Saliva TwoStep for rapid detection of asymptomatic SARS-CoV-2 carriers
- BioFrontiers Institute, University of Colorado Boulder, United States
- Department of Molecular, Cellular and Developmental Biology, University of Colorado Boulder, United States
- Darwin Biosciences Inc, United States
- Department of Mechanical Engineering, University of Colorado Boulder, United States
- Interdisciplinary Quantitative Biology Graduate Program, University of Colorado Boulder, United States
- Department of Biochemistry, University of Colorado Boulder, United States
- Howard Hughes Medical Institute, University of Colorado Boulder, United States
- Department of Integrative Physiology, University of Colorado Boulder, United States
- Wardenburg Health Center, University of Colorado Boulder, United States
Figures
Figure 1 with 2 supplements
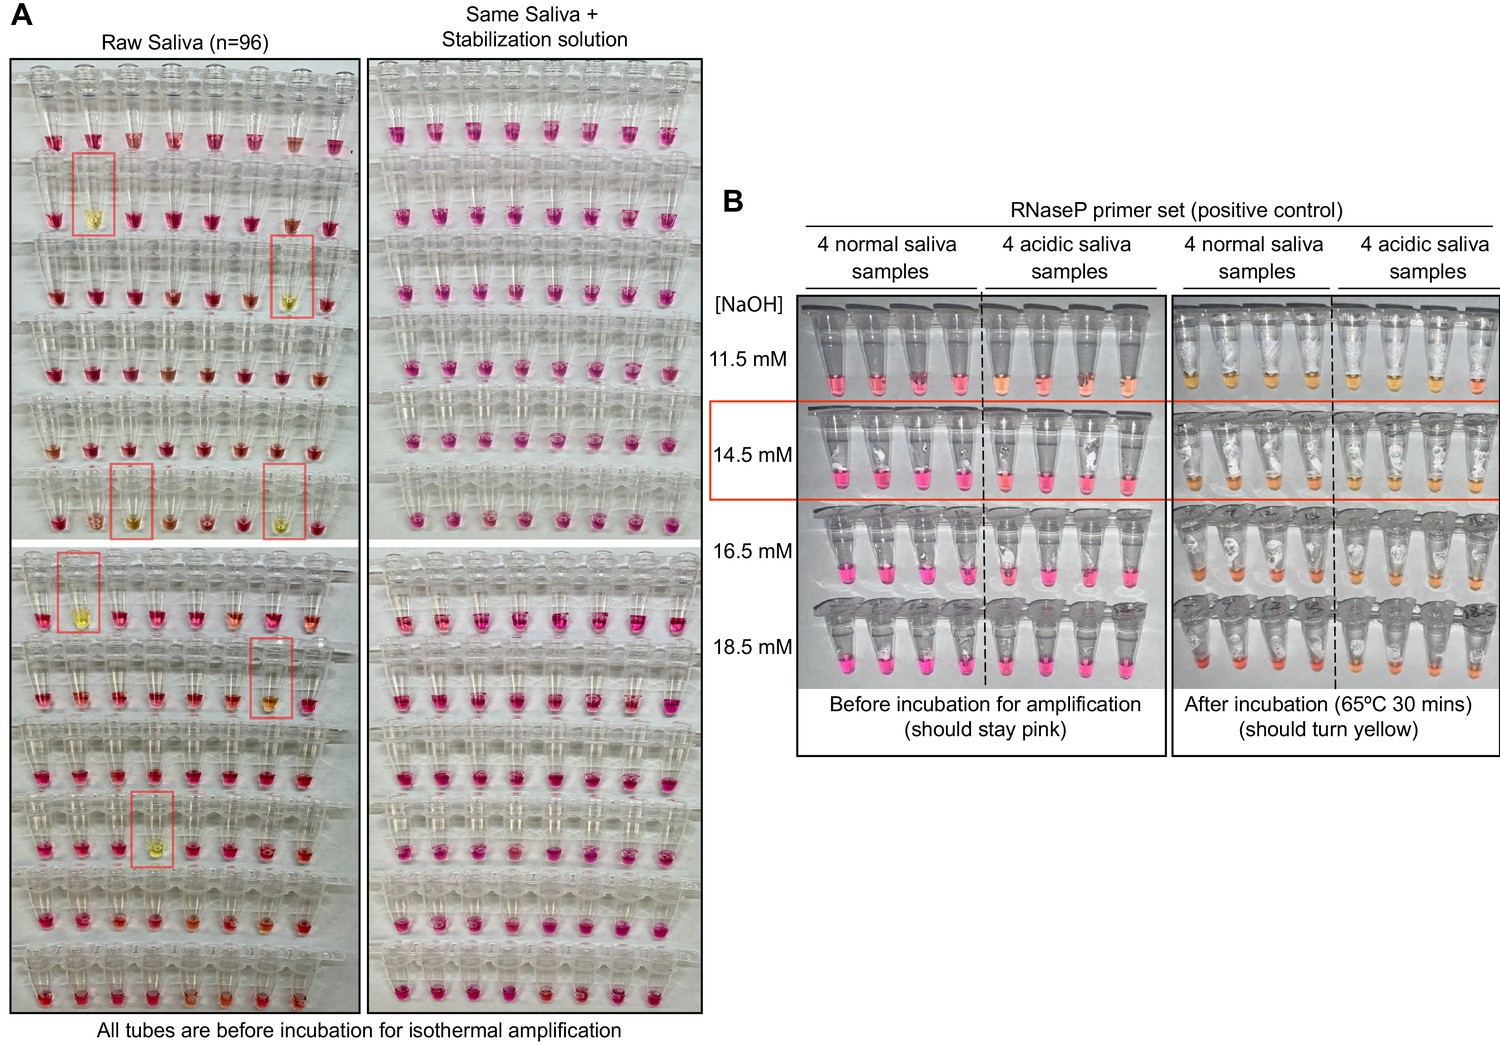
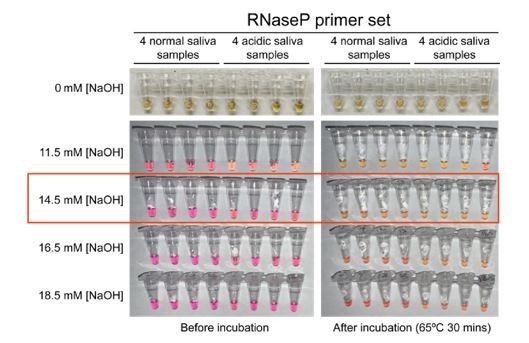
Optimized strategy for controlling natural variability in saliva pH.
(A) Here, saliva samples from 96 different individuals are analyzed for the prevalence of natural acidity extreme enough to trigger the pink-to-yellow color change of phenol red even before isothermal amplification. Each saliva sample was combined 1:1 with water (left) or 2× saliva stabilization solution (right; Materials and methods) and heated at 95°C for 10 min to liberate RNA from virions. Two microliters of each was then added to 18 µL RT-LAMP reaction mix (2× Colorimetric RT-LAMP Master Mix, RNase P primers, nuclease-free water). The pictures show tubes immediately after samples and master mix are combined, before any incubation steps are undertaken to commence isothermal amplification. With raw saliva, 7 of 96 tubes turned yellow at this step (highlighted in red boxes). These are false positives because no amplification reaction has occurred. None of these 96 saliva samples mixed with saliva stabilization solution turned the reaction tube prematurely yellow. (B) Here, we show the method used to identify the ideal pH of the saliva stabilization solution used in (A) and throughout this paper. We chose four normal and four acidic saliva samples and mixed each 1:1 with 2× saliva stabilization solution containing NaOH at various concentrations (final molarity of NaOH after mixing shown). Samples were then heated at 95°C for 10 min and combined with RT-LAMP reaction mix and control primers recognizing the human RNase P transcript. Before incubation, all tubes should be pink, and after incubation, all tubes should be yellow. Based on this, the red box indicates the final optimal NaOH concentration chosen.
Figure 1—figure supplement 1
Optimized heat inactivation for safely detecting SARS-CoV-2 in human saliva.
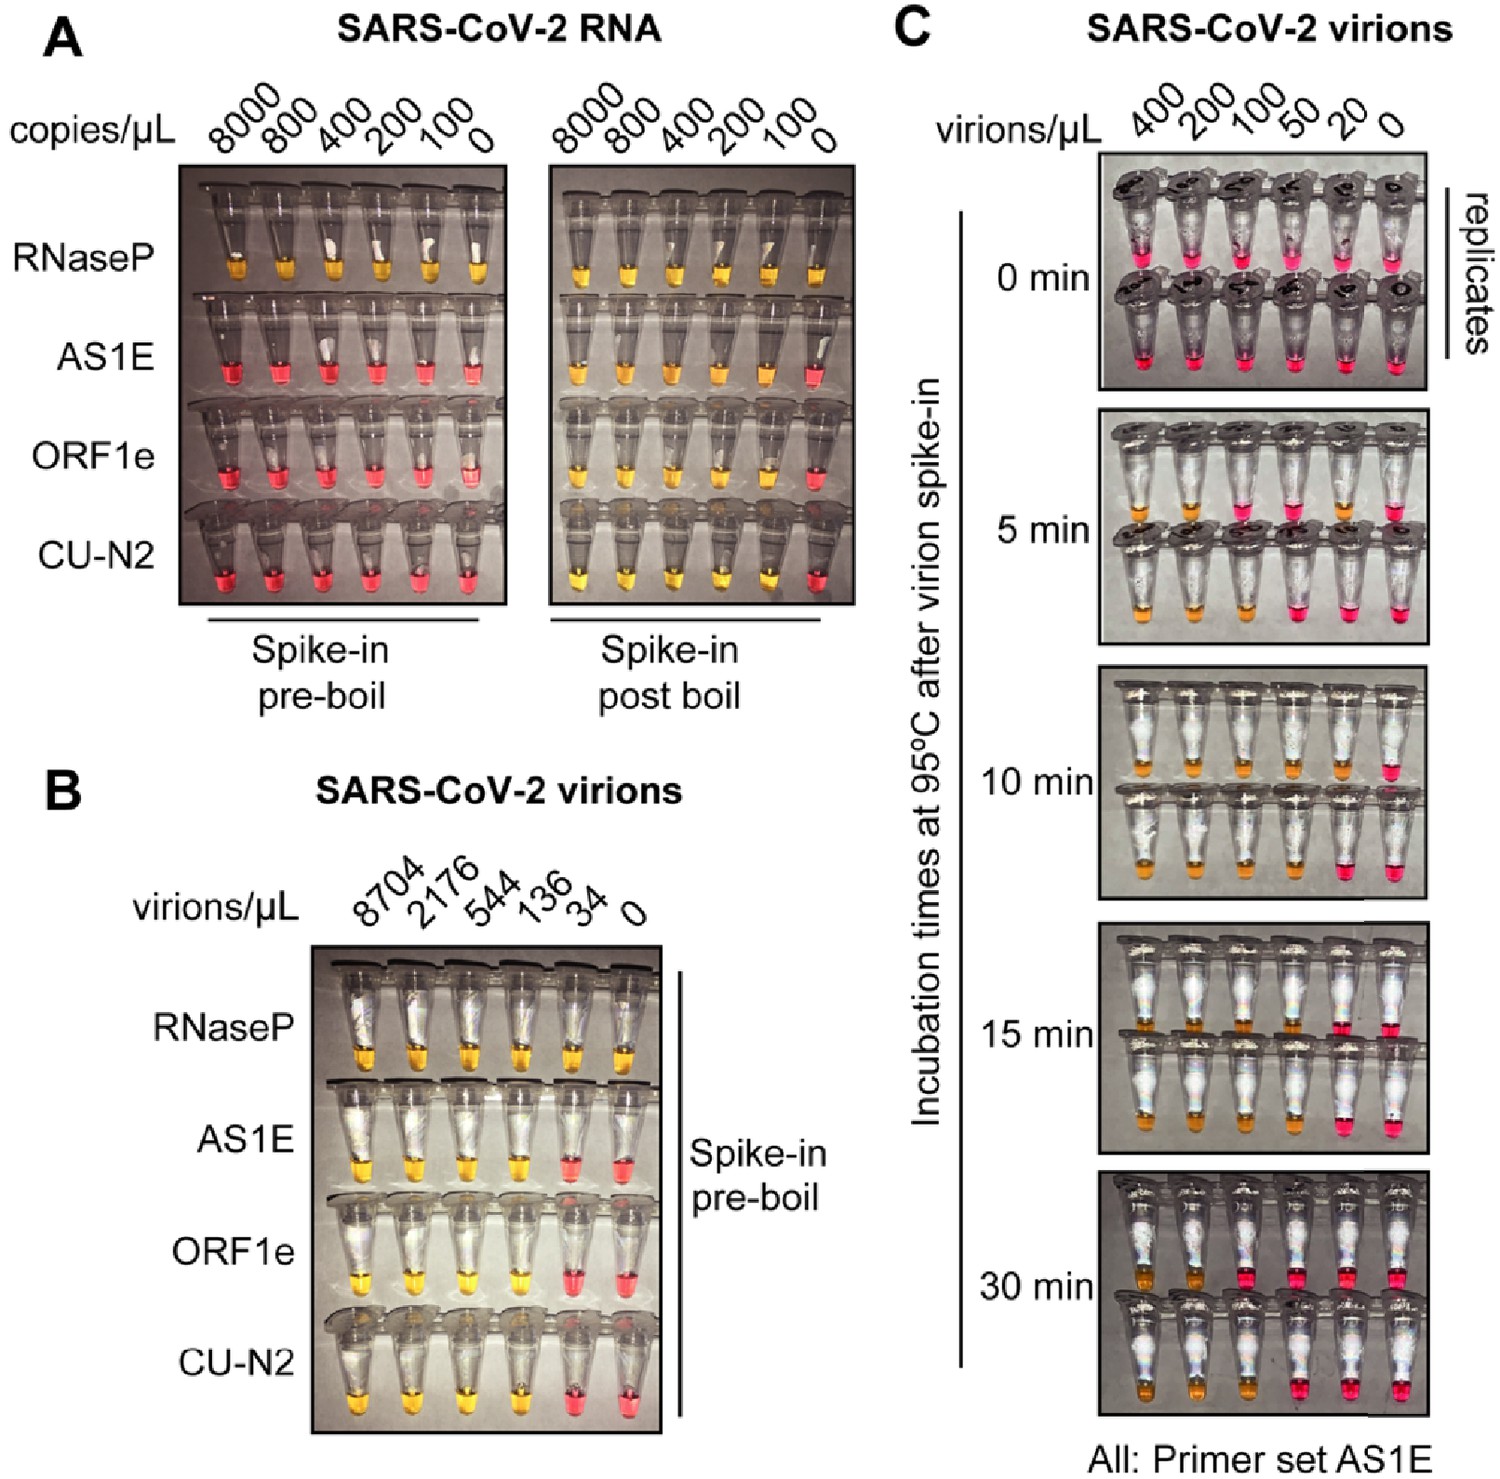
(A) This experiment shows that heating at 95°C for 10 min degrades viral RNA when it is not in the form of virions. Saliva samples were diluted 1:1 with saliva stabilization solution. In vitro transcribed SARS-CoV-2 RNA was spiked into the diluted saliva to reach the indicated concentrations before (left) or after (right) the heating at 95°C for 10 min. To match other experiments, the indicated concentration represents the copies of SARS-CoV-2 RNA in the original undiluted saliva. The samples were then subjected to RT-LAMP at 65°C for 30 min. In this colorimetric version of RT-LAMP, reactions remain pink when no amplification occurred, and turned yellow if there was an amplification event. An RT-LAMP primer set targeting the human RNaseP transcript is included as a host RNA amplification control in addition to the three SARS-CoV-2 primer sets shown in (A). (B) This experiment shows that heating saliva at 95°C for 10 min does not degrades viral RNA when it is in the form of virions. Saliva samples were spiked with the indicated concentrations of heat-inactivated SARS-CoV-2 virions before being diluted 1:1 with saliva stabilization solution. Samples were then heated at 95°C for 10 min and subjected to RT-LAMP similarly to the experiment shown in (A). (C) Results illustrate the optimal incubation time at 95°C to liberate SARS-CoV-2 RNA from virions. Saliva samples were spiked with the indicated concentrations of heat-inactivated SARS-CoV-2 virions before being diluted 1:1 with saliva stabilization solution. Samples were then heated at 95°C for the indicated amount of time, and subjected to RT-LAMP similarly to the experiment shown in (B). Without heating, no SARS-CoV-2 RNA can be detected with RT-LAMP, presumably because virions remain intact and the viral RNA is not accessible by the amplification enzymes. Amplification is somewhat inconsistent at 5 and 30 min possibly because at 5 min hardly any RNA has been liberated, and by 30 min, it has been largely degraded. However, 10 or 15 min at 95°C appears to provide just the right balance between liberating and preserving RNA. All reactions contain the AS1E primer set. Duplicates are presented at each time point.
Figure 1—figure supplement 2
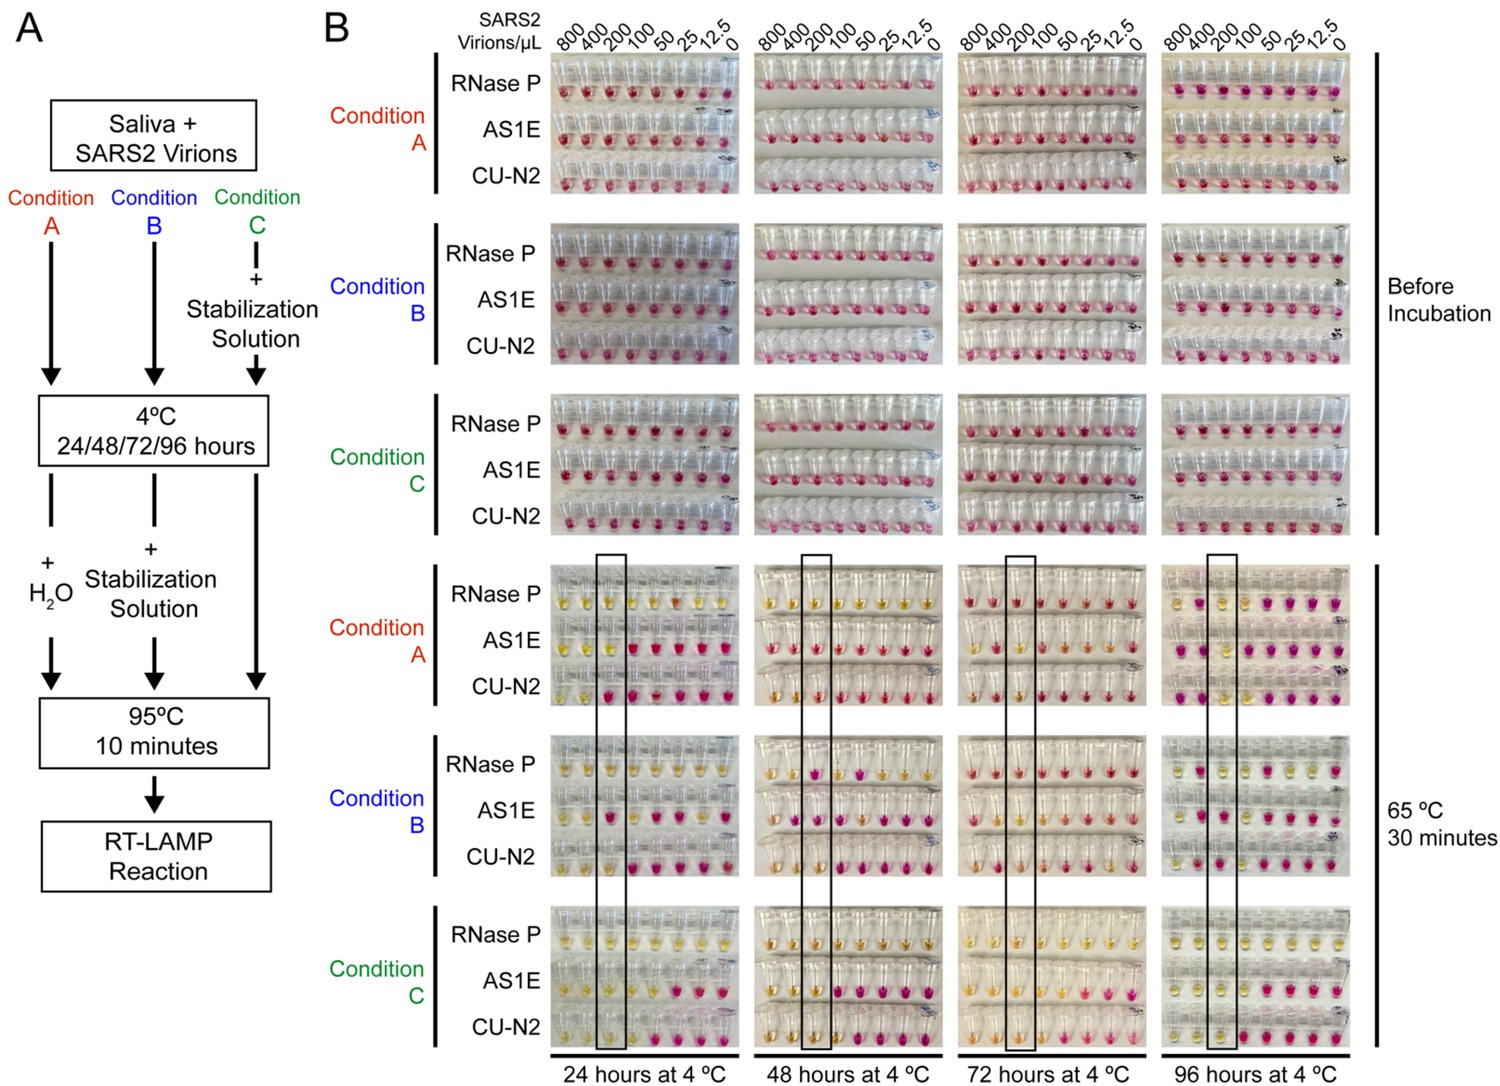
Saliva samples are stable at 4°C for at least 4 days before processing, if stored in saliva stabilization solution.
(A) Schematic of the experimental conditions. (B) RT-LAMP reaction result before and after the isothermal amplification. Saliva samples were spiked with heat-inactivated SARS-CoV-2 virions at the indicated concentration and mixed 1:1 with saliva stabilization solution or nuclease-free water before/after storing at 4°C for 24, 48, 72, and 96 hr. Samples were then heated at 95°C for 10 min and analyzed using RT-LAMP with the indicated primer sets. Condition C, which is the condition used in our test, performs robustly and is sensitive to the limit of detection even after 96 hr storage at 4°C. The stated limit of detection of 200 virions/μL is boxed.
Figure 2 with 1 supplement
Optimized RT-LAMP primer sets for detecting SARS-CoV-2 in human saliva.
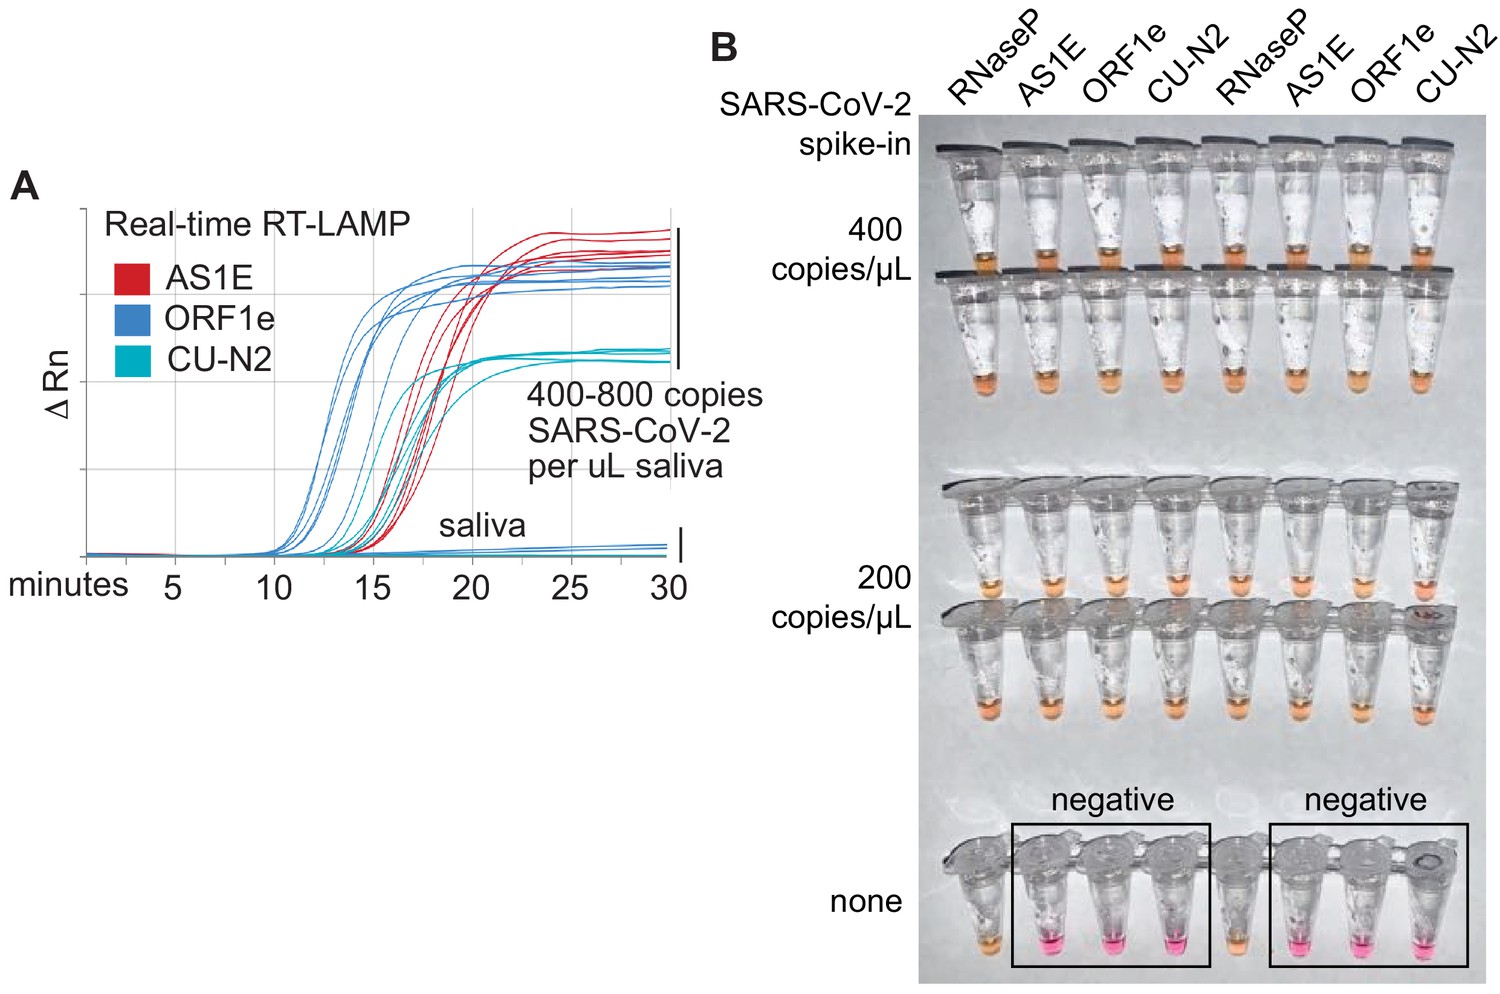
(A) Three RT-LAMP primer sets targeting the SARS-CoV-2 genome (AS1E [Rabe and Cepko, 2020], ORF1e, and CU-N2) were tested with real-time RT-LAMP. Saliva was mixed 1:1 with 2× saliva stabilization solution, heated at 95°C for 10 min, and then spiked with in vitro transcribed SARS-CoV-2 RNA at the indicated concentrations. 4 μL of this was added to a master mix containing primers and NEB’s WarmStart LAMP 2x Master Mix in a final reaction volume of 20 μL. Reactions were incubated at 65°C and a fluorescence reading was taken every 30 s. EvaGreen was used to monitor amplification products in real-time (X-axis) using a QuantStudio3 quantitative PCR machine. There are nine lines for each of the three primer sets because three concentrations of spiked in SARS-CoV-2 RNA were each tested in triplicate (0, 400, 800 copies/μL saliva). When concentrations are given herein, denominator refers to the raw, pre-diluted saliva sample. The normalized change in fluorescence signal (ΔRn) is shown on the Y-axis. (B) Saliva mixed 1:1 with 2× saliva stabilization solution was heated (95°C for 10 min) and then spiked with SARS-CoV-2 RNA at the indicated concentrations. Replicates were tested by RT-LAMP with the control RNaseP primer set and three distinct SARS-CoV-2 primer sets (AS1E, ORF1e, and CU-N2). All samples scored positive as expected except those boxed, which are saliva samples that contain no SARS-CoV-2 RNA.
Figure 2—figure supplement 1
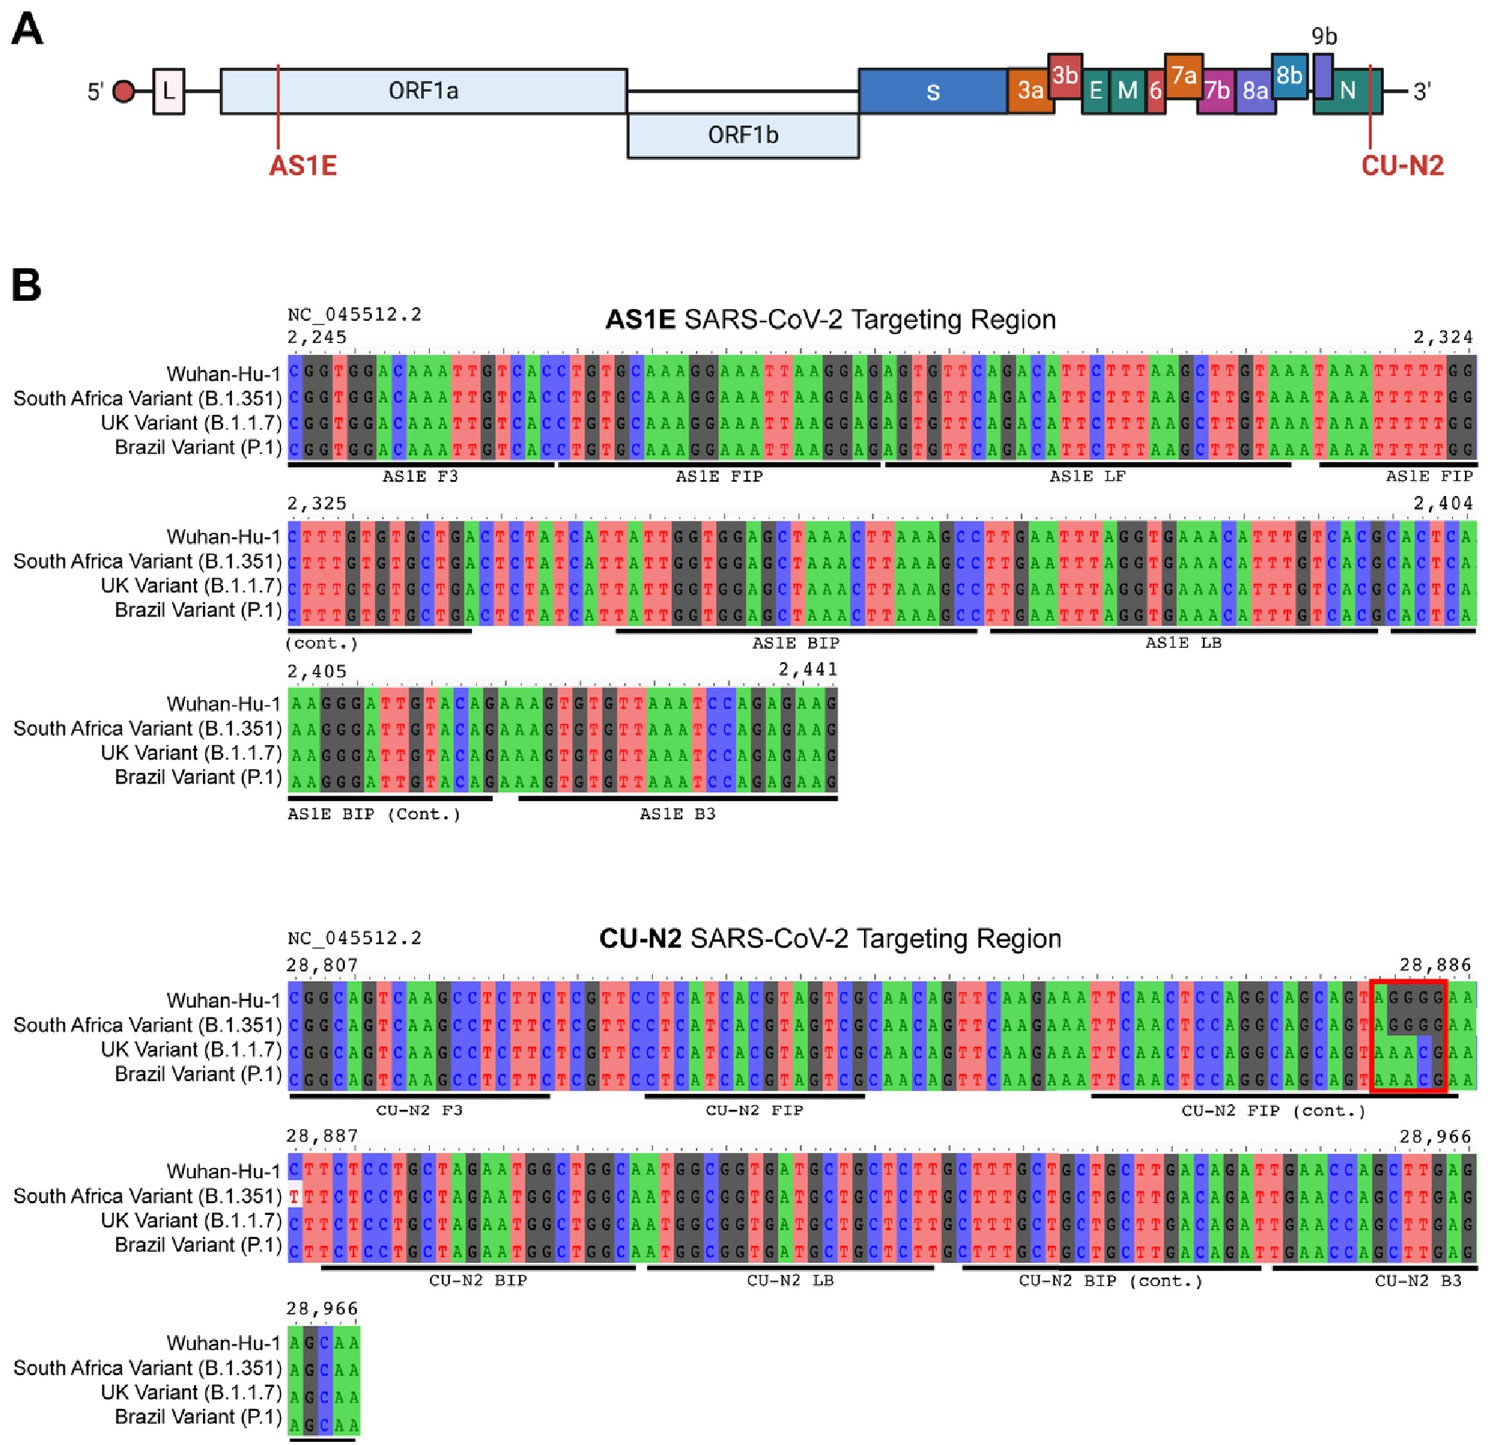
Saliva TwoStep primers will detect most or all currently circulating viral variants of concern.
(A) Genome map of SARS-CoV-2 with the regions targeted RT-LAMP primers highlighted in red. SARS-CoV-2 genome map is adapted from BioRender. (B) Sequence alignments of regions of the key SARS-CoV-2 genome variants targeted by RT-LAMP primer sets AS1E and CU-N2. Binding regions of each individual primer set component is highlighted in underlying horizontal bars. The SARS-CoV-2 genome region targeted by AS1E primer set is conserved among all variants. For CU-N2, the red box highlights region of sequence variation that might render CU-N2 primer set less effective to identify the UK and Brazil variants. The coordinate of the genome sequence is based on the SARS-CoV-2 reference genome (NCBI NC_045512.2). The SARS-CoV-2 variant representative genomes are downloaded from GISAID (South Africa Variant B.1.351: hCoV-19/South Africa/KRISP-EC-K004572/2020; UK Variant B.1.1.7: hCoV-19/England/MILK-9E2FE0/2020; Brazil Variant P.1: hCoV-19/USA/VA-DCLS-2185/2020).
Figure 3 with 2 supplements
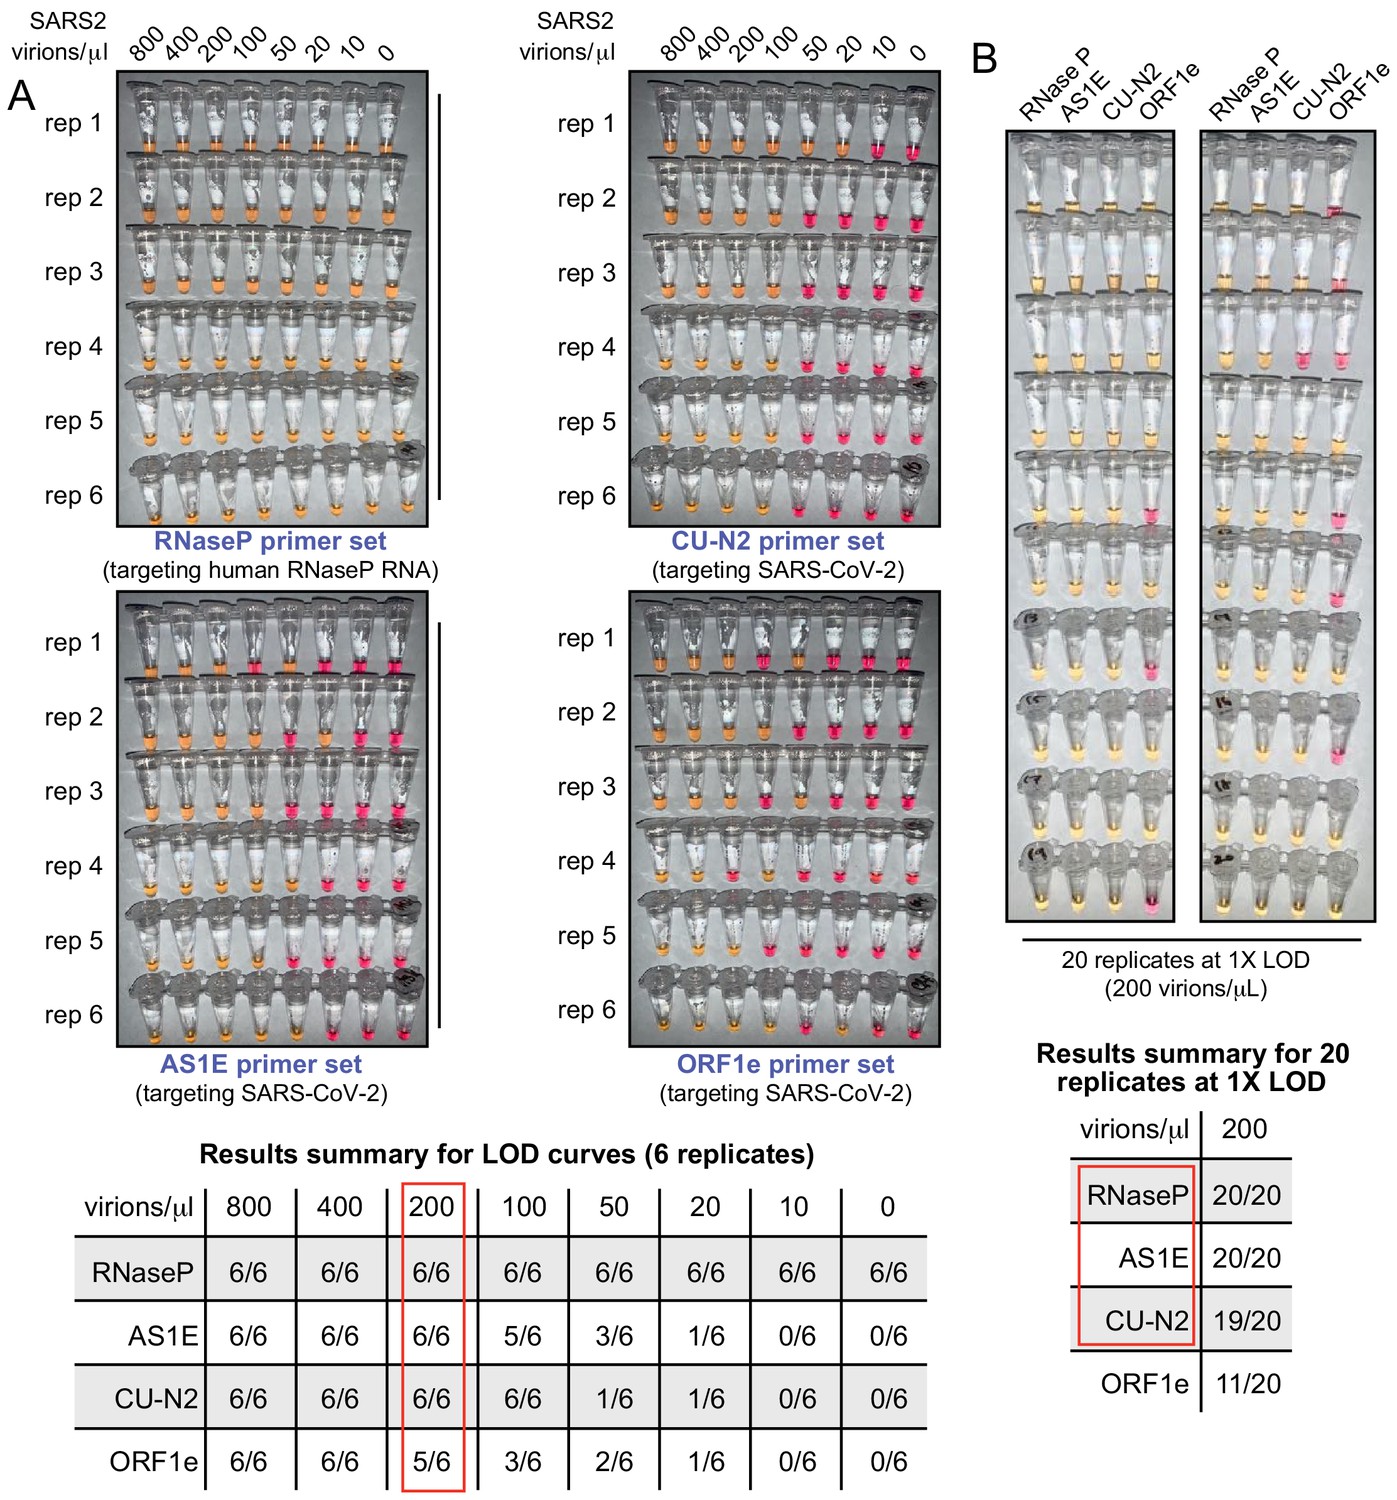
The test limit of detection is 200 virions/μL.
(A) Saliva samples were spiked with the indicated concentrations of heat-inactivated SARS-CoV-2 virions (top) before being diluted 1:1 with 2× saliva stabilization solution. Samples were then heated at 95°C for 10 min and subjected to RT-LAMP at 65°C for 30 min in six replicates. Each panel represents a unique primer set (listed at the bottom of each panel). The table shows a summary of positive reactions (yellow). Red box indicates the determined RT-LAMP limit of detection (LOD). (B) Saliva samples were spiked with heat-inactivated SARS-CoV-2 virions at 200 virions/μL (the limit of detection) before being diluted 1:1 with 2× saliva stabilization solution. Samples were then heated at 95°C for 10 min and 20 replicates of RT-LAMP with the indicated primer sets were incubated at 65°C for 30 min. The table shows a summary of positive reactions (yellow). Red box indicates primer sets to advance to subsequent analyses.
Figure 3—figure supplement 1
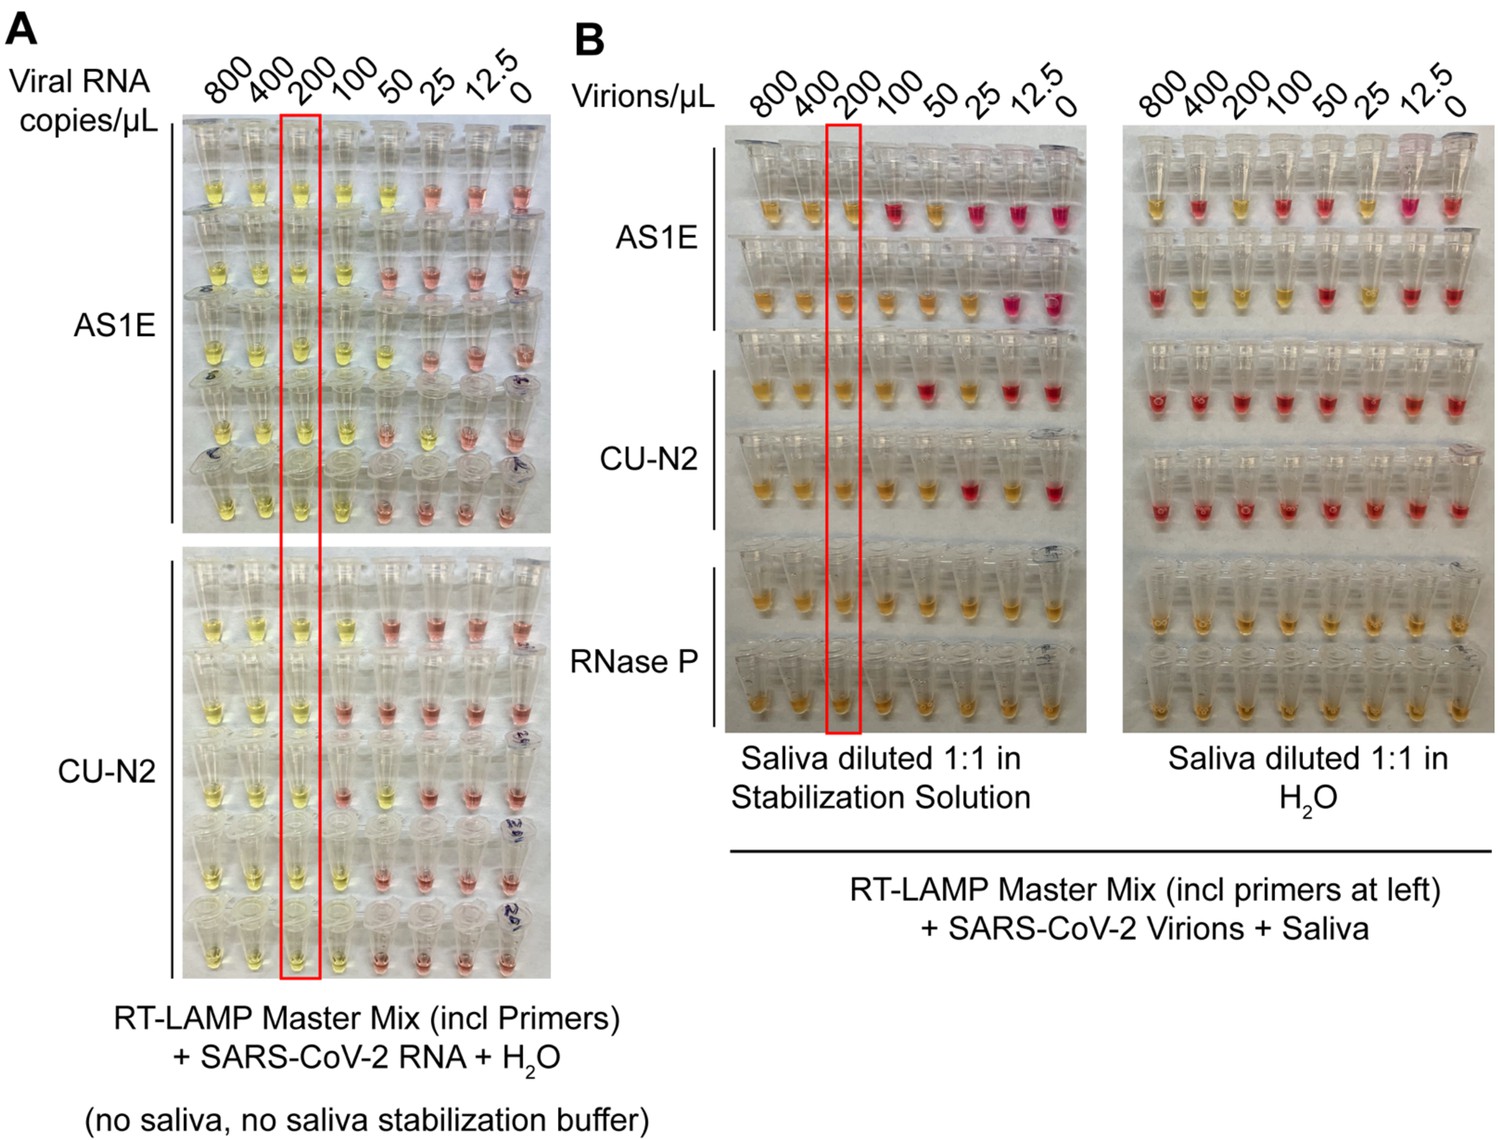
Saliva stabilization solution containing NaOH does not lower sensitivity of colorimetric RT-LAMP detection of SARS-COV-2.
(A) Here, the detection limit of the RT-LAMP assay was assessed in the absence of any saliva or saliva stabilization solution . This was explored in order to determine whether there might be components of saliva or saliva stabilization solution that inherently lower test sensitivity because they are inhibitory to the RT-LAMP reaction. Here, synthetic SARS-CoV-2 RNA was diluted in nuclease-free water. The diluted RNA was mixed with RT-LAMP reaction mix and incubated at 65°C for 30 min to allow isothermal amplification. Positive reactions turn yellow. Two different primer sets that amplify SARS-CoV-2 were employed, AS1E and CU-N2. The red box indicates the concentration at which positives were identified at least 95% of the time (here, 100% is achieved). That is defined at the limit of detection. Here, it is 200 copies/μL, just as when saliva and saliva stabilization solution is used (see panel B, and data figures in main paper). (B) Evaluation of RT-LAMP detection limit in the presence of saliva, but in the presence or absence of saliva stabilization solution. Saliva spiked with heat-inactivated SARS-CoV-2 virions at specified concentrations was mixed 1:1 with stabilization solution (left) or nuclease-free water (right) and heated at 95°C for 10 min (RNA liberation) before being incubated at 65°C for 30 min (isothermal amplification). On the left, the saliva stabilization solution achieves a limit of detection of 200 virions/μL. When virions are boiled without the saliva stabilization solution (right), very few reactions turn positive and the pattern is unpredictable, presumably because virions and viral RNA are destroyed.
Figure 3—figure supplement 2
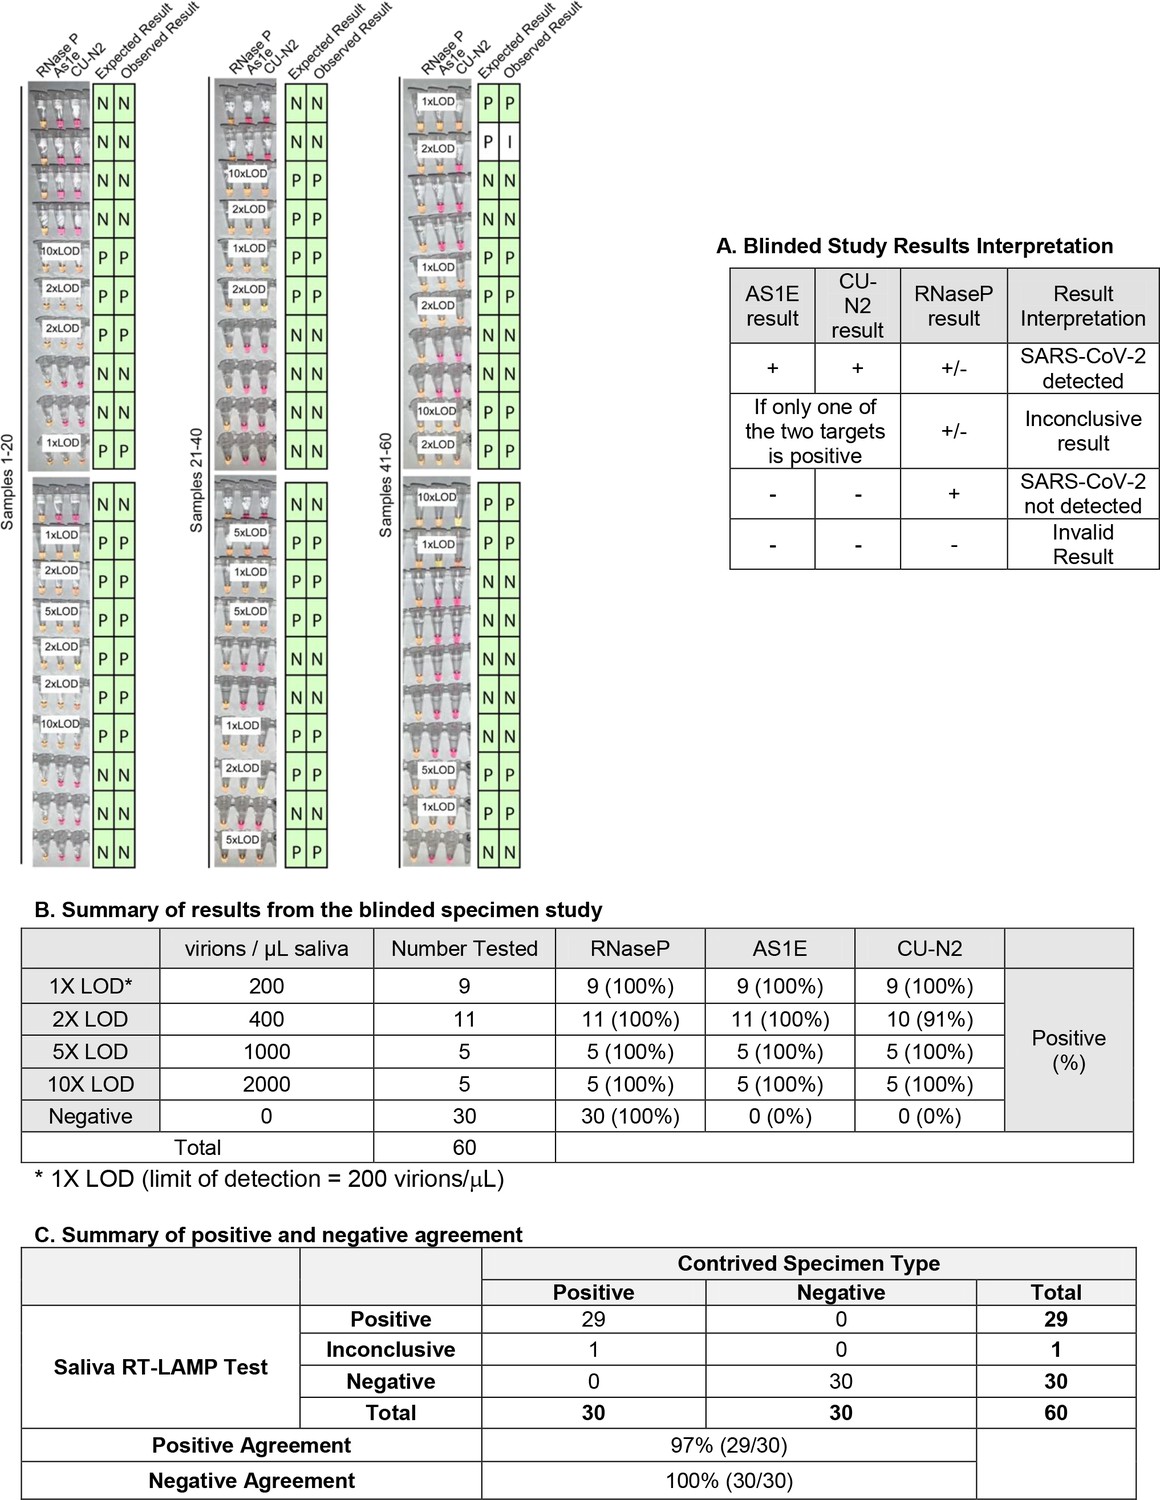
Blinded sample evaluation.
Plain saliva, or saliva spiked with heat-inactivated SARS-CoV-2 virions at different concentrations, was heated at 95ºC for 10 minutes. Samples were then analyzed using RT-LAMP by a researcher that did not know the true state of each sample. Experiments in figure) For each sample, three reactions were performed as indicated by each triplet of tubes. By looking at the patterns of yellow and pink results in each triplet, samples were scored according to the criteria in table A. The true status and observed result of each sample are listed to the right in green boxes (P = Positive, N = Negative, I = Inconclusive). A white box on the triplet is shown if the sample contained SARS-CoV-2. One sample resulted in inconclusive test result. This sample did have SARS-CoV-2 spiked into it, but one of the SARS-CoV-2 primer sets failed to produce a signal (CU-N2). This failed reaction is still pink (negative) even though the tube has 2xLOD virus. 1X LOD = 200 virions/μL. Summary statistics for this experiment are provided in tables B and C below.
Figure 4 with 2 supplements
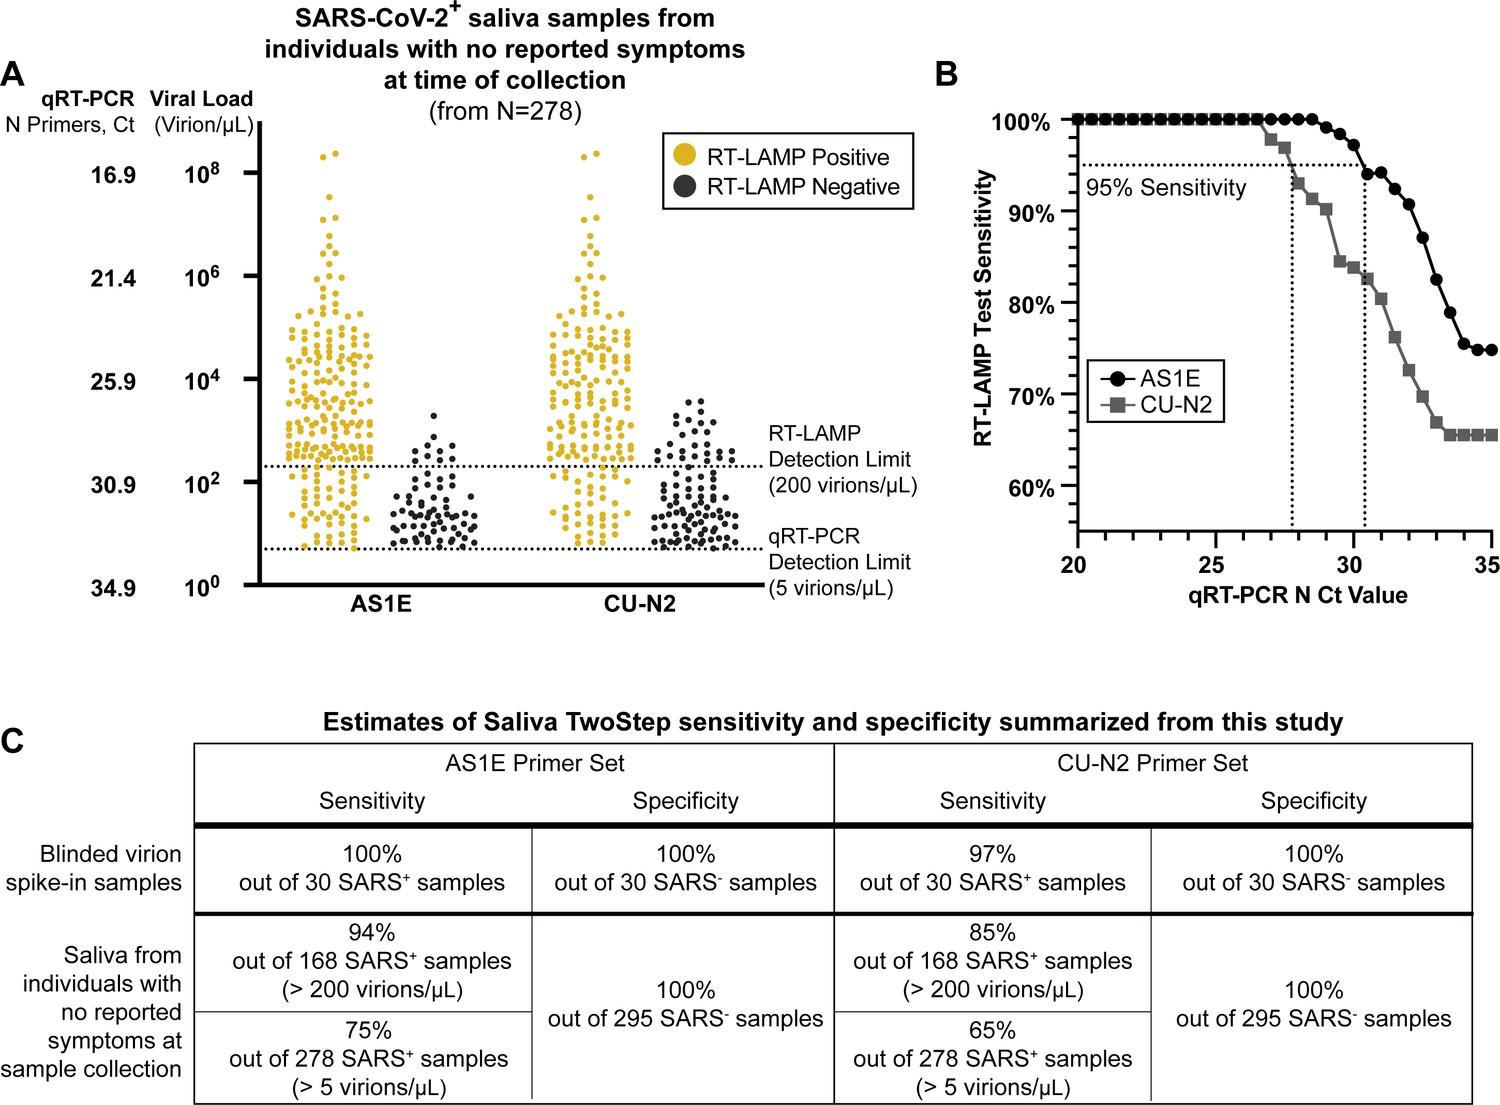
Evaluation of RT-LAMP on SARS-CoV-2-positive saliva samples from individuals with no reported symptoms at the time of sample collection.
(A) We re-analyzed university saliva samples that had been previously analyzed for SARS-CoV-2 using quantitative RT-PCR with a primer set against the N gene of SARS-CoV-2 (see Materials and methods). The remaining saliva was mixed 1:1 with 2× saliva stabilization solution (without Proteinase K) and re-tested using RT-LAMP. The results of RT-LAMP are compared to relative saliva viral load determined by quantitative RT-PCR. The figure shows the distribution of the viral load of all 278 positive saliva samples separated by the corresponding RT-LAMP reaction results with either the AS1E or CU-N2 primer set. (B) Saliva RT-LAMP test sensitivity as a function of the cycle threshold (Ct) from the quantitative RT-PCR analysis. (C) A summary of test sensitivity and specificity from the blinded virion spike-in evaluation described above (Figure 3—figure supplement 2) and from the human sample data in (A).
Figure 4—figure supplement 1
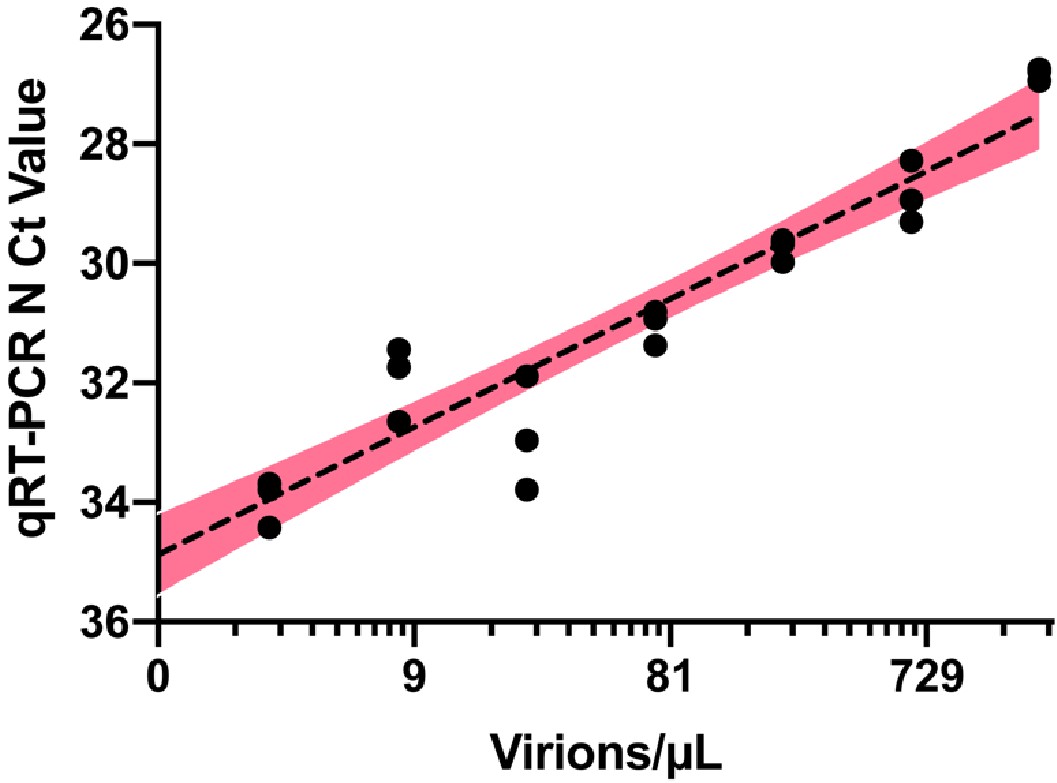
Quantitative RT-PCR standard curve used to determine the Ct value to virion/μL calculation.
10,000 copies/µL of heat deactivated SARS-CoV-2 virus was spiked into negative saliva specimens from six different volunteers and incubated for 30 min at 95°C. Samples were diluted to indicate concentrations using heat-treated saliva without SARS-CoV-2 addition from the same individual. The standard curve for the primer set targeting SARS-CoV-2 N gene is generated from the linear regression analysis and is illustrated with 95% confidence interval.
Figure 4—figure supplement 2
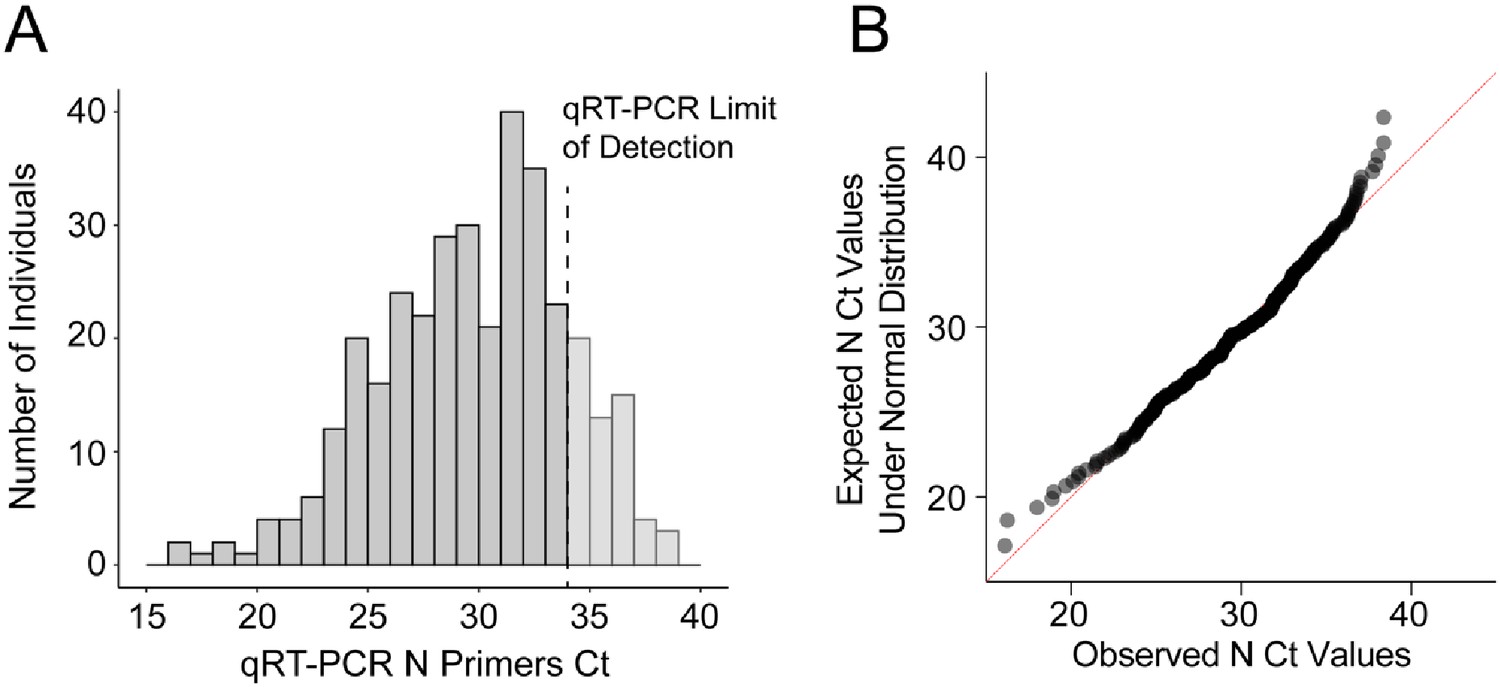
Near normal distribution of quantitative RT-PCR raw Ct values of SARS-CoV-2 N gene from positive individuals.
Between September 16–25, 2020, 8836 saliva samples were screened for SARS-CoV-2 using the direct quantitative RT-PCR method. (A) The amplification of SARS-CoV-2 N gene is detected in 347 samples and the Ct value distribution is illustrated. Samples with Ct values above the qRT-PCR limit of detection (Ct <34, dark gray, N = 278) were considered SARS-CoV-2 positive and used for RT-LAMP validation. (B) Quantile–quantile plot of the SARS-CoV-2 N Ct values indicates near normal distribution within the linear range of qRT-PCR (D'Agostino test, K2 = 9.07, p-value=0.011).
Figure 5
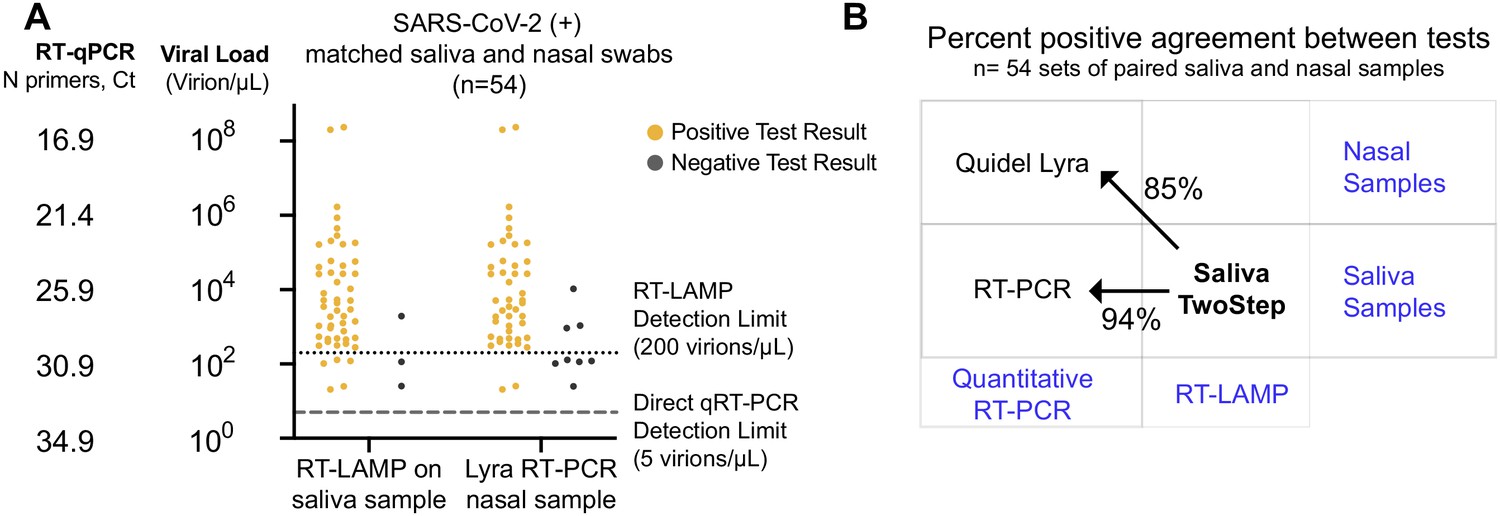
Assessment of Saliva TwoStep against a nasal swab test.
(A) Matched nasal swabs and saliva from 54 individuals were analyzed (all of whom were SARS-CoV-2 positive at the time that these samples were collected, as verified by the saliva quantitative RT-PCR test described above). Nasal swab samples were collected within 2 days of positive saliva test and tested using the Quidel Direct Lyra RT-PCR test. The saliva samples from those same individuals were also re-tested with the Saliva TwoStep test. Data points represent individuals (n = 54), and the corresponding test result is color-coded: positive, yellow; negative, gray. (B) Positive test agreement between Saliva TwoStep and the two comparator tests. The nature of the sample used by each test (nasal swab or saliva), and the test chemistry (quantitative RT-PCR or RT-LAMP) are delineated.
Figure 6 with 1 supplement
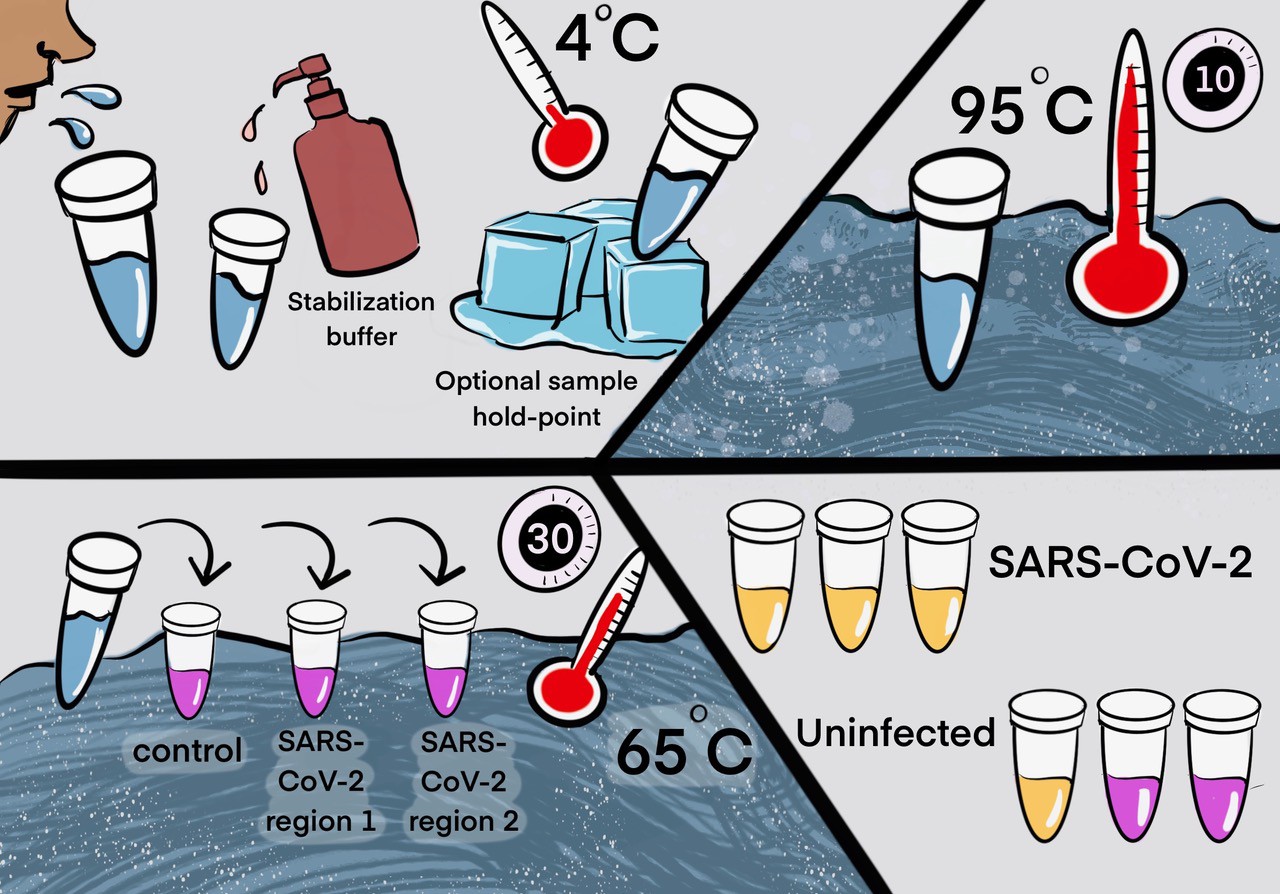
Two step detection of SARS-CoV-2 in saliva.
(Upper half) Step 1: Prepare saliva. Person provides 1 mL of saliva, and 1 mL of 2× saliva stabilization solution is then added to it. (This sample can be processed immediately or stored in the refrigerator at 4°C for at least 4 days.) The mixture is heated at 95°C for 10 min. This step serves to increase the pH of saliva, liberate viral RNA from virions in the saliva, and inactivate virions for safe handling (although appropriate safety precautions should always be taken). We have determined that performing a heating step at 95°C for 30 min in a water bath before addition of the saliva stabilization solution also works well. However, in this case, Proteinase K must be left out of that solution. (Lower half) Step 2: Detect virus. Two microliters of stabilized saliva from step 1 is pipetted into each of three test tubes pre-filled with the RT-LAMP master mix and primers. The only thing different between the three tubes is the primer set included, with each set targeting either the human positive control RNA or a region of SARS-CoV-2 RNA, as indicated. After incubation, the reaction will turn from pink to yellow if the target RNA is present in saliva. An example of a positive and a negative test is shown. Graphic by Annika Rollock.
Figure 6—figure supplement 1
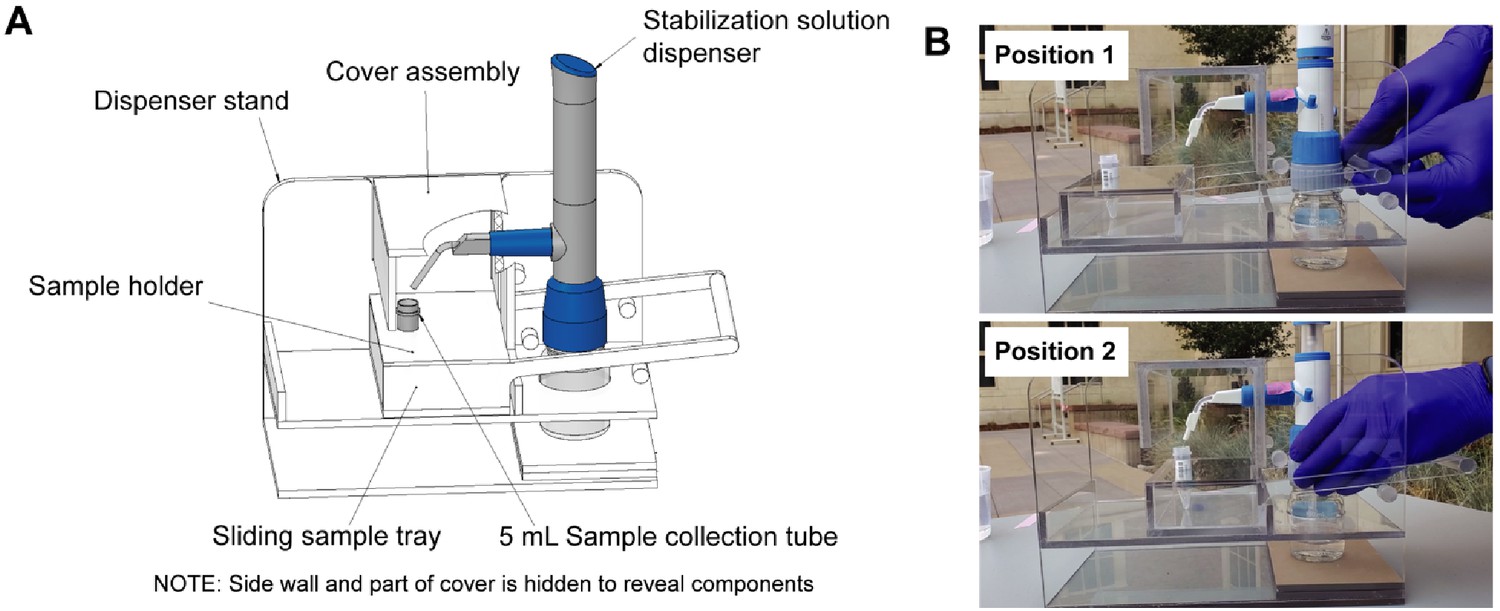
Diagrams of the saliva stabilization solution dispensing apparatus.
(A) CAD model of dispensing apparatus showing components. Custom solution dispensing apparatus fabricated from machined and solvent welded 236-in polycarbonate (Tuffak). Polycarbonate is chosen for visibility, strength, and ability to withstand cleaning solvents such as ethanol. This device prevents the need for staff to directly handle uncapped and potentially infectious sample prior to inactivation, limits splash and aerosol exposure risk, and prevents cross-contamination of samples during solution addition step. (B) Diagram illustrates the operation of the dispensing apparatus. Position 1: Tray is extended toward the testing participant and sample tube is seated in tray. Bottle containing stabilization solution and assembled with bottle top dispenser is seated in back section of apparatus. Staff moves tray toward themselves by gently pulling on handle until the tray is seated against back wall of the apparatus. Position 2: Sample tray is positioned against the back wall of the apparatus. This brings the sample tube and dispenser nozzle into a set orientation underneath the removable cover assembly. Sample collector uses bottle top dispenser to add 1 mL of stabilization solution to sample and then pushes sample tray back to the testing participant.
Author response image 1
Tables
Table 1
Summary of RT-LAMP evaluation in human samples.
| RT-LAMP Primers | |||||||
|---|---|---|---|---|---|---|---|
| AS1E | CU-N2 | ||||||
| No. of samples | No. of positives | Agreement | No. of positives | Agreement | |||
| Quantitative RT-PCR (SARS-CoV-2 N) | Negative | 295 | 0 | 295/295 (100%) | 0 | 295/295 (100%) | |
| Positive (levels of viral load: Virions/μL) | 4000 | 82 | 82 | 82/82 (100%) | 82 | 82/82 (100%) | |
| 2000 | 97 | 97 | 97/97 (100%) | 94 | 94/97 (96.9%) | ||
| 1000 | 118 | 117 | 117/118 (99.2%) | 110 | 110/118 (93.2%) | ||
| 800 | 123 | 122 | 122/123 (99.2%) | 112 | 112/123 (91.1%) | ||
| 400 | 143 | 139 | 139/143 (97.2%) | 129 | 145/173 (90.2%) | ||
| 200 | 168 | 158 | 158/168 (94.0%) | 142 | 142/168 (84.5%) | ||
Additional files
Download links
A two-part list of links to download the article, or parts of the article, in various formats.
Downloads (link to download the article as PDF)
Open citations (links to open the citations from this article in various online reference manager services)
Cite this article (links to download the citations from this article in formats compatible with various reference manager tools)
Saliva TwoStep for rapid detection of asymptomatic SARS-CoV-2 carriers
eLife 10:e65113.
https://doi.org/10.7554/eLife.65113


