Relationship between changing malaria burden and low birth weight in sub-Saharan Africa: A difference-in-differences study via a pair-of-pairs approach
- Graduate Group in Applied Mathematics and Computational Science, School of Arts and Sciences, University of Pennsylvania, United States
- Department of Statistics, The Wharton School, University of Pennsylvania, United States
- Global Health Institute, School of Medicine, Duke University, United States
- Department of Biostatistics and Bioinformatics, School of Medicine, Duke University, United States
Figures
Figure 1
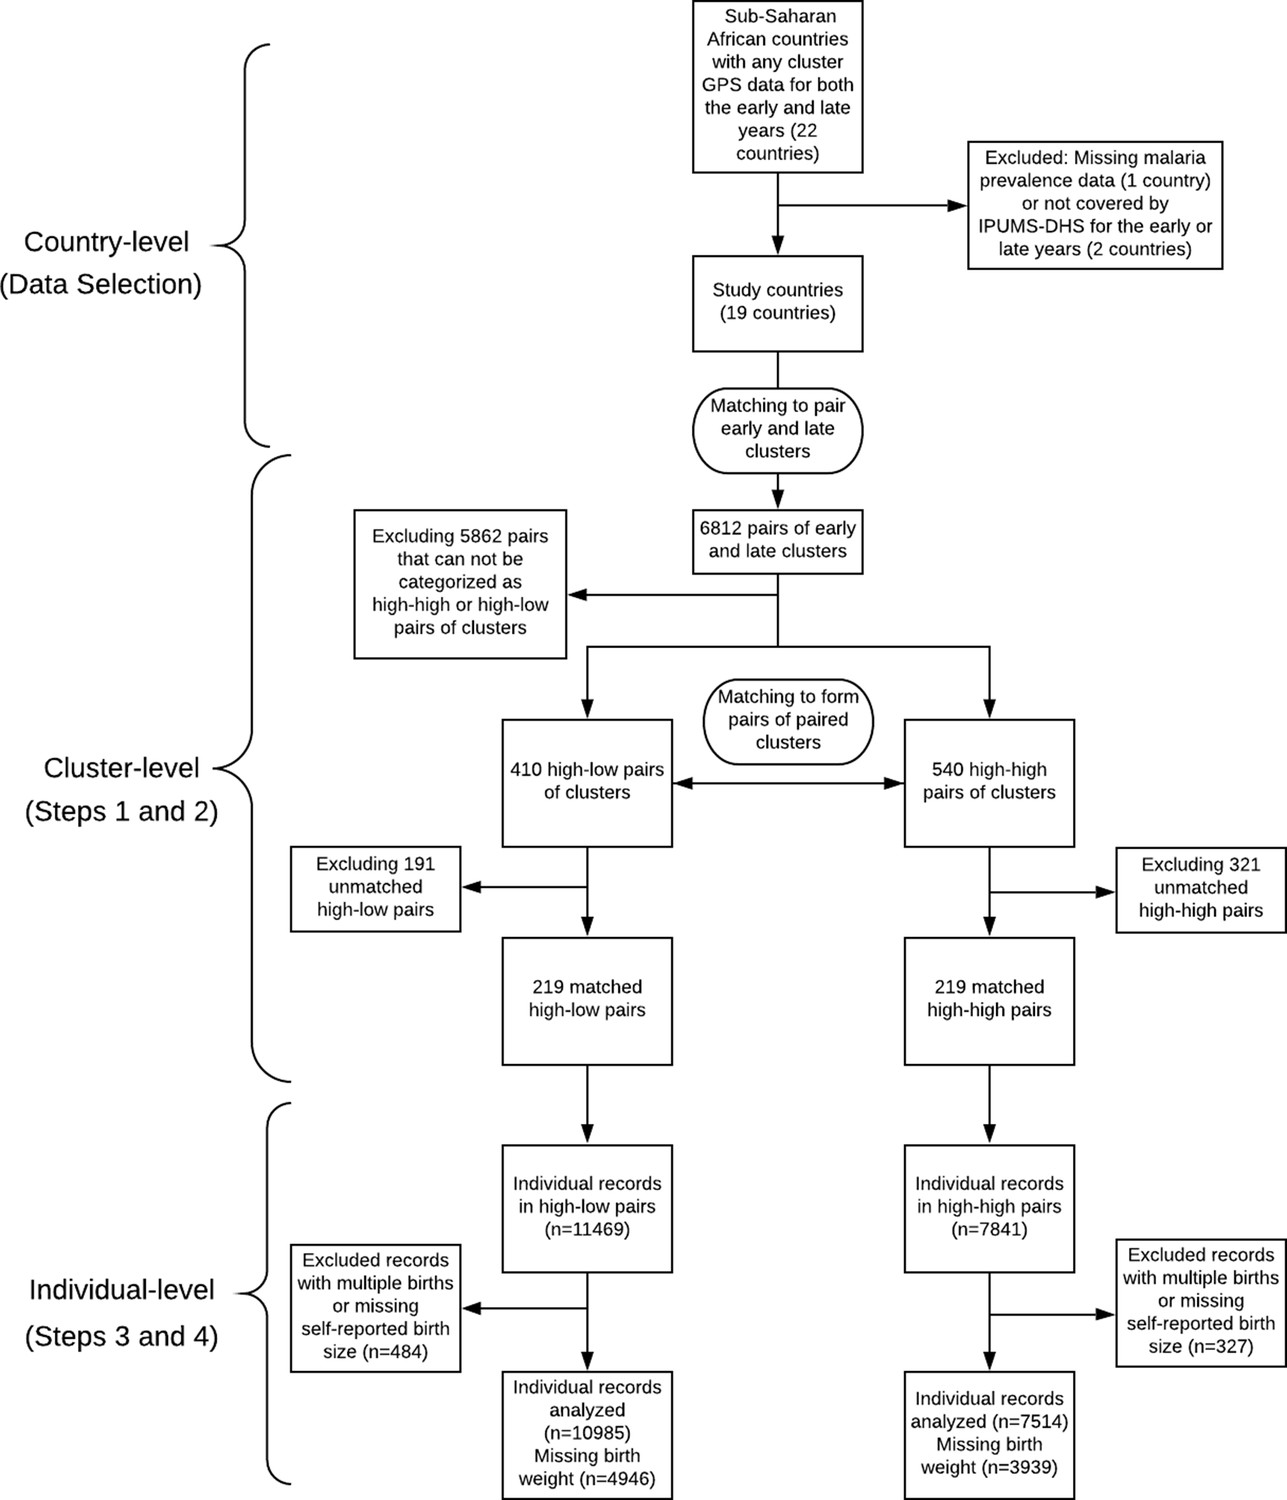
Work flow diagram of the study.
Figure 2
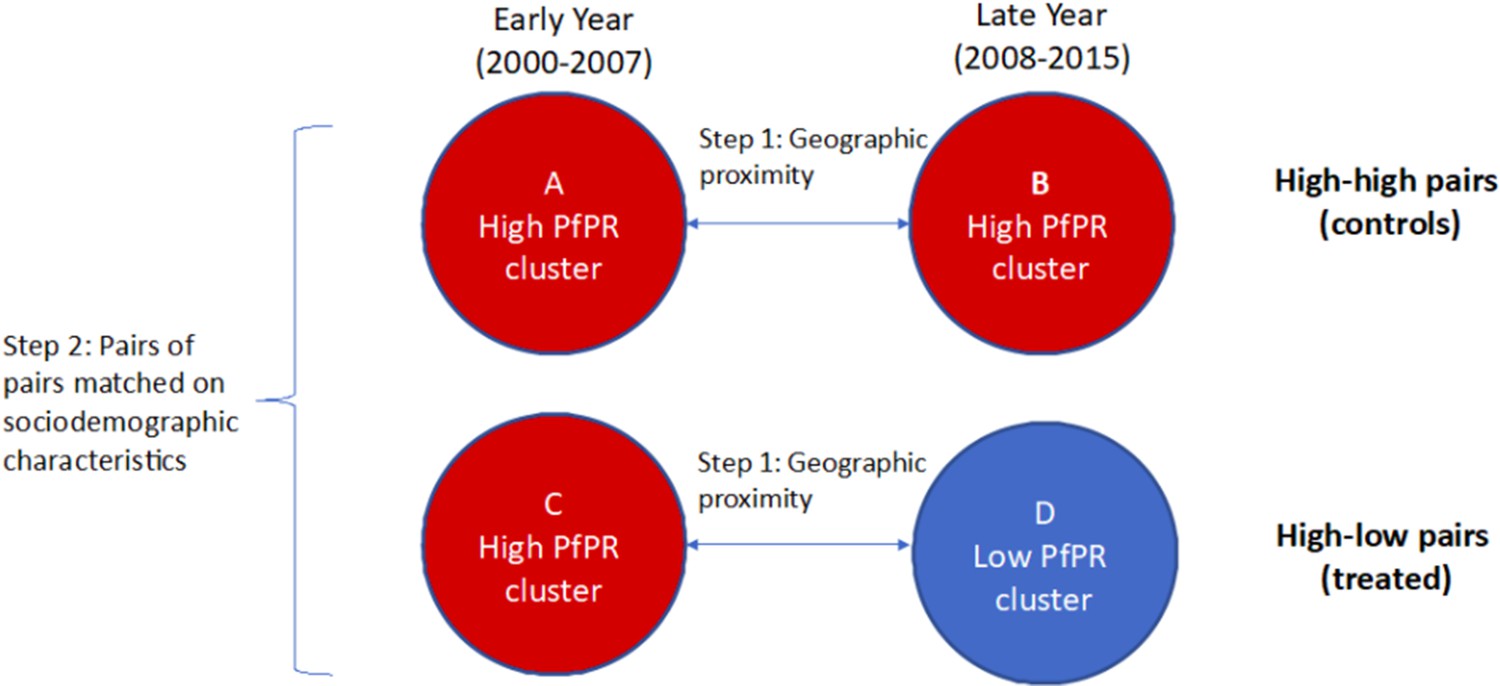
Formed quadruples (pairs of pairs) of matched high-low and high-high pairs of clusters.
In Step 1, pairs of clusters from the early and late time periods are matched on geographic proximity and categorized as ‘high-high’ (comparison, or control) or ‘high-low’ (treated). In Step 2, pairs of high-high clusters are matched with pairs of high-low clusters based on cluster-level sociodemographic characteristics. The difference-in-differences estimate of the coefficient of changing malaria burden on the low birth weight rate is based on comparing (D–C) to (B–A).
Figure 3
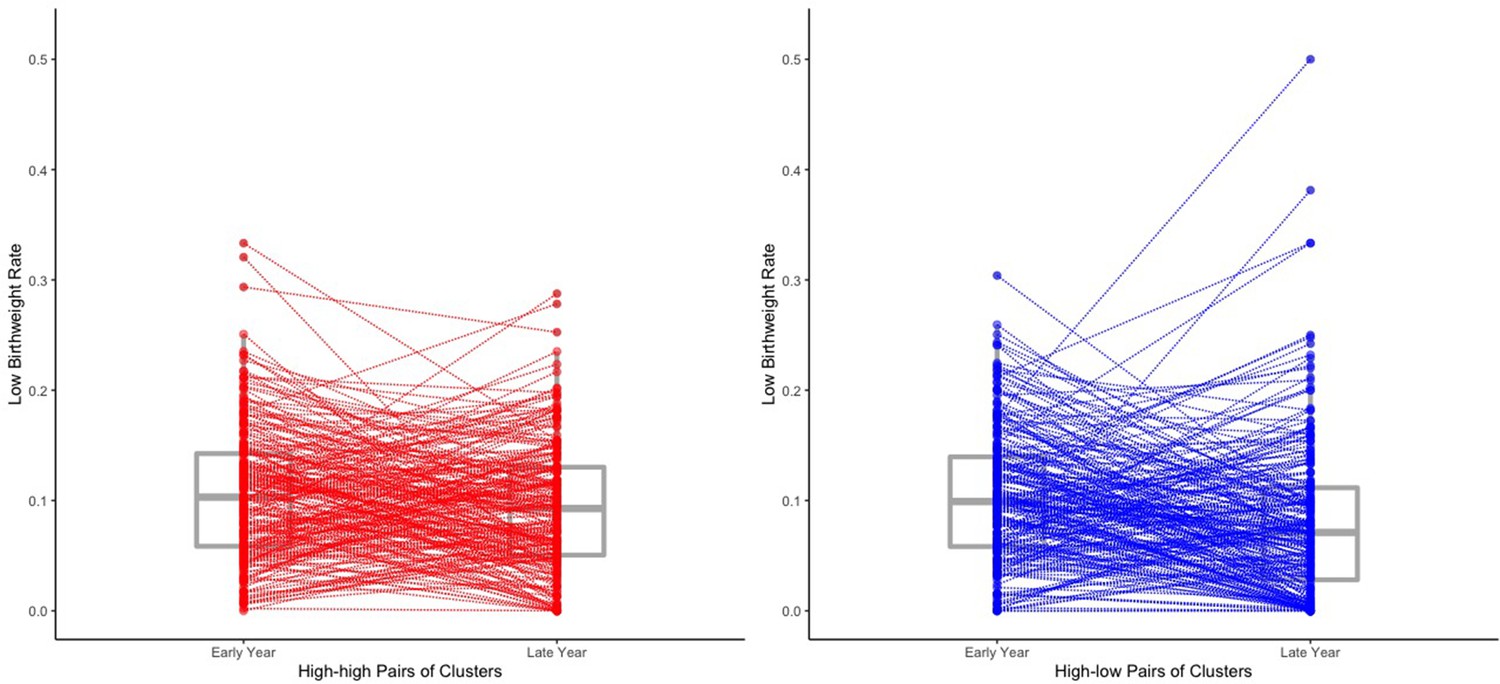
The estimated low birth weight rate of each cluster within the 219 high-high pairs and the 219 high-low pairs.
The estimated low birth weight rate for each cluster are obtained from averaging over all the 500 imputed data sets of the 18,112 individual records. We draw a line to connect two paired clusters (one early year cluster and one late year cluster). Box plots for the low birth weight rates are also shown. Two of the four outliers of the late year clusters among the high-low pairs (i.e. the top four late year clusters in terms of low birth weight rate among the high-low pairs) may result from their extremely small within-cluster sample sizes (no more than three individual records for both two clusters).
Tables
Table 1
The 19 selected sub-Saharan African countries along with their chosen early/late years of malaria prevalence (i.e. estimated parasite rate ) and IPUMS-DHS early/late years.
Note that some DHS span over two successive years.
| Country | Malaria prevalence | IPUMS-DHS | ||
|---|---|---|---|---|
| Early year | Late year | Early year | Late year | |
| Benin | 2001 | 2012 | 2001 | 2011–12 |
| Burkina Faso | 2003 | 2010 | 2003 | 2010 |
| Cameron | 2004 | 2011 | 2004 | 2011 |
| Congo Democratic Republic | 2007 | 2013 | 2007 | 2013–14 |
| Cote d’Ivoire | 2000 | 2012 | 1998–99 | 2011–12 |
| Ethiopia | 2000 | 2010 | 2000 | 2010–11 |
| Ghana | 2003 | 2014 | 2003 | 2014 |
| Guinea | 2005 | 2012 | 2005 | 2012 |
| Kenya | 2003 | 2014 | 2003 | 2014 |
| Malawi | 2000 | 2010 | 2000 | 2010 |
| Mali | 2001 | 2012 | 2001 | 2012–13 |
| Namibia | 2000 | 2013 | 2000 | 2013 |
| Nigeria | 2003 | 2013 | 2003 | 2013 |
| Rwanda | 2005 | 2014 | 2005 | 2014–15 |
| Senegal | 2005 | 2010 | 2005 | 2010–11 |
| Tanzania | 2000 | 2015 | 1999 | 2015–16 |
| Uganda | 2000 | 2011 | 2000–01 | 2011 |
| Zambia | 2007 | 2013 | 2007 | 2013–14 |
| Zimbabwe | 2005 | 2015 | 2005–06 | 2015 |
Table 2
Summary of the Bayesian logistic regression model fitted over records with observed birth weight which is used to predict missing low birth weight indicators.
| Predictor | Posterior mean | Posterior std | z-score | p-value |
|---|---|---|---|---|
| (Intercept) | 1.916 | 0.628 | 3.051 | 0.002** |
| Mother’s age (linear term) | −0.207 | 0.045 | −4.562 | <0.001*** |
| Mother’s age (quadratic term) | 0.003 | 0.001 | 3.987 | <0.001*** |
| Wealth index | 0.060 | 0.037 | 1.591 | 0.112 |
| Child’s birth order (linear term) | −0.989 | 0.338 | −2.925 | 0.003** |
| Child’s birth order (quadratic term) | 0.211 | 0.086 | 2.447 | 0.014* |
| 0 - rural; 1 - urban | 0.126 | 0.103 | 1.214 | 0.225 |
| Mother’s education level | −0.226 | 0.062 | −3.633 | <0.001*** |
| Child is boy | −0.068 | 0.083 | −0.815 | 0.415 |
| Mother is married or living together | −0.173 | 0.117 | −1.482 | 0.138 |
| Indicator of antenatal care | −0.046 | 0.093 | −0.493 | 0.622 |
| Indicator of low birth size | 2.410 | 0.090 | 26.776 | <0.001*** |
| Indicator of large birth size | −1.387 | 0.129 | −10.786 | <0.001*** |
Table 3
An interpretation of the coefficients of the intercept term and the three indicators defined in model (1) (i.e. the ) within each matched quadruple.
The coefficient of the low malaria prevalence indicator (i.e. the k1) incorporates the information of the magnitude of the effect of changing malaria burden (from high to low) on the low birth weight rate.
| Cluster | Prevalence | Time | Pair | Coefficients | Within-pair | Between-pair |
|---|---|---|---|---|---|---|
| Contrast | Contrast | |||||
| 1 | High | Early | High-low | |||
| 2 | Low | Late | High-low | |||
| 3 | High | Early | High-high | |||
| 4 | High | Late | High-high |
Table 4
The mean Haversine distance of the early year clusters and late year clusters is 24.1 km among the 219 high-low pairs of clusters, and 28.7 km among the 219 high-high pairs of clusters.
The within-pair longitudes’ and latitudes’ correlations between the paired early year and late year clusters among the high-low and high-high pairs all nearly equal one. The mean values of the longitudes, the latitudes, the annual malaria prevalence (i.e. ) measured at the early year, denoted as (early), and at the late year, denoted as (late), of the paired early year clusters (clusters sampled at the early year) and late year clusters (clusters sampled at the late year) among the 219 high-low and 219 high-high pairs of clusters used for the statistical inference respectively. Note that an early year cluster has a late year and a late year cluster has an early year since the MAP data contain for each location and for each year between 2000 and 2015.
| High-low pairs | High-high pairs | |||
|---|---|---|---|---|
| Mean within-pair haversine distance | 24.1 km | 28.7 km | ||
| Within-pair correlation of longitude | 0.9999 | 0.9996 | ||
| Within-pair correlation of latitude | 0.9998 | 0.9997 | ||
| Longitude | Latitude | (early) | (late) | |
| Early clusters among high-low pairs | 16.92 | −1.15 | 0.52 | 0.17 |
| Late clusters among high-low pairs | 16.88 | −1.15 | 0.48 | 0.12 |
| Early clusters among high-high pairs | 19.15 | 0.43 | 0.51 | 0.47 |
| Late clusters among high-high pairs | 19.13 | 0.46 | 0.53 | 0.49 |
Table 5
Balance of each covariate before matching (BM) and after matching (AM).
We report the mean of each covariate (including early and late years) for high-low and high-high pairs of clusters, before and after matching. We also report each absolute standardized difference (Std.dif) before and after matching.
| Before matching | After matching | Std.dif | ||||
|---|---|---|---|---|---|---|
| High-low | High-high | High-low | High-high | BM | AM | |
| (410 pairs) | (540 pairs) | (219 pairs) | (219 pairs) | |||
| Urban/rural (early) | 0.44 | 0.20 | 0.26 | 0.26 | 0.53 | 0.00 |
| Urban/rural (late) | 0.60 | 0.21 | 0.37 | 0.32 | 0.85 | 0.09 |
| Toilet facility (early) | 0.88 | 0.60 | 0.82 | 0.79 | 0.86 | 0.10 |
| Toilet facility (late) | 0.94 | 0.69 | 0.90 | 0.88 | 0.90 | 0.10 |
| Floor material (early) | 1.90 | 1.68 | 1.60 | 1.67 | 0.31 | 0.10 |
| Floor material (late) | 2.22 | 1.79 | 1.92 | 1.87 | 0.59 | 0.07 |
| Electricity (early) | 0.36 | 0.12 | 0.17 | 0.16 | 0.70 | 0.02 |
| Electricity (late) | 0.54 | 0.18 | 0.33 | 0.30 | 0.99 | 0.10 |
| Mother’s education (early) | 1.00 | 0.36 | 0.69 | 0.64 | 1.36 | 0.10 |
| Mother’s education (late) | 1.23 | 0.42 | 0.87 | 0.83 | 1.78 | 0.10 |
| Contraception indicator (early) | 0.16 | 0.12 | 0.15 | 0.17 | 0.27 | 0.10 |
| Contraception indicator (late) | 0.22 | 0.18 | 0.24 | 0.26 | 0.23 | 0.10 |
Table 6
Inference with multiple imputation and mixed-effects linear probability model (1).
The unit of estimates and CIs is a percentage point.
| Regressor | Estimate | 95% CI | p-value |
|---|---|---|---|
| 0 - high prevalence; 1 - low prevalence | −1.48 | [−3.70, 0.74] | 0.191 |
| 0 - early year; 1 - late year | −0.06 | [−1.82, 1.69] | 0.943 |
| 0 - high-high pairs; 1 - high-low pairs | 0.21 | [−1.40, 1.82] | 0.797 |
| Mother’s age (linear term) | −1.86 | [−2.48, −1.23] | <0.001*** |
| Mother’s age (quadratic term) | 0.03 | [0.02, 0.04] | <0.001*** |
| Child’s birth order (linear term) | −13.91 | [−18.49, −9.32] | <0.001*** |
| Child’s birth order (quadratic term) | 2.91 | [1.82, 4.00] | <0.001*** |
| Wealth index | 0.09 | [−0.38, 0.56] | 0.709 |
| 0 - rural; 1 - urban | 0.82 | [−0.63, 2.27] | 0.269 |
| Mother’s education level | −2.02 | [−2.82, −1.22] | <0.001*** |
| Child is boy | −1.75 | [−2.75, −0.74] | <0.001*** |
| Mother is married or living together | −1.43 | [−3.04, 0.19] | 0.083 |
| Antenatal care indicator | −0.96 | [−2.06, 0.13] | 0.085 |
Appendix 1—table 1
The early and late years coded in the IPUMS-DHS and GPS data sets.
| GPS data | Malaria prevalence | IPUMS-DHS | ||||
|---|---|---|---|---|---|---|
| Early | Late | Early | Late | Early | Late | |
| Benin | 2001 | 2012 | 2001 | 2012 | 2001 | 2011 |
| Burkina Faso (BF) | 2003 | 2010 | 2003 | 2010 | 2003 | 2010 |
| Cameron (CM) | 2004 | 2011 | 2004 | 2011 | 2004 | 2011 |
| Congo Democratic Republic (CD) | 2007 | 2013 | 2007 | 2013 | 2007 | 2013 |
| Cote d’Ivoire (CI) | 1998 | 2012 | 2000 | 2012 | 1998 | 2011 |
| Ethiopia (ET) | 2000 | 2010 | 2000 | 2010 | 2000 | 2011 |
| Ghana (GH) | 2003 | 2014 | 2003 | 2014 | 2003 | 2014 |
| Guinea (GN) | 2005 | 2012 | 2005 | 2012 | 2005 | 2012 |
| Kenya (KE) | 2003 | 2014 | 2003 | 2014 | 2003 | 2014 |
| Malawi (MW) | 2000 | 2010 | 2000 | 2010 | 2000 | 2010 |
| Mali (ML) | 2001 | 2012 | 2001 | 2012 | 2001 | 2012 |
| Namibia (NM) | 2000 | 2013 | 2000 | 2013 | 2000 | 2013 |
| Nigeria (NG) | 2003 | 2013 | 2003 | 2013 | 2003 | 2013 |
| Rwanda (RW) | 2005 | 2014 | 2005 | 2014 | 2005 | 2014 |
| Senegal (SN) | 2005 | 2010 | 2005 | 2010 | 2005 | 2010 |
| Tanzania (TZ) | 1999 | 2015 | 2000 | 2015 | 1999 | 2015 |
| Uganda (UG) | 2000 | 2011 | 2000 | 2011 | 2001 | 2011 |
| Zambia (ZM) | 2007 | 2013 | 2007 | 2013 | 2007 | 2013 |
| Zimbabwe (ZW) | 2005 | 2015 | 2005 | 2015 | 2005 | 2015 |
Appendix 1—table 2
The numbers of the high-high pairs of clusters and high-low pairs of clusters contributed by each of the 19 selected sub-Saharan African countries after the matching in Step 1 and Step 2.
We also summarize the total number of pairs of clusters after Step 1 matching in the first column.
| Country | Step 1 matching | Step 2 matching | |||
|---|---|---|---|---|---|
| Total pairs | High-high | High-low | High-high | High-low | |
| Benin | 247 | 29 | 6 | 4 | 6 |
| Burkina Faso | 400 | 150 | 0 | 19 | 0 |
| Cameron | 466 | 17 | 163 | 16 | 51 |
| Congo Democratic Republic | 300 | 11 | 55 | 11 | 24 |
| Cote d’Ivoire | 140 | 19 | 2 | 7 | 2 |
| Ethiopia | 539 | 0 | 0 | 0 | 0 |
| Ghana | 412 | 24 | 18 | 18 | 8 |
| Guinea | 295 | 47 | 12 | 10 | 12 |
| Kenya | 400 | 2 | 10 | 2 | 8 |
| Malawi | 560 | 96 | 15 | 81 | 15 |
| Mali | 402 | 101 | 21 | 17 | 19 |
| Namibia | 260 | 0 | 0 | 0 | 0 |
| Nigeria | 362 | 24 | 11 | 16 | 1 |
| Rwanda | 462 | 0 | 0 | 0 | 0 |
| Senegal | 376 | 0 | 0 | 0 | 0 |
| Tanzania | 176 | 0 | 68 | 0 | 57 |
| Uganda | 298 | 19 | 29 | 17 | 16 |
| Zambia | 319 | 1 | 0 | 1 | 0 |
| Zimbabwe | 398 | 0 | 0 | 0 | 0 |
| Total | 6812 | 540 | 410 | 219 | 219 |
Appendix 1—table 3
Summary of the low malaria prevalence indicators, the time indicators, the group indicators, the covariates, and the birth weight records among the 18,112 study individual records.
| Variables | Percentages of some categories |
|---|---|
| Low malaria prevalence indicator | High prevalence (70.6%) |
| Low prevalence (29.4%) | |
| Time indicator | Early year (50.3%) |
| Late year (49.7%) | |
| Group indicator | High-high pairs (40.9%) |
| High-low pairs (59.1%) | |
| Mother’s age in years | ≤19 (7.1%) |
| 20–29 (52.5%) | |
| 30–39 (31.4%) | |
| ≥40 (8.9%) | |
| Wealth index | Poorest (20.2%) |
| Poorer (23.3%) | |
| Middle (22.8%) | |
| Richer (20.4%) | |
| Richest (13.3%) | |
| Child’s birth order | 1 (21.5%) |
| 2–4 (46.0%) | |
| 4+ (32.6%) | |
| Urban or rural | Rural (77.1%) |
| Urban (22.9%) | |
| Mother’s education level | No education (36.6%) |
| Primary (47.2%) | |
| Secondary or higher (16.2%) | |
| Child’s sex | Female (49.3%) |
| Male (50.7%) | |
| Mother’s marital status | Never married or formerly in union (11.6%) |
| Married or living together (88.4%) | |
| Indicator of antenatal care | Yes (61.9%) |
| No or missing (38.1%) | |
| Self-reported birth size | Very small or smaller than average (13.0%) |
| Average (45.5%) | |
| Larger than average or very large (41.5%) | |
| Low birth weight indicator | Yes (4.6%) |
| No (48.5%) or Missing (47.0%) |
Appendix 2—table 1
Diagnostics for multiple imputation with the mixed-effects linear probability model.
We report the between-imputation variance (`Between var’), the within-imputation variance (‘Within var’), and the variance ratio: (between-imputation variance)/(within-imputation variance), denoted as `Var ratio’.
| Regressor | Between var | Within var | Var ratio |
|---|---|---|---|
| 0 - high prevalence; 1 - low prevalence | 3.21 × 10⁻⁵ | 9.62 × 10⁻⁵ | 0.334 |
| 0 - early year; 1 - late year | 2.20 × 10⁻⁵ | 5.81 × 10⁻⁵ | 0.379 |
| 0 - high-high pairs; 1 - high-low pairs | 1.92 × 10⁻⁵ | 4.83 × 10⁻⁵ | 0.398 |
| Mother’s age (linear term) | 3.32 × 10⁻⁶ | 6.85 × 10⁻⁶ | 0.486 |
| Mother’s age (quadratic term) | 8.28 × 10⁻¹⁰ | 1.68 × 10⁻⁹ | 0.493 |
| Child’s birth order (linear term) | 1.60 × 10⁻⁴ | 3.87 × 10⁻⁴ | 0.413 |
| Child’s birth order (quadratic term) | 8.55 × 10⁻⁶ | 2.24 × 10⁻⁵ | 0.382 |
| Wealth index | 1.74 × 10⁻⁶ | 4.05 × 10⁻⁶ | 0.430 |
| 0 -rural; 1 - urban | 1.27 × 10⁻⁵ | 4.21 × 10⁻⁵ | 0.303 |
| Mother’s education level | 4.56 × 10⁻⁶ | 1.20 × 10⁻⁵ | 0.380 |
| Child is boy | 7.12 × 10⁻⁶ | 1.91 × 10⁻⁵ | 0.373 |
| Mother is married or living together | 1.83 × 10⁻⁵ | 4.96 × 10⁻⁵ | 0.370 |
| Antenatal care indicator | 9.63 × 10⁻⁶ | 2.16 × 10⁻⁵ | 0.447 |
Appendix 3—table 1
The results of the sensitivity analyses for the coefficient of the low malaria prevalence indicator under various sensitivity parameters divided into the four cases: Case 1: ; Case 2: ; Case 3: ; Case 4: .
The unit of estimates and CIs is a percentage point.
| Case 1 | ||||||
|---|---|---|---|---|---|---|
| Estimate | 95% CI | p-value | Estimate | 95% CI | p-value | |
| 0.179 | 0.168 | |||||
| 0.167 | 0.145 | |||||
| 0.156 | 0.125 | |||||
| 0.145 | 0.107 | |||||
| Case 2 | ||||||
| Estimate | 95% CI | p-value | Estimate | 95% CI | p-value | |
| 0.204 | 0.219 | |||||
| 0.218 | 0.249 | |||||
| 0.234 | 0.282 | |||||
| 0.250 | 0.318 | |||||
| Case 3 | ||||||
| Estimate | 95% CI | p-value | Estimate | 95% CI | p-value | |
| 0.204 | 0.219 | |||||
| 0.219 | 0.249 | |||||
| 0.234 | 0.282 | |||||
| 0.250 | 0.319 | |||||
| Case 4 | ||||||
| Estimate | 95% CI | p-value | Estimate | 95% CI | p-value | |
| 0.179 | 0.168 | |||||
| 0.167 | 0.146 | |||||
| 0.156 | 0.126 | |||||
| 0.145 | 0.108 | |||||
Additional files
-
Source code 1
The source code for producing the results in Figure 1, the results in Figure 3, the results in Tables 2, 3, 5 and 6, the results in Table 4, the results in Appendix 1—table 2, the results in Appendix 1 Table 3, and the results in Appendix 3—table 1 can be found respectively in 'Code for Figure 1.R', 'Code for Figure 3.R', 'Code for primary analysis.R', 'Code for Table 4.R', 'Code for Appendix 1 Table 2.R', 'Code for Appendix 1 Table 3.R', and 'Code for Sensitivity Analyses.R' in the source code files.
The source code are also posted on GitHub (https://github.com/siyuheng/Malaria-and-Low-Birth-Weight; Heng, 2021a).
- https://cdn.elifesciences.org/articles/65133/elife-65133-code1-v1.zip
-
Transparent reporting form
- https://cdn.elifesciences.org/articles/65133/elife-65133-transrepform-v1.docx
Download links
A two-part list of links to download the article, or parts of the article, in various formats.
Downloads (link to download the article as PDF)
Open citations (links to open the citations from this article in various online reference manager services)
Cite this article (links to download the citations from this article in formats compatible with various reference manager tools)
Relationship between changing malaria burden and low birth weight in sub-Saharan Africa: A difference-in-differences study via a pair-of-pairs approach
eLife 10:e65133.
https://doi.org/10.7554/eLife.65133


