Resistance to different anthracycline chemotherapeutics elicits distinct and actionable primary metabolic dependencies in breast cancer
- Department of Biochemistry, Faculty of Medicine, McGill University, Canada
- Goodman Cancer Research Centre, McGill University, Canada
- Department of Biochemistry, Microbiology, and Immunology, University of Ottawa, Canada
- Ottawa Institute of Systems Biology, Canada
- Department of Medicine, Faculty of Medicine, McGill University, Canada
- Department of Epidemiology, Biostatistics and Occupational Health, McGill University, Canada
- Lady Davis Institute, Jewish General Hospital, Canada
- Department of Human Genetics, McGill University, Canada
- Gerald Bronfman Department of Oncology, Canada
Figures
Figure 1 with 1 supplement
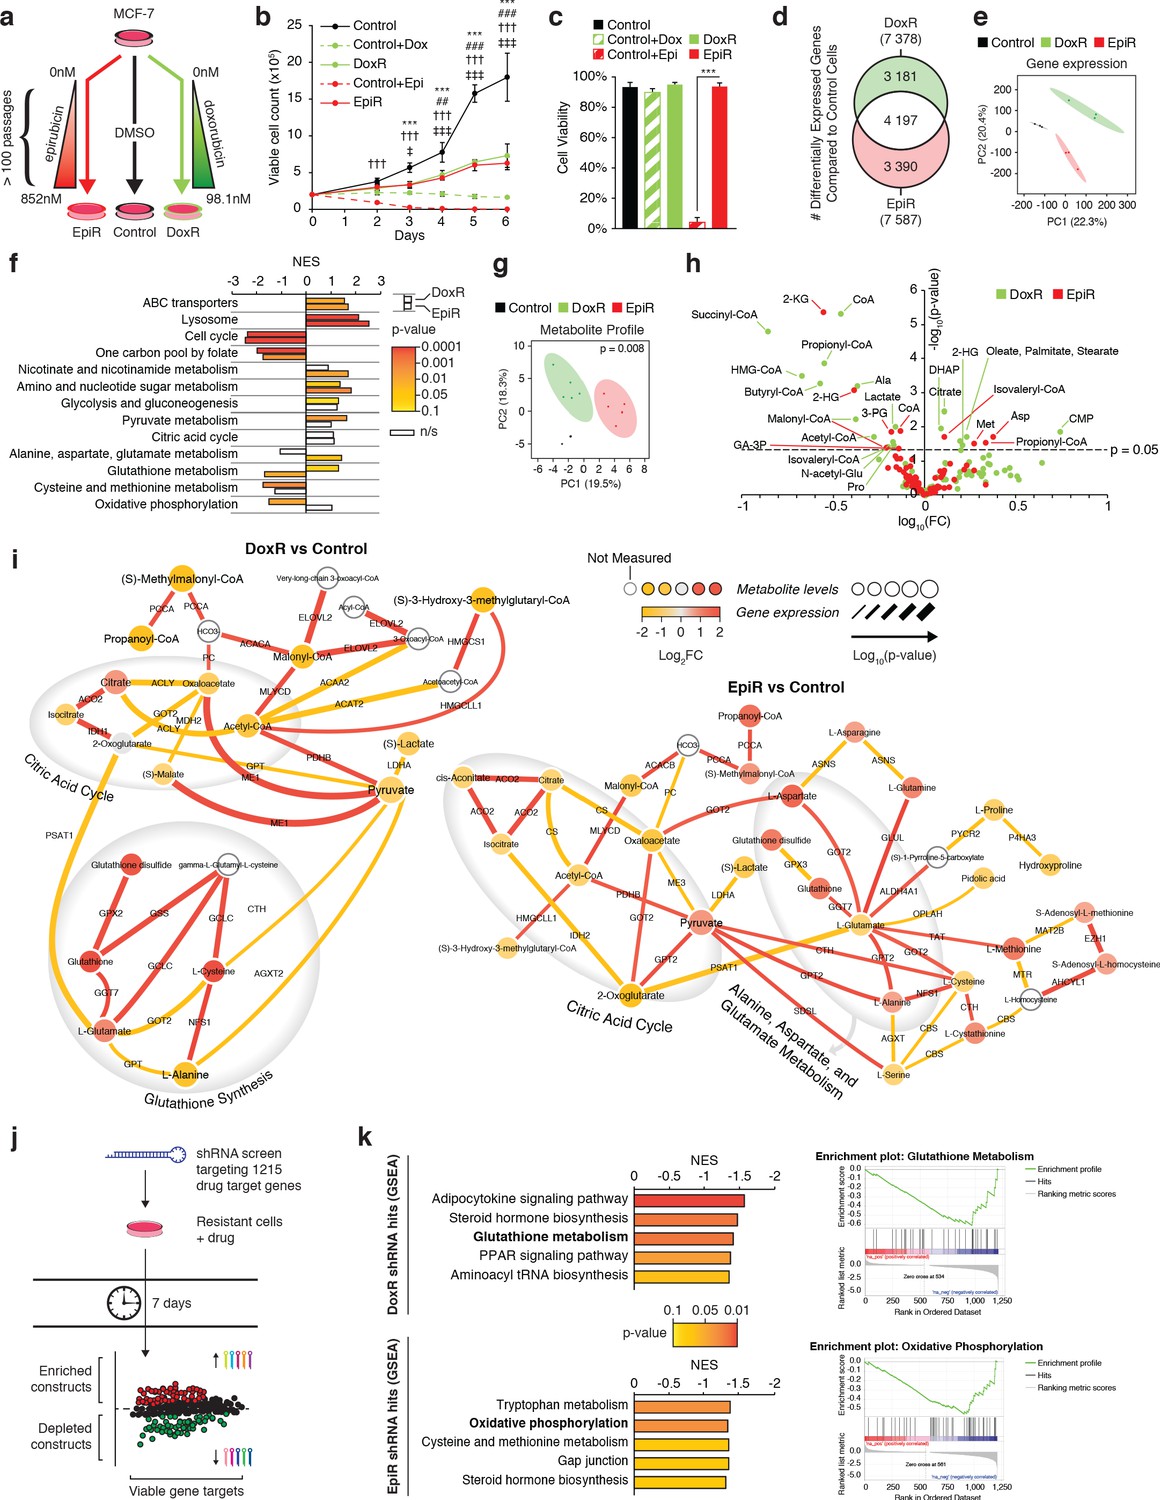
Transcriptomic and metabolomic analyses uncover distinct metabolic alterations in doxorubicin and epirubicin resistant breast cancer cells, compared to anthracycline-sensitive Control cells.
(a) Model detailing stepwise generation of Control, DoxR, and EpiR breast cancer cells, as previously described (Hembruff et al., 2008). (b) Viable cell number of anthracycline-resistant cells in the presence of drugs and anthracycline-treated Control cells compared to untreated Control (DMSO). N = 4, ***p<0.001 Control vs Control +Dox, ##p<0.01 ###p<0.001 DoxR vs Control +Dox, †††p<0.001 Control vs Control +Epi, ‡p<0.05 ‡‡‡p<0.001 EpiR vs Control +Epi (two-way ANOVA, Tukey’s multiple comparison test). (c) Viability of anthracycline-resistant cells and treated or untreated (DMSO) Control cells after 7 days growth. N = 4, ***p<0.001 (paired Student’s t-test). (d) Venn diagram of differentially expressed genes in DoxR or EpiR cells compared to Control cells. Legend: green (differentially expressed in DoxR only), red (differentially expressed in EpiR only), and white (differentially expressed in both). N = 3. (e) Principal component analysis of global gene expression profiling between Control, DoxR, and EpiR cells. N = 3. (f) Gene set enrichment analysis (GSEA) of DoxR and EpiR cells compared to Control cells (KEGG database, N = 3). Data are shown as normalized enrichment score (NES) for DoxR and EpiR, where color designates the p-value associated with each enrichment (from yellow at p=0.1 to red at p=0.0001) and where white bars designate non-significant enrichments (n/s, p>0.1). (g) Partial least squares discriminant analysis of metabolite profile data between Control, DoxR, and EpiR cells. N = 6, p=0.008 (1000 permutations). (h) Volcano plot of metabolite profile of DoxR and EpiR cells compared to Control cells (N = 6). Significant features (p<0.05, paired Student’s t-test) highlighted. (i) Integrated metabolic network analysis of DoxR (left) and EpiR (right) cells compared to Control cells. Metabolites are represented by nodes, with p-value represented by node size. Enzymes are represented by edges, with p-value of gene expression represented by edge thickness. Direction and magnitude of fold changes in gene expression and metabolite abundance are represented on a yellow (depleted in resistant) to red (enriched in resistant) color scale. Major pathways are highlighted in shaded areas. (j) Model detailing shRNA screen targeting 1215 drug target genes. Changes in shRNA barcode abundance were measured after 7 days, and viable gene targets were ranked by p-value and fold change of target shRNA abundance. Depleted shRNA were considered cytotoxic or cytostatic to resistant cells in the presence of drug, while enriched barcodes were considered to promote cell proliferation or survival. (k) (left) Top five metabolic pathways identified by Gene Set Enrichment Analysis (KEGG database) of ranked shRNA gene targets depleted in DoxR (top) and EpiR (bottom) cells. (right) GSEA plots detailing enrichment of key metabolic pathways identified in DoxR cells (Glutathione Metabolism, top) or EpiR (Oxidative Phosphorylation, bottom). All data presented as averages ± S.E.M. (b-c).
Figure 1—figure supplement 1
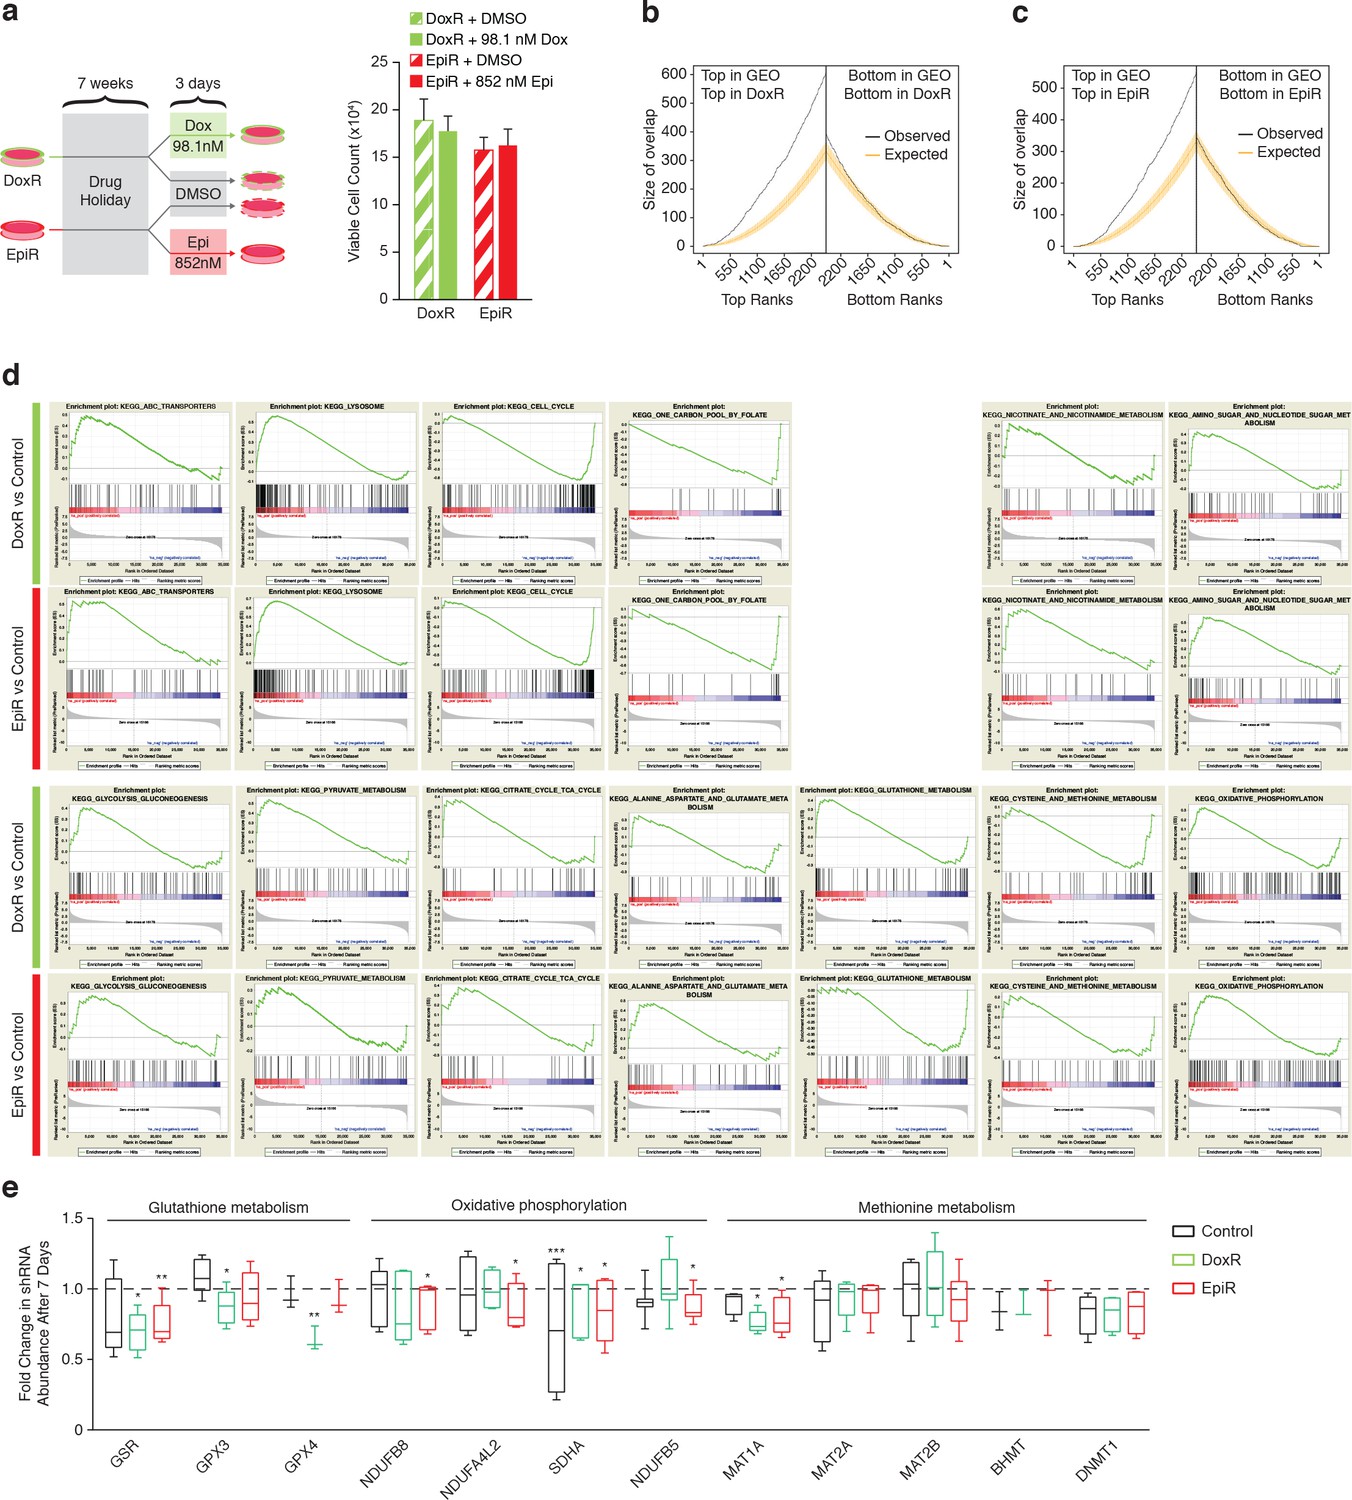
Common and distinct pathways modulated in DoxR and EpiR cells compared to Control cells.
(a) Viable cell counts in DoxR and EpiR cells treated for 3 days with 98.1 nM doxorubicin or 852 nM epirubicin respectively, compared to DoxR and EpiR cells treated with DMSO control, after a 7-week (49 days) drug holiday. N = 3. Data presented as averages ± S.E.M. (b) Overlap of differentially expressed genes in DoxR (compared to Control) cells and patient biopsies post-chemotherapy (compared to pre-chemotherapy). Overlap size is drawn as a step function over respective ranks. Top ranks correspond to upregulated and Bottom ranks to downregulated genes. The yellow lines represent the expected overlap ±95% empirical confidence intervals derived by random shuffling strategy. (c) Overlap of differentially expressed genes in EpiR (compared to Control) cells and patient biopsies post-chemotherapy (compared to pre-chemotherapy), as in (b). (d) Gene Set Enrichment Analysis (GSEA) plots of over-represented and under-represented KEGG pathways in global gene expression of DoxR and EpiR cells compared to Control cells. (e) Fold change in abundance of shRNA targeting genes of the glutathione metabolism, oxidative phosphorylation, and methionine metabolism pathways, after 7 days in Control, DoxR, or EpiR cells. *p<0.05 **p<0.01 ***p<0.001 day 7 vs day 0 (MAGeCK analysis). Data are shown as box plots representing the average of three to seven independent shRNA barcodes per gene target ± S.E.M.
Figure 2 with 3 supplements

Doxorubicin-resistant breast cancer cells fuel anaplerotic metabolism by altering glucose and glutamine metabolism.
(a) Relative expression of pyruvate metabolism, citric acid cycle, and glutamine and glutathione metabolism genes in DoxR and EpiR compared to Control cells. N = 3–6, *p<0.05 **p<0.01 ***p<0.001 resistant versus Control cells (paired Student’s t-test). (b) Stable isotope tracing diagram for [U-13C]-Glucose through glycolysis and into the citric acid cycle via pyruvate dehydrogenase (PDH, black) and adjacent pathways (gray). (c) [U-13C]-Glucose tracing into the citric acid cycle via PDH (citrate, malate, fumarate, and aspartate m + 2, 30 min tracer) in Control, DoxR, and EpiR cells expressed as fractional enrichment. N = 4, *p<0.05 resistant versus Control cells (paired Student’s t-test). (d) [U-13C]-Glucose tracing to glutamate (m + 2) via PDH and into the citric acid cycle via PC or ME1/2 activity (citrate, malate, fumarate, and aspartate m + 3, 30 min tracer) in Control, DoxR, and EpiR cells expressed as fractional enrichment. N = 4, *p<0.05 **p<0.01 resistant versus Control cells (paired Student’s t-test). (e) Stable isotope tracing diagram for [U-13C]-Glutamine into the citric acid cycle, glutathione synthesis, and adjacent pathways. Reductive carboxylation pathway shown in gray. (f) [U-13C]-Glutamine tracing to glutamate and into the citric cycle (2KG m + 5, citrate m + 4 and m + 5, 60 min tracer) or through to glutathione (GSH m + 3,5 and GSSG m + 3,5,6,8,10, 4 hr tracer) in Control, DoxR, and EpiR cells expressed as fractional enrichment. N = 4, *p<0.05 ***p<0.001 resistant versus Control cells (paired Student’s t-test). (g) Total intracellular glutathione concentration in Control, DoxR and EpiR cells. N = 4, *p<0.05 resistant vs Control cells, #p<0.05 DoxR vs EpiR cells (paired Student’s t-test). (h) Fold change in GSH:GSSG ratio of DoxR and EpiR cells compared to Control cells. N = 4, **p<0.01 resistant vs Control, #p<0.05 DoxR vs EpiR cells (paired Student’s t-test). (i) Fold change in NADH/NAD and NADPH/NAD ratio of DoxR and EpiR cells compared to Control cells. N = 6, *p<0.05 **p<0.01 resistant versus Control cells (paired Student’s t-test). Data are shown on a log2 scale. (j) Relative expression of oxidative response genes in DoxR and EpiR cells compared to Control cells. N = 4–7, *p<0.05 **p<0.01 ***p<0.001 resistant vs Control cells (paired Student’s t-test). (k) Fold change of ROS signal in DoxR and EpiR cells compared to Control cells, detected by CM-H2DCFDA. N = 3, **p<0.01 resistant vs Control cells, #p<0.05 DoxR vs EpiR cells (paired Student’s t-test). (l) Fold change of ROS signal in DoxR and EpiR compared to Control cells, after 30-min treatment with 0.03% H2O2. N = 3, *p<0.05 **p<0.01 resistant vs Control cells (paired Student’s t-test). All data presented as averages ± S.E.M.
Figure 2—figure supplement 1

[U-13C]-glucose tracing of Control, DoxR, and EpiR breast cancer cells.
(a) Time-course of [U-13C]-glucose tracing through glycolysis and into the citric acid cycle via PDH (black) and adjacent pathways (gray) in Control, DoxR, and EpiR expressed as fractional enrichment. N = 4, *p<0.05 DoxR vs Control cells, #p<0.05 EpiR vs Control cells (paired Student’s t-test). Relative metabolite levels in Control, DoxR, and EpiR are respectively indicated by black, green, and red circles above each fractional enrichment graph. N = 6. (b) Fractional enrichment of [U-13C]-glucose-labeled citric acid cycle metabolites (citrate, malate, fumarate, and aspartate 30 min tracer) in Control, DoxR, and EpiR, at a single time point within the dynamic range. N = 4, *p<0.05 **p<0.01 resistant vs Control cells (paired Student’s t-test). All data presented as averages ± S.E.M.
Figure 2—figure supplement 2
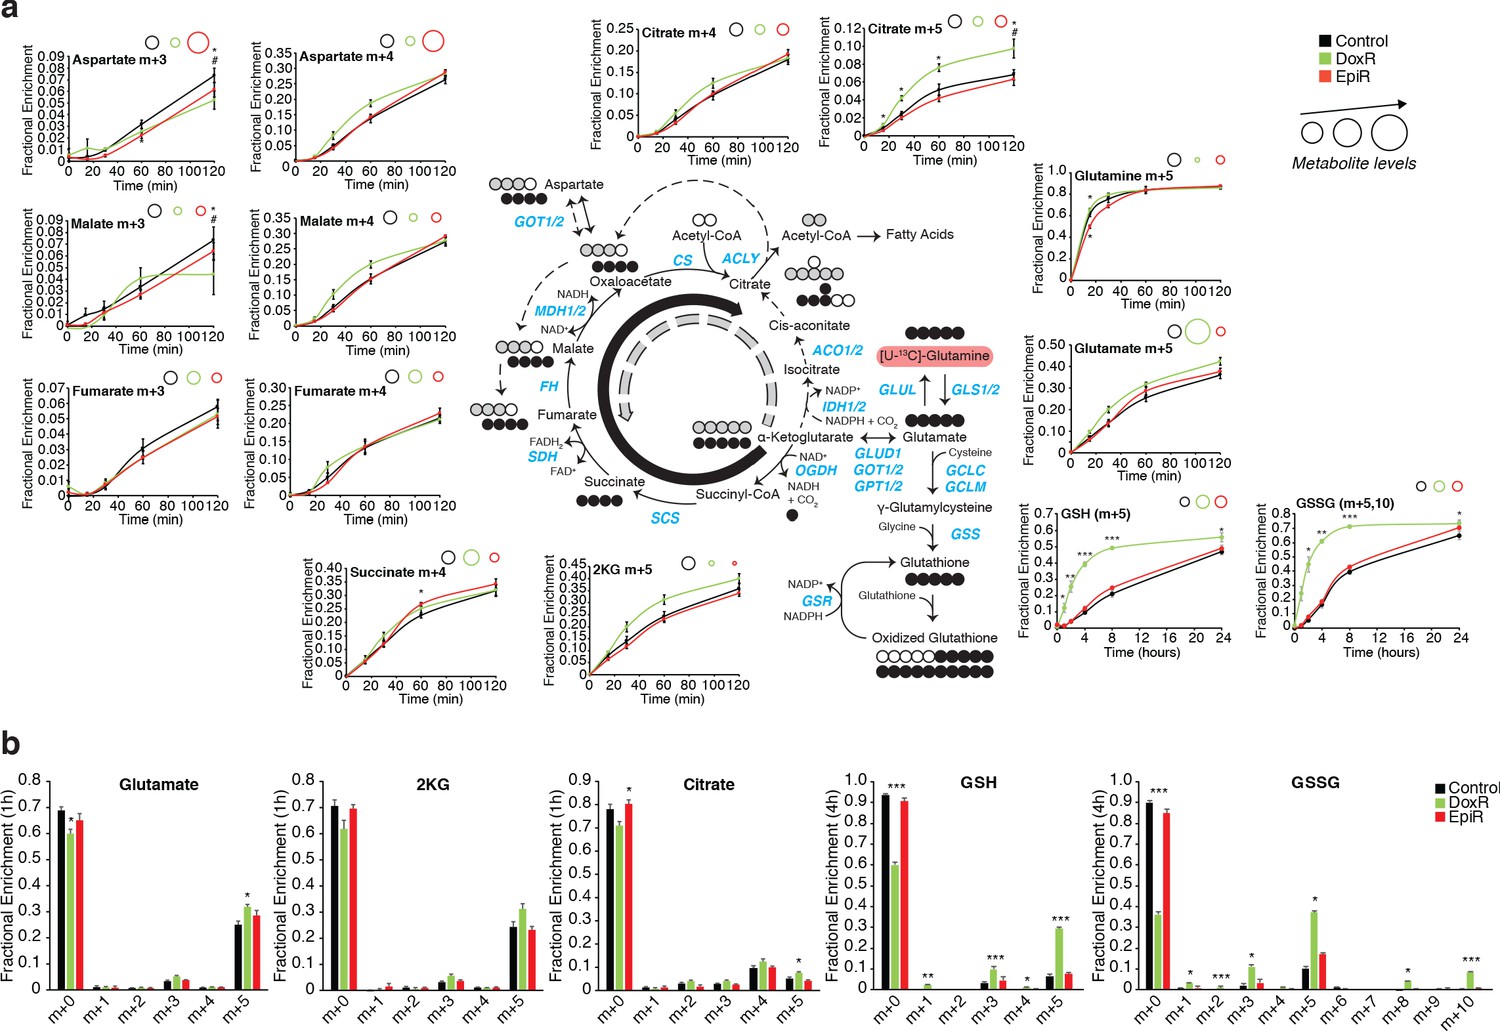
[U-13C]-glutamine tracing of Control, DoxR, and EpiR breast cancer cells.
(a) Time-course of [U-13C]-glutamine tracing into the citric acid cycle, glutathione synthesis, and adjacent pathways in Control, DoxR, and EpiR expressed as fractional enrichment. N = 4, *p<0.05 DoxR vs Control cells, #p<0.05 EpiR vs Control cells (paired Student’s t-test). Relative metabolite levels in Control, DoxR, and EpiR are respectively indicated by black, green, and red circles above each fractional enrichment graph. N = 4–6. (b) Fractional enrichment of [U-13C]-glutamine labeled glutamate (1 hr tracer), citric acid cycle (α-ketoglutarate (2KG), citrate, 1 hr tracer) metabolites, and glutathione (GSH, GSSG, 4 hr tracer) in Control, DoxR, and EpiR, at a single time point within the dynamic range. N = 4, *p<0.05 **p<0.01 resistant vs Control cells (paired Student’s t-test). All data presented as averages ± S.E.M.
Figure 2—figure supplement 3
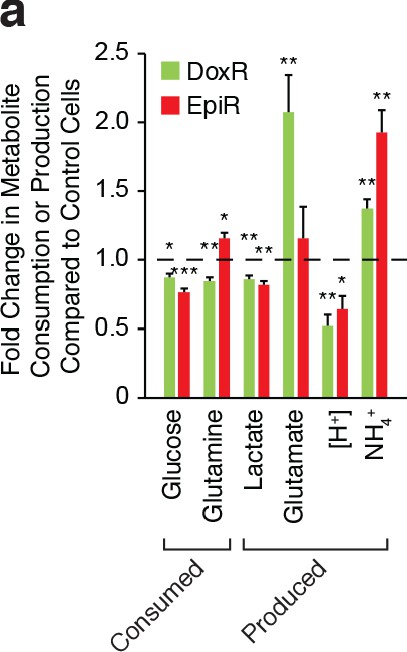
Media metabolite composition of Control, DoxR, and EpiR breast cancer cells.
(a) Fold change in media metabolite abundance of DoxR and EpiR cells compared to Control cells, after 72 hr of growth and normalized to blank media from parallel plates that were not exposed to cells. *p<0.05 **p<0.01 ***p<0.001 resistant vs Control cells (paired Student’s t-test). All data presented as averages ± S.E.M.
Figure 3 with 1 supplement
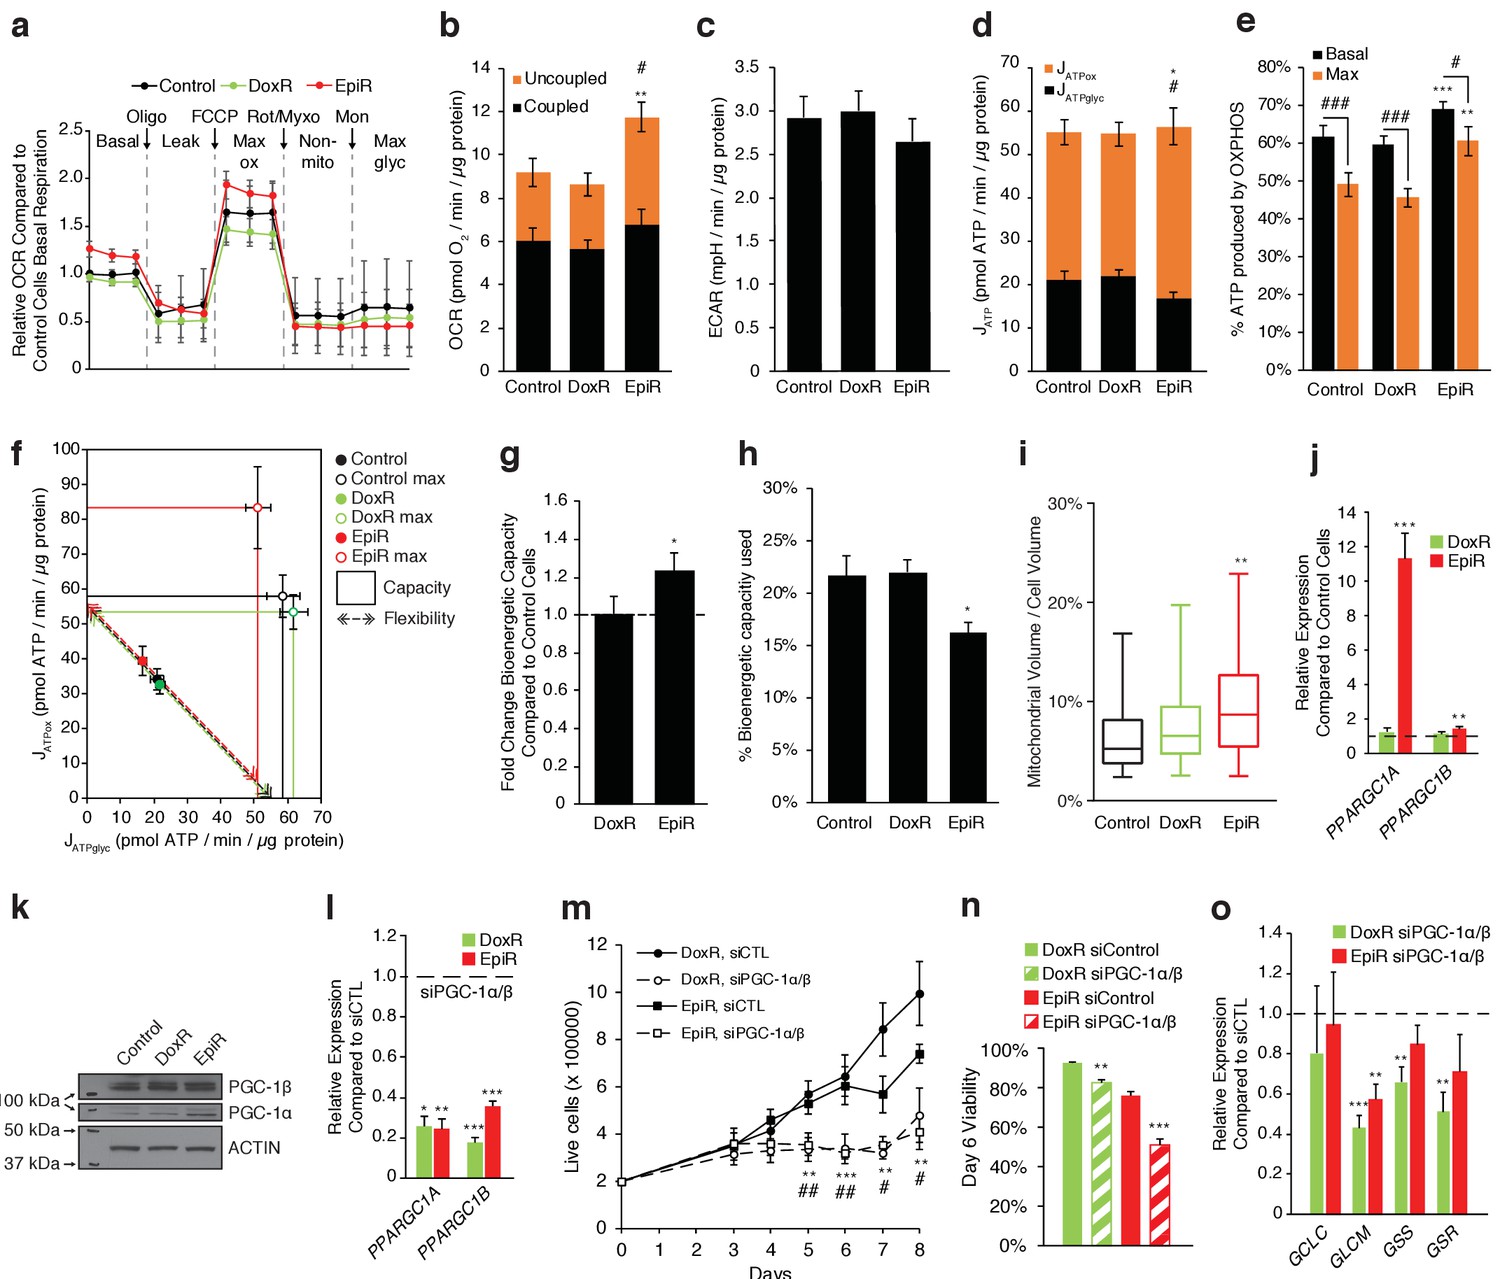
PGC-1α is overexpressed and elevates OXPHOS capacity in epirubicin-resistant cells but is essential for sustaining growth and survival in both doxorubicin and epirubicin resistant breast cancer cells.
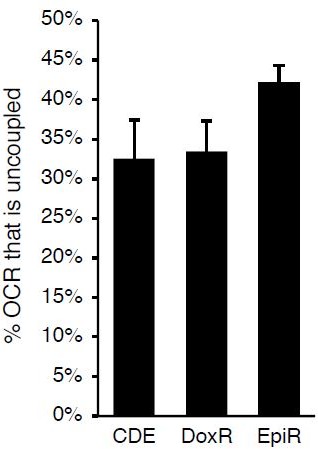
(a) Analysis of relative basal, leak (oligomycin), maximum (FCCP), and non-mitochondrial (rotenone and myxothiazol) respiration, as well as after addition of monensin, in Control, DoxR, and EpiR cells. All values normalized to basal respiration in Control cells. N = 9. (b) Quantification of coupled, uncoupled, and total Oxygen Consumption Rate (OCR) in Control, DoxR, and EpiR cells. N = 9, **p<0.01 uncoupled #p<0.05 total, resistant vs Control cells (paired Student’s t-test). (c) Quantification of basal Extracellular Acidification Rate (ECAR) in Control, DoxR, and EpiR cells. N = 9. (d) Quantification of ATP production rate (JATP) from oxidative phosphorylation (JATPox) or glycolysis (JATPglyc) in Control, DoxR, and EpiR cells. N = 9, *p<0.05 JATPox #p<0.05 JATPglyc, resistant vs Control cells (paired Student’s t-test). (e) Proportion of ATP produced by OXPHOS in Control, DoxR, and EpiR cells under basal conditions and at peak bioenergetic capacity (Max). N = 9, **p<0.01 ***p<0.001 resistant vs Control cells, #p<0.05 ##p<0.01 ###p<0.001 Max vs Basal (paired Student’s t-test). (f) Bioenergetic space plots of Control, DoxR, and EpiR cells. Solid points represent basal JATPglyc and JATPox values, hollow points represent theoretical maximums for JATPox (FCCP) and JATPglyc (rotenone, myxothiazol, monensin). Dotted line arrows’ length represents flexibility of ATP production within maximum boundaries (solid lines). Area under maximum boundaries represents the bioenergetic capacity. N = 9. (g) Fold change in bioenergetic capacity of DoxR and EpiR cells compared to Control cells. N = 9, *p<0.05 resistant vs Control cells (paired Student’s t-test). (h) Fraction of bioenergetic capacity used under basal conditions in Control, DoxR, and EpiR cells. N = 9, *p<0.05 resistant vs Control cells (paired Student’s t-test). (i) Quantification of mitochondrial volume as a percentage of total cytoplasmic volume, in Control, DoxR, and EpiR cells. N = 38, **p<0.01 resistant vs Control cells (Kruskal-Wallis test and Dunn’s multiple comparisons test). Data presented as a box plot. (j) Relative expression of PPARGC1A and PPARGC1B mRNA in DoxR and EpiR cells compared to Control cells. N = 7, **p<0.01 ***p<0.001 resistant vs Control cells (paired Student’s t-test). (k) Immunoblots of PGC-1β, PGC-1α, and Actin protein expression in Control, DoxR, and EpiR cells. (l) Relative expression of PPARGC1A and PPARGC1B mRNA in DoxR and EpiR 3 days after double siRNA knockdown of PGC-1α and PGC-1β, compared to control siRNA. N = 5, *p<0.05 **p<0.01 ***p<0.001 siPGC-1α/β vs siCTL (paired Student’s t-test). (m) Growth of DoxR and EpiR in the presence of anthracyclines (dox 98.1 nM or epi 852 nM) with double siRNA knockdown of PGC-1α and PGC-1β or control siRNA. N = 5, **p<0.01 ***p<0.001 DoxR siPGC-1α/β vs DoxR siCTL, #p<0.05 ##p<0.01 EpiR siPGC-1α/β vs EpiR siCTL (paired Student’s t-test). (n) Cell viability at day 6 of the growth curve shown in d. N = 5, **p<0.01 ***p<0.001 siPGC-1α/β vs siCTL (paired Student’s t-test). (o) Relative expression of glutathione metabolism genes 3 days after double siRNA knockdown of PGC-1α and PGC-1β, compared to control siRNA. N = 5, **p<0.01 ***p<0.001 siPGC-1α/β vs siCTL (paired Student’s t-test). All data presented as averages ± S.E.M.
Figure 3—figure supplement 1
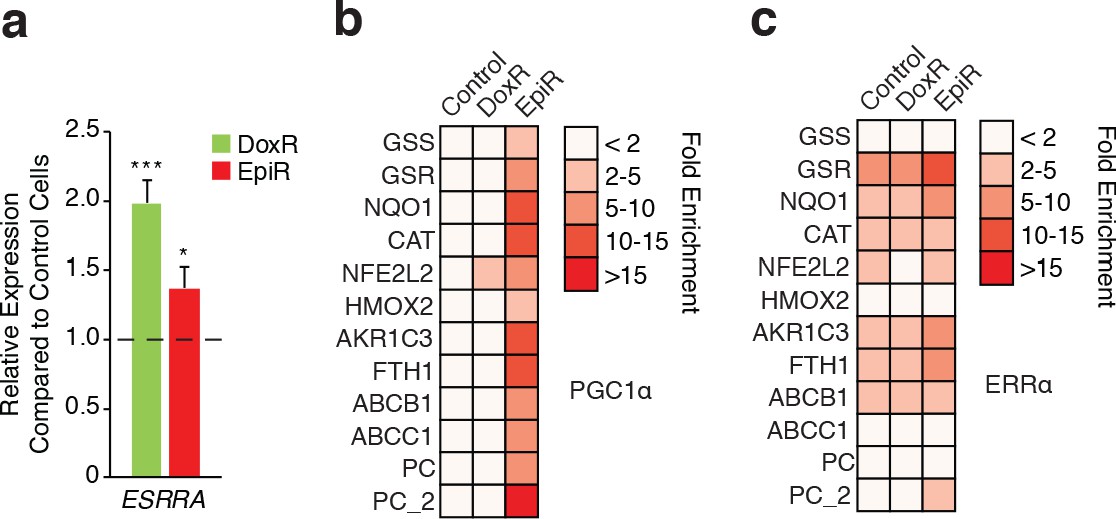
PGC-1α and ERRα are enriched at the promoters of key metabolic and resistance-associated genes.
(a) Relative expression of ESRRA mRNA in DoxR and EpiR cells compared to Control cells. N = 8, *p<0.05 ***p<0.001 resistant vs Control cells (paired Student’s t-test). (b) ChIP analyses for PGC-1α at ERRE sites on the promoter of glutathione, oxidative response, and resistance-associated genes in Control, DoxR, and EpiR. Data represent the fold enrichment versus IgG control for one representative experiment of N = 3. (c) ChIP analyses for ERRα at ERRE sites on the promoter of key glutathione, oxidative response, and resistance-associated genes in Control and anthracycline-resistant MCF7 cells. Data represent the fold enrichment versus IgG control for one representative experiment of N = 3. All data presented as averages ± S.E.M.
Figure 4 with 1 supplement

Doxorubicin-resistant breast cancer cells are reliant on glutamine to sustain their OXPHOS bioenergetic capacity.
(a) Growth of Control, DoxR, and EpiR cells in glutamine-rich (4 mM) or glutamine-deprived (0 mM) conditions. Cells were differentially seeded to reach a total of 200,000 cells at day 3 under normal growth conditions; media was then changed for glutamine-rich or glutamine-depleted media, daily (day 3–11). N = 3, *p<0.05 **p<0.01 Control cells 0 mM vs 4 mM, #p<0.05 ##p<0.01 DoxR cells 0 mM vs 4 mM, †p<0.05 ††p<0.001 EpiR cells 0 mM vs 4 mM (paired Student’s t-test). (b) Fold change in viability of Control, DoxR, and EpiR cells after 6 days glutamine withdrawal compared to glutamine-rich (4 mM) conditions. N = 3, *p<0.05 **p<0.01 0 mM vs 4 mM glutamine (paired Student’s t-test). (c) Seahorse analysis of basal, leak (oligomycin), maximum (FCCP), and non-mitochondrial (rotenone and myxothiazol) oxygen consumption rates, as well as after addition of monensin, in Control, DoxR, and EpiR cells after 4 hr glutamine withdrawal compared to glutamine-rich (4 mM) conditions, presented as relative to the basal respiration rate of Control cells in the presence of glutamine. N = 5, *p<0.05 **p<0.01 DoxR 0 mM Gln vs DoxR 4 mM Gln, #p<0.05 EpiR 0 mM Gln vs EpiR 4 mM Gln (paired Student’s t-test). (d) Fold change in ATP production by oxidative phosphorylation (JATPox) of Control, DoxR, and EpiR cells after 4 hr glutamine withdrawal compared to glutamine-rich (4 mM) conditions. N = 5, #p<0.05 0 mM vs 4 mM (paired Student’s t-test). (e) Fold change in ATP production from glycolysis (JATPglyc) of Control, DoxR, and EpiR cells after 4 hr glutamine withdrawal compared to glutamine-rich (4 mM) conditions. N = 5, ##p<0.01 0 mM vs 4 mM (paired Student’s t-test). (f) Fold change in total ATP production rate (JATP) of Control, DoxR, and EpiR cells after 4 hr glutamine withdrawal compared to glutamine-rich (4 mM) conditions. N = 5, *p<0.05 resistant vs Control cells (paired Student’s t-test). (g) Fold change in bioenergetic capacity of Control, DoxR, and EpiR cells after 4 hr glutamine withdrawal compared to glutamine-rich (4 mM) conditions. N = 5, *p<0.05 **p<0.01 resistant vs Control cells, ###p<0.001 0 mM vs 4 mM glutamine. (h-j) Bioenergetic space plots of Control (h), DoxR (i), and EpiR (j) cells after 4 hr glutamine withdrawal compared to glutamine-rich (4 mM) conditions. Solid points represent actual JATPglyc and JATPox values, hollow points represent theoretical maximums for JATPox (FCCP) and JATPglyc (rotenone, myxothiazol, monensin). Dotted line arrows’ length represents flexibility of ATP production within maximum boundaries (solid lines). Area under maximum boundaries represents the bioenergetic capacity. N = 5. All data presented as averages ± S.E.M.
Figure 4—figure supplement 1
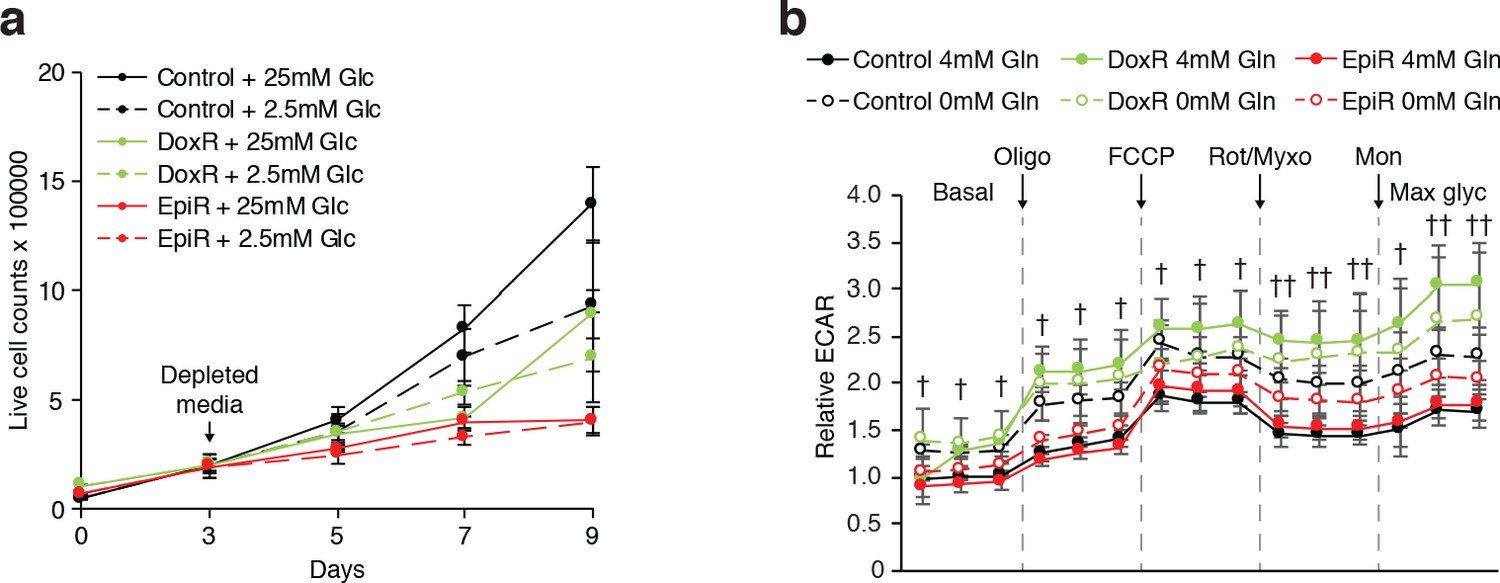
Proliferation and bioenergetics of Control, DoxR, and EpiR cells under nutrient deprivation conditions.
(a) Growth of Control, DoxR, and EpiR cells in glucose-rich (25 mM) or low-glucose (2.5 mM) conditions. Cells were differentially seeded to reach a total of 200,000 cells at day 3 under normal growth conditions; media was then changed for glucose-rich or low-glucose media, daily (day 3–9). N = 3. (b) Seahorse analysis of basal, leak (oligomycin), maximum (FCCP), and non-mitochondrial (rotenone and myxothiazol) extracellular acidification rates (ECAR), as well as after addition of monensin, in Control, DoxR, and EpiR cells after 4 hr glutamine withdrawal compared to glutamine-rich (4 mM) conditions, presented as relative to the basal ECAR of Control cells in the presence of glutamine. N = 5, †p<0.05 ††p<0.01 Control cells 0 mM vs 4 mM glutamine (paired Student’s t-test). All data presented as averages ± S.E.M.
Figure 5 with 1 supplement
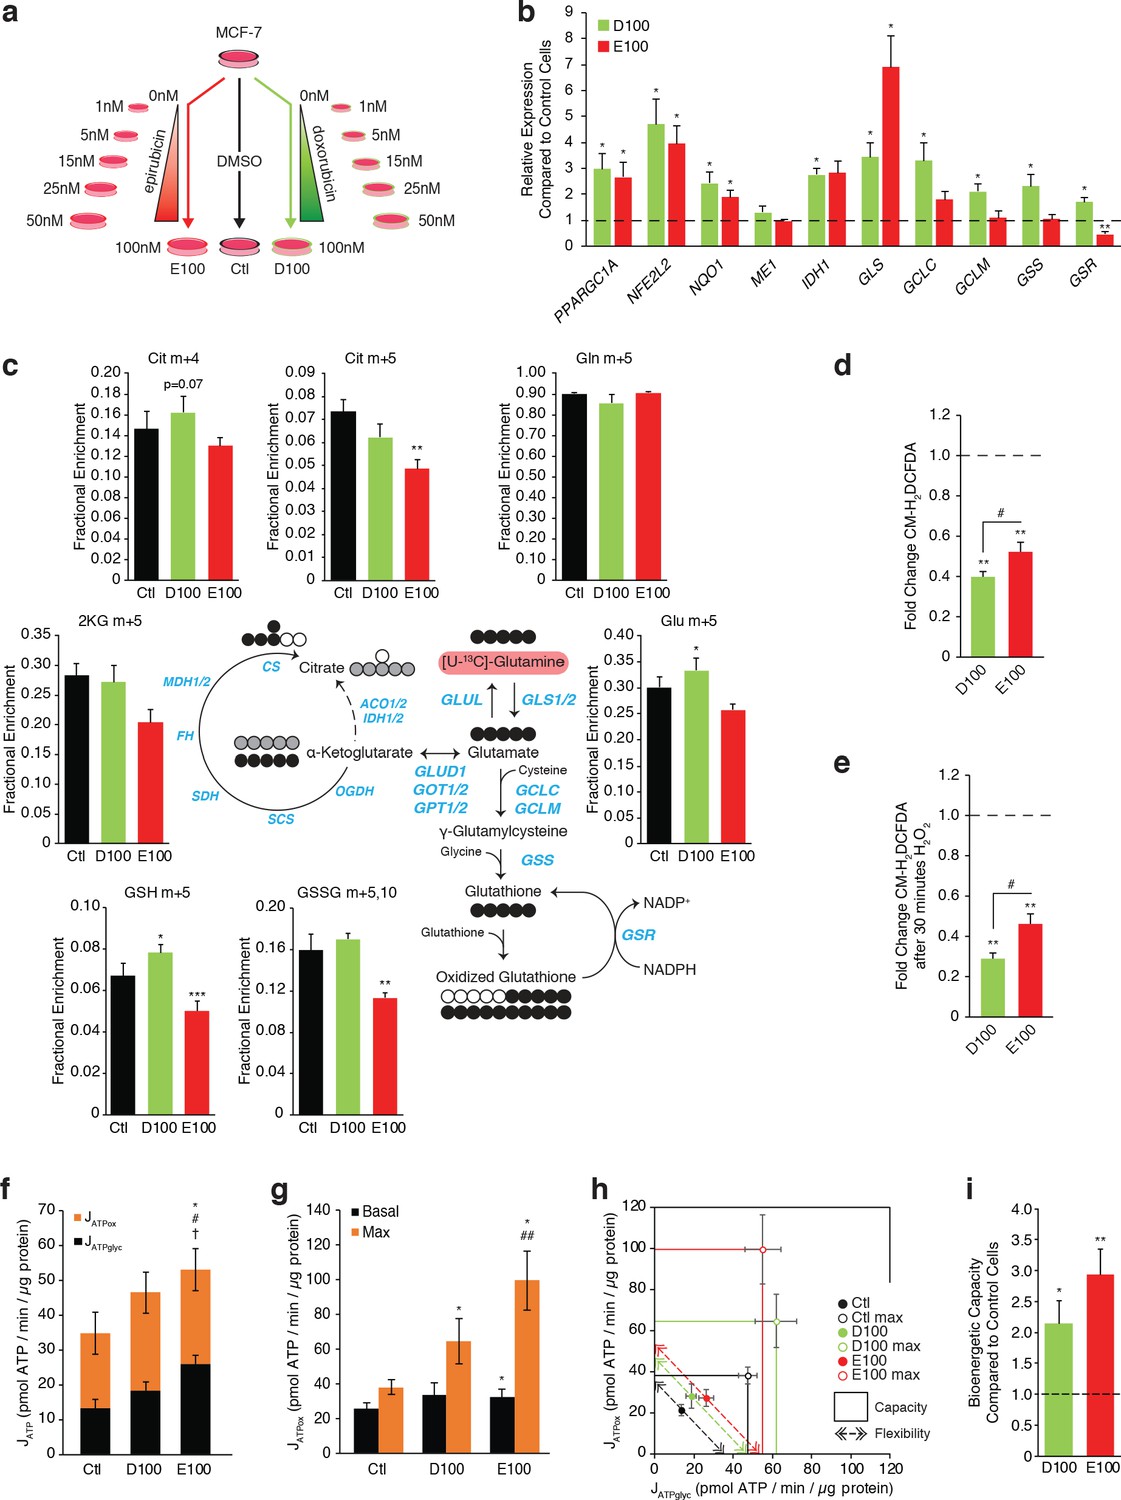
Independently derived resistant models confirm specific metabolic adaptations to doxorubicin and epirubicin.
(a) Model detailing generation of breast cancer cells resistant to increasing concentrations of anthracyclines, to a final stable extracellular concentration of 100 nM of doxorubicin (D100) or epirubicin (E100). Control cells (Ctl) were maintained in DMSO in parallel passages. (b) Relative expression of PPARGC1A and selected metabolic, glutathione, and oxidative response genes in D100 and E100 compared to Ctl. N = 3–6. *p<0.05 resistant vs Ctl cells (paired Student’s t-test). (c) [U-13C]-Glutamine tracing to glutamate and into the citric cycle (2 KG m + 5, citrate m + 4 and m + 5, malate m + 3, 2 hr tracer) or through to glutathione (GSH m + 5 and GSSG m + 5,10, 4 hr tracer) in Ctl, D100, and E100 expressed as fractional enrichment. N = 3–5, *p<0.05 **p<0.01 ***p<0.001 resistant vs Ctl cells (paired Student’s t-test). (d) Fold change of ROS signal in D100 and E100 cells compared to Ctl cells, detected by CM-H2DCFDA staining. N = 5, **p<0.01 resistant vs Control cells, #p<0.05 D100 vs E100 (paired Student’s t-test). (e) Fold change of ROS signal in D100 and E100 compared to Ctl cells, after 30 min treatment with 0.03% H2O2. N = 5, **p<0.01 resistant vs Control cells, #p<0.05 D100 vs E100 (paired Student’s t-test). (f) Quantification of ATP production (JATP) from oxidative phosphorylation (JATPox) or glycolysis (JATPglyc) in Ctl, D100, and E100. N = 5, *p<0.05 JATPox #p<0.05 JATPglyc †p<0.05 JATP, resistant vs Ctl cells (paired Student’s t-test). (g) Quantification of ATP production by OXPHOS (JATPox) in Ctl, D100 and E100 cells under basal conditions and at peak bioenergetic capacity (Max). N = 5, *p<0.05 resistant vs Ctl cells, ##p<0.01 E100 vs D100 (paired Student’s t-test). (h) Bioenergetic space plots of Ctl, D100, and E100. Solid points represent actual JATPglyc and JATPox values, hollow points represent maximums for JATPox (FCCP) and JATPglyc (rotenone, myxothiazol, monensin). Length of dotted line arrows represents flexibility of ATP production within maximum boundaries (solid lines). Area under maximum boundaries represents the bioenergetic capacity. N = 5. (i) Fold change in bioenergetic capacity of D100 and E100 compared to Ctl. N = 5 *p<0.05 **p<0.01 resistant vs Ctl cells (paired Student’s t-test). All data presented as averages ± S.E.M.
Figure 5—figure supplement 1

Supporting information for independently derived resistant models.
(a) Fractional enrichment of [U-13C]-Glutamine-labeled glutamine, glutamate, α-ketoglutarate (2KG), and citrate (2 hr tracer), as well as glutathione (GSH, GSSG, 4 hr tracer) in Ctl, D100, and E100 cells, at a single time point within the dynamic range. N = 4, *p<0.05 **p<0.01 ***p<0.001 resistant vs Ctl cells (paired Student’s t-test). (b) Quantification of oxygen consumption rate in Ctl, D100, and E100. N = 5, *p<0.05 total respiration, #p<0.05 uncoupled respiration, p=0.06 coupled respiration, resistant vs Ctl cells (paired Student’s t-test). (c) Quantification of extracellular acidification rate in Ctl, D100, and E100. N = 5, **p<0.01 resistant vs Ctl cells (paired Student’s t-test).
Figure 6

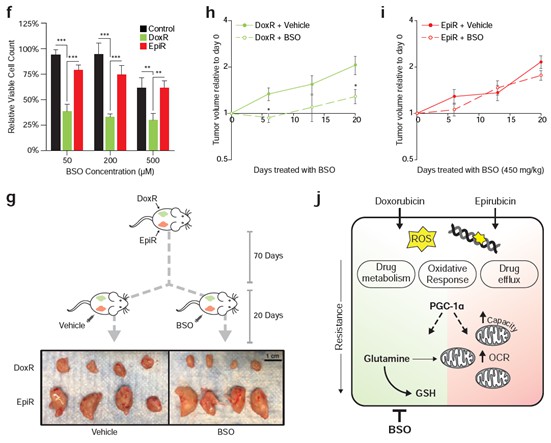
Tailored metabolic adaptations underpinning resistance to doxorubicin and epirubicin lead to primary actionable vulnerabilities in vitro and in vivo.
(a) Relative viable cell count of Control, DoxR, and EpiR cells after 3 days treatment with a combination of phenformin and their respective drug (DMSO, 98.1 nM doxorubicin, or 852 nM epirubicin). Data are shown as relative viable cell count of phenformin-treated cells compared to cells treated with vehicle (water). N = 4, *p<0.05 **p<0.01 ***p<0.001 resistant vs Control cells, #p<0.05 DoxR vs EpiR cells (paired Student’s t-test). (b) Relative viable cell count of Ctl, D100, and E100 cells after 3 days treatment with a combination of phenformin and their respective drug (DMSO, 100 nM doxorubicin, or 100 nM epirubicin). Data are shown as relative viable cell count of phenformin-treated cells compared to cells treated with vehicle (water). N = 4, **p<0.01 ***p<0.001 resistant vs Ctl cells, ***p<0.001 D100 vs E100 cells (paired Student’s t-test). (c) Relative viable cell count of Control, DoxR, and EpiR cells after 3 days treatment with a combination of buthionine sulfoximine (BSO) and their respective drug (DMSO, 98.1 nM doxorubicin, or 852 nM epirubicin) after 7 weeks of drug holiday. Data are shown as relative viable cell count of BSO-treated cells compared to cells treated with vehicle (water). N = 3, **p<0.01 ***p<0.001 resistant vs Control cells, ##p<0.01 ###p<0.001 DoxR vs EpiR cells (paired Student’s t-test). (d) Relative viable cell count of Ctl, D100, and E100 cells after 3 days treatment with a combination of BSO and their respective drug (DMSO, 100 nM doxorubicin, or 100 nM epirubicin). Data are shown as relative viable cell count of BSO-treated cells compared to cells treated with vehicle (water). N = 3, **p<0.01 resistant vs Control cells, #p<0.05 ##p<0.01 ###p<0.001 D100 vs E100 cells (paired Student’s t-test). (e) Picture of end-point DoxR and EpiR tumors after 70 days of growth in the opposing mammary fat pads of NOD Scid Gamma mice supplemented twice weekly with subcutaneous injection of 5 µg estrogen, followed by 20 days with daily intraperitoneal injection of either 450 mg/kg BSO or vehicle (PBS). (f) Volume of DoxR and EpiR tumors measured over 20 days with daily treatments of either 450 mg/kg BSO or vehicle (PBS) by intraperitoneal injection. Data are shown as tumor volume on day 0, 6, 13, and 20. N = 4–5, *p<0.05 BSO vs vehicle (two-way ANOVA, Sidak’s post-hoc test). (g) Fold change in DoxR and EpiR tumor volumes after 20 days of daily treatment with either 450 mg/kg BSO or vehicle (PBS) by intraperitoneal injection. Data are shown as fold changes for individual tumors, relative to baseline tumor volume at day 0 (dotted line). The average fold change for each condition is shown by horizontal lines. N = 4–5, *p<0.05 BSO vs vehicle (Student’s t-test). (h) Schematic of common adaptation mechanisms and distinct primary metabolic dependencies in anthracycline resistant breast cancer cells. Doxorubicin and epirubicin both induce production of reactive oxygen species (ROS) and intercalate nucleic acids and inhibit topoisomerase II, leading to double-strand DNA breaks. Both doxorubicin- and epirubicin-resistant cells engage oxidative response, drug metabolism, and drug efflux pathways to overcome these drug mechanisms, and both are dependent on expression of PGC-1α for their survival. PGC-1α-regulated pathways may further underpin distinct and context-dependent metabolic adaptations to either drug. Compared to drug-sensitive control cells, doxorubicin-resistant cells rely on glutamine for de novo glutathione (GSH) synthesis and for mitochondrial ATP production, while epirubicin-resistant cells display elevated mitochondrial content, oxygen consumption rate (OCR), and oxidative bioenergetic capacity. These distinct primary metabolic dependencies are actionable, as epiribucin-resistant cells are more sensitive to phenformin treatment than doxorubicin-resistant cells, and the latter are specifically sensitive to inhibition of glutathione synthesis by buthionine sulfoximine (BSO) both in vitro and in vivo. Unless otherwise noted, all data presented as averages ± S.E.M.
Author response image 1
Author response image 2

Venn diagrams of differential gene expression, comparing D100 vs Ctl and DoxR vs Control cells (left) and comparing E100 vs Ctl and EpiR vs Control cells (right).
Author response image 3
Tables
Appendix 1—key resources table
| Reagent type (species) or resource | Designation | Source or reference | Identifiers | Additional information |
|---|---|---|---|---|
| Cell line (H. sapiens) | MCF-7 Control, MCF-7CC | Obtained from Dr. Amadeo Parissenti Hembruff et al., 2008; DOI: 10.1186/1471-2407-8-318 | Grown in 0.1% DMSO media. Negative for mycoplasma. | |
| Cell line (H. sapiens) | MCF-7 DoxR, MCF-7DOX-2 | Obtained from Dr. Amadeo Parissenti Hembruff et al., 2008; DOI: 10.1186/1471-2407-8-318 | Resistant to 98.1 nM doxorubicin. Negative for mycoplasma. | |
| Cell line (H. sapiens) | MCF-7 EpiR, MCF-7EPI | Obtained from Dr. Amadeo Parissenti Hembruff et al., 2008; DOI: 10.1186/1471-2407-8-318 | Resistant to 852 nM epirubicin. Negative for mycoplasma. | |
| Cell line (H. sapiens) | MCF-7 Ctl | This paper | Grown in 0.1% DMSO media. Derived from MCF-7 cells obtained from the American Type Culture Collection (ATCC). Negative for mycoplasma. | |
| Cell line (H. sapiens) | MCF-7 D100 | This paper | Resistant to 100 nM doxorubicin. Derived from MCF-7 cells obtained from the American Type Culture Collection (ATCC). Negative for mycoplasma. | |
| Cell line (H. sapiens) | MCF-7 E100 | This paper | Resistant to 100 nM epirubicin. Derived from MCF-7 cells obtained from the American Type Culture Collection (ATCC). Negative for mycoplasma. | |
| Antibody | Human PGC-1α (mouse, monoclonal) | Calbiochem | Cat #: ST1202; RRID:AB_2237237 | Immunoblots, (1:1000) |
| Antibody | Human PGC-1β (rabbit, polyclonal) | Millipore | Cat #: ABC218 RRID:AB_2891214 | Immunoblots, (1:1000) |
| Antibody | Human Actin (goat, polyclonal) | Santa Cruz Biotechnology | Cat #: sc-1616 RRID:AB_630836 | Immunoblots, (1:2000) |
| Antibody | anti-mouse (goat, polyclonal) | KPL | Cat #: KP-074-1806 | Immunoblots, (1:10000) |
| Antibody | anti-rabbit (goat, polyclonal) | KPL | Cat #:KP-074-1506 | Immunoblots, (1:10000) |
| Antibody | anti-goat (donkey, polyclonal) | Abcam | Cat #: ab6881 RRID:AB_955236 | Immunoblots, (1:10000) |
| Antibody | Human Tom20 (rabbit, polyclonal) | Proteintech | Cat #:11802-1-AP RRID:AB_2207530 | Immuno-fluorescence |
| Antibody | anti-rabbit conjugated to Alexa Fluor 568 (goat, polyclonal) | Thermo Fisher Scientific | Cat #: A-11011 RRID:AB_143157 | Immuno-fluorescence |
| Antibody | Human PGC-1α (rabbit, polyclonal) | Santa Cruz Biotechnology | Cat #: sc-13067 RRID:AB_2166218 | ChIP |
| Antibody | Human ERRα (rabbit, monoclonal) | Abcam | Cat #: Ab76228 RRID:AB_1523580 | ChIP |
| transfected construct (H. sapiens) | ON-TARGETplus Non-targeting Control Pool siRNA | Dharmacon | Cat #: D-001810-10-05 | 40 nM pool of siRNA |
| transfected construct (H. sapiens) | ON-TARGETplus Human PPARGC1A siRNA | Qiagen | Cat #: FlexiTube-GeneSolutionGS10891 | Combined 40 nM pool of four siRNA |
| transfected construct (H. sapiens) | ON-TARGETplus Human PPARGC1B siRNA | Qiagen | Cat #: FlexiTube-GeneSolutionGS133522 | Combined 40 nM pool of four siRNA |
| transfected construct (H. sapiens) | FDA shRNA library | The McGill Platform for Cell Perturbation (MPCP) of the Rosalind and Morris Goodman Cancer Research Centre and Biochemistry department at McGill University | Developed by YX, GM, and SH | |
| sequence-based reagent | RT-qPCR primers | See Supplementary file 2 | ||
| sequence-based reagent | ChIP primers | See Supplementary file 3 | ||
| commercial assay or kit | Aurum Total RNA Mini Kit | Bio-Rad | ||
| commercial assay or kit | iScript cDNA Synthesis kit | Bio-Rad | ||
| commercial assay or kit | iQ SYBR Green Supermix | Bio-Rad | ||
| commercial assay or kit | BCA protein assay kit | Thermo Fisher Scientific | Cat #: PI123225 | |
| commercial assay or kit | Seahorse XFe96 Analyzer | Agilent Technologies | RRID:SCR_019545 | |
| commercial assay or kit | BioProfile 400 Analyzer | BioNova | ||
| chemical compound, drug | Doxorubicin | AbMole Biosciences | Cat #: M1969 | |
| chemical compound, drug | Epirubicin | Sigma Aldrich | Cat #: E9406 | |
| chemical compound, drug | L-buthionine-sulfoximine | Sigma Aldrich | Cat #: B2515 | |
| chemical compound, drug | Phenformin | Sigma Aldrich | Cat #: P7045 | |
| chemical compound, drug | Oligomycin | Sigma Aldrich | Cat #: O4876 | |
| chemical compound, drug | FCCP (Carbonyl cyanide 4-(trifluoromethoxy)phenylhydrazone) | Sigma Aldrich | Cat #: C2920 | |
| chemical compound, drug | Rotenone | Sigma Aldrich | Cat #: R8875 | |
| chemical compound, drug | Myxothiazol | Sigma Aldrich | Cat #: T5580 | |
| chemical compound, drug | Monensin | Sigma Aldrich | Cat #: M5273 | |
| chemical compound, drug | CM-H2DCFDA | Thermo Fisher Scientific | Cat #: C6827 | |
| chemical compound, drug | Clarity ECL | Bio-Rad | Cat #: 1705060 | |
| chemical compound, drug | HCS CellMask Green stain | Thermo Fisher Scientific | Cat #: H32714 | |
| chemical compound, drug | Lipofectamine RNAiMax | Thermo Fisher Scientific | Cat #: 13778-50 | |
| chemical compound, drug | ProLong Glass Antifade Mountant | Thermo Fisher Scientific | Cat #: P36982 | |
| software, algorithm | Autoquant X2 software | MediaCybernetics | RRID:SCR_002465 | |
| software, algorithm | Imaris v8 | Bitplane | RRID:SCR_007370 | |
| software, algorithm | GraphPad Prism | GraphPad Software, Inc | RRID:SCR_002798 | |
| software, algorithm | Microsoft Excel | Microsoft Corporation | RRID:SCR_016137 | |
| software, algorithm | R Project for Statistical Computing | R Foundation for Statistical Computing, (R Development Core Team, 2019) | RRID:SCR_001905 | |
| software, algorithm | R Bioconductor | DOI:10.1186/gb-2004-5-10-r80 | RRID:SCR_006442 | |
| software, algorithm | Shiny GAM | https://artyomovlab.wustl.edu/shiny/gam/ Sergushichev et al., 2016; DOI:10.1093/nar/gkw266 | ||
| software, algorithm | Cytoscape | Shannon et al., 2003; DOI:10.1101/gr.1239303 | RRID:SCR_003032 | |
| software, algorithm | In-house algorithm for isotopic corrections | In-house algorithm of the St-Pierre laboratory, first described in McGuirk et al., 2013; DOI:10.1186/2049-3002-1-22 | Developed by SM | |
| software, algorithm | Masshunter Quantitative Analysis software | Agilent Technologies | RRID:SCR_015040 | |
| software, algorithm | Chemstation software | Agilent Technologies | RRID:SCR_015742 | |
| software, algorithm | Transcriptome Analysis Console | Affymetrix | RRID:SCR_016519 | |
| software, algorithm | Gene Set Enrichment Analysis | Mootha et al., 2003; Subramanian et al., 2005; DOI:10.1038/ng1180, 10.1073/pnas.0506580102 | RRID:SCR_003199 | |
| software, algorithm | Gene Expression Omnibus | NCBI Edgar et al., 2002; DOI:10.1093/nar/30.1.207 | RRID:SCR_005012 | |
| software, algorithm | MAGeCK (v0.5.5) | Li et al., 2014; DOI:10.1186/s13059-014-0554-4 | ||
| other | GEO patient dataset | GSE43816 Gruosso et al., 2016; DOI:10.15252/emmm.201505891 | Gene expression of human breast cancer tumors biopsies prior to and after treatment with four cycles of epirubicin and cyclophosphamide, followed by four cycles of docetaxel | |
| other | GEO cell line dataset | GSE125187; this paper | Gene expression of Control, DoxR, and EpiR cells |
Additional files
-
Supplementary file 1
PGC-1α supports therapeutic resistance across several cancer types.
- https://cdn.elifesciences.org/articles/65150/elife-65150-supp1-v1.docx
-
Supplementary file 2
List of primer sequences for RT-qPCR.
- https://cdn.elifesciences.org/articles/65150/elife-65150-supp2-v1.docx
-
Supplementary file 3
List of primer sequences for ChIP.
- https://cdn.elifesciences.org/articles/65150/elife-65150-supp3-v1.docx
-
Transparent reporting form
- https://cdn.elifesciences.org/articles/65150/elife-65150-transrepform-v1.docx
Download links
A two-part list of links to download the article, or parts of the article, in various formats.
Downloads (link to download the article as PDF)
Open citations (links to open the citations from this article in various online reference manager services)
Cite this article (links to download the citations from this article in formats compatible with various reference manager tools)
Resistance to different anthracycline chemotherapeutics elicits distinct and actionable primary metabolic dependencies in breast cancer
eLife 10:e65150.
https://doi.org/10.7554/eLife.65150


