An oomycete effector subverts host vesicle trafficking to channel starvation-induced autophagy to the pathogen interface
- Imperial College London, United Kingdom
- Sainsbury Laboratory Cambridge University (SLCU), United Kingdom
- Gregor Mendel Institute (GMI), Austrian Academy of Sciences, Vienna BioCenter (VBC), Austria
- INGEBI-CONICET, Ciudad Autonoma de Buenos Aires, Argentina
- The Sainsbury Laboratory, University of East Anglia, United Kingdom
Figures
Figure 1
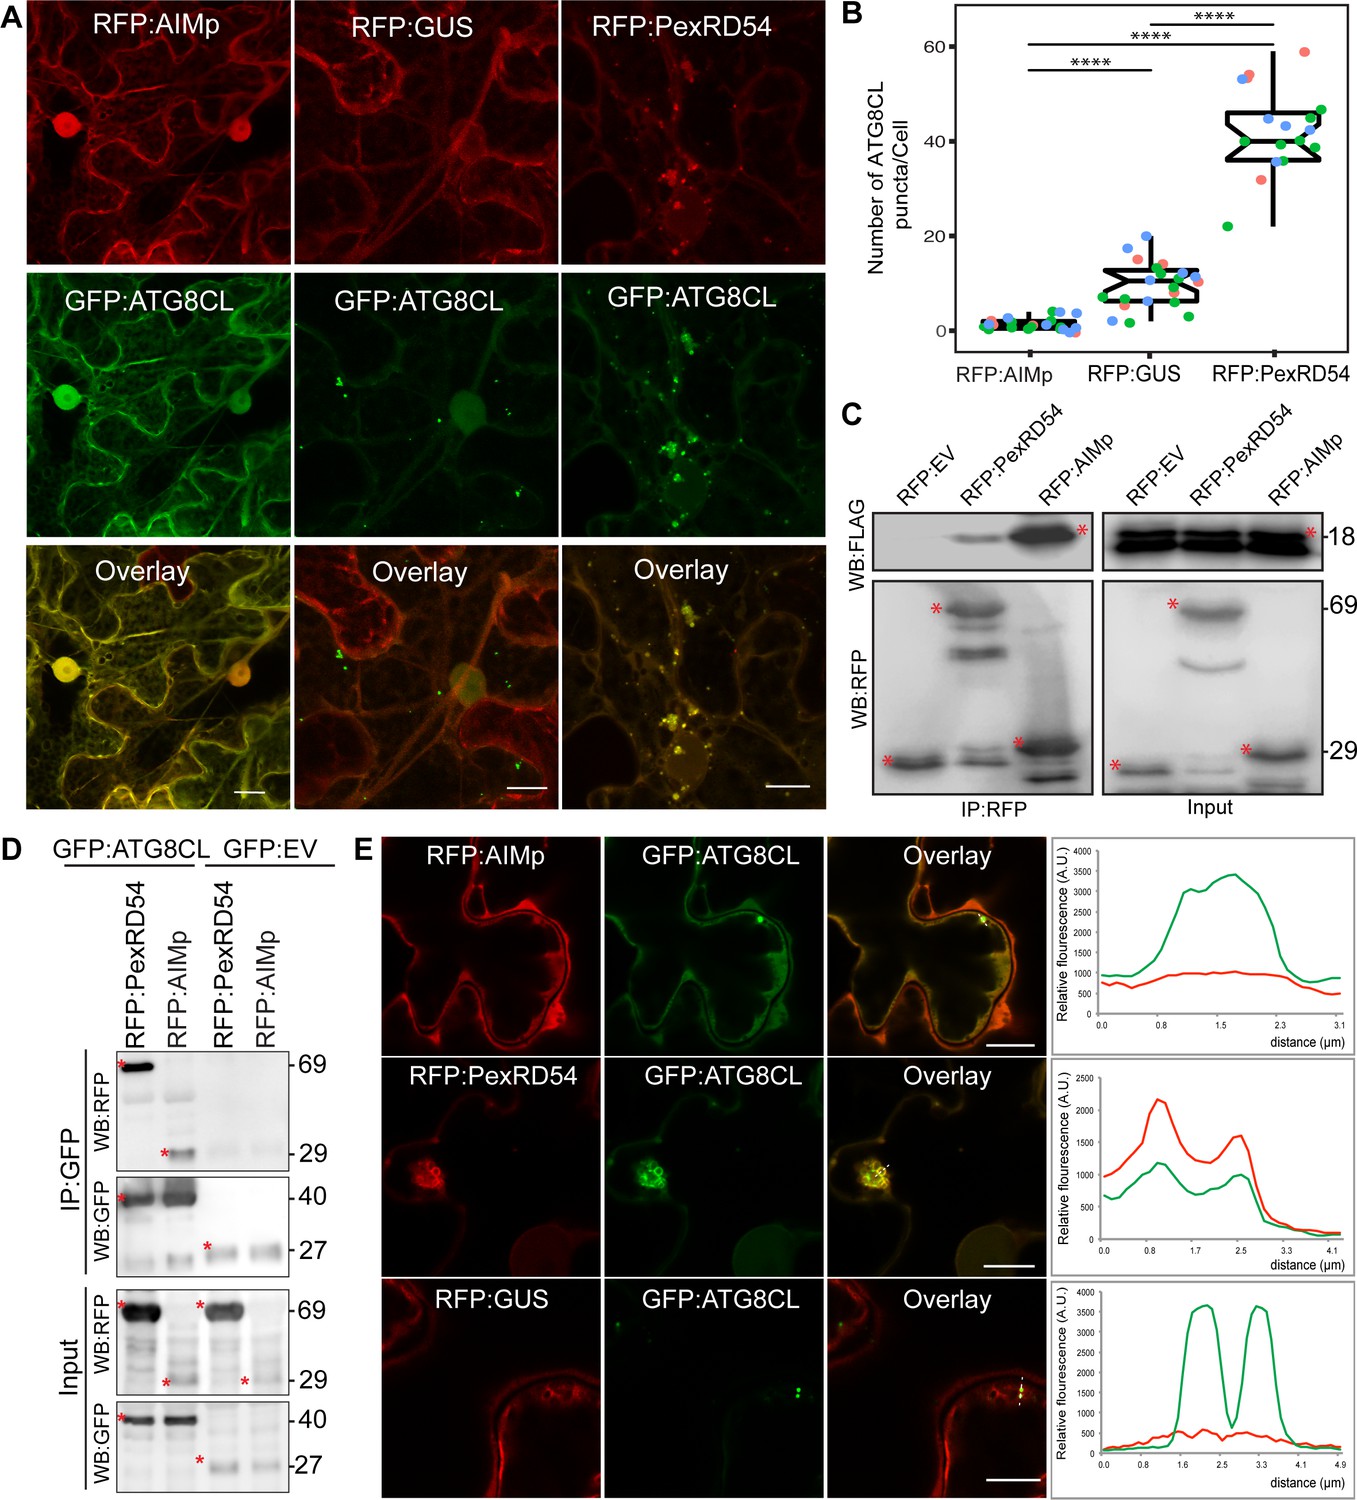
The AIM peptide of PexRD54 is not sufficient for stimulation of autophagosome formation.
(A) Confocal micrographs of Nicotiana benthamiana leaf epidermal cells transiently expressing either RFP:AIMp (left), RFP:PexRD54 (middle), or RFP:GUS (right), with GFP:ATG8CL. Scale bars = 10 µm. Images shown are maximal projections of 26 frames with 1 μm steps (B) Quantification of autophagosome numbers from A shows RFP:PexRD54 expression increases ATG8CL autophagosomes per cell (40, N = 19 images quantified) compared to RFP:GUS control (10, N = 22 images quantified), while RFP:AIMp significantly decreases ATG8CL autophagosome numbers (2, N = 23 images quantified). Scattered points show individual data points, color indicates biological repeats. Statistical differences were analyzed by Student t-test in R. Measurements were significant when p<0.05 (*) and highly significant when p<0.0001(****). (C) In planta co-immunoprecipitation between ATG8CL and PexRD54, AIMp or an Empty vector (EV). FLAG:ATG8CL was transiently co-expressed with either RFP:PexRD54, RFP:AIMp, or RFP:EV. IPs were obtained with anti-RFP antiserum. (D) Reverse pull-down between ATG8CL and PexRD54, AIMp, or GFP:EV. IPs were obtained with anti-GFP antiserum. (C– D) Red asterisks indicate expected band sizes. Protein sizes in kDa. (E) Confocal micrographs of RFP:AIMp (top), RFP:PexRD54 (middle), or RFP:GUS (bottom), co-expressed with GFP:ATG8CL. Transects in overlay panel correspond to plot of relative fluorescence over the labeled distance. RFP:PexRD54 co-localizes in discrete puncta with GFP:ATG8CL while RFP:AIMp and RFP:GUS fluorescence signals do not peak at GFP:ATG8CL puncta. Images shown are maximal projections of 12 frames with 1 μm steps. Scale bars represent 10 μm.
-
Figure 1—source data 1
Source data for western blots and autophagosome counts.
The ZIP archive contains full sized immune blots and data sheet values for autophagosome quantification.
- https://cdn.elifesciences.org/articles/65285/elife-65285-fig1-data1-v2.zip
Figure 2 with 7 supplements
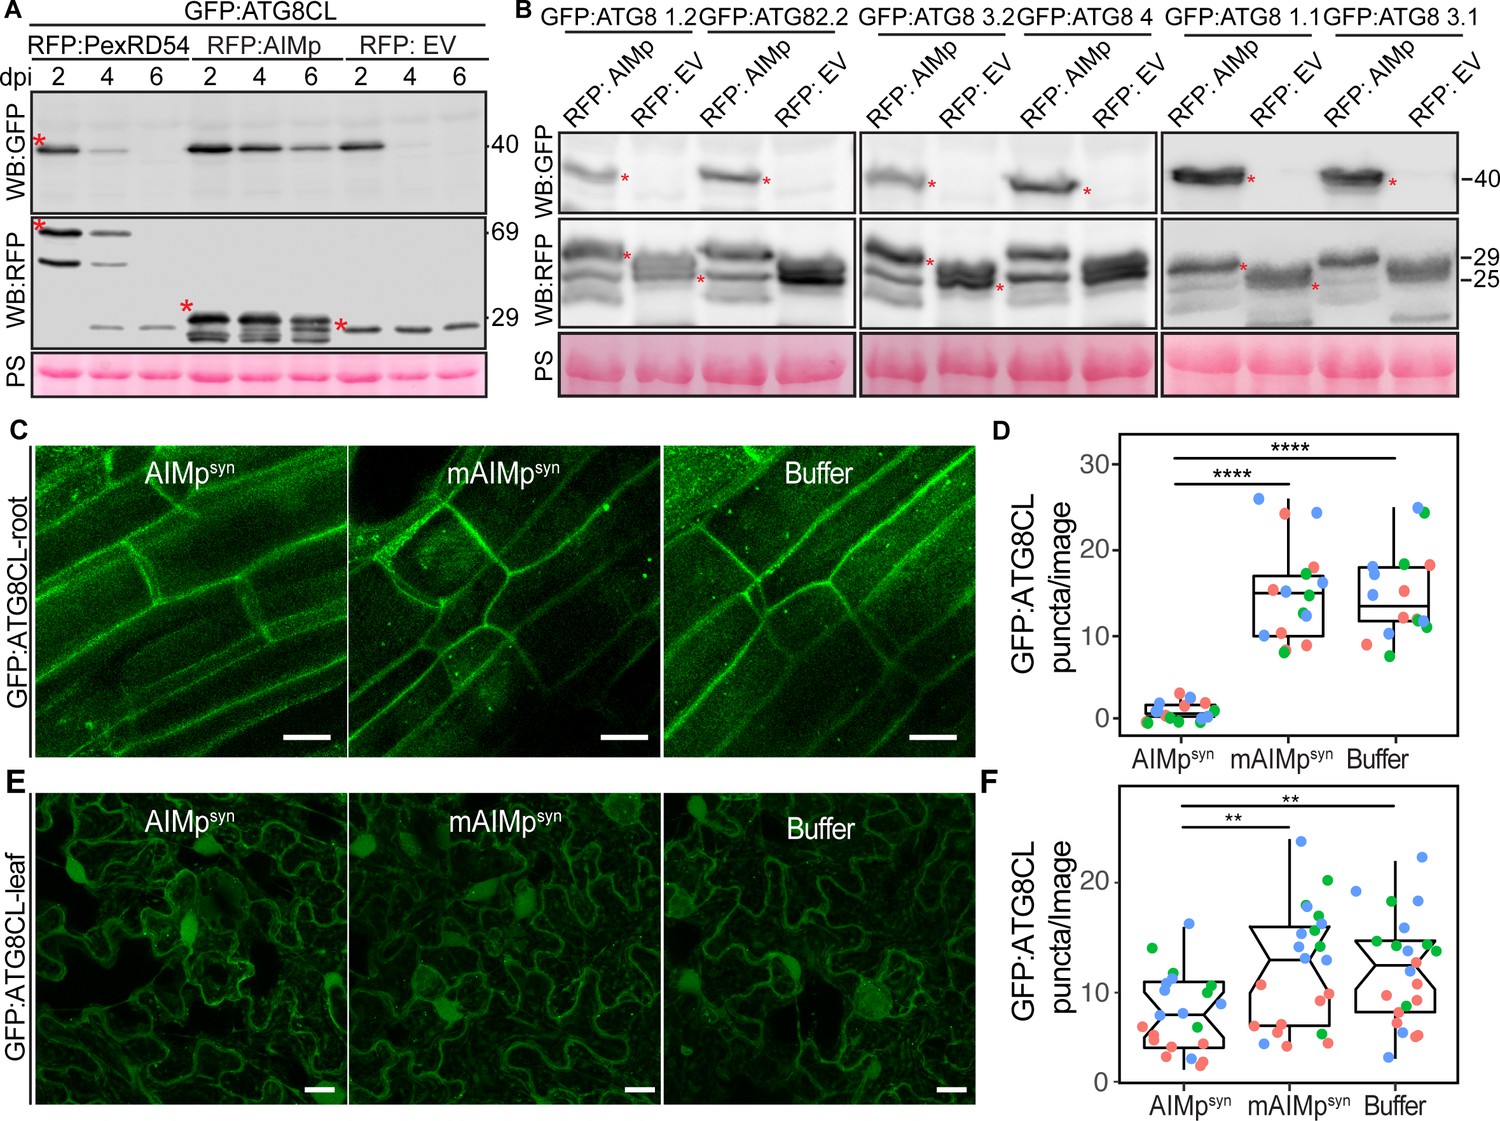
The AIM peptide supresses autophagy flux.
(A) Western blots show depletion of GFP:ATG8CL is substantially reduced by RFP:AIMp compared to RFP:PexRD54 and RFP:GUS control beyond 2 days post infiltration. (B) Western blots show various Agrobacterium expressed GFP:ATG8 isoforms is stabilized by RFP:AIMp. Total protein extracts were prepared 4 days post Agroinfiltration. Red asterisks in A-B show expected band sizes. Protein sizes in kDa. (C) Confocal micrographs of transgenic N. benthamiana root cells stably expressing GFP-ATG8CL infiltrated with cell penetrating peptides or buffer. Images shown are maximal projections of 10 frames with 1 μm steps. (D) Compared to a buffer control (15, N = 16 images quantified), synthesized AIM peptide fused to a cell penetrating peptide (AIMpsyn) suppresses ATG8CL autophagosomes per image in roots (1, N = 18 images quantified), while the AIM peptide mutant mAIMpsynAA does not (15, N = 17 images quantified). Statistical differences were analyzed by Student t-test in R. Measurements were significant when p<0.05 (*) and highly significant when p<0.0001(****). (E) Transgenic N. benthamiana leaf epidermal cells stably expressing GFP-ATG8CL infiltrated with cell penetrating peptides or buffer. Images shown are maximal projections of 25 frames with 1 μm steps. Scale bars represent 10 μm. (F) Scatter-boxplot shows exogenous application of cell penetrating AIMpsyn in GFP-ATG8CL transgenic N. benthamiana significantly decreases the number of ATG8 puncta per image (8, N = 21 images quantified) compared to cell penetrating mAIMsynAA (12, N = 22 images quantified), or Buffer control (12, N = 22 images quantified). Scattered points show individual data points, color indicates biological repeat. Statistical differences were analyzed by Students t-test in R. Measurements were significant when p<0.05 (*) and highly significant when p<0.0001(****).
-
Figure 2—source data 1
Source data for western blots and autophagosome counts.
The ZIP archive contains full sized immune blots and data sheet values for autophagosome quantification.
- https://cdn.elifesciences.org/articles/65285/elife-65285-fig2-data1-v2.zip
Figure 2—figure supplement 1
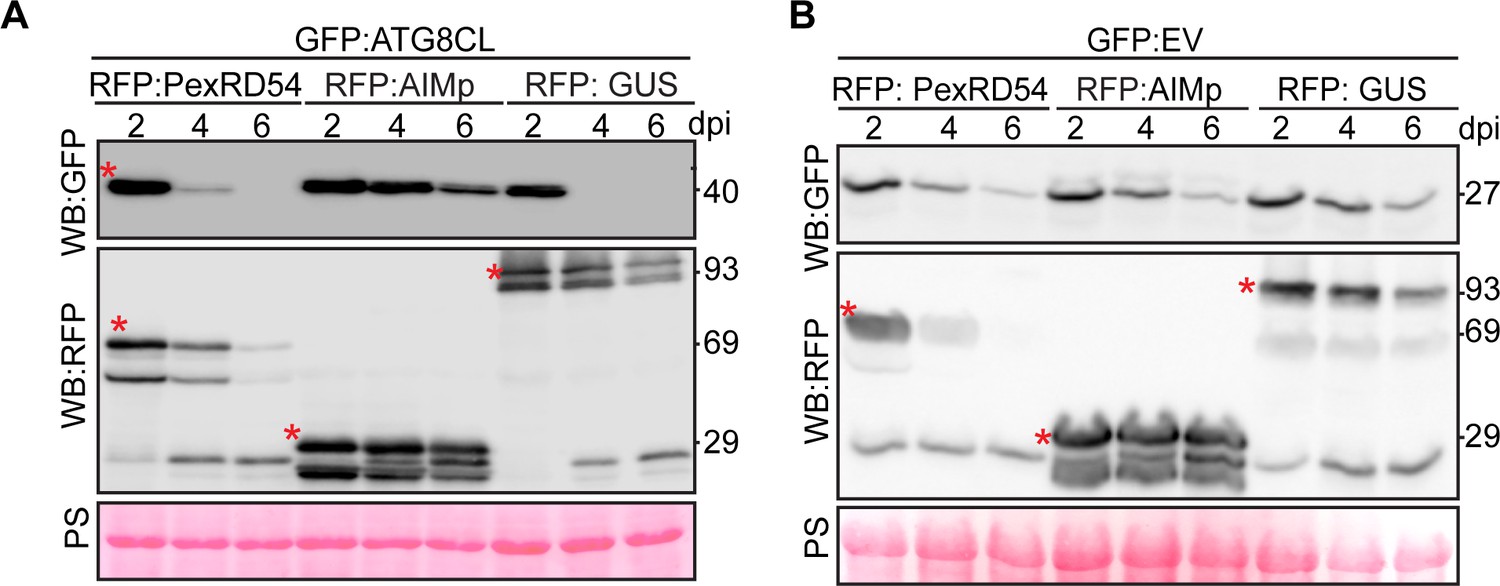
AIMp stabilizes ATG8CL but not GFP.
(A) Western blots show depletion of GFP:ATG8CL is substantially reduced by RFP:AIMp compared to RFP:PexRD54 and RFP:GUS control beyond 2 days post Agrobacterium-mediated expression. (B) Empty vector for the free GFP control GFP:EV is not stabilized by co-expression with RFP:PexRD54, RFP:AIMp, or RFP:GUS. Total protein extracts were isolated 2, 4, and 6 days after infiltration and immunoblotted. Red asterisks indicate expected band sizes. Protein sizes in kDa.
Figure 2—figure supplement 2
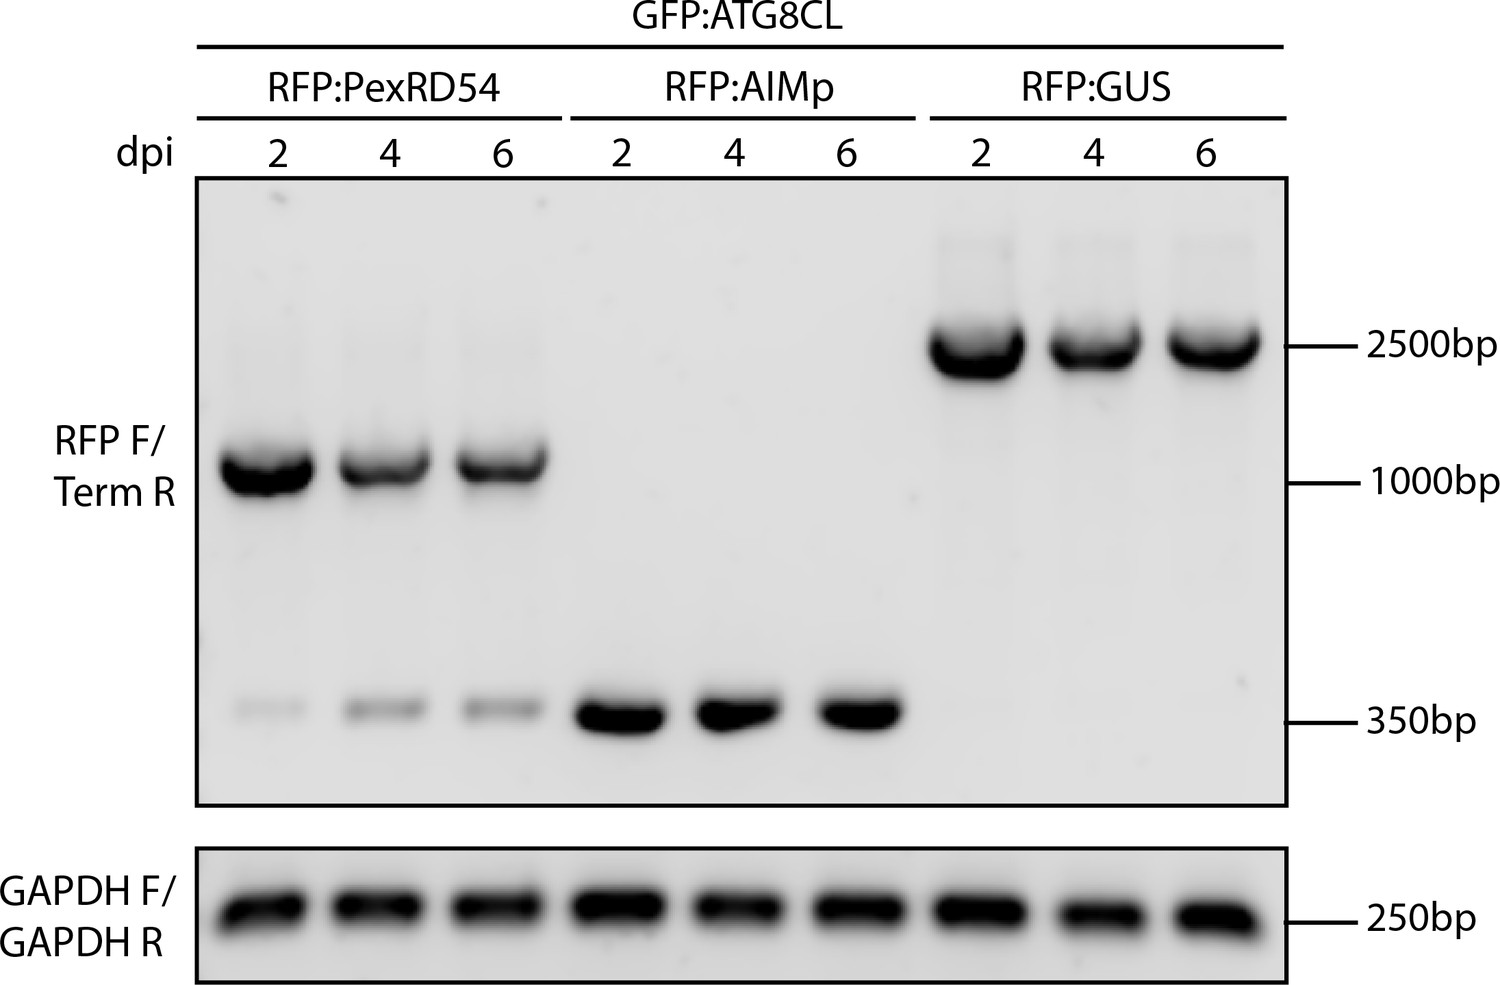
RT-PCR shows expression of RFP constructs.
RNA was extracted at 2, 4, and 6 dpi from the N. benthamiana leaves expressing RFP:PexRD54, RFP:AIMp, or RFP:GUS. RT-PCR was performed using primers that amplify 5’ RFP and 3’ UTR regions of the RFP constructs using RFP F_/ Term_R and GAPDH_F/GAPDH_R primer combinations listed in Table 1.
Figure 2—figure supplement 3
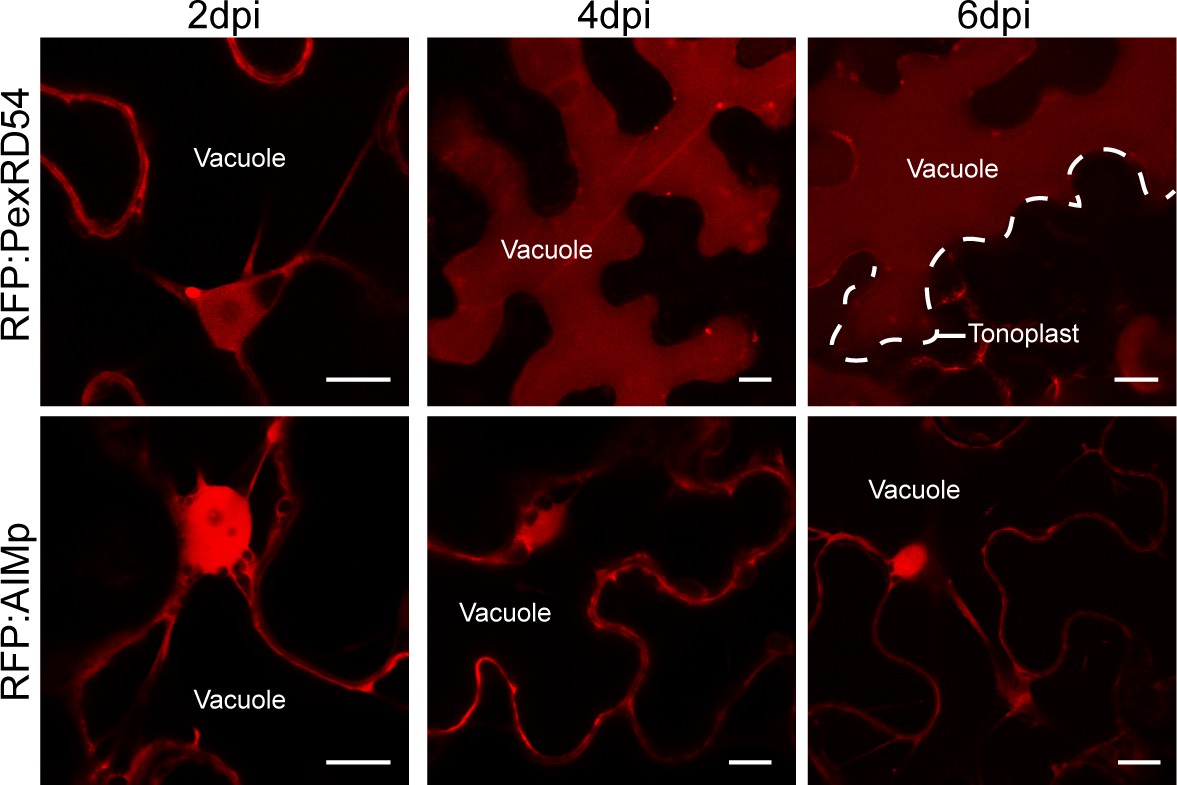
PexRD54 is trafficked to the vacuole while AIMp remains cytoplasmic.
Single plane confocal micrographs of N. benthamiana leaf epidermal cells expressing RFP:RD54 or RFP:AIMp at 2, 4, and 6 dpi. Scale bars represent 10 μm.
Figure 2—figure supplement 4
AIM peptide mutant does not stabilize ATG8CL.
Western blot shows depletion of GFP:ATG8CL is substantially reduced by RFP:AIMp but not with mutant RFP:mAIMpAA(WEIV to AEIA) and RFP:EV control 3 days post agroinfiltration. Red asterisks indicate expected band sizes. Protein sizes in kDa.
Figure 2—figure supplement 5
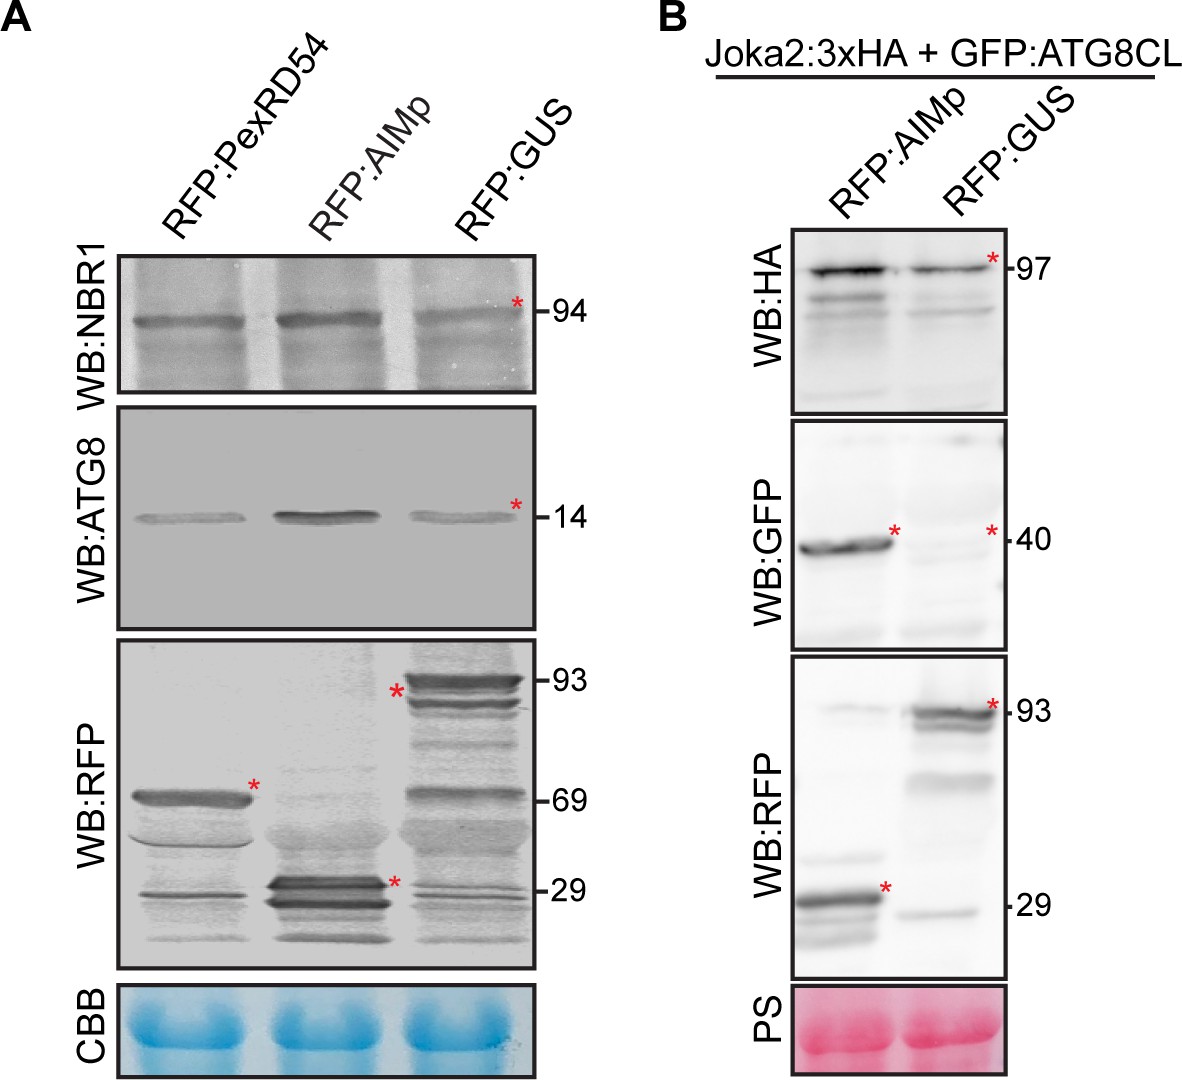
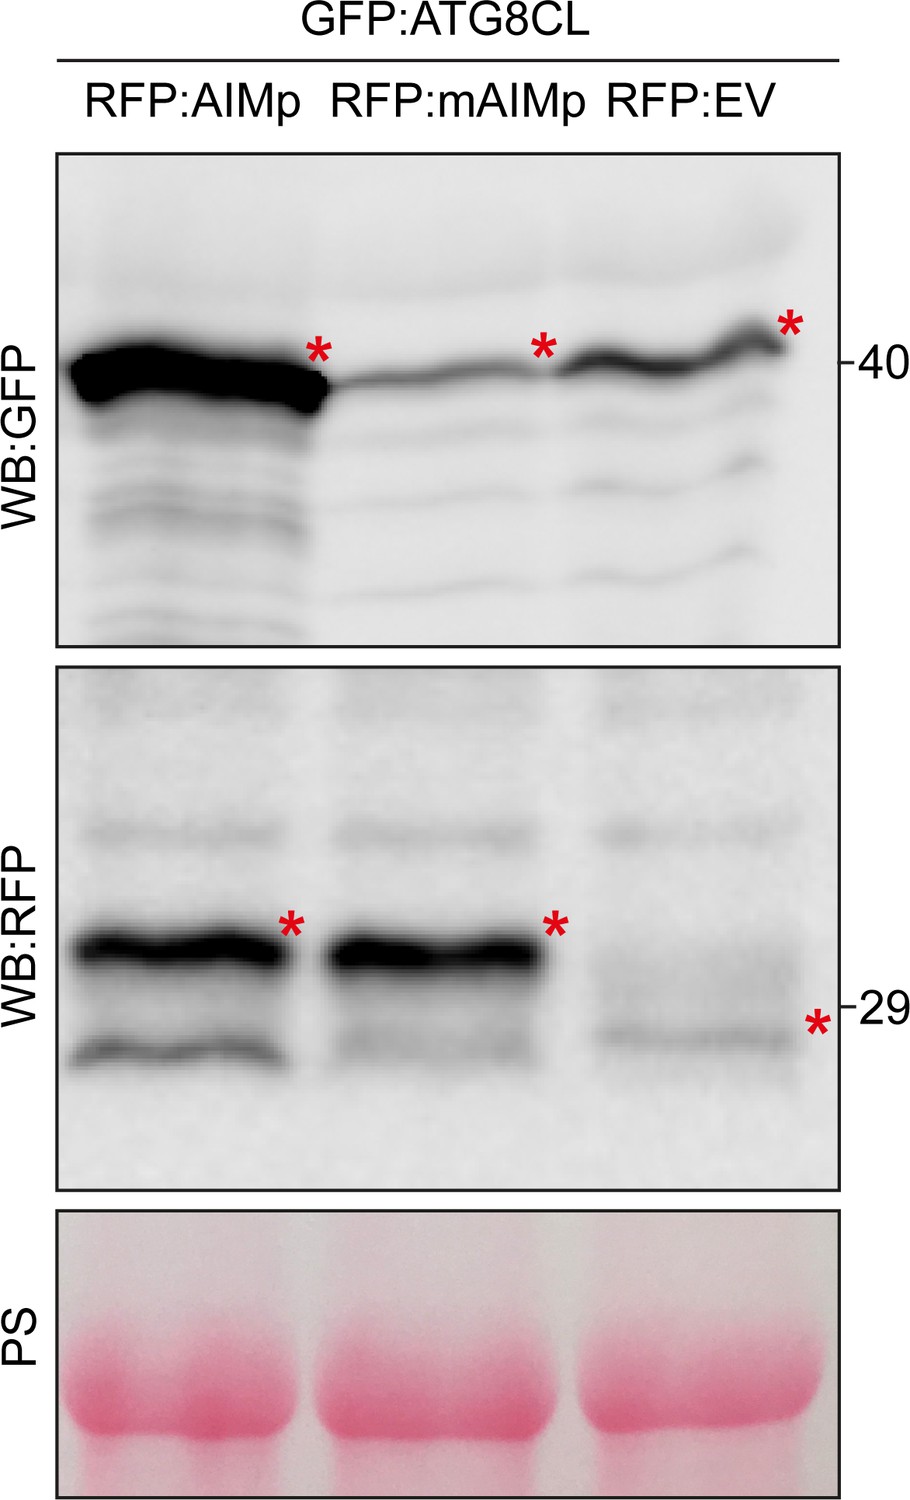
AIMp stabilizes both endogenous and transiently expressed NBR1/Joka2 and ATG8(s).
(A) RFP:AIMp stabilizes endogenous NBR1/Joka2 and ATG8(s), whereas PexRD54 has a milder effect on NBR1/Joka2 stabilization but no apparent effect on ATG8(s) compared to RFP:GUS control. (B) AIMp stabilizes transiently expressed Joka2:3xHA and GFP:ATG8CL using constitutive 35S promoter. RFP:GUS is used as a negative control for RFP:AIMp (A–B) Total protein extracts were isolated 3 days after infiltration and immunoblotted. Red asterisks indicate expected band sizes. Protein sizes in kDa.
Figure 2—figure supplement 6
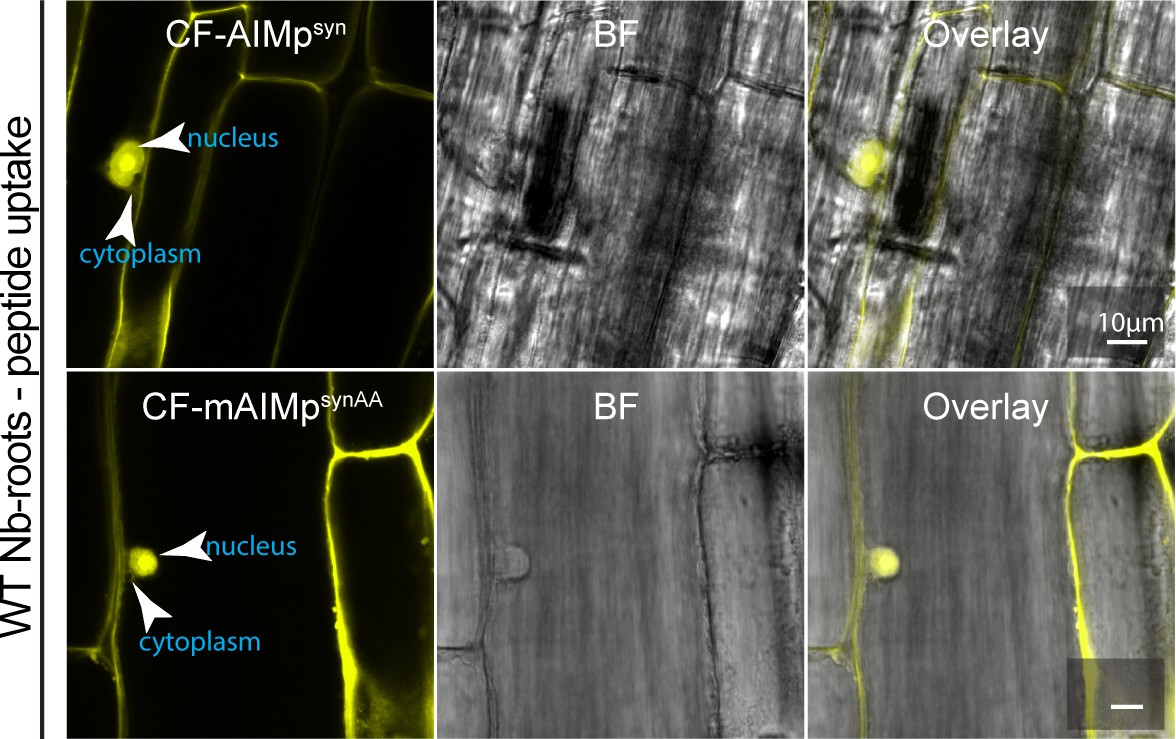
Cell penetrating AIM peptide constructs are uptaken in roots.
Maximum projection confocal micrographs of N. benthamiana root epidermal cells exogenously supplied with either CF-AIMpsyn (top) or CF-mAIMpsyn (bottom). Both AIMp and its mutant form are translocated well by the roots into the cytoplasm and diffuse into the nucleus. CF = 5-Carboxyfluorescein. Scale bars represent 10 μm.
Figure 2—figure supplement 7
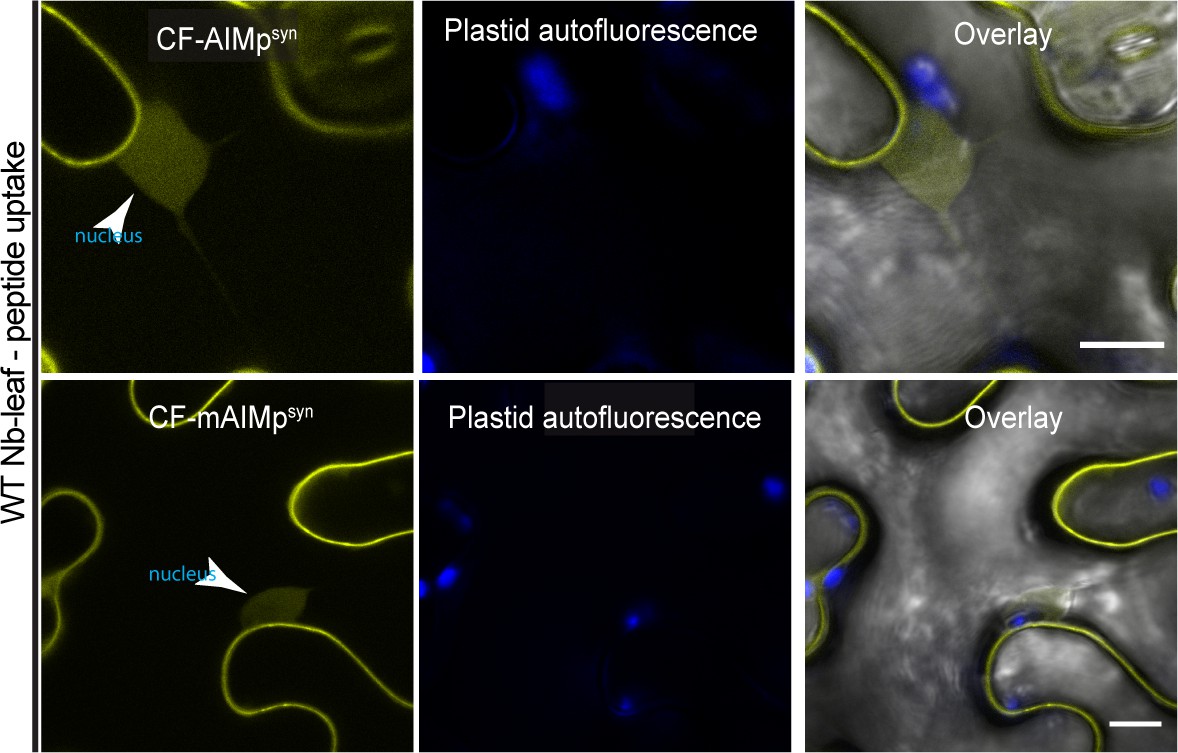
Cell penetrating AIM peptides translocate inside leaf cells.
Single-plane confocal micrographs of WT N. benthamiana exogenously supplied with 5-Carboxyfluorescein (CF) tagged versions of AIMsyn and mAIMsyn, showing peptide translocation into the nucelocytoplasm of leaf epidermal cells. Scale bars, 10 µm.
Figure 3 with 5 supplements
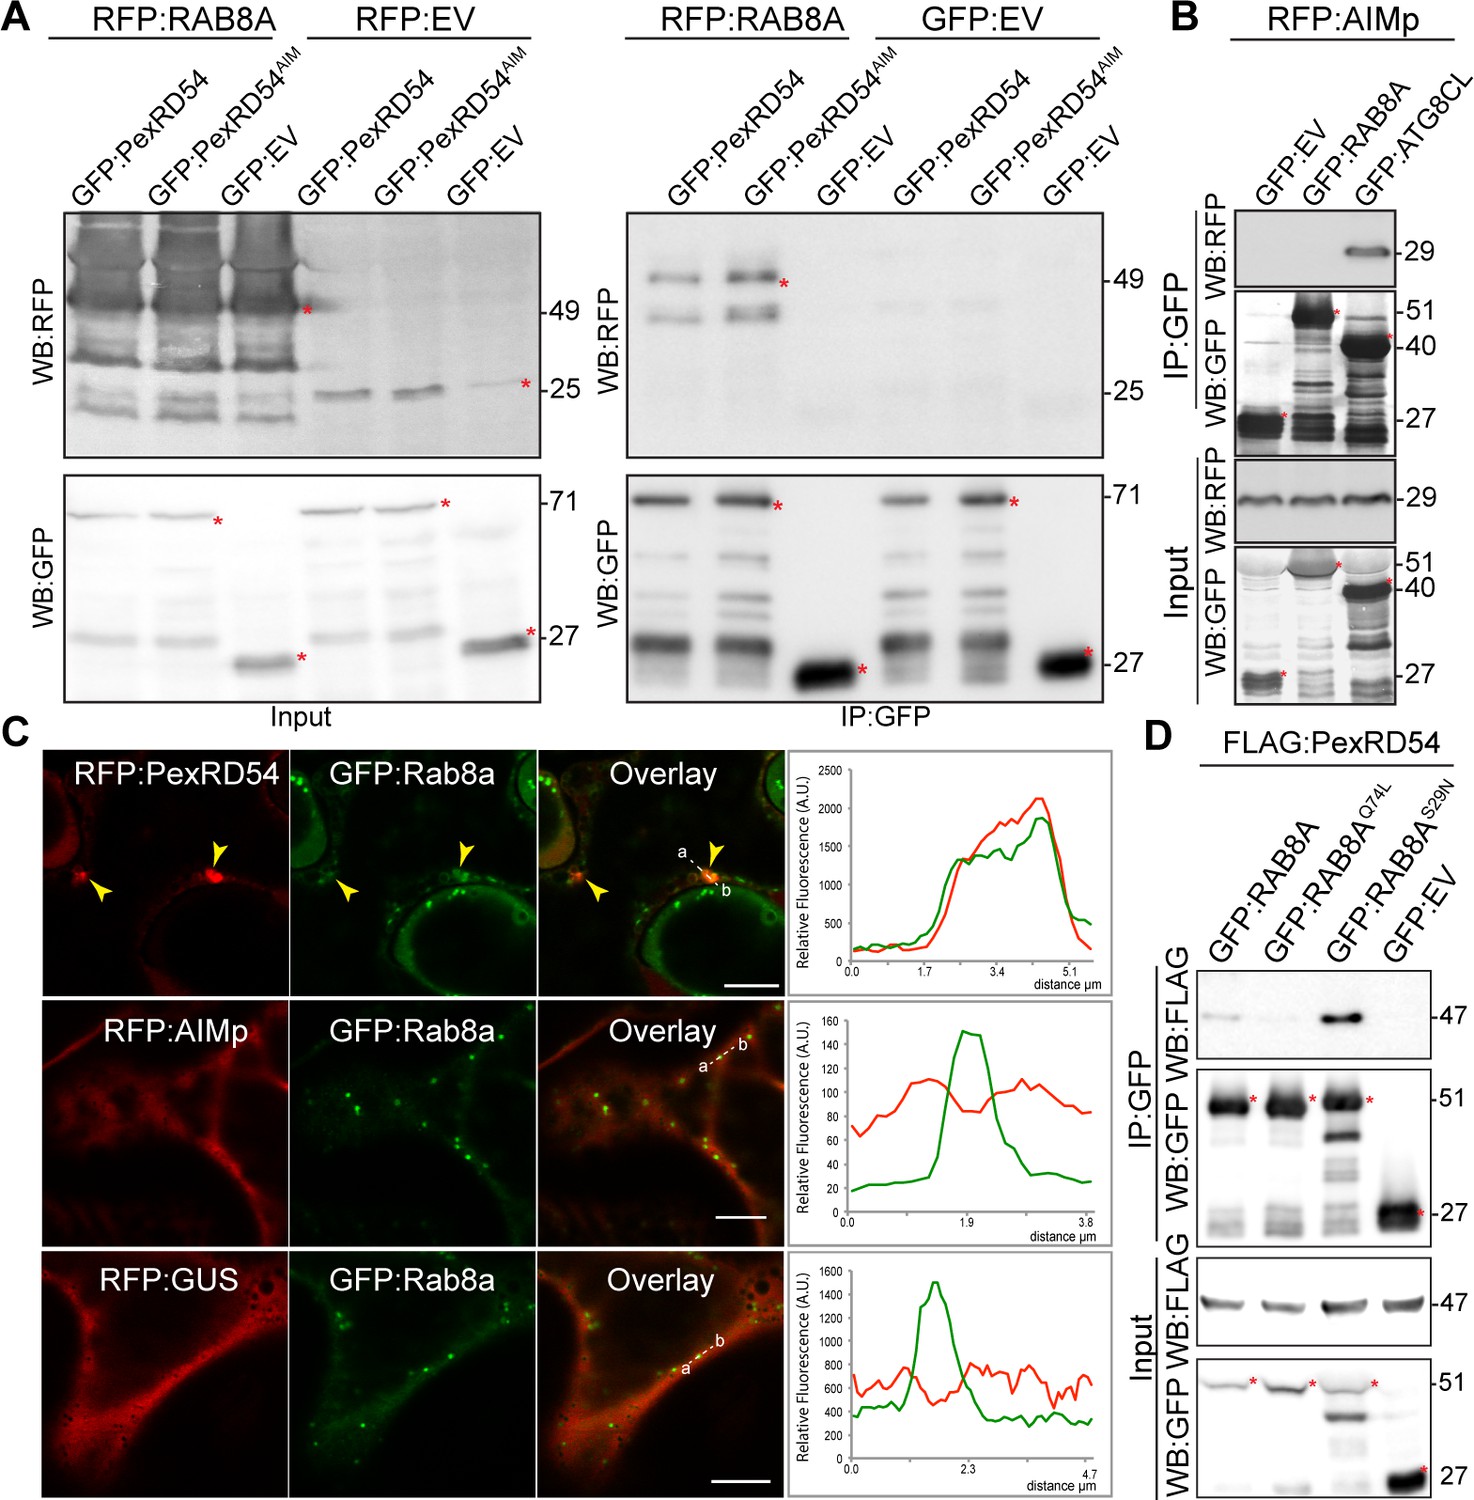
PexRD54 associates with the host vesicle transport regulator Rab8a independently of its ATG8CL binding.
(A) In planta co-immunoprecipitation between Rab8a and PexRD54 or PexRD54AIM. RFP:Rab8a was transiently co-expressed with either GFP:EV, GFP:PexRD54 or GFP:PexRD54AIM. Red asterisks indicate expected band sizes. (B) In planta co-immunoprecipitation between the AIMp and ATG8CL or Rab8a. RFP:AIMp was transiently co-expressed with either GFP:EV, GFP:ATG8CL, or GFP:Rab8a. IPs were obtained with anti-GFP antiserum. Total protein extracts were immunoblotted. Red asterisks indicate expected band sizes. (C) Confocal micrographs of N. benthamiana leaf epidermal cells transiently expressing either RFP:PexRD54 (top), RFP:AIMp (middle), or RFP:GUS (bottom), with GFP:Rab8a. Yellow arrows show colocalization between constructs. Transects in overlay panel correspond to plot of relative fluorescence over the labeled distance. RFP:PexRD54 co-localizes in discrete punctate structures with GFP:Rab8a while RFP:AIMp and RFP:GUS show diffuse expression. Scale bars, 5 µm (D).
-
Figure 3—source data 1
Source data for western blots, Rab8a/mutant sequences, autophagosome counts, and localization data sheets.
The ZIP archive contains full sized immune blots, Rab8a wt and mutant sequences, and data sheet values for autophagosome quantification and colocalization assays.
- https://cdn.elifesciences.org/articles/65285/elife-65285-fig3-data1-v2.zip
Figure 3—figure supplement 1
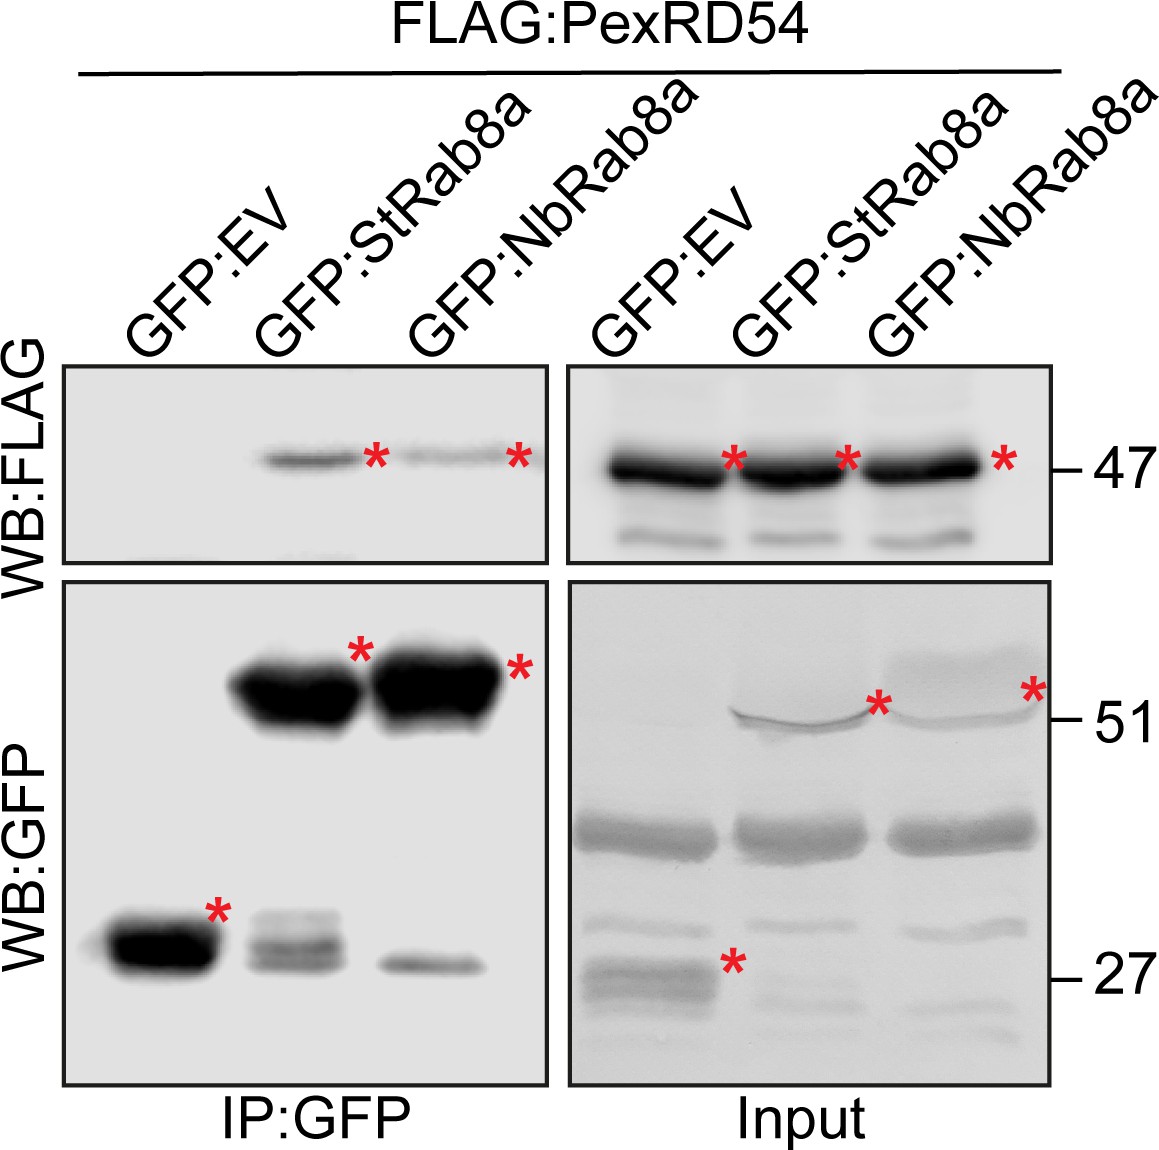
PexRD54 interacts with NbRab8a.
In planta co-immunoprecipitation between PexRD54 and GFP:NbRab8a, GFP:StRab8a or an GFP Empty vector (GFP:EV). FLAG:PexRD54 was transiently co-expressed with either GFP:NbRab8a, GFP:StRab8a or an GFP:EV for 3 days. IPs were obtained with anti-GFP antiserum. Red asterisks indicate expected band sizes. Protein sizes in kDa.
Figure 3—figure supplement 2
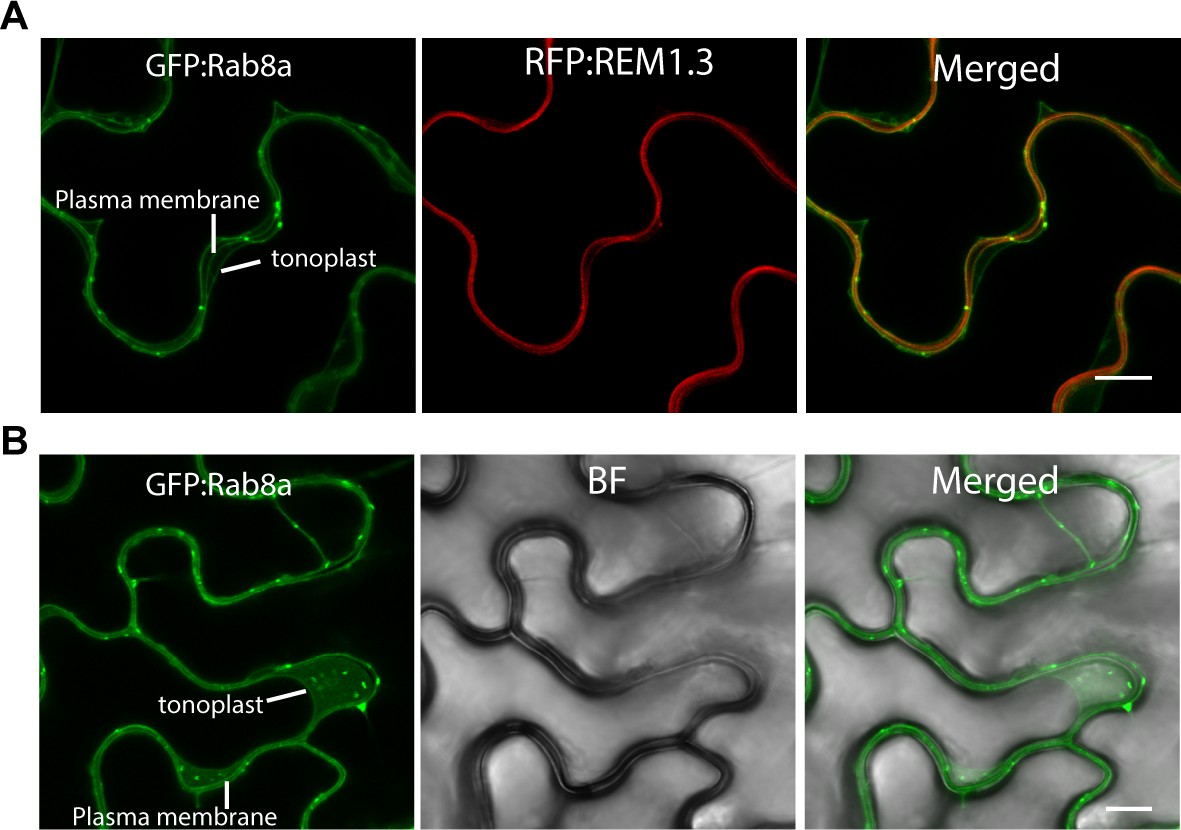
Rab8a localizes to the tonoplast, plasma membrane, and punctate structures.
Single-plane confocal micrographs of N. benthamiana leaf epidermal cells transiently expressing either GFP:Rab8a with the plasma membrane marker RFP:REM1.3 (A) or GFP:Rab8a alone (B). (A-B) Rab8a localizes in discrete puncta as well as in the plasma membrane with RFP:REM1.3 and in the tonoplast. Images shown are maximal projections of 15 frames with 1 μm steps. Scale bars represent 10 μm.
Figure 3—figure supplement 3
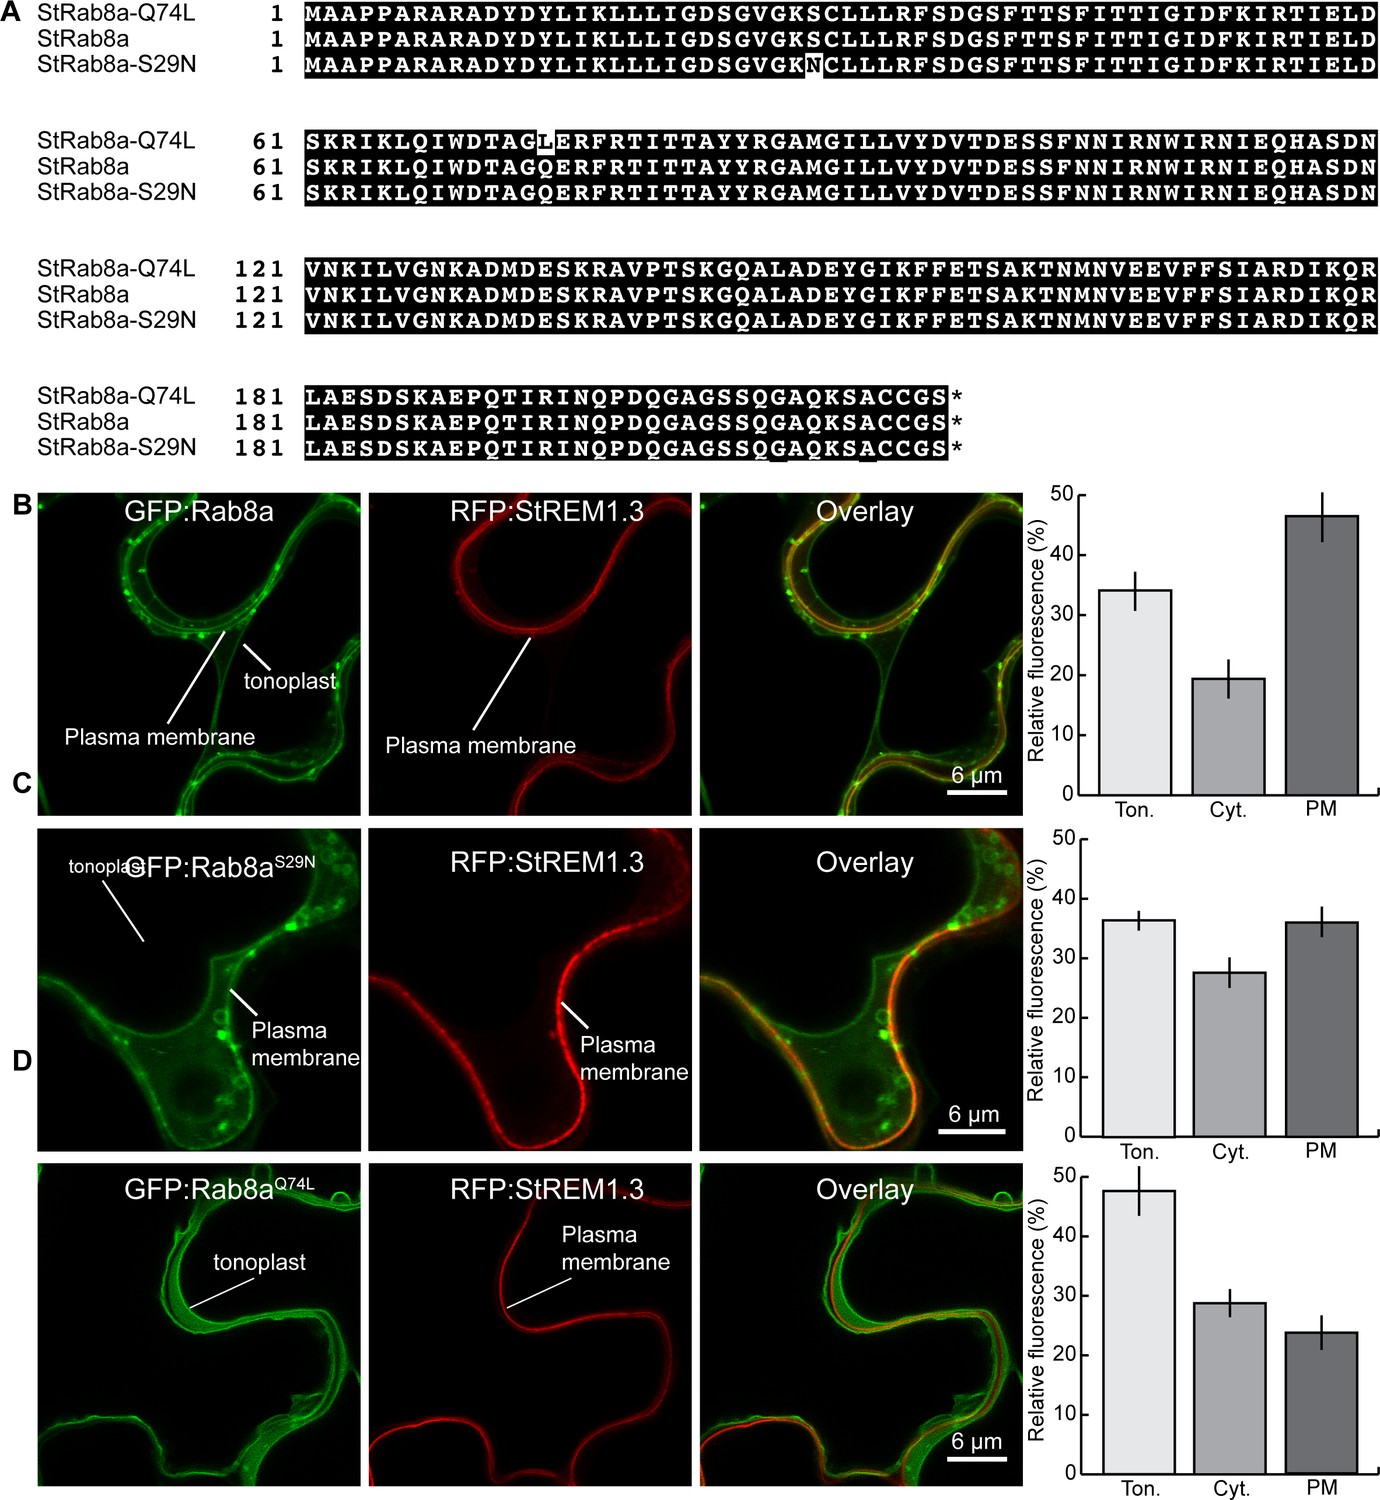
Subcellular distribution of Rab8a and its mutants.
(A) Amino acid sequences of S. tuberosum Rab8aQ74L (top), wild type Rab8a (middle) and Rab8aS29N (bottom) proteins. (B–D) Maximum projection confocal micrographs of N. benthamiana leaf epidermal cells transiently expressing GFP:Rab8a (top), Rab8aS29N (middle), and Rab8aQ74L (bottom), with plasma membrane marker RFP:REM1.3 (N=22 images are quantified per panel with one biological replicate). Transects in overlay panel correspond to plot of relative fluorescence over the labeled distance. Images shown are maximal projections of 20 frames with 1 μm steps. Scale bars represent 6 μm. Statistical differences were analyzed by Welch Two Sample t-test in R in B and D. In C, statistical differences were analyzed by Students t-test in R.
Figure 3—figure supplement 4
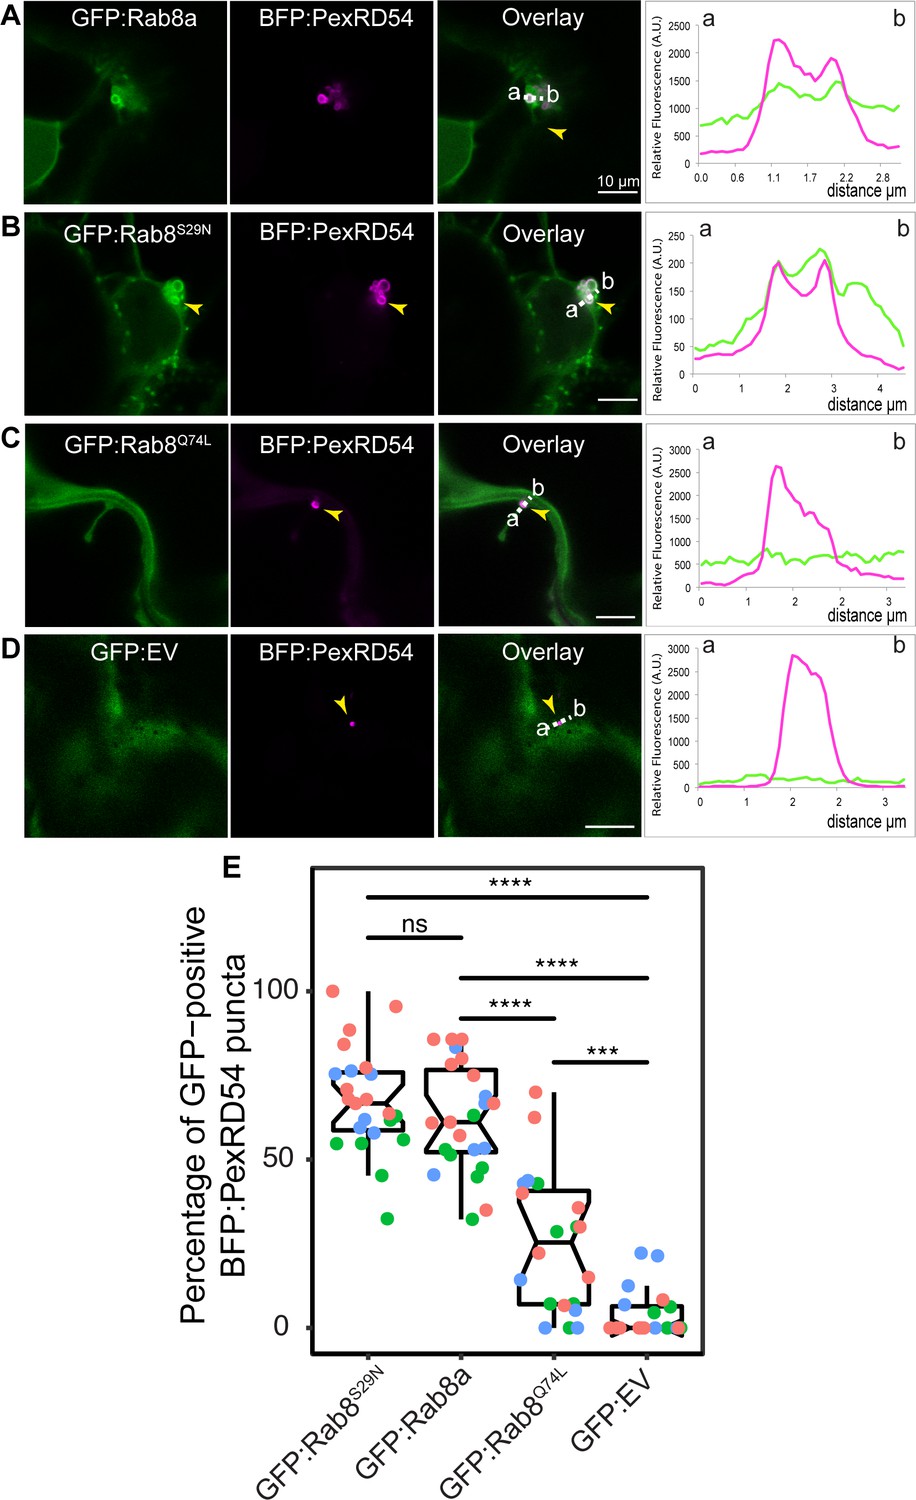
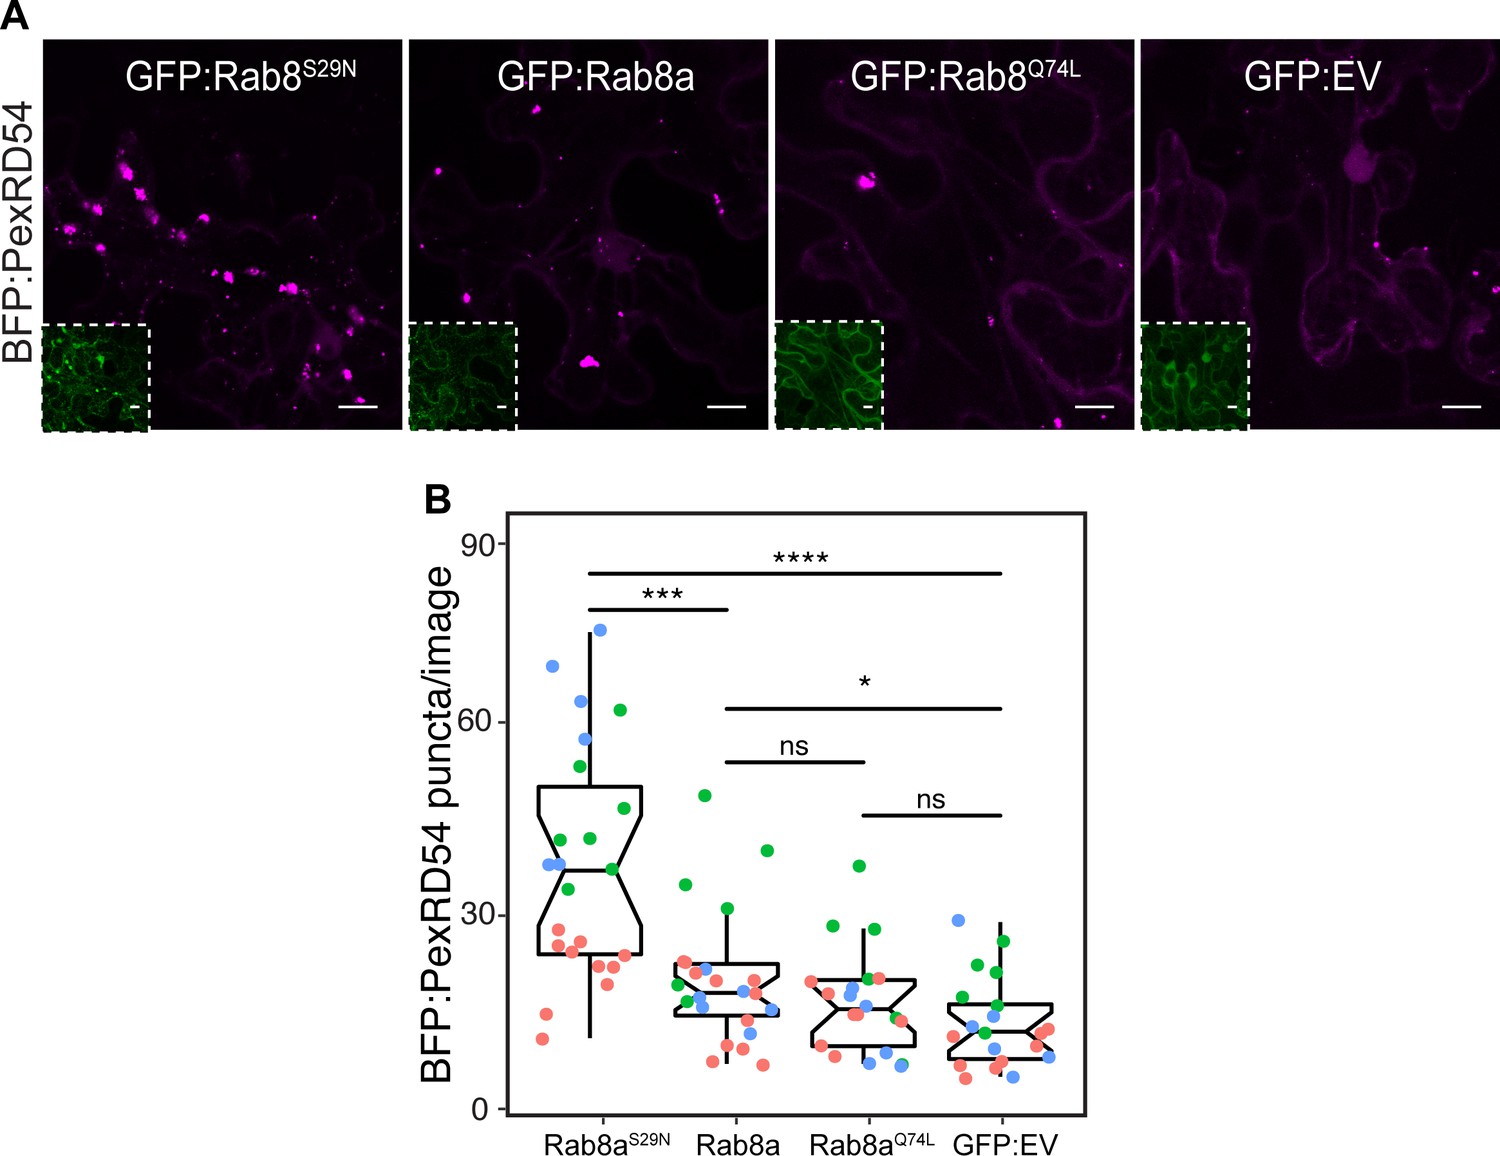
PexRD54 puncta preferentially co-localize with puncta of wild type and GDP bound form of Rab8a (Rab8aS29N) rather than GTP bound form (Rab8aQ74L).
Maximum projection confocal micrographs of N. benthamiana leaf epidermal cells transiently expressing BFP:PexRD54 with GFP:Rab8a (A), GFP:Rab8aS29N (B), GFP:Rab8aQ74L (C), or GFP:EV (D). Transects in overlay panel correspond to plot of relative fluorescence over the labeled distance. GFP:Rab8a and GFP:Rab8aS29N shows similar co-localization pattern with BFP:PexRD54, while GFP:Rab8aQ74L has much lower co-localization with BFP:PexRD54. Images shown are maximal projections of 15 frames with 1 μm steps Scale bars represent 10 μm (E) Scatter-boxplot shows GFP:Rab8aQ74L (25%, N = 20 images quantified) colocalizes significantly less with PexRD54 compared to GFP:Rab8a (68%, N = 23 images quantified), GFP:Rab8aS29N (67%, N = 23 images quantified) or an empty vector (11%, N = 23 images quantified). Statistical differences were analyzed by Welch Two Sample t-test in R. Measurements were significant when p<0.05 (*) and highly significant when p<0.0001(****).
Figure 3—figure supplement 5
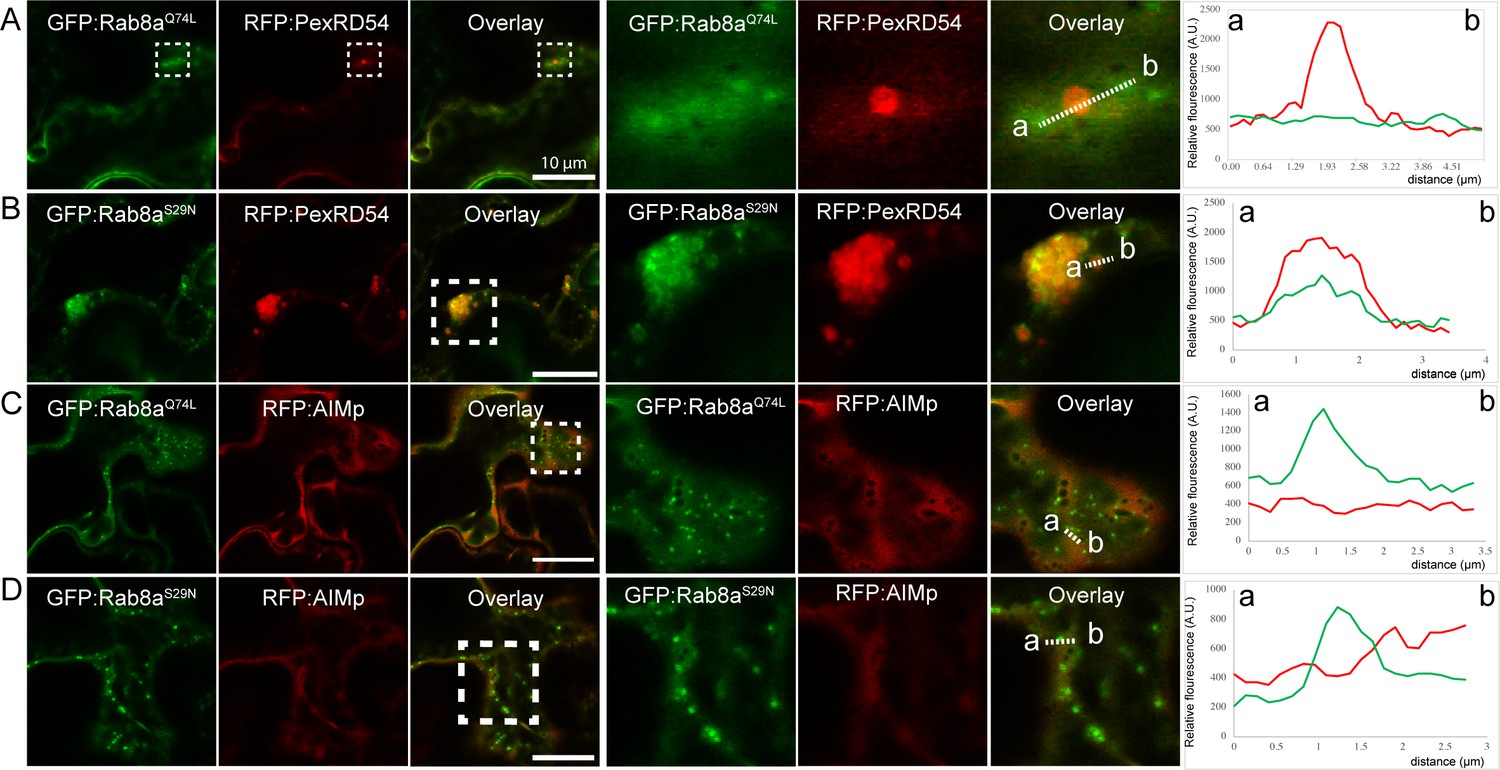
Rab8aS29N and GFP:Rab8aQ74L do not co-localize with AIM peptide in planta.
Maximum projection confocal micrographs of N. benthamiana leaf epidermal cells transiently expressing either RFP:PexRD54 or RFP:AIMp, with either (B, D) GFP:Rab8aS29N or (A, C) GFP:Rab8aQ74L. While GFP:Rab8aS29N, GDP bound form, labels PexRD54 puncta, GDP bound form of Rab8a, GFP:Rab8aQ74L, does not label most of the RFP:PexRD54 puncta. Both of the mutants do not co-localize with RFP:AIMp. Confocal micrographs on the right are zoomed versions of white dashed squares on the left images. Transects in overlay panel correspond to plot of relative fluorescence over the labeled distance. Images shown are maximal projections of 21 frames with 1 μm steps. Scale bars represent 10 μm.
Figure 4 with 3 supplements
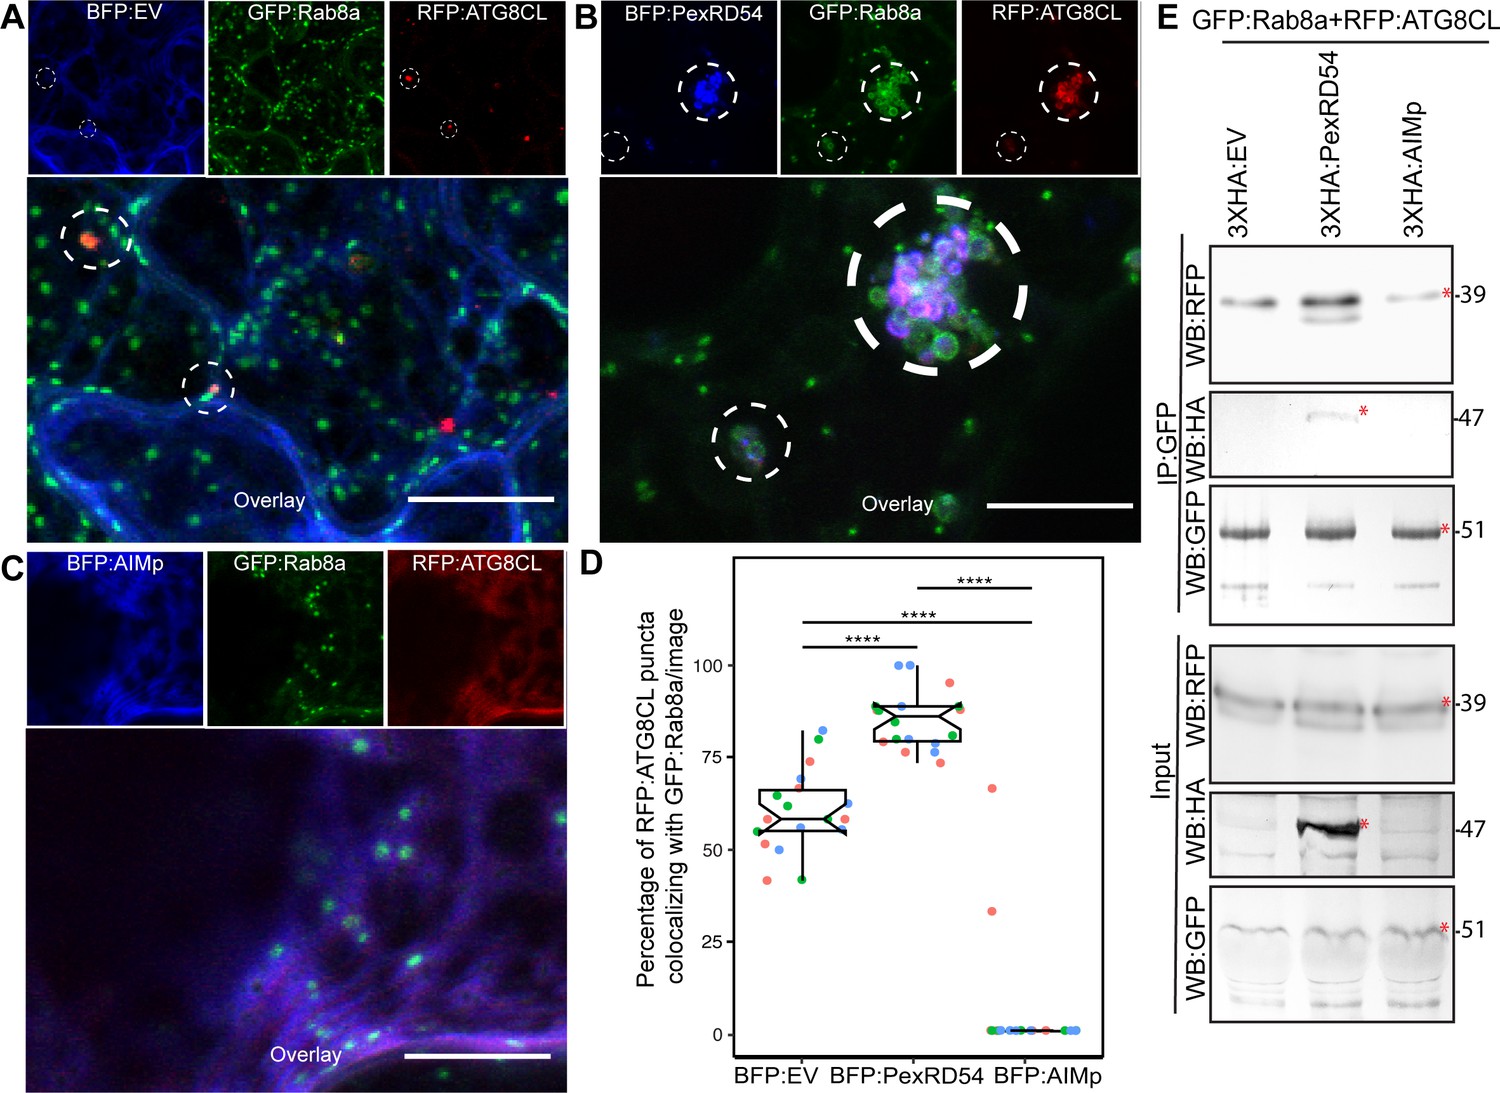
PexRD54 recruits Rab8A to ATG8CL-labeled autophagosomes.
(A–C) Maximum projection confocal micrographs of N. benthamiana leaf epidermal cells transiently expressing either BFP:EV (A), BFP:PexRD54 (B), or BFP:AIMp (C), with GFP:Rab8a and RFP:ATG8CL. Dashed white circles show variable colocalization between RFP:ATG8CL and GFP:Rab8a. Scale bars represent 10 μm (D) BFP:PexRD54 expression significantly increases punctate colocalization between RFP:ATG8CL and GFP:Rab8 (85%, N = 18 images quantified), while BFP:AIMp significantly reduces colocalization between RFP:ATG8CL and GFP:Rab8 (6%, N = 18 images quantified) compared to the BFP:EV control (60%, N = 18 images quantified). Scattered points show individual data points, colors indicate biological repeats. Statistical differences were analyzed by Welch Two Sample t-test in R. Measurements were significant when p<0.05 (*) and highly significant when p<0.0001(****). (E) In planta co-immunoprecipitation between Rab8A and ATG8CL, and PexRD54 or AIMp. GFP:Rab8A and RFP:ATG8CL were transiently co-expressed with either 3xHA:EV, 3xHA:PexRD54, or 3xHA:AIMp. IPs were obtained with anti-GFP antiserum. Total protein extracts were immunoblotted. Red asterisks indicate expected band sizes. Protein sizes in kDa.
-
Figure 4—source data 1
Source data for western blots, colocalization data sheets and image analysis plugin.
The ZIP archive contains full sized immune blots, data sheet values for colocalization analyses, and Fiji Macro/plugin used for puncta colocalization.
- https://cdn.elifesciences.org/articles/65285/elife-65285-fig4-data1-v2.zip
Figure 4—figure supplement 1
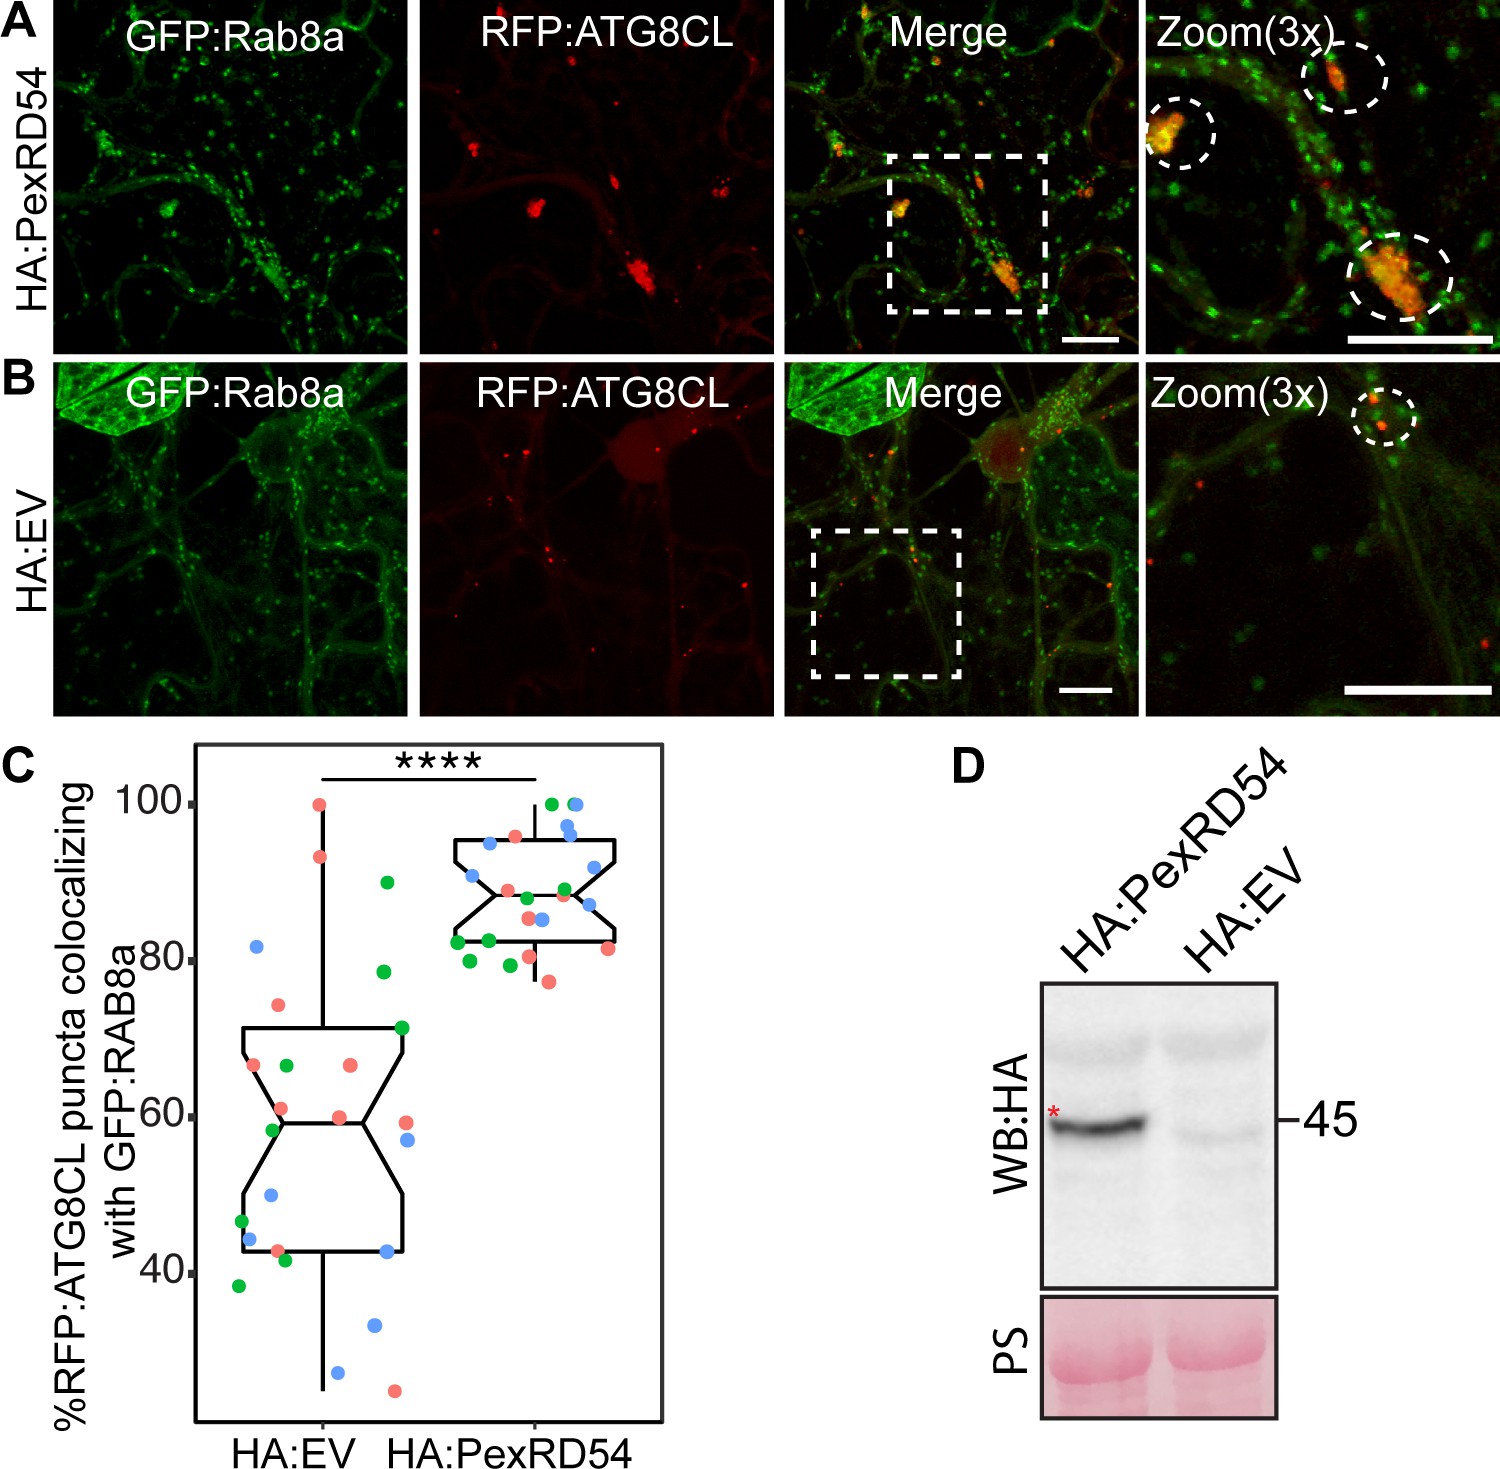
PexRD54 increases Rab8a and ATG8CL co-localisation.
(A–B) Maximum projection confocal micrographs of GFP:NbRab8a transgenic N. benthamiana leaf epidermal cells transiently expressing either (A) HA:PexRD54, or (B) HA:EV, with GFP:ATG8CL and RFP:ATG8CL. Clustering of ATG8CL with Rab8a increases in the presence of PexRD54 expression. Images shown are maximal projections of 22 frames with 1 μm steps. Scale bars represent 10 μm. (C) Scatter-boxplot shows HA:PexRD54 expression significantly increases the percentage of RFP:ATG8CL puncta colocalizing with GFP:Rab8a per image (87%, N = 22 images quantified) compared to expressing HA:EV control (58%, N = 25 images quantified) Statistical differences were analyzed by Welch Two Sample t-test in R. Measurements were significant when p<0.05 (*) and highly significant when p<0.0001(****). (D) Western blot analysis showing HA:PexRD54 is well expressed and the expected size. Total protein extracts were isolated 3 days after infiltration and immunoblotted. Red asterisk indicates expected band sizes. Protein sizes in kDa.
Figure 4—figure supplement 2
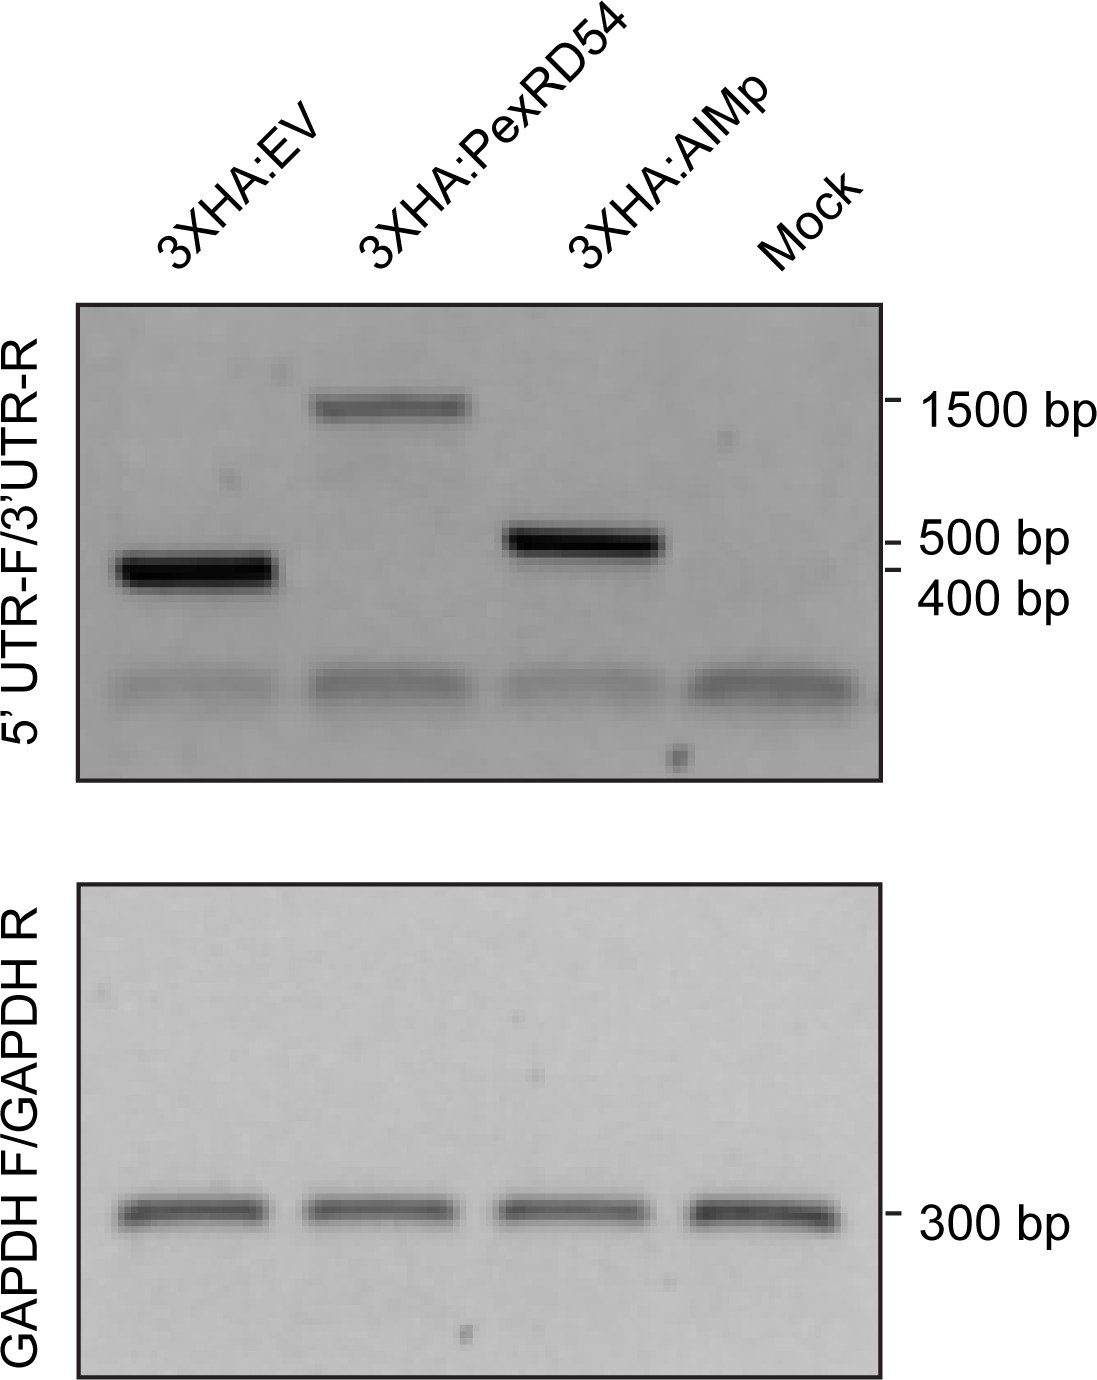
RT-PCR shows expression of 3XHA constructs.
RNA was extracted at 2dpi from the N. benthamiana leaves expressing 3XHA:EV, 3XHA:PexRD54 or 3XHA:AIMp. RT-PCR was performed using Vector primers that amplify 5’ and 3’ UTR regions of the HA constructs using GA_35S__HA_F/GA_Term_R and GAPDH_F/GAPDH_R in Table 1.
Figure 4—figure supplement 3
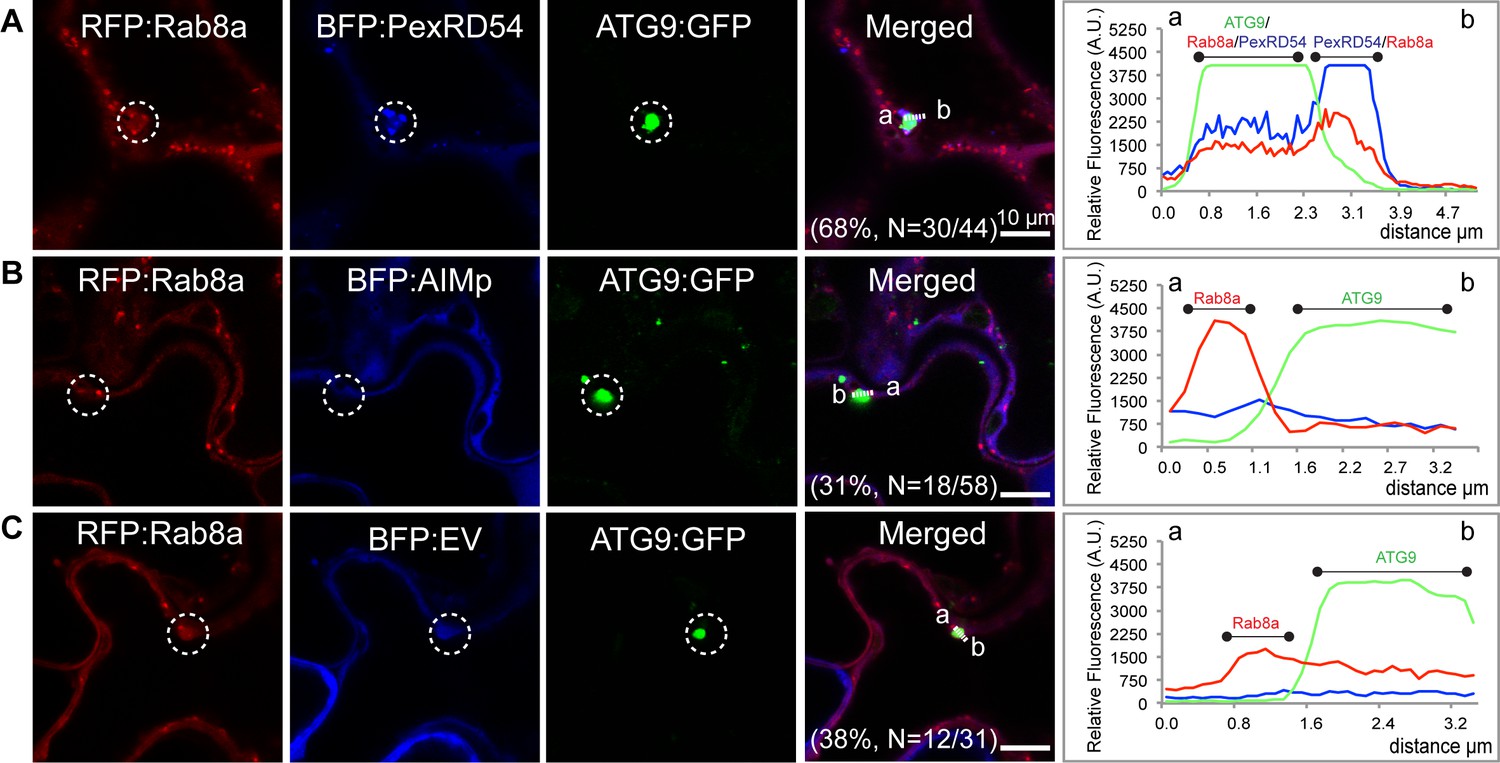
PexRD54 enhances proximity of Rab8a puncta to ATG9 compartments.
Maximum projection confocal micrographs (xyz) of N. benthamiana leaf epidermal cells transiently expressing RFP:Rab8a and ATG9:GFP with either (A) BFP:PexRD54, (B) BFP:AIMp, or (C) BFP:EV. Transects in overlay panel correspond to plot of relative fluorescence over the labeled distance. Images shown are maximal projections of 15 frames with 1 μm steps. Scale bars represent 10 μm. Expression of BFP:PexRD54 increases the proximity of ATG9 and Rab8a puncta (68%, N = 44 images quantified) compared to a BFP control (38%, N = 31 images quantified). Expression of BFP:AIMp (31%, N = 58 images quantified) does not have an effect compared to a BFP control.
Figure 5 with 9 supplements
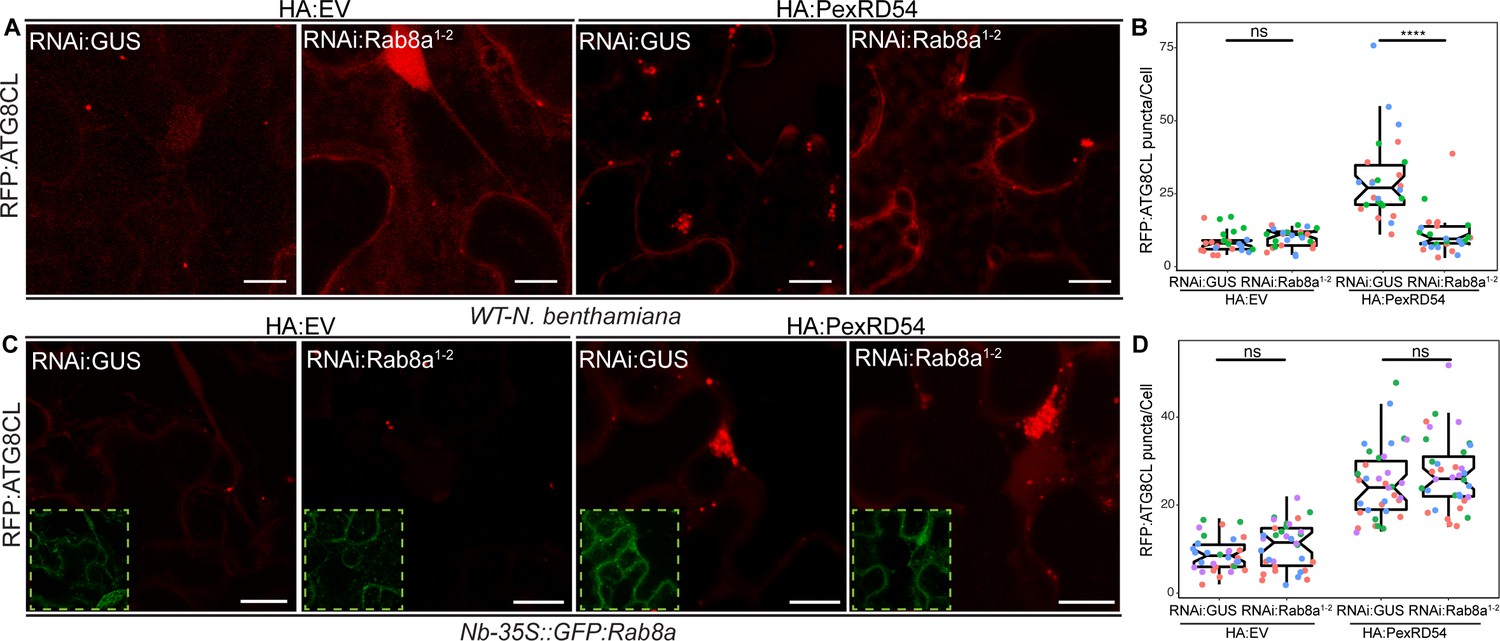
Rab8a is required for PexRD54-mediated autophagosome formation.
(A–B) RNAi-mediated silencing of Rab8a leads to reduction of autophagosome numbers induced by PexRD54. (A) Confocal micrographs of N. benthamiana leaf epidermal cells transiently expressing RFP:ATG8CL with HA:EV or HA:PexRD54 either combined with RNAi:GUS or RNAi:NbRab8a1-2. Images shown are maximal projections of 25 frames with 1.2 μm steps. Scale bars represent 10 μm. (B) Silencing N. benthamiana Rab8a1-2 significantly suppresses the autophagosome formation induced by PexRD54 (11, N = 26 images quantified) compared to GUS silencing control (30, N = 26 images quantified), but in the absence of PexRD54 silencing Rab8a1-2 has no effect on endogenous autophagosome number (10, N = 27 images quantified) compared to silencing control (9, N = 24 images quantified). Statistical differences were analyzed by Welch Two Sample t-test in R. Measurements were significant when p<0.05 (*) and highly significant when p<0.0001(****). (C-D) Complementation of Rab8a1-2 silencing phenotype. (C) Confocal micrographs of GFP:NbRab8a leaf epidermal cells transiently expressing RFP:ATG8CL with HA:EV or HA:PexRD54 either combined with RNAi:GUS or RNAi:NbRab8a1-2. Dashed white squares show GFP signal of complemented GFP:Rab8a. Images shown are maximal projections of 25 frames with 1.2 μm steps. Scale bars represent 10 μm. (D) Complementing endogenous Rab8a1-2 silencing in the silencing resistant Nb-35S::GFP:Rab8a transgenics recovered PexRD54-induced autophagosome formation (24, N = 35 images quantified), to similar levels to the silencing control RNAi:GUS (28, N = 35 images quantified). Statistical differences were analyzed by Welch Two Sample t-test in R. Measurements were significant when p<0.05 (*) and highly significant when p<0.0001(****).
-
Figure 5—source data 1
Source data for Rab8a sequences and autophagosome counts.
The ZIP archive contains NbRab8a_1–4 and StRab8a DNA sequences and data sheet values for autophagosome quantification.
- https://cdn.elifesciences.org/articles/65285/elife-65285-fig5-data1-v2.zip
Figure 5—figure supplement 1
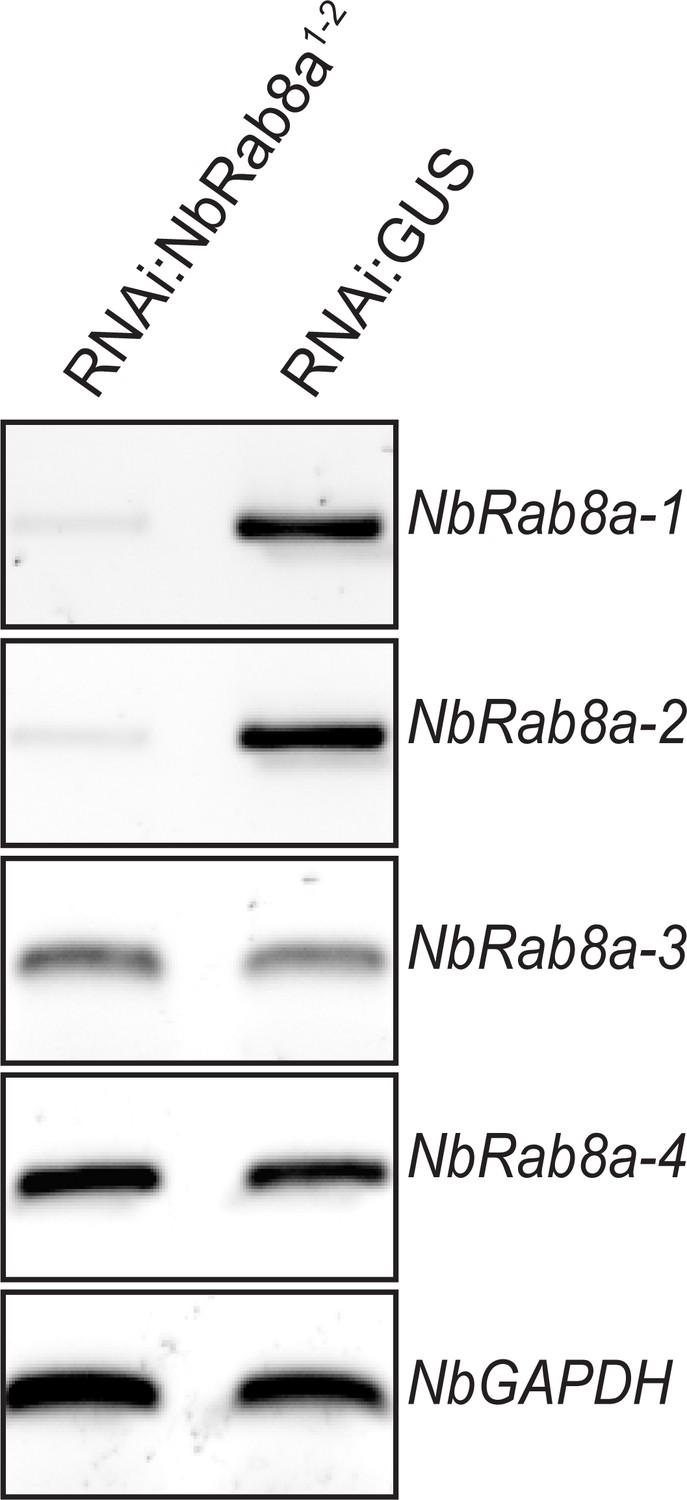
Validation of NbRab8a-1/2 silencing by RNAi:NbRab8a1-2.
Constructs carrying hairpin plasmids (pRNAi-GG) targeting NbRab8a, or GUS reporter gene were infiltrated to N. benthamiana and the expression of targeted genes was assessed by RT-PCR at 3 days post silencing. RT-PCR verified efficient gene silencing of NbRab8a-1 and NbRab8a-2. Glyceraldehyde 3-phosphate dehydrogenase (GAPDH) was used as internal control. cDNA was synthesized using total RNA.
Figure 5—figure supplement 2
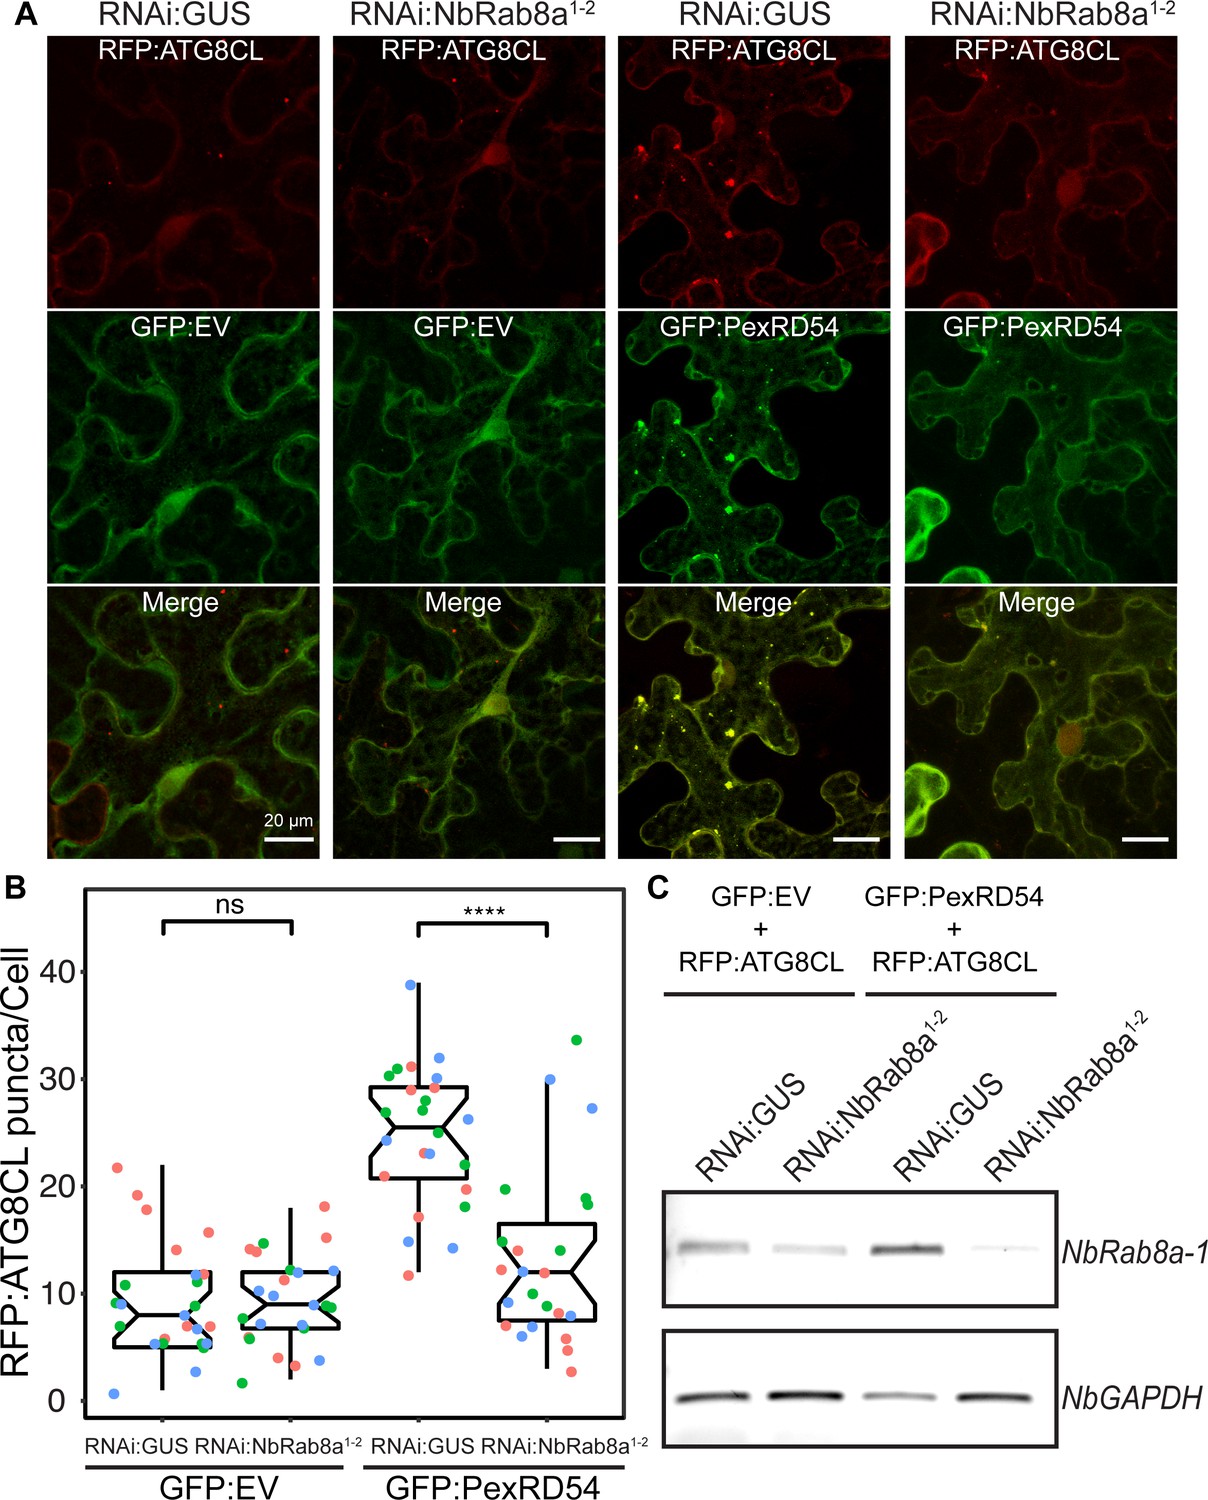
PexRD54 increases the number of ATG8CL puncta in a Rab8a-dependent manner.
(A) Maximum projection confocal micrographs of N. benthamiana leaf epidermal cells transiently expressing RFP:ATG8CL and GFP:EV with either RNAi:GUS (left column) or RNAi:NbRab8a1-2 (right column). RFP:ATG8CL puncta are still seen in Rab8a-silenced tissue. Maximum projection confocal micrographs of N. benthamiana leaf epidermal cells transiently expressing RFP:ATG8CL and GFP:PexRD54 with either RNAi:GUS (left column) or RNAi:NbRab8a1-2 (right column). RFP:ATG8CL puncta are reduced in Rab8a-silenced tissue. Images shown are maximal projections of 22 frames with 1 μm steps. Scale bars represent 10 um. (B) Scatter-boxplot shows quantification of A-B. When GFP:PexRD54 is co-expressed, RNAi:NbRab8a1-2 expression significantly reduces the number of RFP:ATG8CL puncta per cell (13, N = 23 images quantified) compared to RNAi:GUS expression (25, N = 24 images quantified), but a similar reduction is not seen when GFP:EV is co-expressed (9, N = 24; 9, N = 25 images quantified). Statistical differences were analyzed by Students t-test in R. Measurements were significant when p<0.05 (*) and highly significant when p<0.0001(****). (C) RT-PCR validates efficient silencing of NbRab8a-1 in experiment A-C when RNAi:NbRab8a1-2 is expressed, compared to RNAi:GUS expression.
Figure 5—figure supplement 3
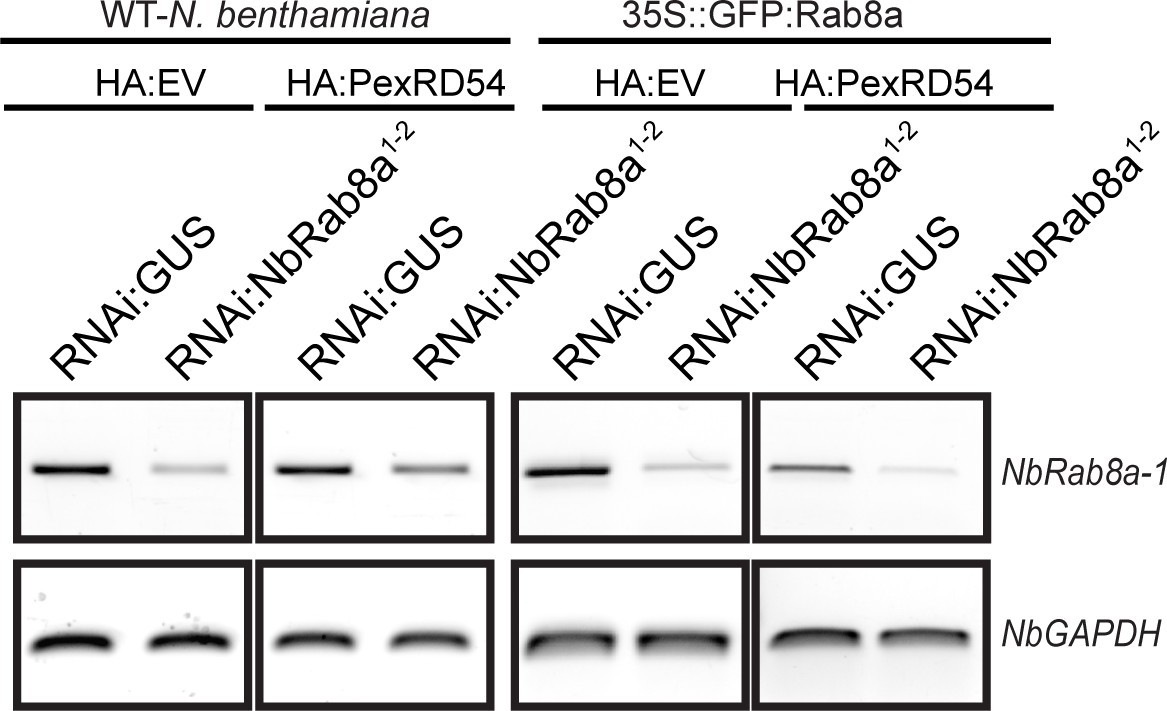
Validation of silencing of NbRab8a-1 by RNAi:NbRab8a1-2.
RT-PCR validates silencing of NbRab8a-1 for Figure 5A–B when RNAi:NbRab8a1-2 is expressed, compared to RNAi:GUS expression.
Figure 5—figure supplement 4
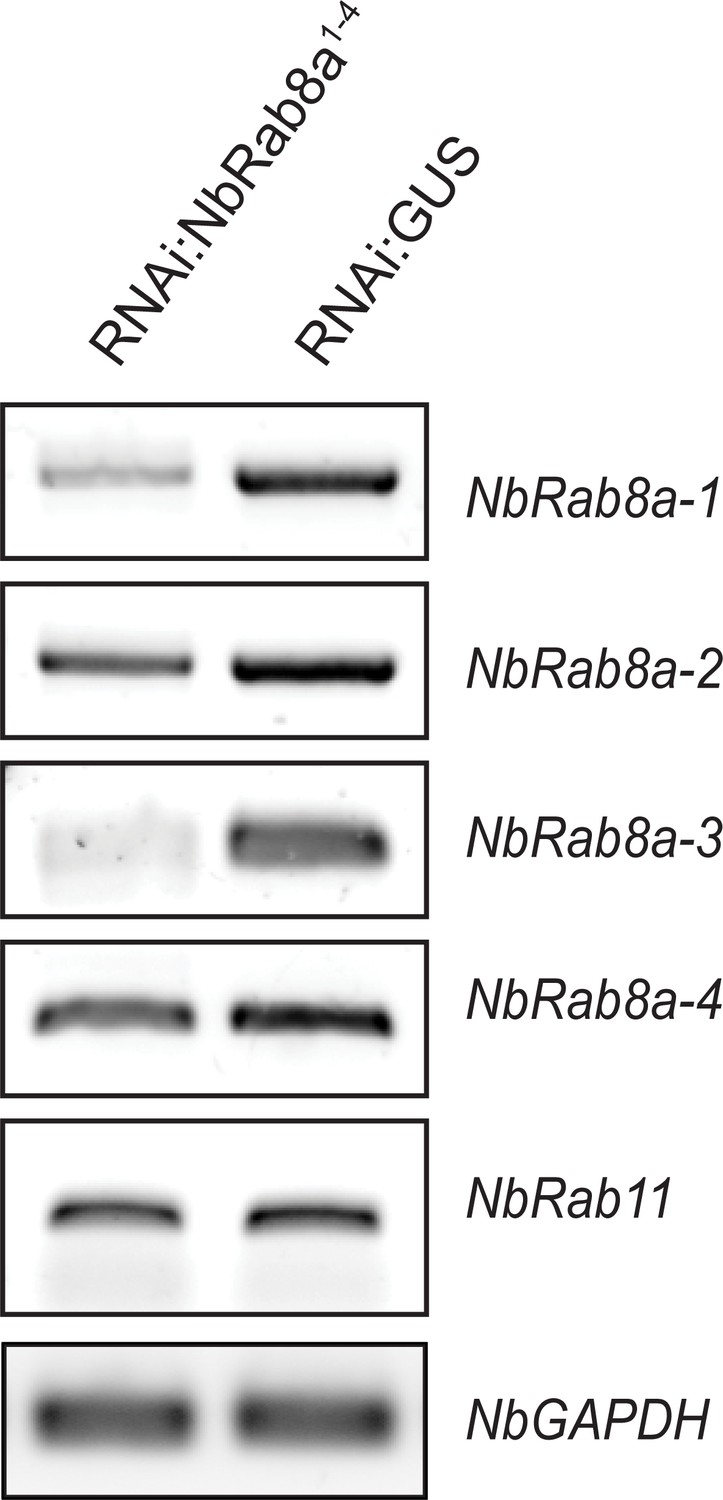
Validation of RNAi:NbRab8a1-4 silencing construct.
RT-PCR validates efficient silencing of NbRab8a1-4 when RNAi:NbRab8a1-4 is expressed, compared to RNAi:GUS expression. Rab11 is not efficiently silenced by RNAi:NbRab8a1-4 compared to RNAi:GUS.
Figure 5—figure supplement 5
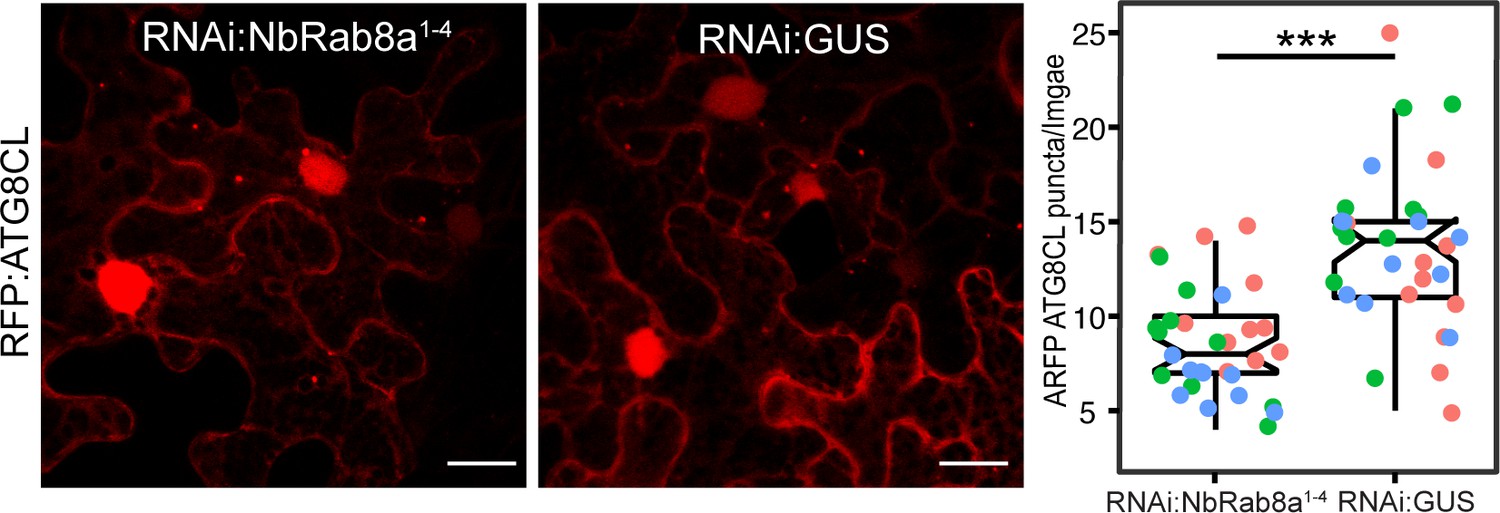
Silencing of NbRab8a1-4 significantly reduces ATG8CL autophagosome numbers.
Confocal micrographs of N. benthamiana leaf epidermal cells transiently expressing RFP:ATG8CL with either RNAi:Rab8a1-4 (Left panel) or RNAi:GUS (Mid panel). Images shown are maximal projections of 22 frames with 1 μm steps. Scale bars represent 10 μm. (Right panel) Quantification of RFP:ATG8CL puncta is shown on scatter-boxplot. Expression of RNAi:Rab8a1-4 significantly reduces the amount of RFP:ATG8CL autophagosomes (7, N = 30 images quantified) compared to RNAi:GUS (14, N = 30 images quantified). Scattered points show individual data points, colors indicate biological repeats. Statistical differences were analyzed by Students t-test in R. Measurements were significant when p<0.05 (*) and highly significant when p<0.001(***).
Figure 5—figure supplement 6
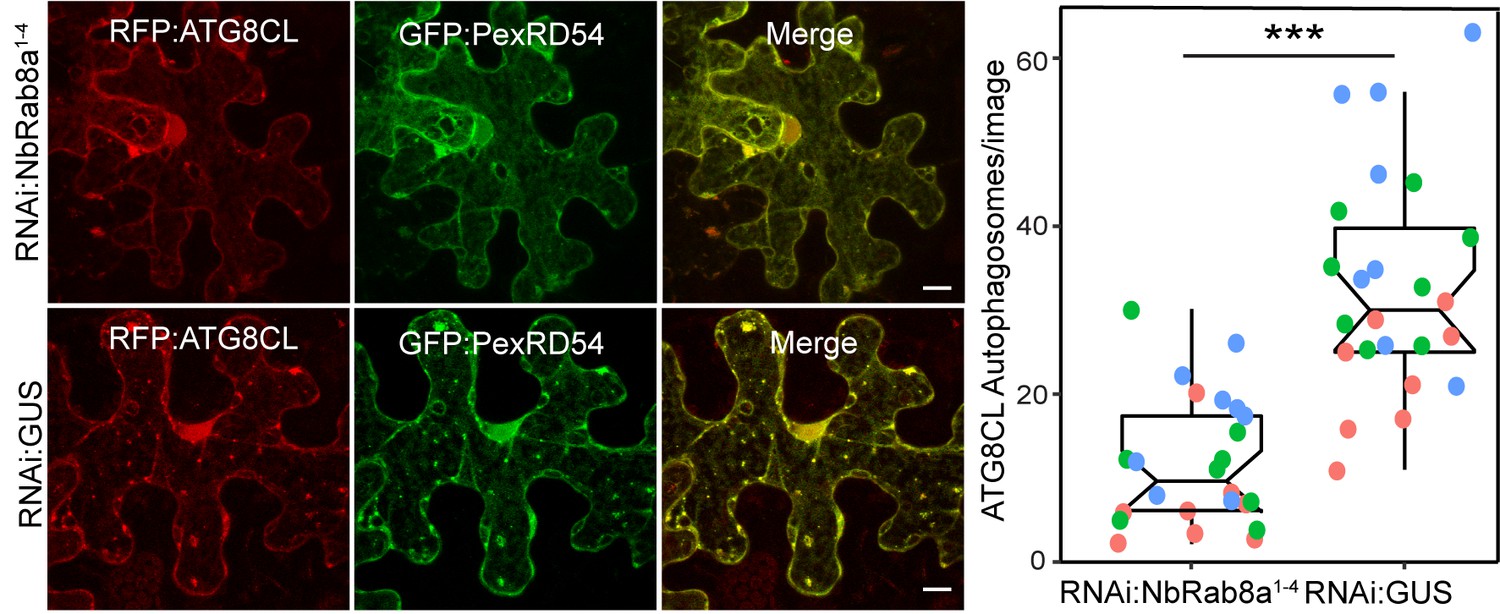
Silencing of NbRab8a1-4 significantly reduces PexRD54-triggered ATG8CL autophagosome numbers.
(A) Maximum projection confocal micrographs of N. benthamiana leaf epidermal cells transiently expressing RFP:ATG8CL and GFP:PexRD54 with either RNAi:Rab8a1-4 (Top) or RNAi:GUS (Bottom). Images shown are maximal projections of 22 frames with 1 μm steps Scale bars represent 10 μm. (B) Quantification of RFP:ATG8CL puncta is shown on scatter-boxplot. Expression of RNAi:Rab8a1-4 significantly reduces the amount of PexRD54-triggered RFP:ATG8CL autophagosomes (13, N = 24 images quantified) compared to RNAi:GUS (33, N = 24 images quantified). Scattered points show individual data points, colors indicate biological repeats. Statistical differences were analyzed by Welch Two Sample t-test in R. Measurements were significant when p<0.05 (*) and highly significant when p<0.001(***).
Figure 5—figure supplement 7
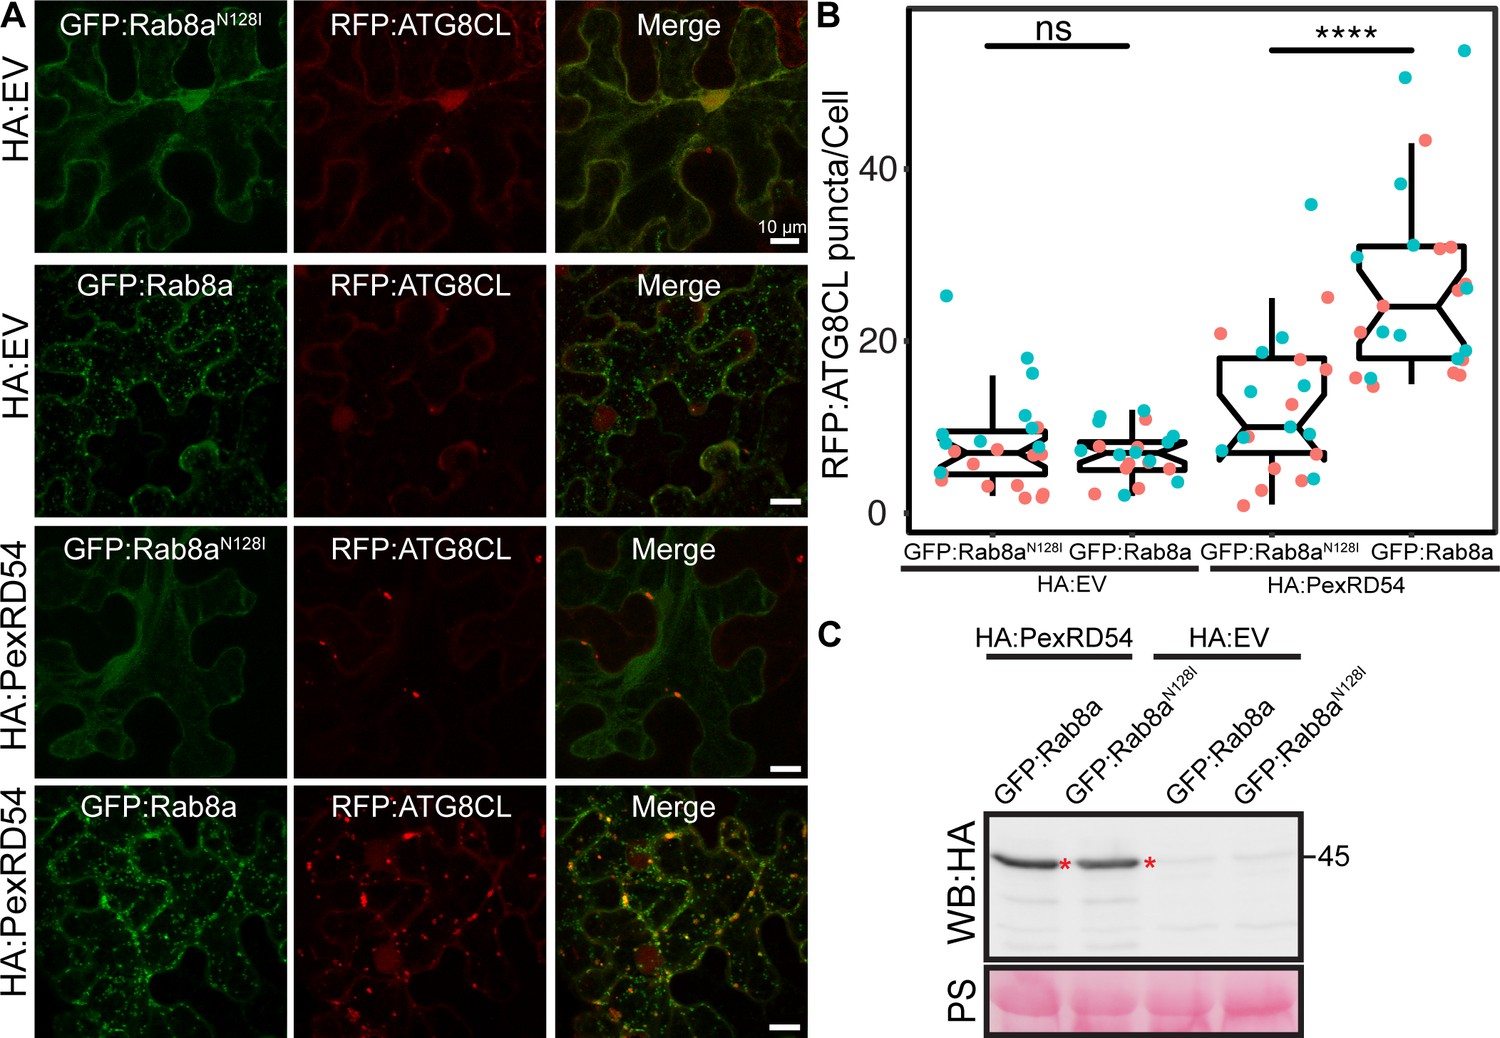
Dominant negative mutant of Rab8a (N128I) decreases PexRD54-induced autophagosome formation.
(A) Maximum projection confocal micrographs of N. benthamiana leaf epidermal cells transiently expressing RFP:ATG8CL with either GFP:Rab8aN128I (top) or GFP:Rab8a (bottom) together with either HA:EV or HA:PexRD54. RFP:ATG8CL puncta are still seen in Rab8a-silenced tissue. GFP:Rab8aN128I significantly reduces autophagosome number induced by HA:PexRD54. Images shown are maximal projections of 22 frames with 1 μm steps. Scale bars represent 10 μm. (B) Quantification of RFP:ATG8CL puncta is shown on scatter-boxplot. Expression of GFP:Rab8aN128I significantly reduces the amount of HA:PexRD54-triggered RFP:ATG8CL autophagosomes (12, N = 20 images quantified) compared to GFP:Rab8a (26, N = 23 images quantified). When HA:EV is expressed, expression of GFP:Rab8aN128I does not affect the amount of RFP:ATG8CL autophagosomes (8, N = 23 images quantified) compared to GFP:Rab8a (8, N = 23 images quantified). Statistical differences were analyzed by Welch Two Sample t-test in R. Measurements were significant when p<0.05 (*) and highly significant when p<0.0001(****). (C) Western blot analysis showing HA:PexRD54 is expressed at similar levels when co-expressed with GFP:Rab8aN128I or GFP:Rab8a. Red asterisks indicate expected band sizes. Protein sizes in kDa.
Figure 5—figure supplement 8
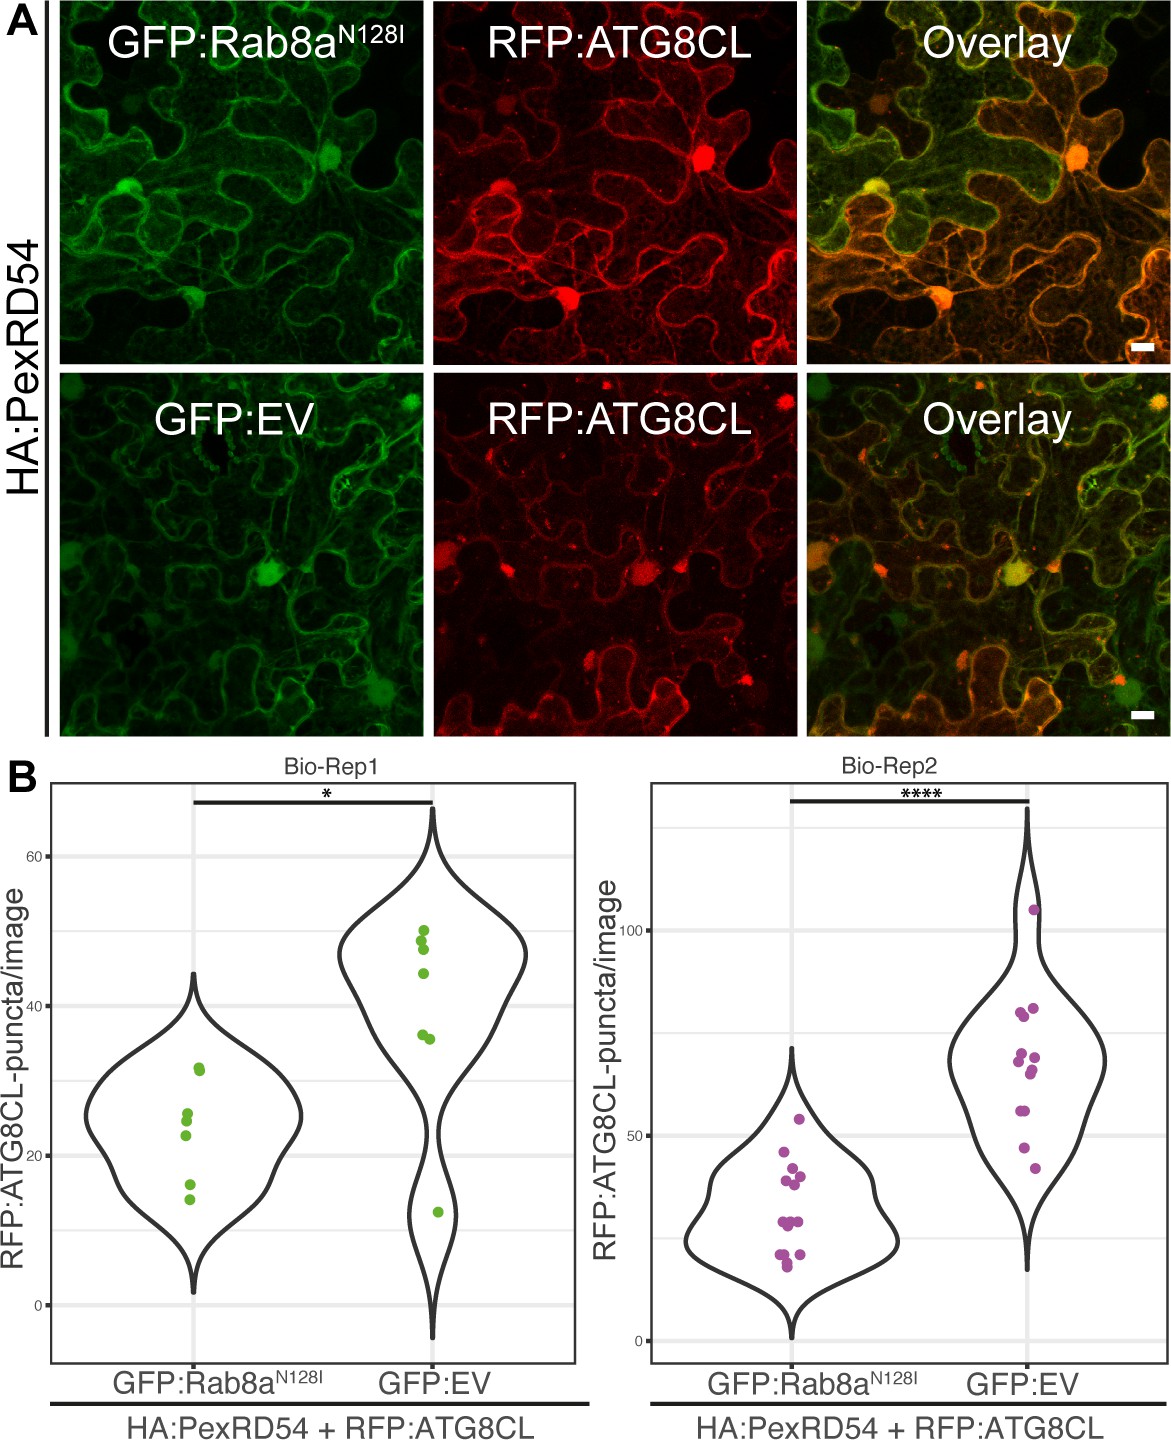
Rab8a (N128I) reduces the number of PexRD54-induced autophagosomes.
A) Maximum projection confocal micrographs of N. benthamiana leaf epidermal cells transiently expressing RFP:ATG8CL with either GFP:Rab8aN128I (top) or GFP:EV (bottom) together with either HA:PexRD54. Compared to GFP:EV control, GFP:Rab8aN128I reduces number of RFP:ATG8CL puncta induced by HA:PexRD54. Images shown are maximal projections of 17 frames with 1.5 μm steps. Scale bars represent 10 μm. (B) Quantification of RFP:ATG8CL puncta is shown on violin plots. Expression of GFP:Rab8aN128I significantly reduces the amount of HA:PexRD54-triggered RFP:ATG8CL puncta (Bio-Rep1, 23, N = 7 images quantified; Bio-Rep2, 32, N=15) compared to GFP:EV (Bio-Rep1, 39, N = 8; Bio-Rep2, 66, N=14 images quantified). Statistical differences were analyzed by Mann-Whitney test in R. Measurements were significant when p<0.05 (*) and highly significant when p<0.0001(****). P = 0029 (bio_rep1) and P=1.2e-05 (bio_rep2).
Figure 5—figure supplement 9
WT Rab8a and Rab8aS29N increases the amount of PexRD54-triggered puncta.
(A) Confocal micrographs of N. benthamiana leaf epidermal cells transiently expressing BFP:PexRD54 with either GFP:Rab8aS29N, GFP:Rab8a, GFP:Rab8aQ74L, or GFP:EV. Scale bars represent 10 μm (B) Overexpression of GFP:Rab8aS29N enhances PexRD54 puncta number (38, N = 23 images quantified) compared to the GTP mutant form GFP:Rab8aQ74L (17, N = 20 images quantified) or an empty vector control (13, N = 20 images quantified). The WT Rab8a had a mildly positive effect on PexRD54 puncta number (20, N = 23 images quantified) compared to an empty vector. (B) Scattered points show individual data points, colors indicate biological repeats. Statistical differences were analyzed by Welch Two Sample t-test in R. Measurements were significant when p<0.05 (*) and highly significant when p<0.0001(****).
Figure 6 with 1 supplement
Rab8a is dispensable for Joka2-mediated autophagy.
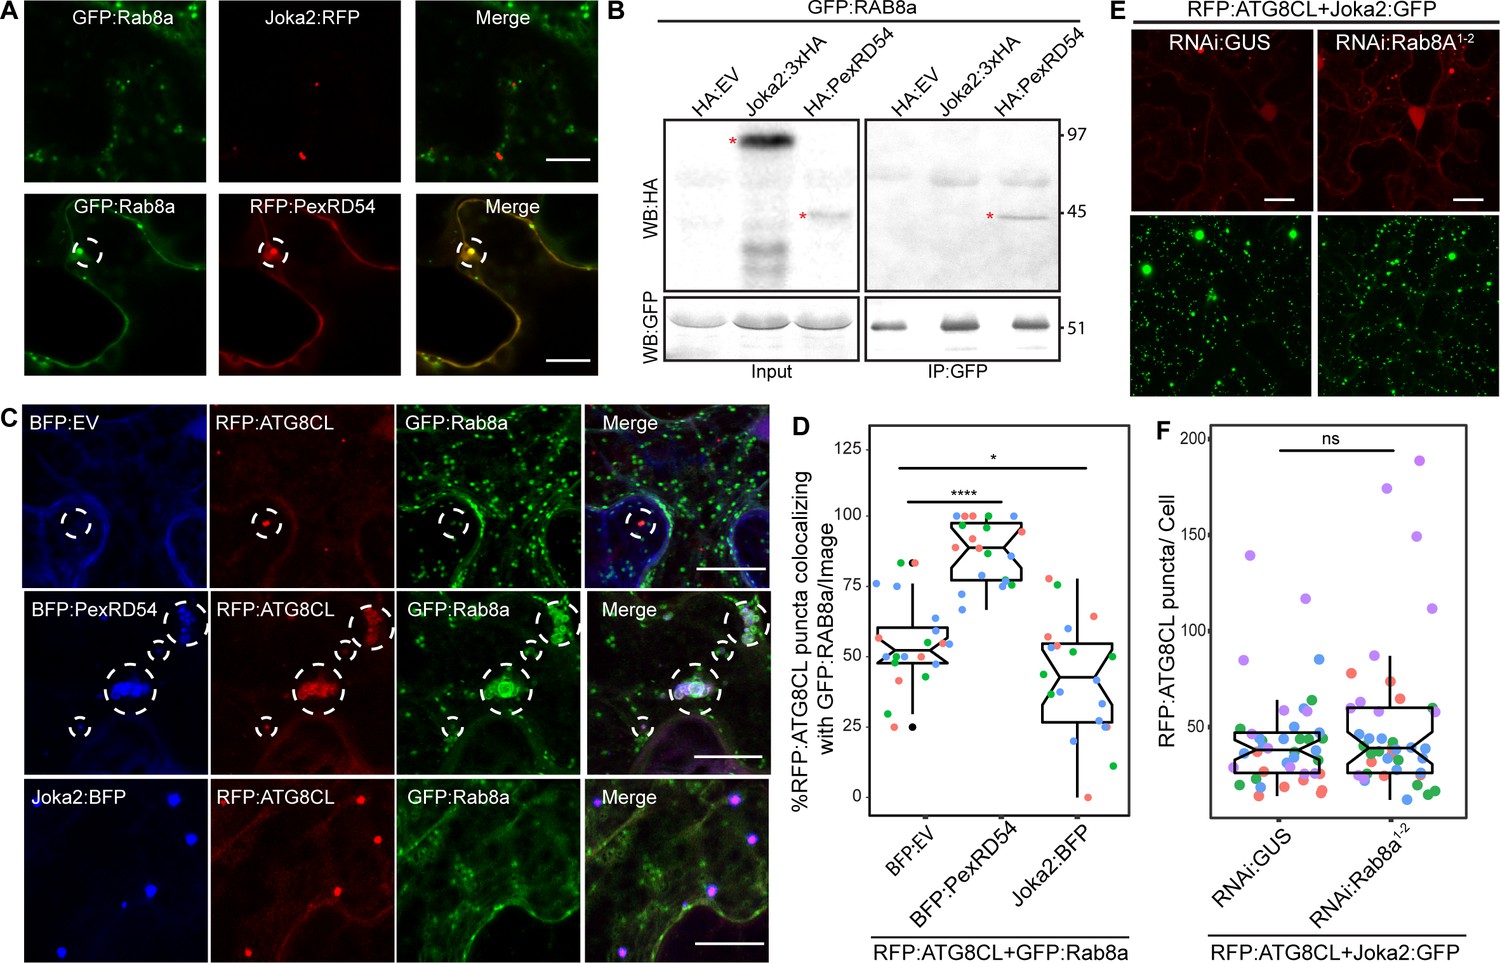
(A) Confocal micrographs of Nicotiana benthamiana leaf epidermal cells transiently expressing either Joka2:RFP (top) or RFP:PexRD54 (bottom), with GFP:Rab8a. Dashed circle highlights co-localized PexRD54 and Rab8a puncta. (B) In planta GFP pull-down assays of GFP:Rab8a and HA:EV, Joka2:HA or HA:PexRD54. Red asterisks indicate expected band sizes. (C) Maximum projection confocal micrographs of N. benthamiana leaf epidermal cells transiently expressing RFP:ATG8CL and Joka2:GFP, with either RNAi:GUS or RNAi:Rab8a1-2. Scale bars represent 10 μm. Images shown are maximal projections of 23 frames with 1 μm steps (D) Scatter-boxplot shows that silencing NbRab8a1-2 (51, N = 41 images quantified) does not affect induction of ATG8CL autophagosome formation by Joka2 compared to a GUS silencing control (42, N = 42 images quantified). Statistical differences were analyzed by Students t-test in R. Measurements were significant when p<0.05 (*) and highly significant when p<0.0001(****). (E) Confocal micrographs of N. benthamiana leaf epidermal cells transiently expressing either Joka2:BFP (top), BFP:PexRD54 (middle) and BFP:EV (bottom), with RFP:ATG8CL and GFP:Rab8a. Scale bars represent 20 μm. Images shown are maximal projections of 16 frames with 1.2 μm steps (F) BFP:PexRD54 expression increases colocalization of RFP:ATG8CL and GFP:Rab8a puncta (88%, N = 20 images quantified) compared to Joka2:BFP (42%, N = 20 images quantified) and BFP:EV control (55% N = 20 images quantified), whereas Joka2:BFP slightly induces ATG8CL-Rab8a colocalization. Scattered points show individual data points, color indicates biological repeat. Statistical differences were analyzed by Welch Two Sample t-test in R. Measurements were significant when p<0.05 (*) and highly significant when p<0.0001(****).
-
Figure 6—source data 1
Source data for western blots, autophagosome counts and colocalization values.
The ZIP archive contains uncropped full sized immune blots, data sheet values for autophagosome quantification and colocalization assays.
- https://cdn.elifesciences.org/articles/65285/elife-65285-fig6-data1-v2.zip
Figure 6—figure supplement 1
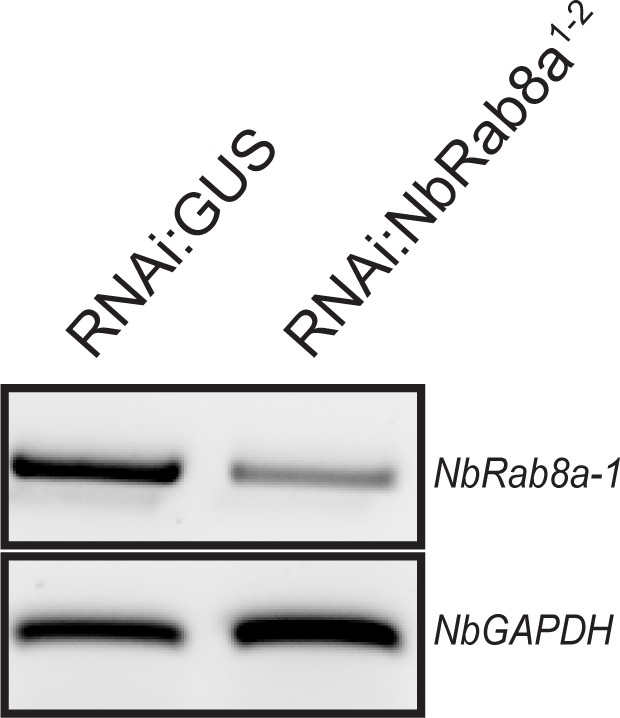
Validation of NbRab8a-1 silencing.
RT-PCR verified gene silencing of NbRab8a-1. Glyceraldehyde 3-phosphate dehydrogenase (GAPDH) was used as internal control.
Figure 7 with 11 supplements
PexRD54 triggered autophagy is reminiscent of autophagy induced during carbon starvation.
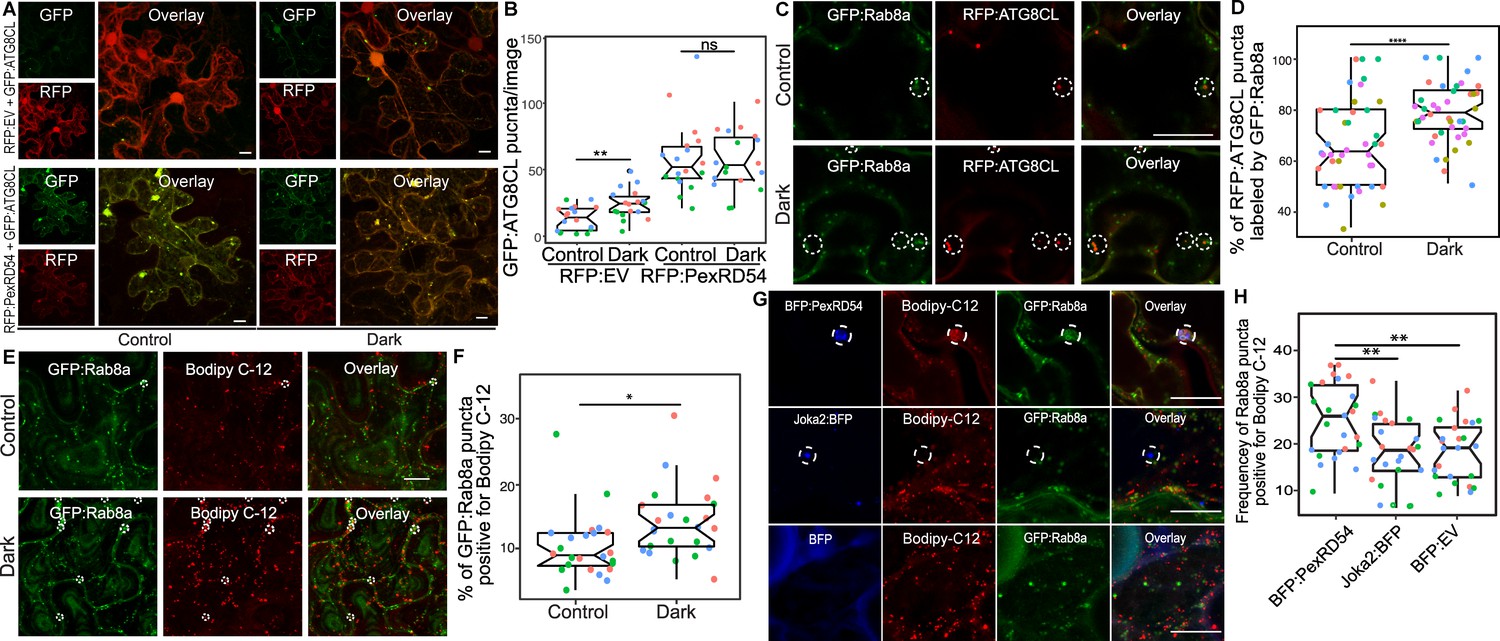
(A) Confocal micrographs of N. benthamiana leaf epidermal cells transiently expressing either RFP:EV or RFP:PexRD54, with GFPATG8CL under normal light or 24-hour-dark conditions. (B) Scatter-boxplot shows that dark treatment (24, N = 18 images quantified ) significantly increases RFP:ATG8CL-labeled puncta compared to control conditions (13, N = 18 images quantified ); however, when RFP:PexRD54 is present (59, N = 18 images quantified ), dark treatment does not further enhance puncta formation (57, N = 18 images quantified ). Images shown are maximal projections of 25 frames with 1 μm steps. (C) Colocalization of GFP:Rab8a and RFP:ATG8CL under normal light (top) or 24-hour-dark (bottom) conditions. Dashed circle shows co-localized ATG8CL and Rab8a puncta. (D) Dark treatment significantly increases percentage of RFP:ATG8CL puncta labeled by GFP:Rab8 (79%, N = 44 images quantified) compared to control conditions (66%, N = 44 images quantified). (E) Cells expressing GFP:Rab8a that are labeled by BODIPY-C12 under normal light (top) and 24-hr-dark (bottom) conditions. Dashed circle shows co-localized Rab8a and BODIPY-C12-positive puncta. (F) Twenty-four-hour-dark treatment increases the percentage of Rab8a puncta positive for BODIPY-C12 (14%, N = 24 images quantified) compared to control conditions (10%, N = 24 images quantified). (G) Confocal micrographs of cells expressing either BFP:PexRD54 (top), Joka2:BFP (middle), or BFP:EV, with GFP:Rab8a and BODIPY C12. Dashed circle in top panel shows BFP PexRD54 puncta is positively labeled by BODIPY-C12 and GFP:Rab8a. Dashed circle in middle panel shows Joka2 puncta is negative for BODIPY-C12 and GFP:Rab8a (H) Quantification of the puncta positive for both Rab8a and BODIPY C12 shows enhanced frequency of colocalization by BFP:PexRD54 (25%, N = 25 images quantified) but not by Joka2:BFP (18%, N = 24 images quantified) or BFP:EV (18%, N = 24 images quantified). Scattered points show individual data points, color indicates biological repeat in panels B, D, F, and H. Statistical differences in panels B, D, and H were analyzed by Students t-test, and statistical differences in panel F were analyzed by Welch two sample t-test in R. Measurements were significant when p<0.05 (*) and highly significant when p<0.0001(****). Scale bars represent 10 µm.
-
Figure 7—source data 1
Source data for western blots, autophagosome counts and colocalization values.
The ZIP archive contains uncropped full sized immune blots, data sheet values for autophagosome quantification and colocalization assays.
- https://cdn.elifesciences.org/articles/65285/elife-65285-fig7-data1-v2.zip
Figure 7—figure supplement 1
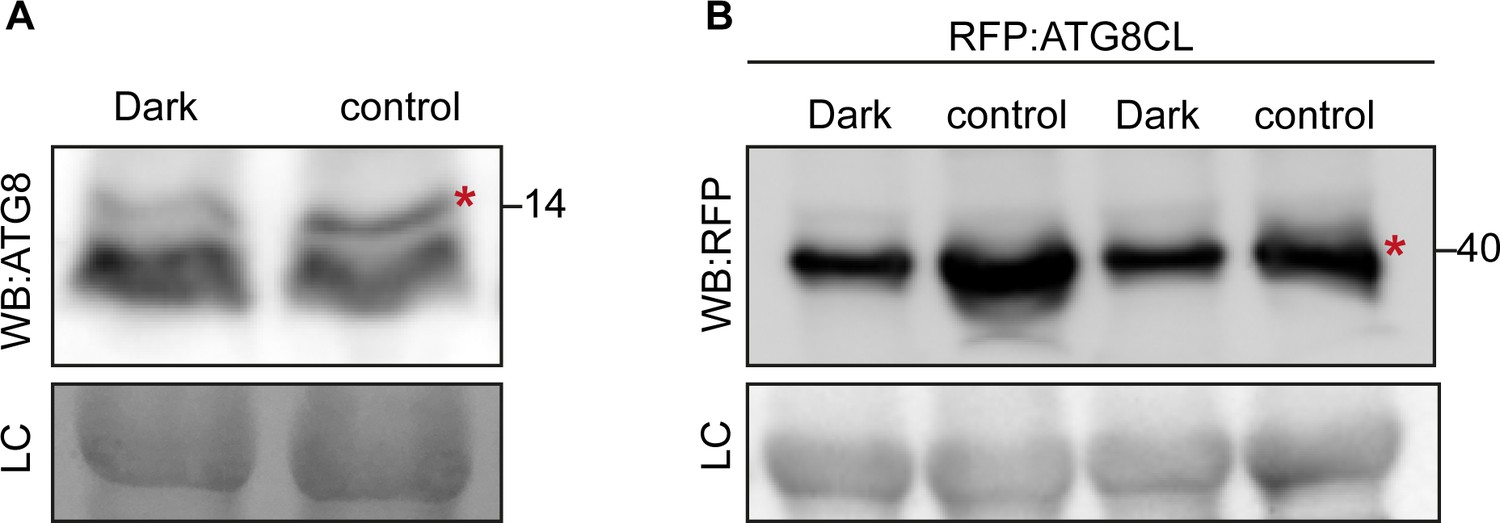
Light restriction enhances depletion of both endogenous ATG8s and transiently expressed RFP:ATG8CL.
(A–B) compared to normal light conditions (control treatment), dark treatment (24 hr) slightly enhances the depletion of; (A) endogenous ATG8(s); (B) transiently expressed RFP:ATG8CL. In B, N. benthamiana leaves were Agroinfiltrated with RFP:ATG8CL and incubated in normal light conditions for 48 hr. Following this, plants were kept either at 24 hr in dark or normal light conditions and total protein extracts were isolated at the end of this period for immunoblot assays. Two independent plants were used for each treatment. Red asterisks indicate expected band sizes. Protein sizes in kDa.
Figure 7—figure supplement 2
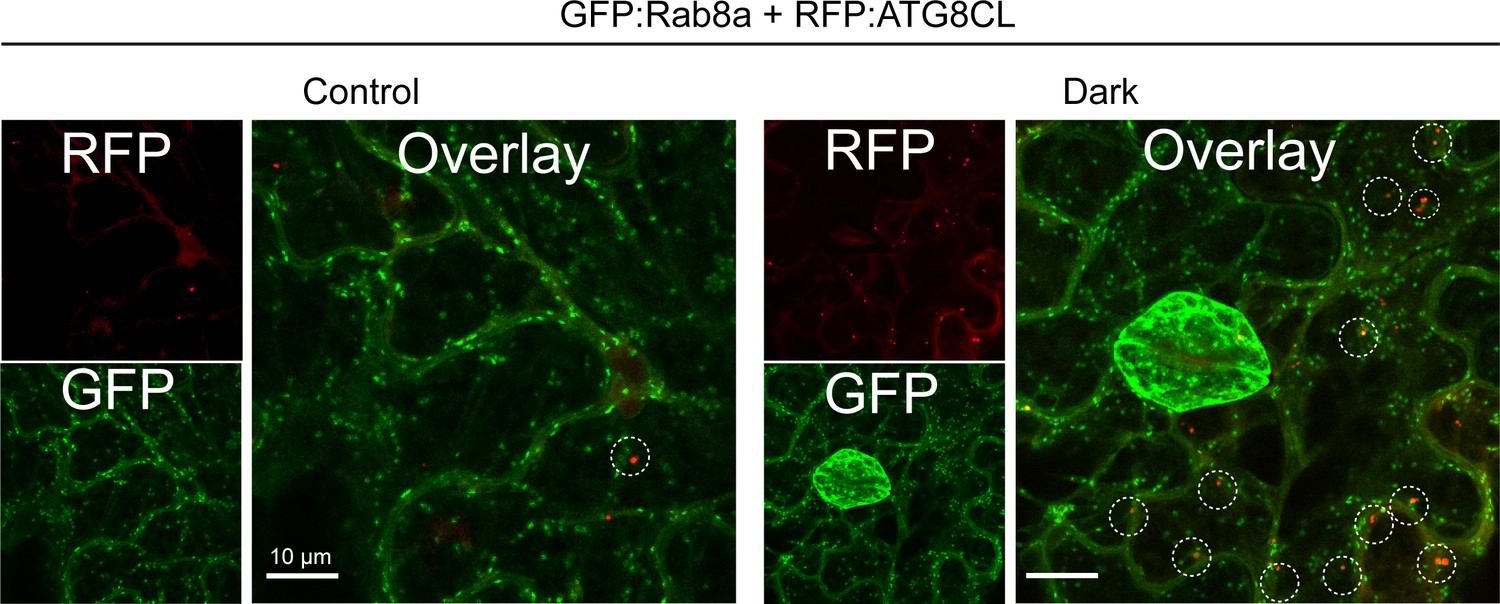
Dark treatment increases ATG8CL/Rab8a colocalization.
Maximum projection confocal micrographs of Nb::35SGFP:Rab8a N. benthamiana leaf epidermal cells transiently expressing RFP:ATG8CL under normal light or 24-hr-dark conditions. Scale bars represent 10 μm.
Figure 7—figure supplement 3
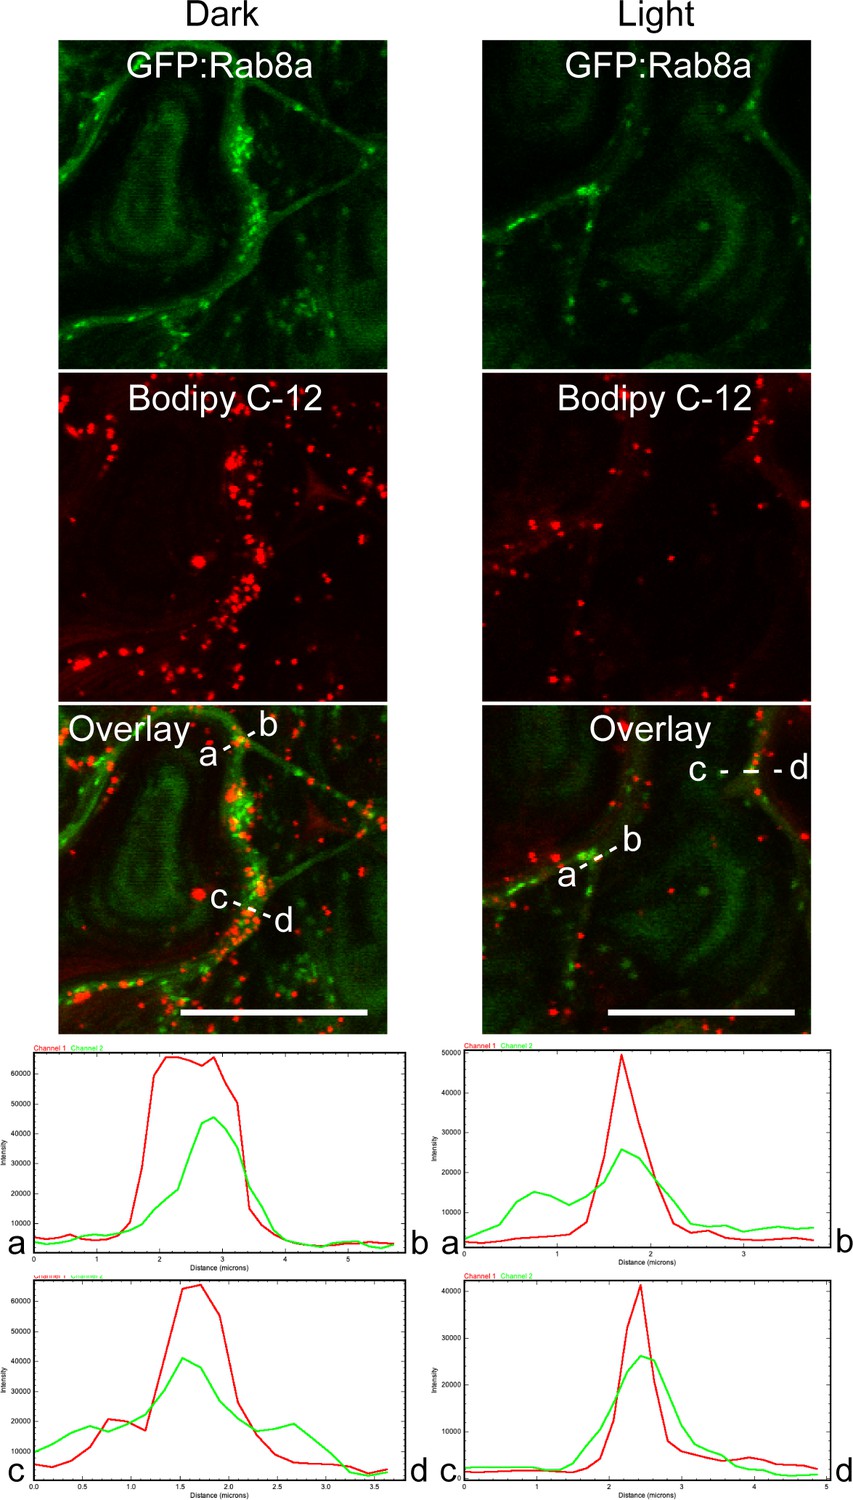
Rab8a puncta colocalize with Bodipy C12.
Maximum projection confocal micrographs (xyz) of N. benthamiana leaf epidermal cells transiently expressing GFP:Rab8a, stained with Bodipy C12 and exposed to either 24-hr-dark treatment or normal light conditions. Transects in overlay panel correspond to plot of relative fluorescence over the labeled distance. Images shown are maximal projections of 15 frames with 1 μm steps. Scale bars represent 10 μm.
Figure 7—figure supplement 4
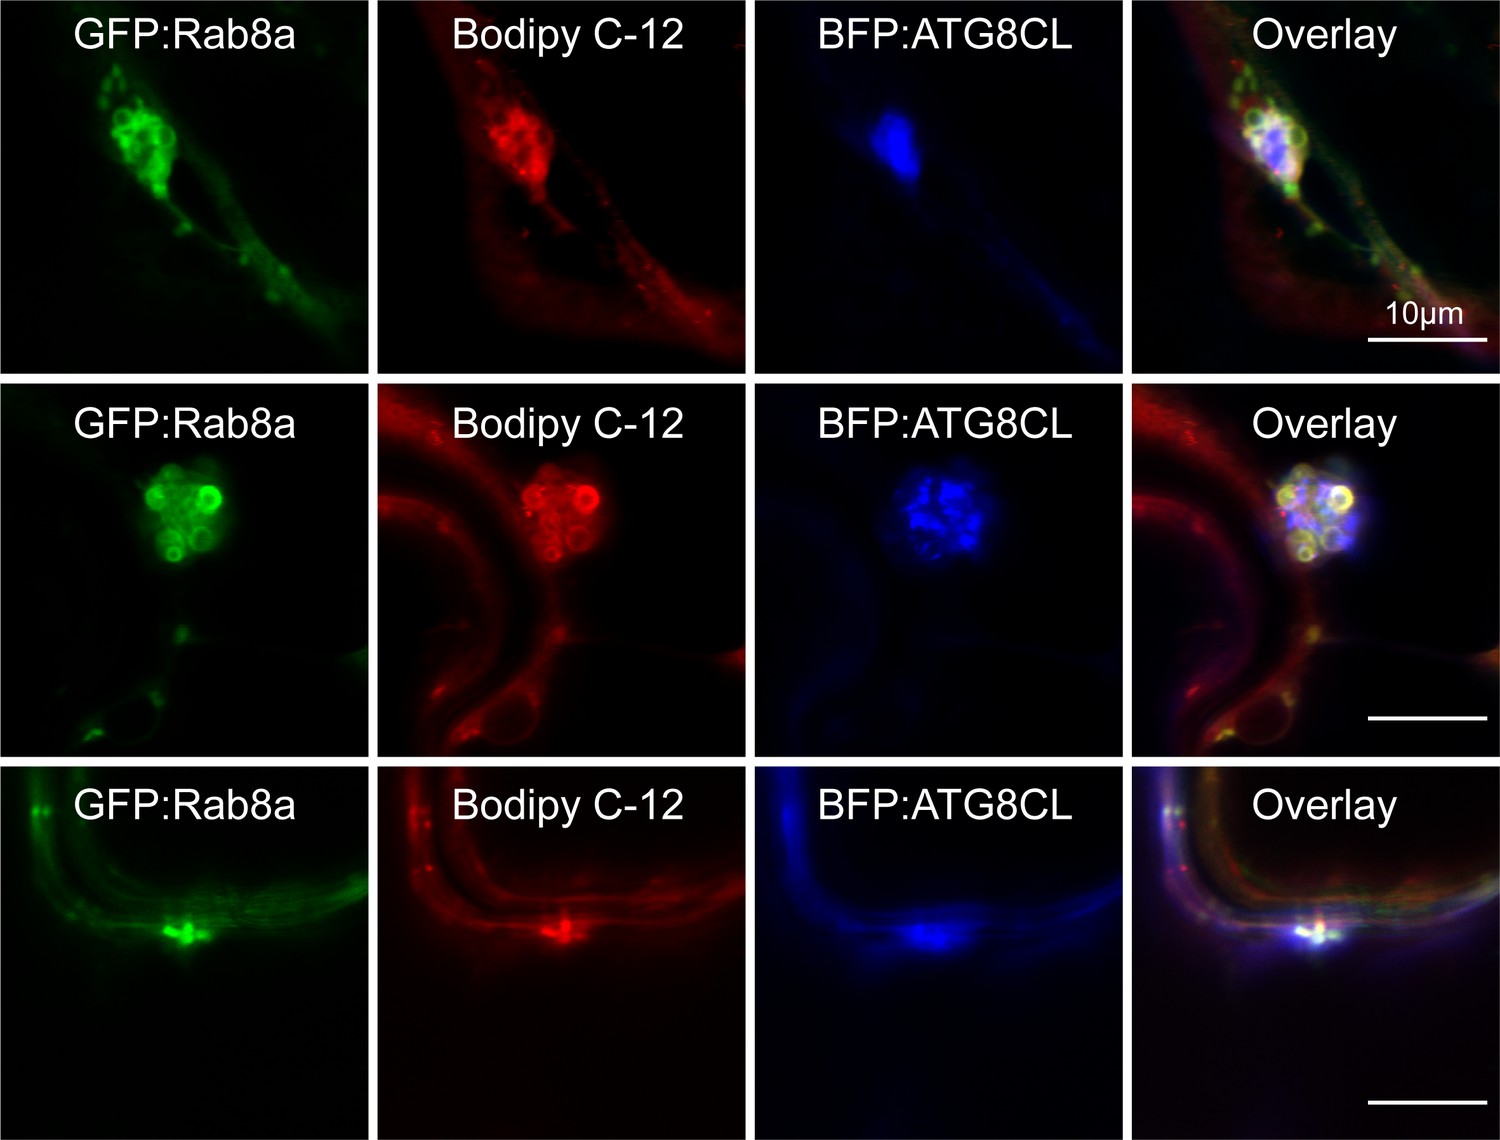
Rab8a colocalizes in puncta and ring-shaped vesicle-like structures with ATG8CL and Bodipy C-12.
Maximum projection confocal micrographs of N. benthamiana leaf epidermal cells transiently expressing GFP:Rab8a, BFP:ATG8CL and stained with Bodipy C-12. Images shown are maximal projections of 15 frames with 1 μm steps. Scale bars represent 10 μm.
Figure 7—figure supplement 5
PexRD54/Rab8a cluster localization with Bodipy C-12.
Confocal micrographs of N. benthamiana leaf epidermal cells transiently expressing BFP:PexRD54 with GFP:Rab8a and stained with Bodipy C-12. Transects in overlay panel correspond to plot of relative fluorescence over the labeled distance. Scale bars represent 10 μm.
Figure 7—figure supplement 6
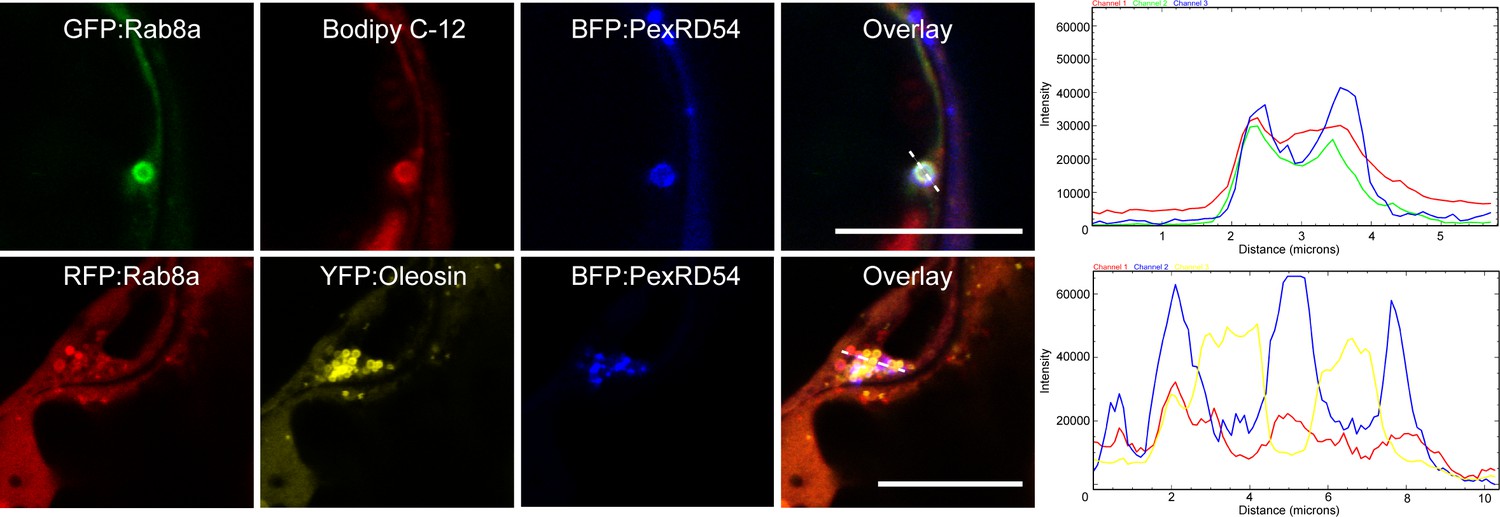
PexRD54/Rab8a cluster localization with Bodipy C-12 and Oleosin.
Confocal micrographs (xy) of N. benthamiana leaf epidermal cells transiently expressing BFP:PexRD54 with either GFP:Rab8a and stained with Bodipy C-12 or RFP:Rab8a and YFP:Oleosin. Transects in overlay panel correspond to plot of relative fluorescence over the labeled distance. Scale bars represent 10 μm.
Figure 7—figure supplement 7
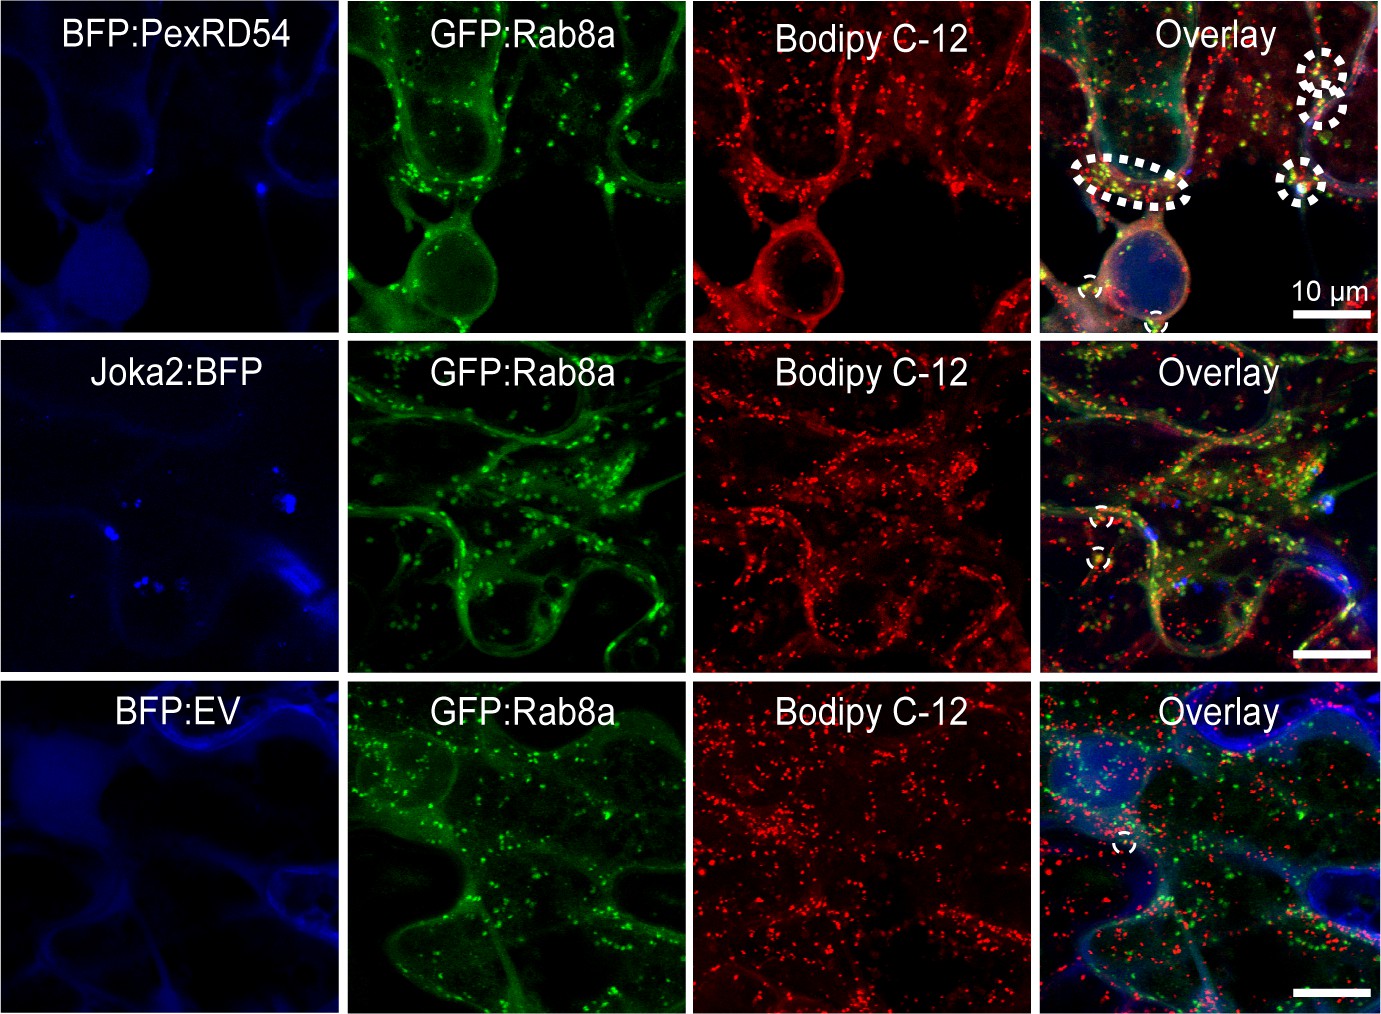
Stimulation of autophagy by PexRD54, but not Joka2, increases frequency of Rab8a and Bodipy C-12-positive puncta.
Maximum projection confocal micrographs of N. benthamiana leaf epidermal cells treated with Bodipy C-12 dye to mark lipid droplets while transiently expressing GFP Rab8 with either BFP PexRD54 (top), BFP Joka2 (middle), or BFP empty vector (bottom). Scale bars represent 10 μm.
Figure 7—figure supplement 8
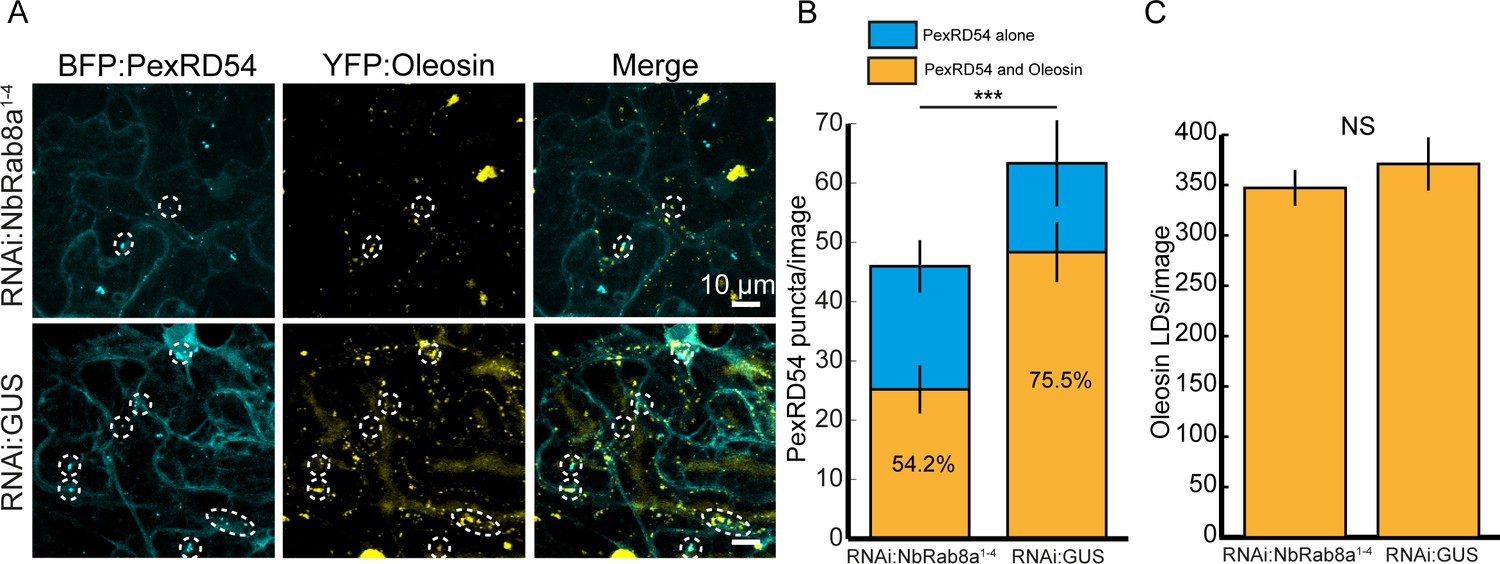
Rab8a knockdown reduces the proportion of PexRD54 autophagosomes associated with Oleosin-labeled LDs.
(A) Confocal micrographs of N. benthamiana leaf epidermal cells transiently expressing BFP:PexRD54, YFP:Oleosin with either RNAi:NbRab8a1-4 or RNAi:GUS. Images shown are maximal projections of 15–25 frames with 1 μm steps. Scale bars represent 10 μm. (B) Stacked bar plot shows that silencing NbRab8a1-4 (54.2%, N = 30 images quantified) significantly reduces the proportion of PexRD54 puncta that colocalize with Oleosin-labeled LDs compared to a GUS silencing control (75.5%, N = 30 images quantified). Silencing NbRab8a1-4 (46, N = 30) also significantly reduces the total amount of PexRD54 puncta per image compared to a silencing control (64, N = 30). (C) Knockdown of Nb:Rab8a1-4 (347, N = 30) does not significantly affect the amount of Oleosin-positive LDs per image compared to a silencing control (371, N = 30). Statistical differences were analyzed by Welch Two Sample t-test in R. Measurements were significant when p<0.05 (*) and highly significant when p<0.001(***).
Figure 7—figure supplement 9
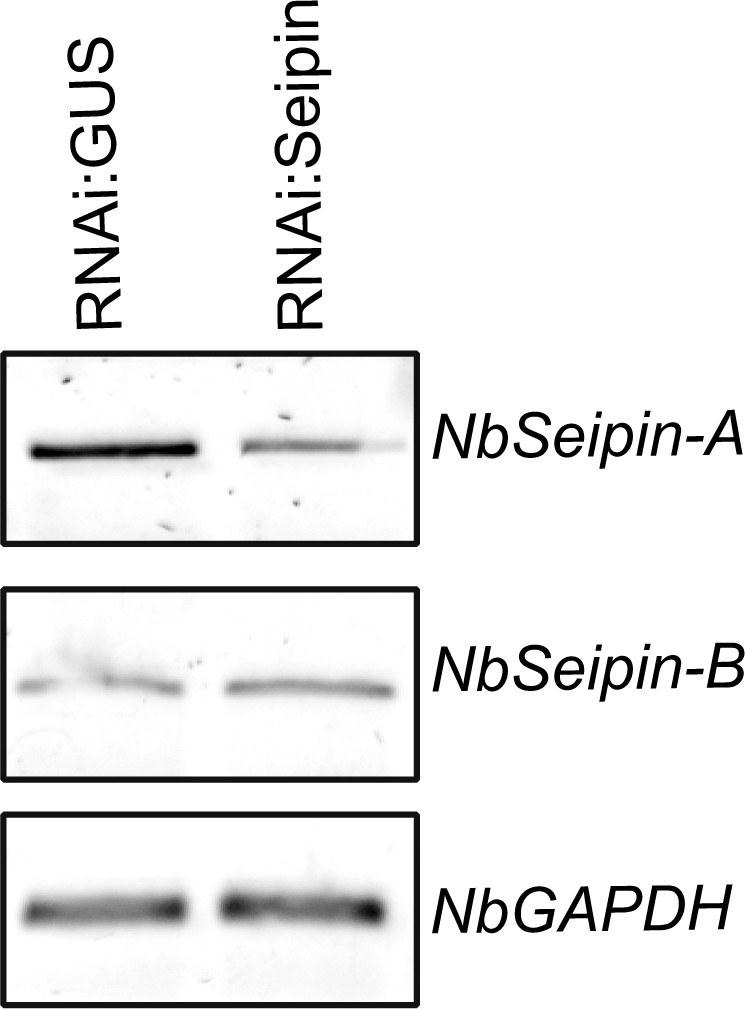
Validation of RNAi:Seipin silencing construct.
RT-PCR validates efficient silencing of NbSeipin-A but not NbSeipin-B when RNAi:Seipin is expressed, compared to RNAi:GUS expression.
Figure 7—figure supplement 10
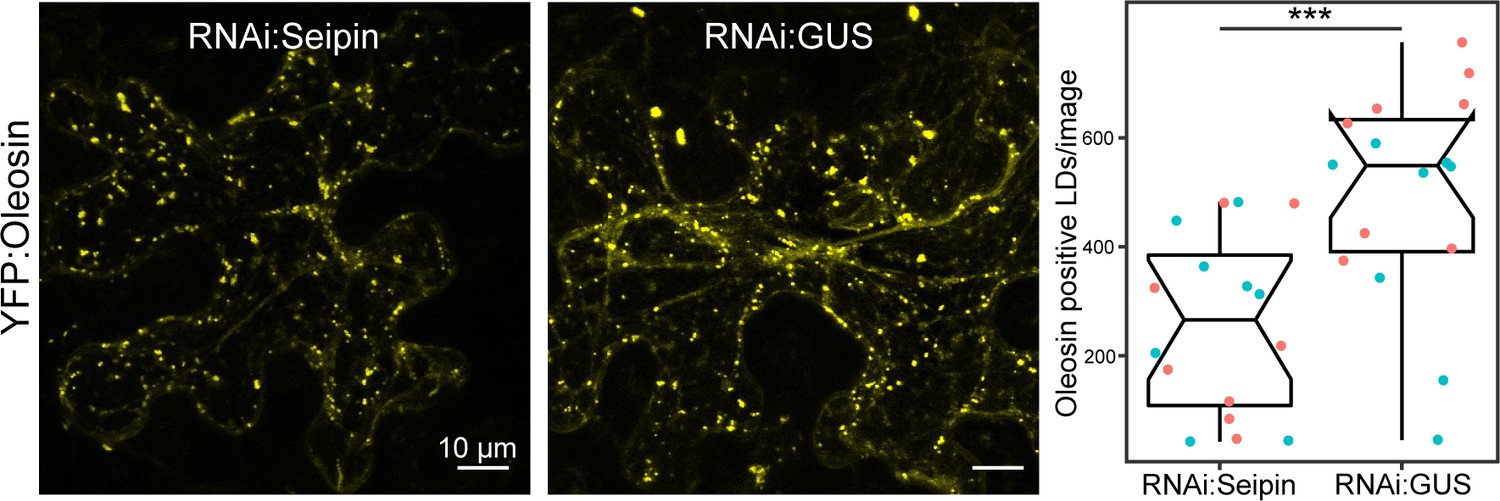
Seipin knockdown reduces the number Oleosin-positive LDs.
Confocal micrographs of N. benthamiana leaf epidermal cells transiently expressing YFP:Oleosin with either RNAi:Seipin or RNAi:GUS. Images shown are maximal projections of 15–25 frames with 1 μm steps. Scale bars represent 10 μm. Scatter-boxplot shows that silencing NbSeipin-A (252, N = 16 images quantified) significantly reduced the amount of Oleosin-positive LDs compared to a GUS silencing control (382, N = 16 images quantified). Statistical differences were analyzed by Welch Two Sample t-test in R. Measurements were significant when p<0.05 (*) and highly significant when p<0.001(***).
Figure 7—figure supplement 11
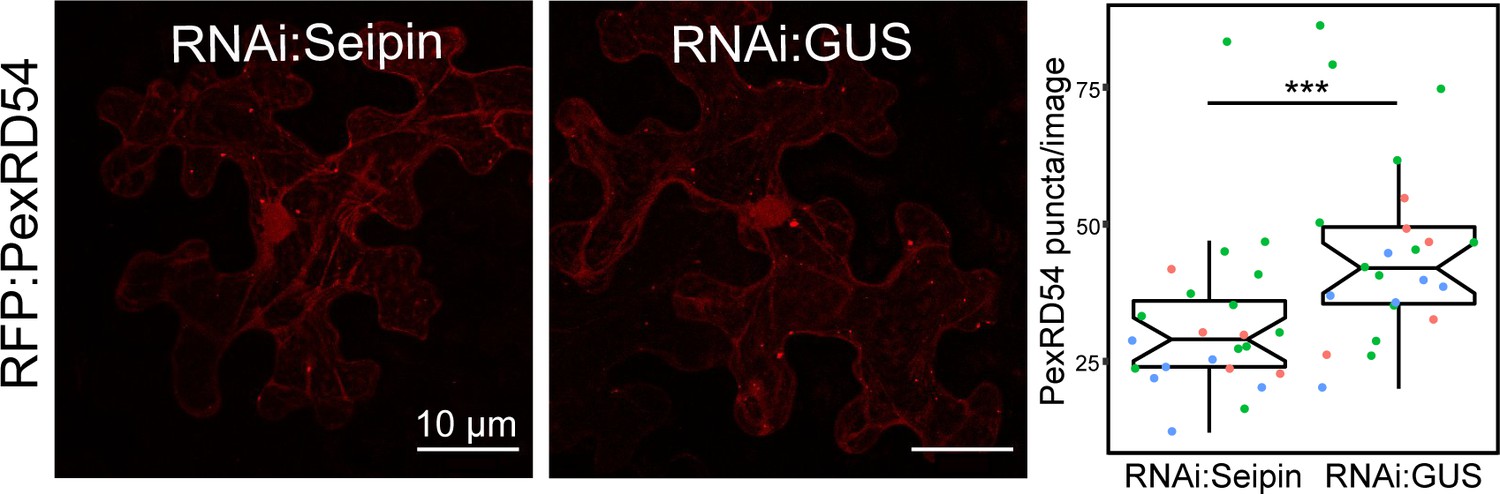
Seipin knockdown reduces the number of PexRD54 puncta.
Confocal micrographs of N. benthamiana leaf epidermal cells transiently expressing RFP:PexRD54 with either RNAi:Seipin or RNAi:GUS. Images shown are maximal projections of 15–25 frames with 1 μm steps. Scale bars represent 10 μm. Scatter-boxplot shows that silencing NbSeipin A (32, N = 23 images quantified) significantly reduced the amount of PexRD54 puncta compared to a GUS silencing control (45, N = 23 images quantified). Statistical differences were analyzed by Welch Two Sample t-test in R. Measurements were significant when p<0.05 (*) and highly significant when p<0.0001(***).
Figure 8 with 8 supplements

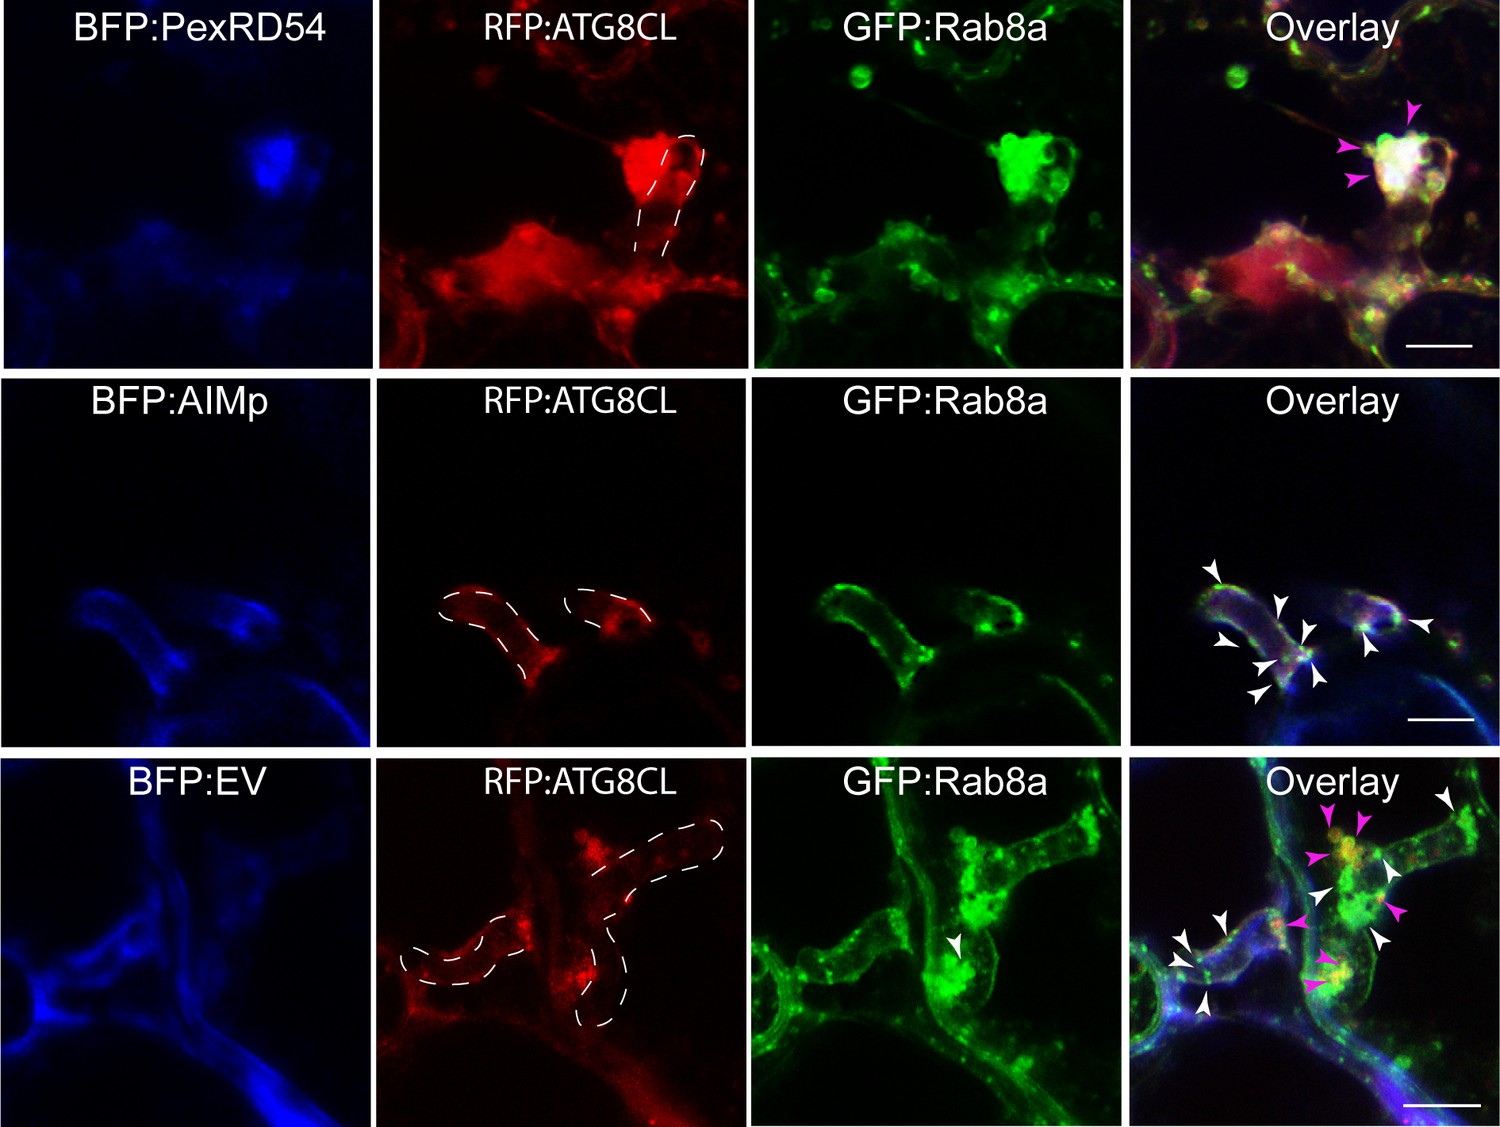
Rab8a is recruited to perihaustorial PexRD54-ATG8CL autophagosomes.
(A-D) Confocal micrographs of P. infestans-infected N. benthamiana leaf epidermal cells transiently expressing either BFP:PexRD54 (A), BFP:EV (B), BFP:AIMp (C) or Joka2:BFP (D), with both RFP:ATG8CL and GFP:Rab8a. BFP:PexRD54 co-localizes with RFP:ATG8CL and GFP:Rab8a at perihaustorial region, whereas Joka2:BFP-labeled ATG8CL puncta are exclusive to GFP:Rab8a puncta. Haustoria are labeled with white dashed lines. Pink arrowheads highlight vesicles labeled by ATG8CL and Rab8a, whereas white arrowheads highlight vesicles labeled by Rab8a only.
-
Figure 8—source data 1
Source data for infection assays.
The ZIP archive contains data sheet values for infection assays in Figure 8—figure supplements 6–8.
- https://cdn.elifesciences.org/articles/65285/elife-65285-fig8-data1-v2.zip
Figure 8—figure supplement 1
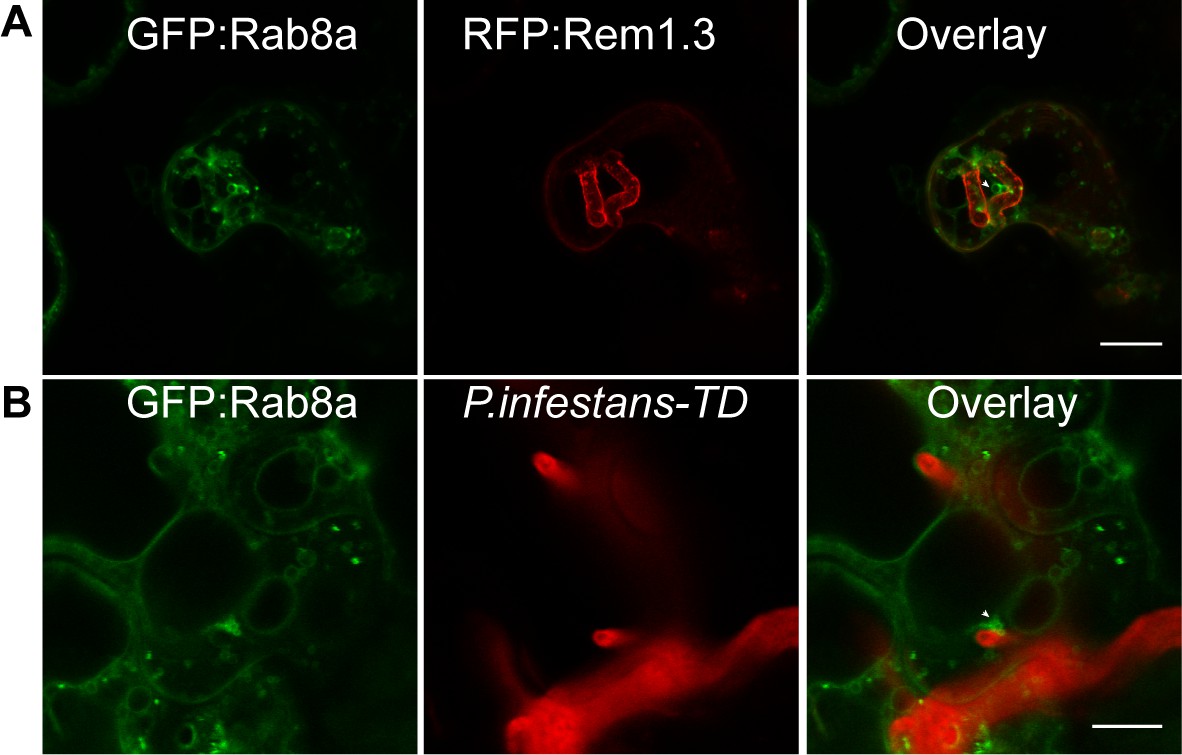
Rab8a localizes to various vesicle-like structures around haustoria during infection with P. infestans.
Maximum projection confocal micrographs of N. benthamiana leaf epidermal cells infected with P. infestans (three dpi) and transiently expressing GFP:Rab8a. (A) Tissue infected with P. infestans 88609 strain and expressing RFP:Rem1.3 to label haustoria. (B) Tissue infected with P. infestans red fluorescent strain 88069-TD. (A, B) White arrowheads highlight P. infestans haustoria. Scale bars represent 10 μm.
Figure 8—figure supplement 2
Two distinct populations of Rab8a vesicles localize to P. infestans haustoria.
Maximum projection confocal micrographs of N. benthamiana leaf epidermal cells infected with P. infestans (3 dpi) and transiently expressing RFP:ATG8CL, GFP:Rab8a and either BFP:PexRD54, BFP:AIMp, or BFP:EV. White arrowheads highlight vesicles labeled by Rab8a only. Pink arrowheads highlight vesicles labeled by ATG8CL and Rab8a. White dotted lines highlight P. infestans haustoria. Scale bars represent 5 μm.
Figure 8—figure supplement 3
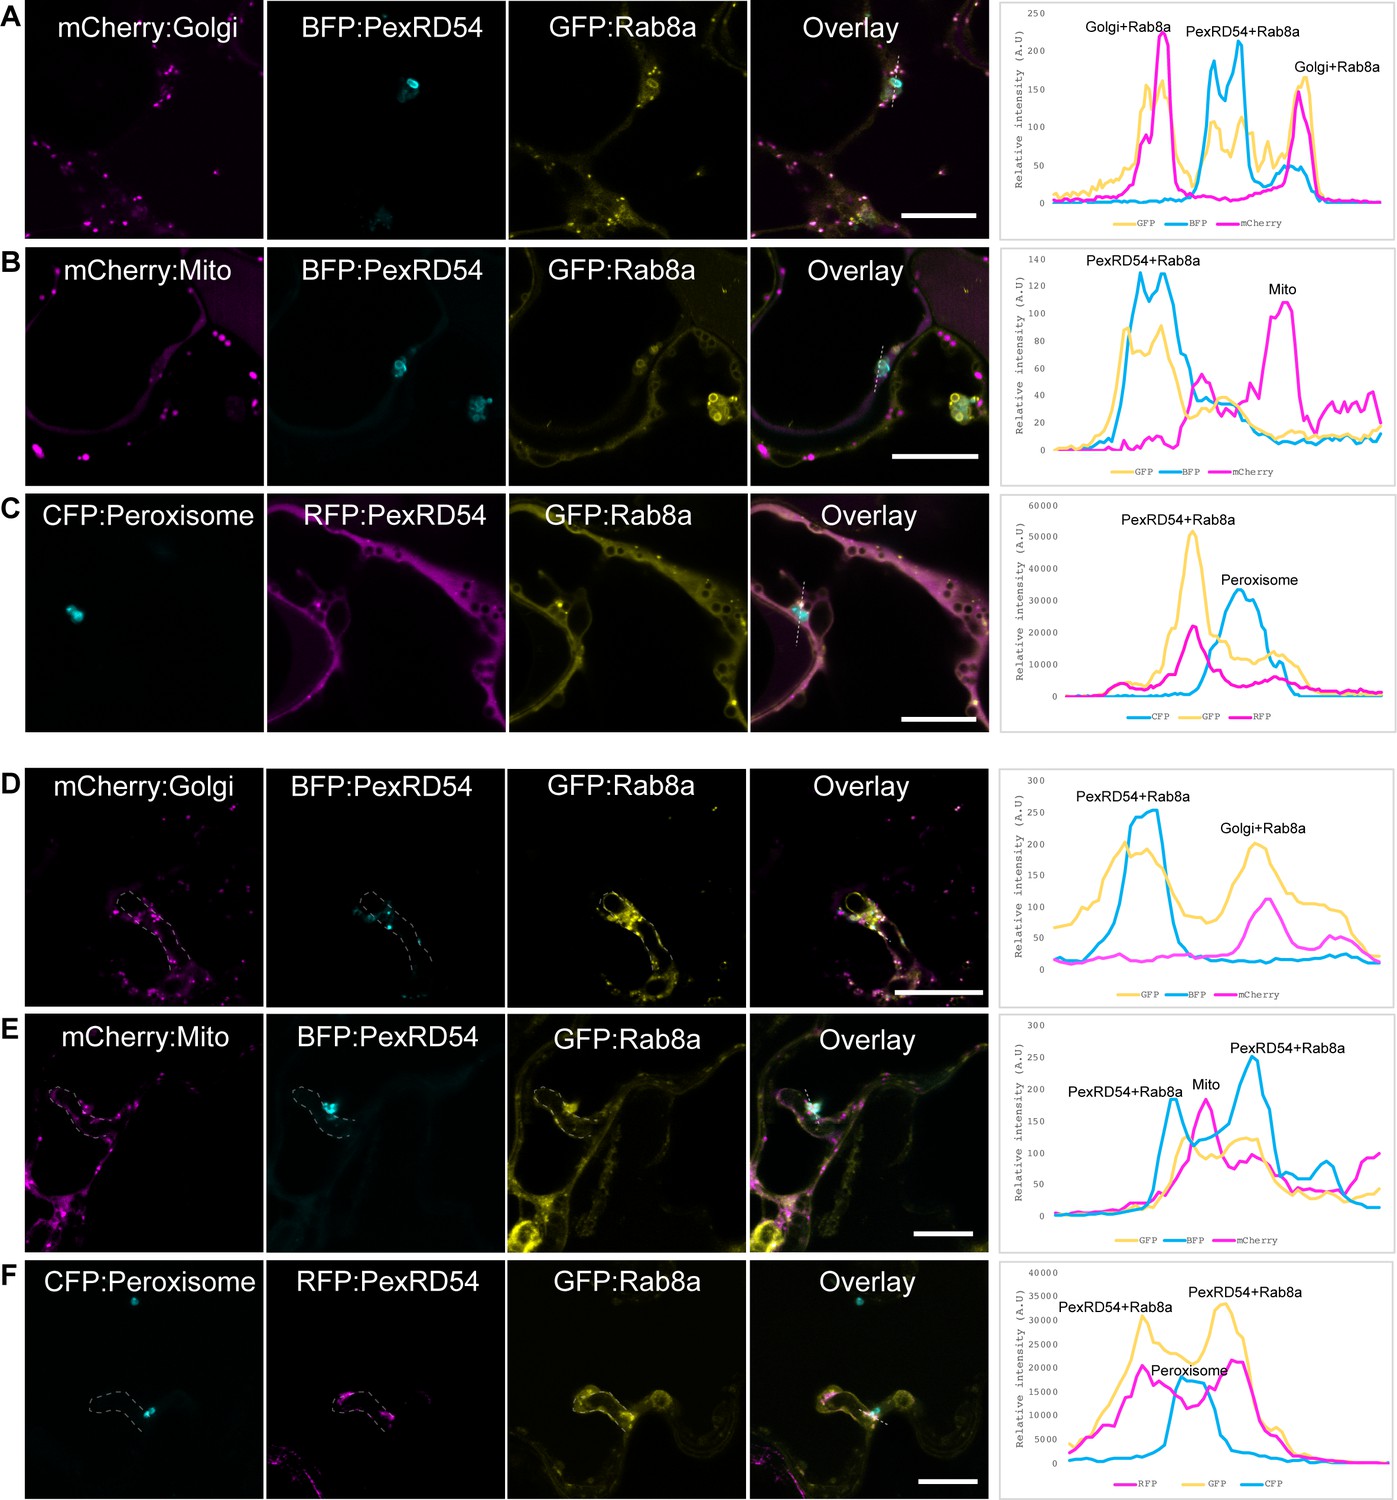
Rab8a localizes to PexRD54-autophagosomes or Golgi, but not to mitochondria or peroxisomes.
(A–C) Confocal micrographs of N. benthamiana leaf epidermal cells transiently expressing (A) GFP:Rab8a, BFP:PexRD54, and GmMan11-49-mCherry (Golgi marker) or (B) GFP:Rab8a, BFP:PexRD54, and ScCOX41-29-mCherry (mCherry:Mito) (C) GFP:Rab8a, RFP:PexRD54, and CFP-GLOX (peroxisome marker). (D–E) Confocal micrographs of N. benthamiana leaf epidermal cells infected with P. infestans (three dpi) and transiently expressing (D) GFP:Rab8a, BFP:PexRD54, and GmMan11-49-mCherry (Golgi marker) or (E) GFP:Rab8a, BFP:PexRD54, and ScCOX41-29-mCherry (mCherry:Mito) (F) GFP:Rab8a, RFP:PexRD54, and CFP-GLOX (peroxisome marker). Scale bars represent 10 μm. Dotted lines in individual channels highlight P. infestans haustoria, whereas transects in overlay panel correspond to plot of relative fluorescence over the labeled distance.
Figure 8—figure supplement 4
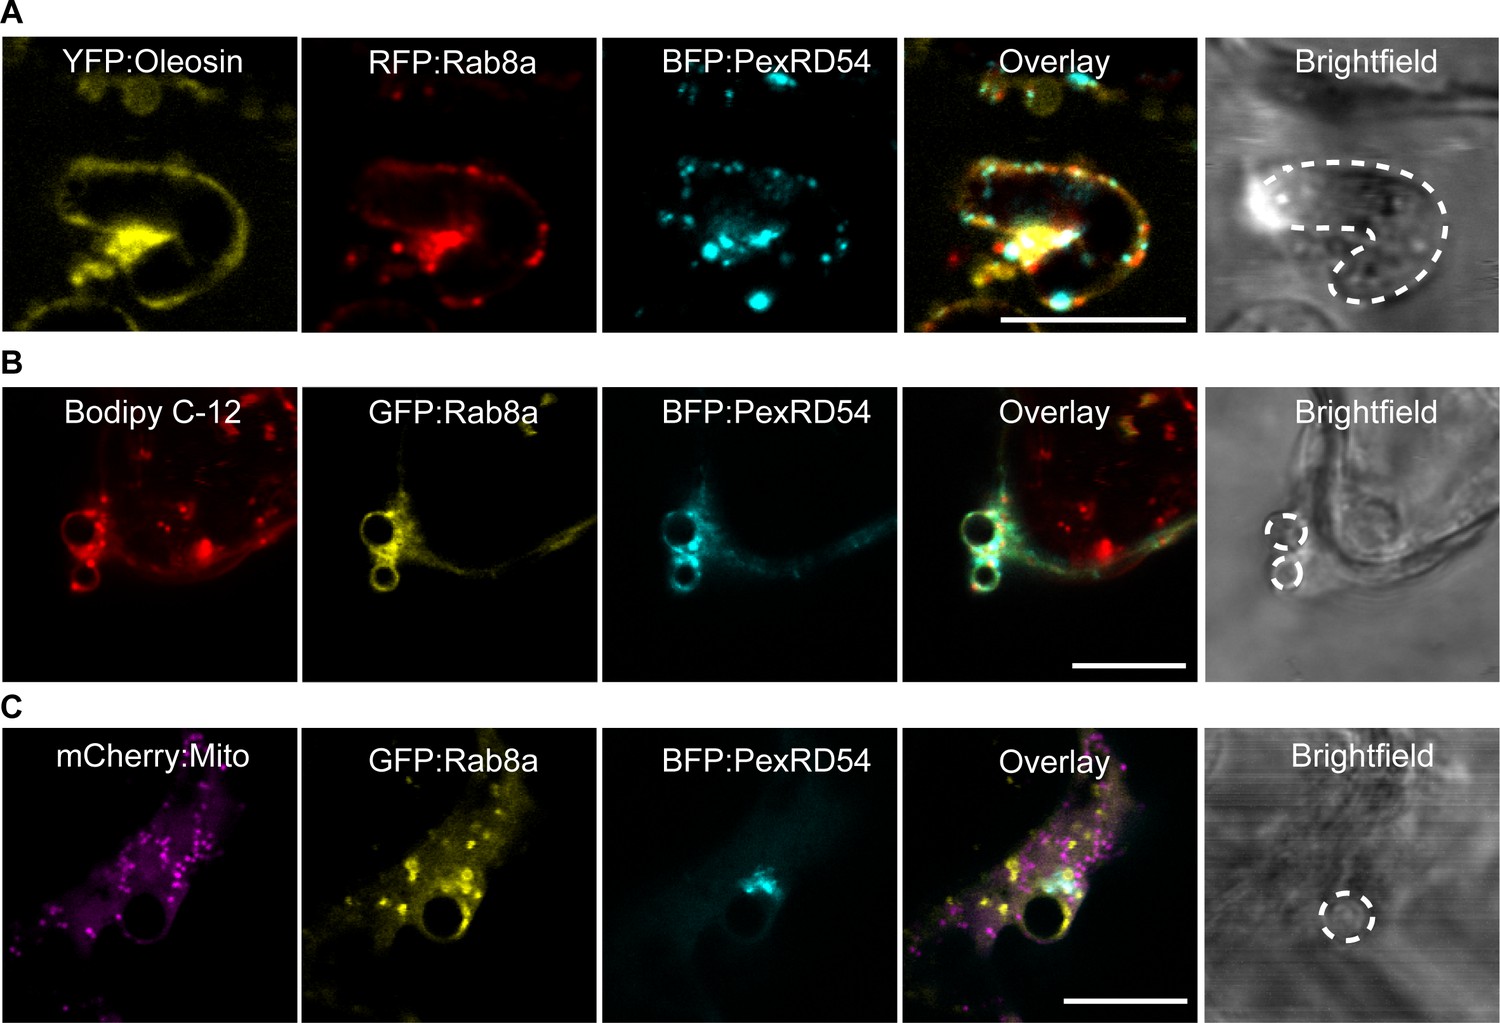
Rab8a colocalizes with PexRD54, Oleosin and Bodipy C-12, but not with the mitochondria marker, in puncta around P. infestans haustoria.
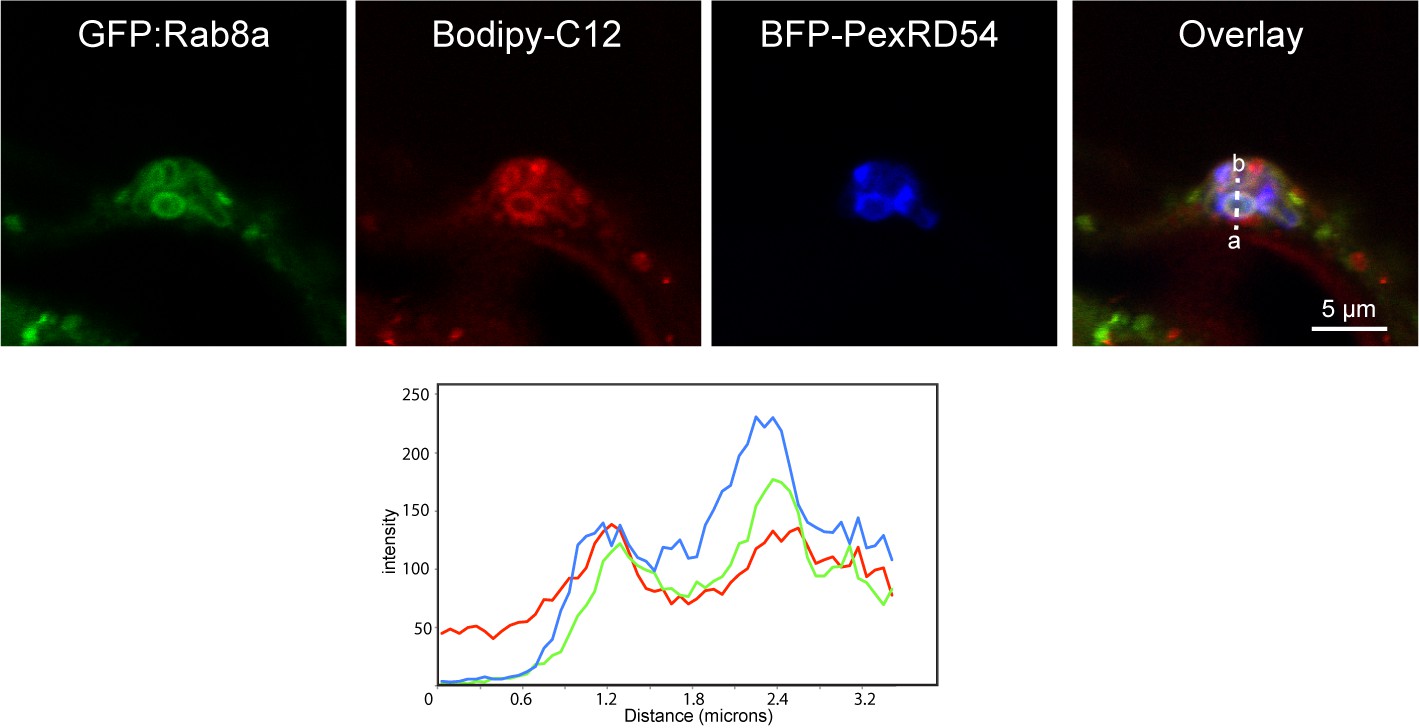
Confocal micrographs of N. benthamiana leaf epidermal cells infected with P. infestans (3 dpi) and transiently expressing (A) RFP:Rab8a, BFP:PexRD54, and YFP:Oleosin or (B) GFP:Rab8a, BFP:PexRD54 and stained with Bodipy C-12 (C) mCherry:Mito (ScCOX41-29-mCherry), GFP:Rab8a and BFP:PexRD54. Scale bars represent 10 μm. Dotted lines highlight P. infestans haustoria.
Figure 8—figure supplement 5
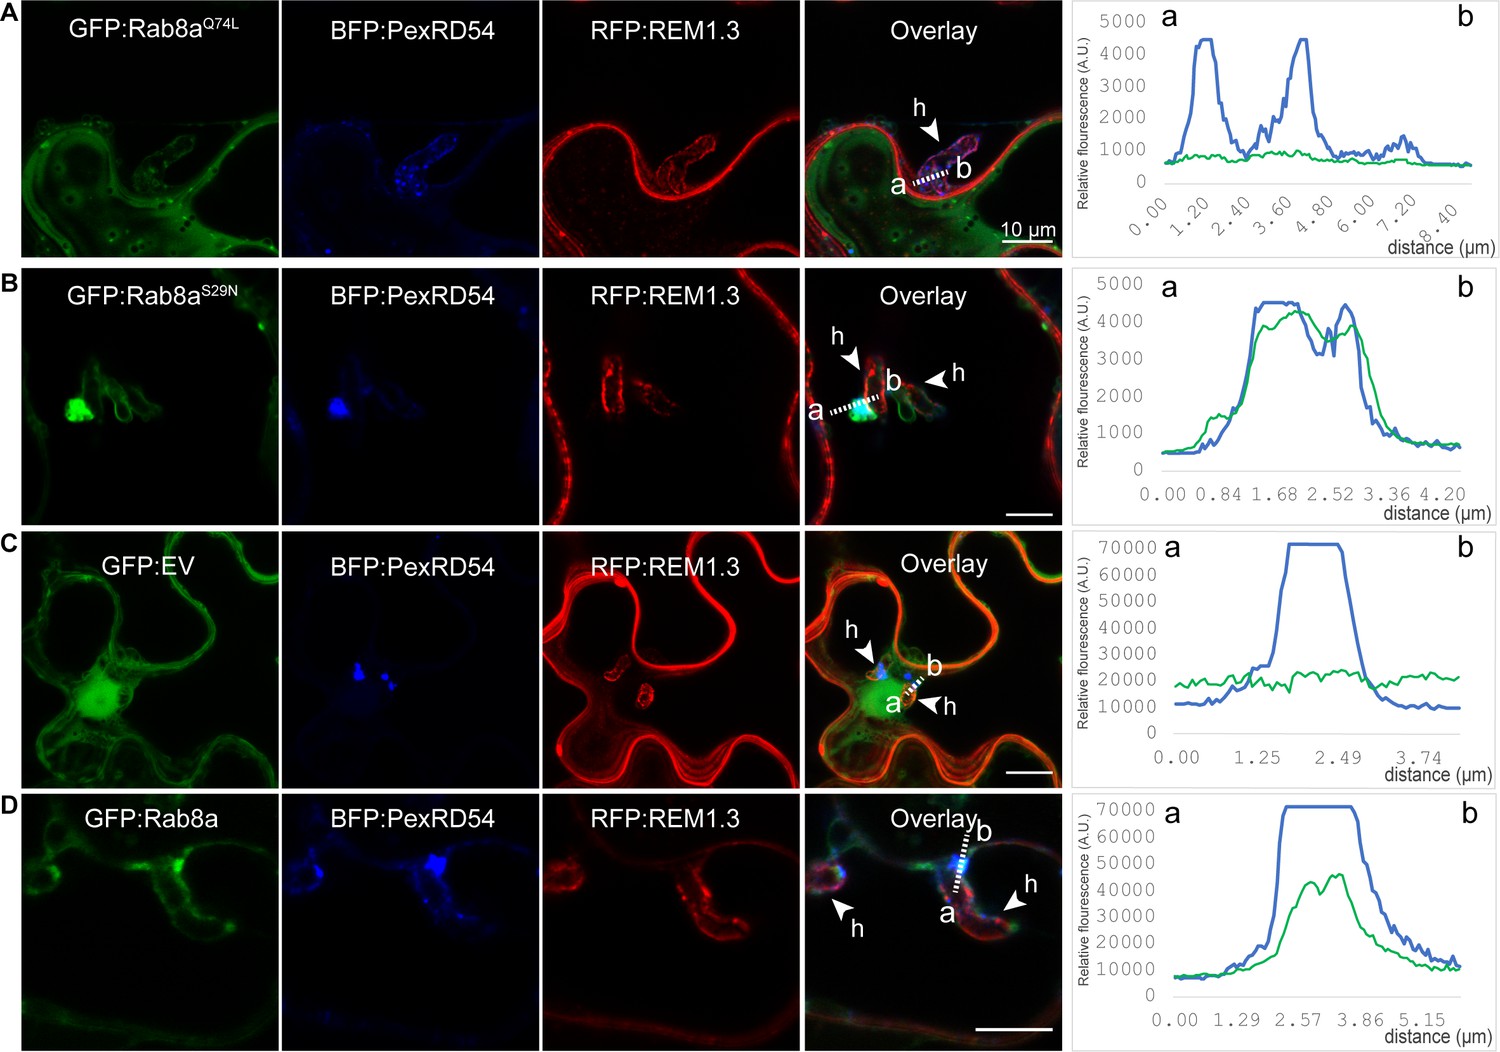
Localisation of Rab8a and its mutants in perihaustorial autophagosomes during infection by P. infestans.
Maximum projection confocal micrographs of N. benthamiana leaf epidermal cells infected with P. infestans (3 dpi) and transiently expressing either GFP Rab8a GTP (A), GFP Rab8a GDP (B), GFP (C), or GFP Rab8a (D) with BFP PexRD54 and RPF Remorin 1.3. White arrows show haustoria. Transects in overlay panel correspond to plot of relative fluorescence over the labeled distance. Scale bars represent 10 μm.
Figure 8—figure supplement 6
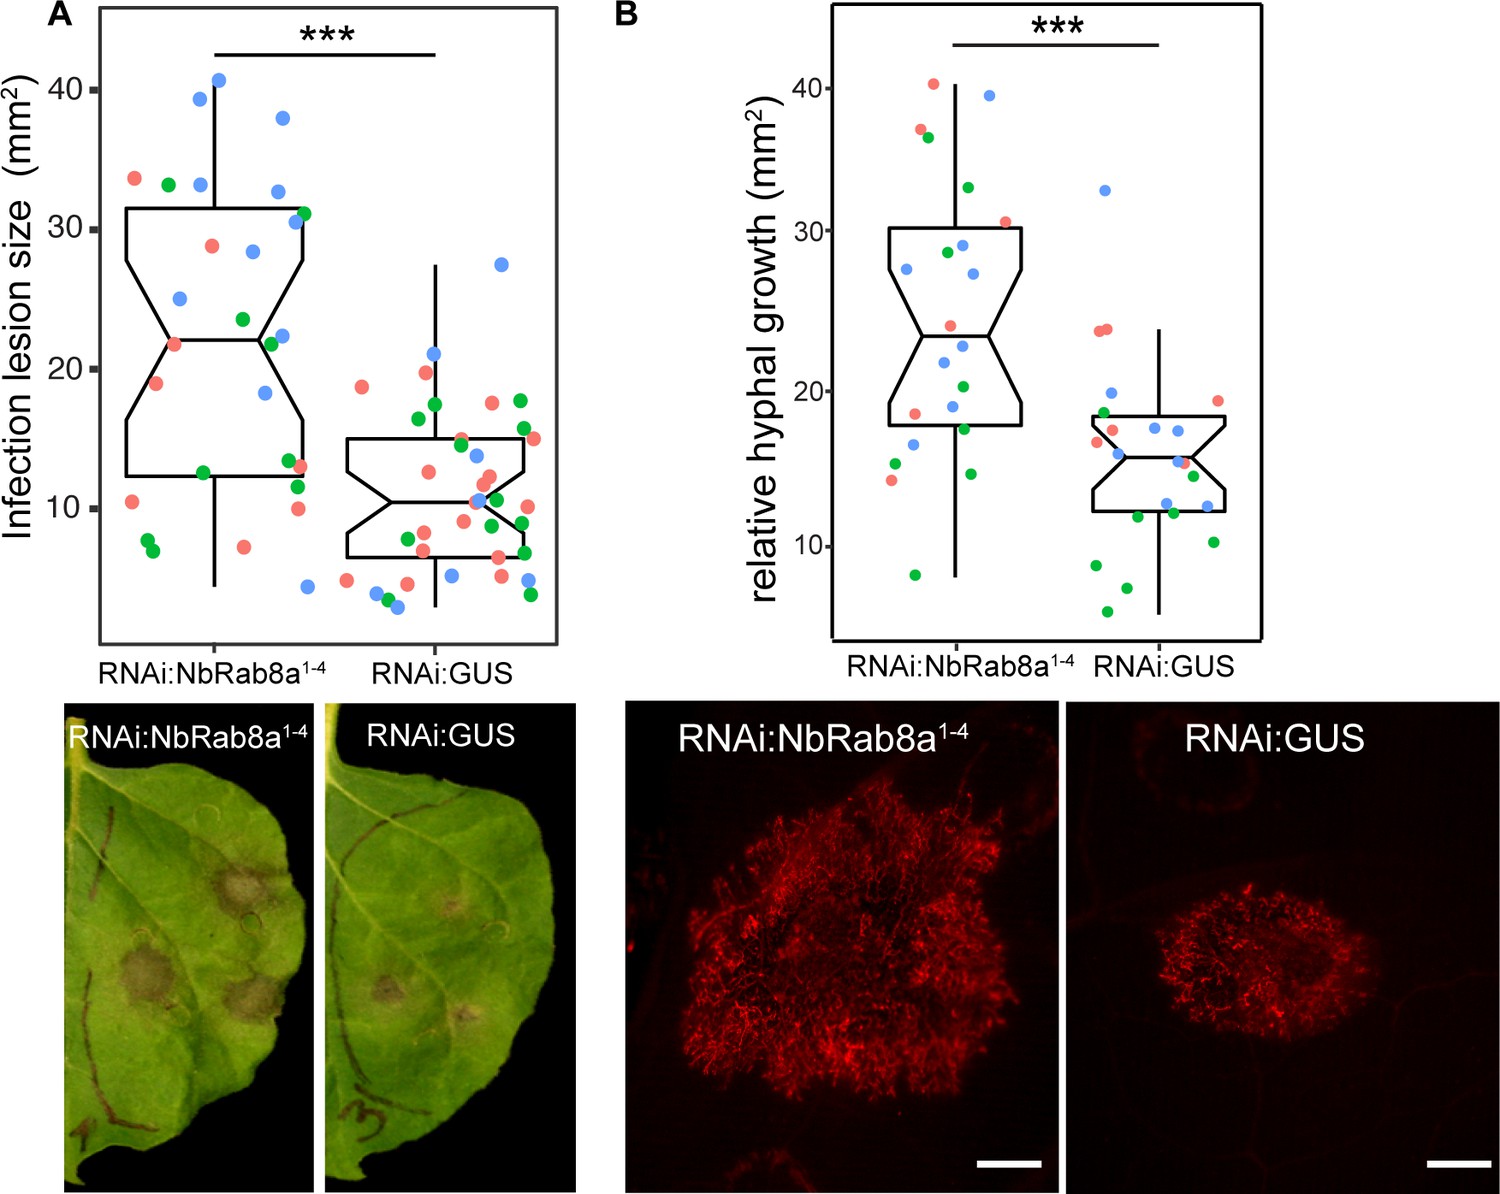
Rab8a positively contributes to immunity to P. infestans.
(A) Silencing endogenous Rab8a 1–4 significantly increases P. infestans infection lesion size (22, N = 28 infected leaves) compared to a silencing control (11, N = 37 infected leaves). N. benthamiana leaves expressing RNAi:NbRab8a1-4 or RNAi:GUS were infected with P. infestans and pathogen growth was determined by measuring infection lesion size 7 days post-inoculation. (B) Silencing of homologs 1–4 of Rab8a (25 mm2, N = 22 infected leaves) significantly increases P. infestans hyphal growth compared to a silencing control (16 mm2 N = 22 infected leaves). N. benthamiana leaves expressing RNAi:NbRab8a1-4 or RNAi:GUS were infected with P. infestans tdTomato and pathogen growth was determined by epifluorescence microscopy 5 days post-inoculation. Scale bars represent 1 mm.
Figure 8—figure supplement 7
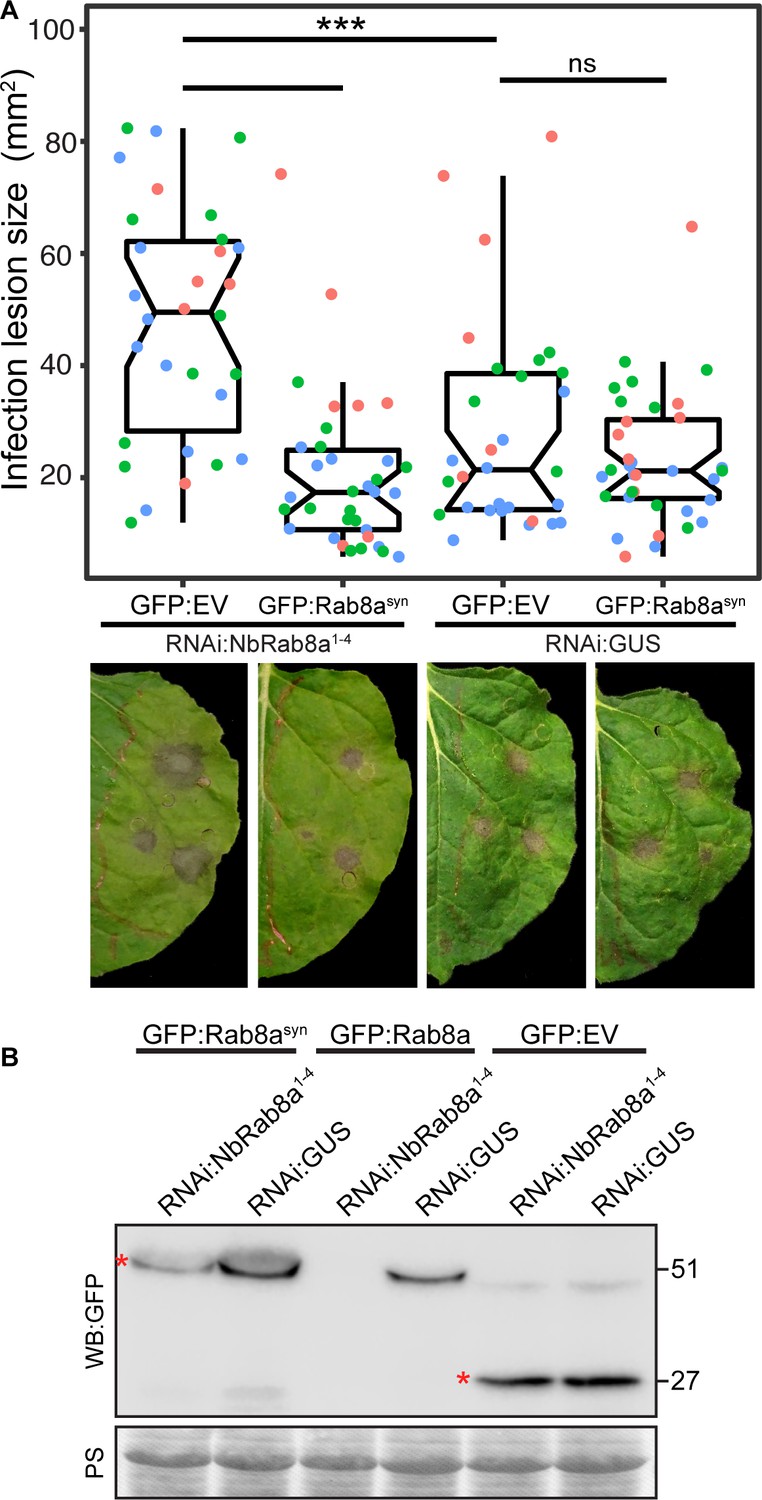
Silencing resilient synthetic Rab8a (Rab8asyn) rescues enhanced pathogen susceptibility phenotype caused by NB:Rab8a1-4 silencing.
(A) Complementing Rab8a 1–4 silencing with a silencing resistant GFP:Rab8asyn (NbRab8a-1) recovers resistance to P. infestans. When Rab8a 1–4 is silenced, expression of GFP:Rab8asyn significantly reduces P. infestans infection lesion size (20, N = 30 infected leaves) compared to an empty vector control (61, N = 30 infected leaves). When a silencing control is expressed, expression of GFP:Rab8asyn does not affect P. infestans infection lesion size (23, N = 28 infected leaves) compared to an empty vector (28, N = 31 infected leaves). Pathogen growth was determined by measuring infection lesion size 7 days post-inoculation. (B) Synthetic GFP:Rab8asyn is more resistant to silencing by RNAi:NbRab8a1-4 compared to GFP:Rab8a. Western-blot analysis shows that GFP:Rab8asyn shows significantly higher protein levels compared to GFP:Rab8a when RNAi:NbRab8a1-4 is co-expressed. RNAi:NbRab8a1-4 does not affect GFP:EV protein levels compared to RNAi:GUS. Total protein extracts were isolated 4 days after infiltration and immunoblotted. Red asterisks indicate expected band sizes. Protein sizes in kDa.
Figure 8—figure supplement 8
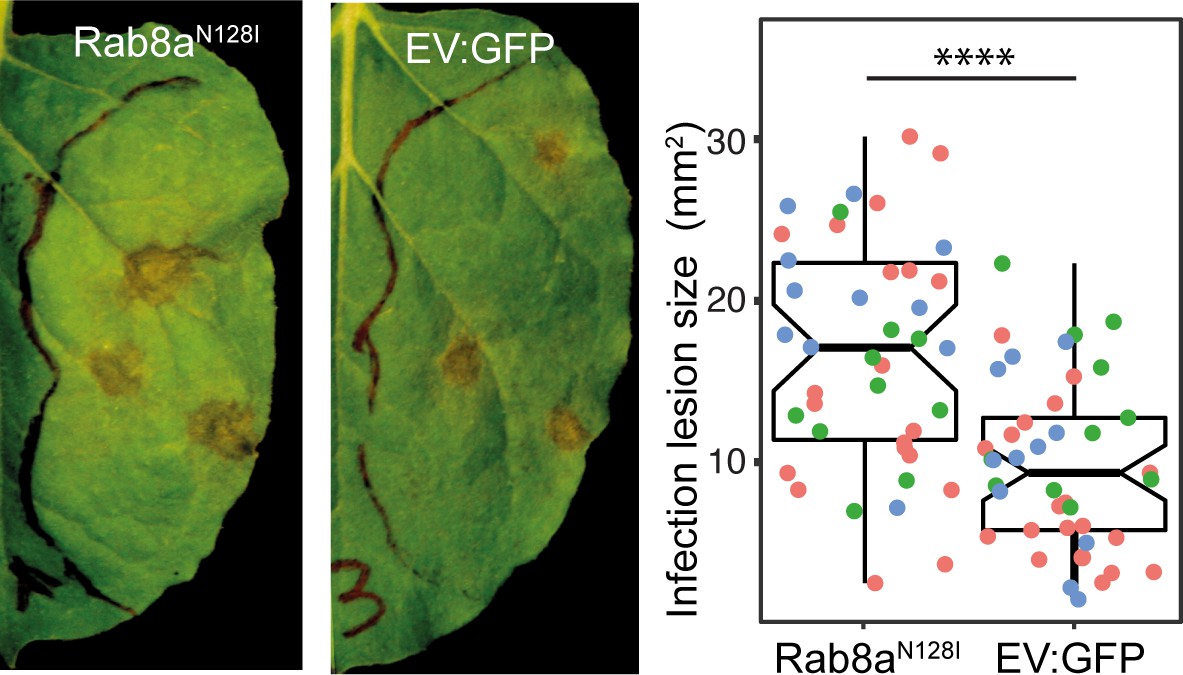
Overexpression of Rab8aN128I significantly increases P.
infestans hyphal growth. Expression of GFP:Rab8aN128I (36, N = 42 infected leaves ) significantly increases P. infestans necrotic lesion size compared to an empty vector GFP control (20, N = 41 infected leaves). Pathogen growth was determined by measuring infection lesion size 7 days post-inoculation.
Figure 9

AIM peptide mediated arrest of ATG8 autophagy negatively affects P. infestans infection.
(A) Confocal micrographs of P. infestans-infected N. benthamiana leaf epidermal cells transiently expressing either RFP:AIMp (top), RFP:PexRD54 (middle), or PM-haustorial marker RFP:Rem1.3 (bottom), with GFP:ATG8CL. Haustoria are labeled with white dashed lines. (B) Co-expressing RFP:AIMp with GFP:ATG8CL substantially decreases the percentage of haustoria associated with ATG8CL-labeled puncta (26%, N = 178 haustoria), compared to PexRD54 (79%, N = 96 haustoria) and haustorial marker control RFP:Rem1.3 (66%, N = 165 haustoria). Statistical differences were analyzed by Pearson’s chi-squared test in R. Measurements were significant when p<0.05 (*) and highly significant when p<0.001(***). (C) AIMp reduces disease symptoms of P. infestans (65, N = 84 infected leaves) compared to empty vector control (87, N = 85 infected leaves). N. benthamiana leaves expressing RFP:AIMp and RFP:EV were infected with P. infestans and pathogen growth was determined by measuring infection lesion size 7 days post-inoculation. (D) Box plot shows relative infection lesion size of 84 and 85 infection sites from five biological replicates, respectively. Scattered points indicate individual data points and different colors represent various biological repeats. Statistical differences were analyzed by Welch Two Sample t-test in R. Measurements were significant when p<0.05 (*) and highly significant when p<0.001(***).
-
Figure 9—source data 1
Source data for infection assays.
Data sheet values for infection assays performed in Figure 9D.
- https://cdn.elifesciences.org/articles/65285/elife-65285-fig9-data1-v2.zip
Figure 10
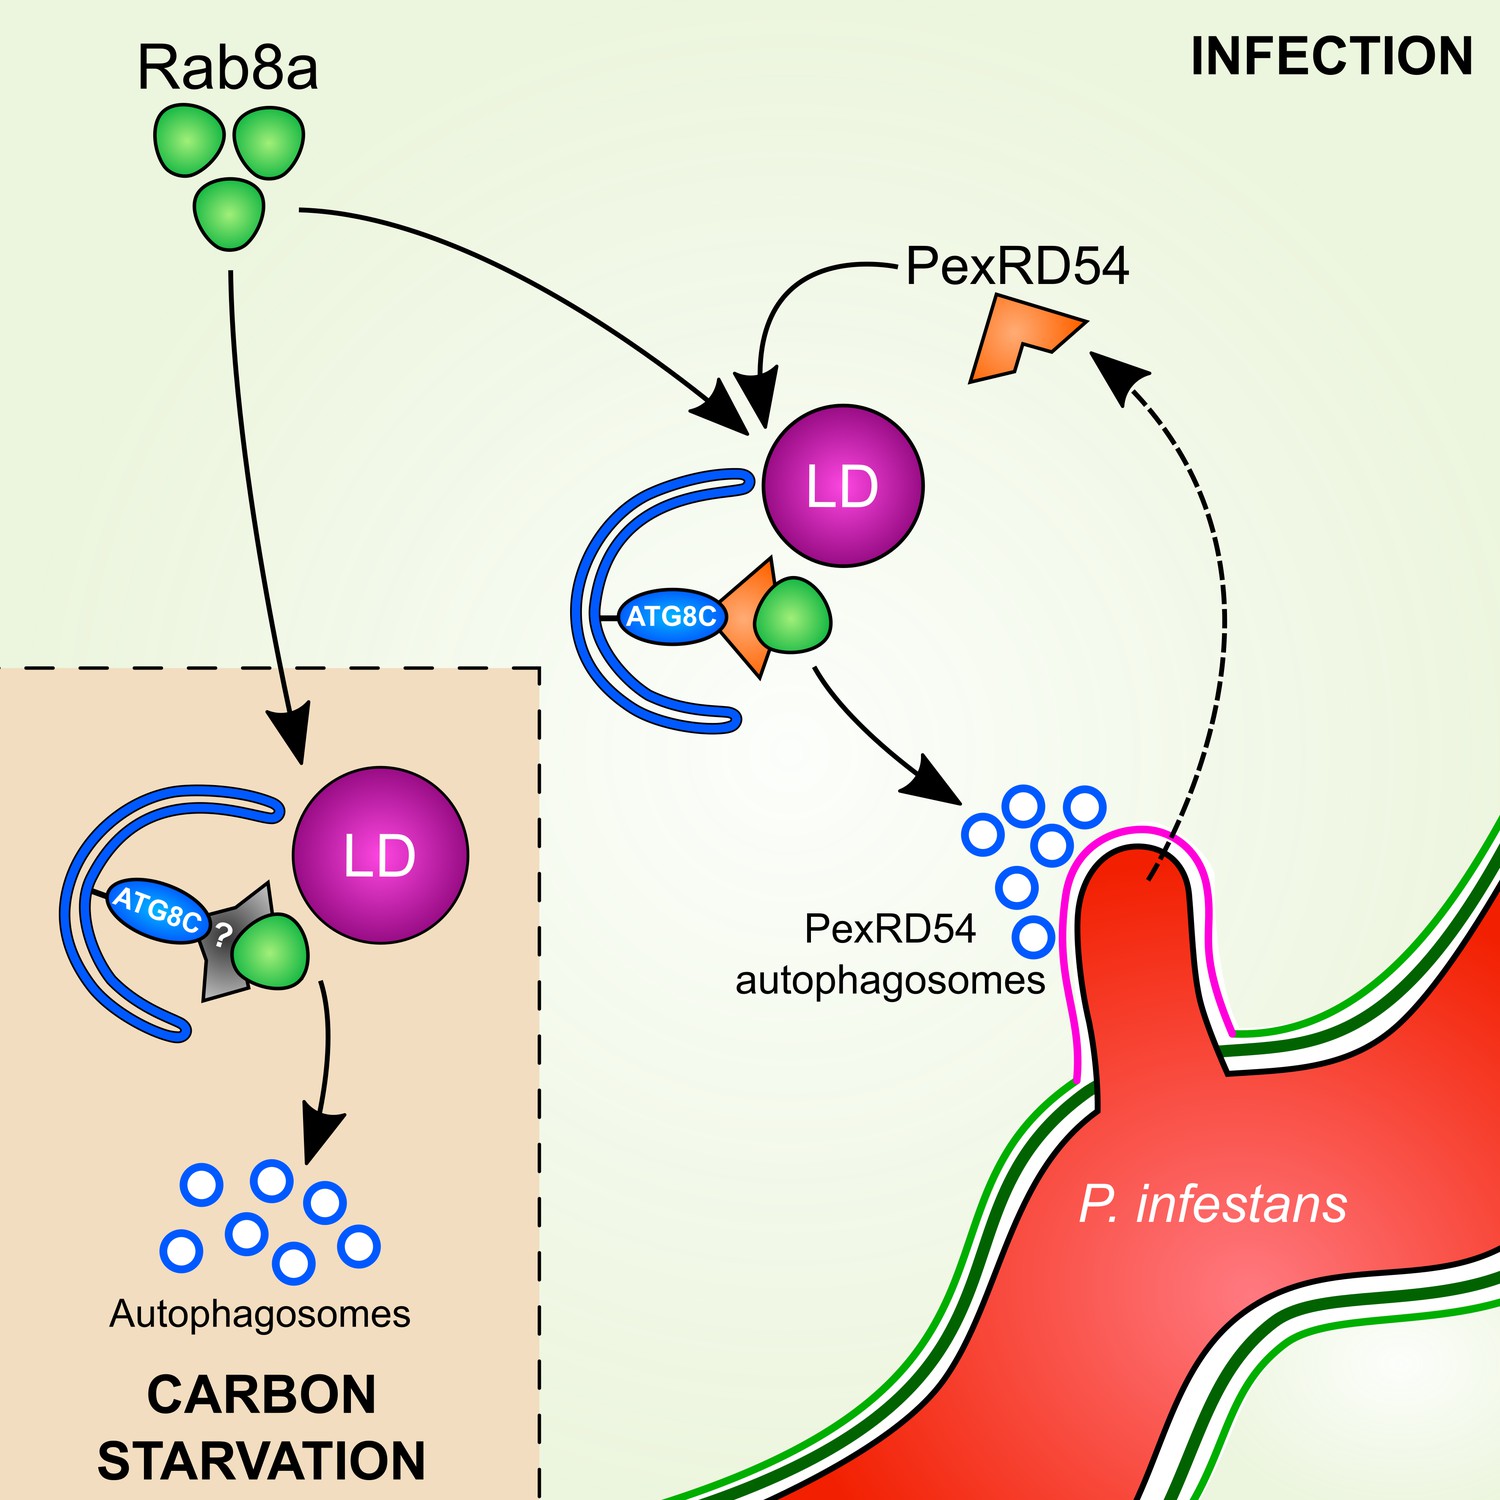
Model for PexRD54 subversion of host vesicle trafficking to stimulate autophagosome biogenesis at the haustorial interface.
Under carbon starvation conditions, Rab8a recruits lipid droplets (LDs) to the phagophore assembly site that contains ATG8CL to drive starvation-induced autophagy, possibly via an unknown cargo receptor or adaptor protein. During P. infestans infection, the RXLR effector PexRD54 is translocated inside the host cells across the extra-haustorial membrane (magenta). Inside the host cells PexRD54 interacts with the host autophagy protein ATG8CL and co-opts Rab8a to recruit LDs and induce the formation of autophagosomes which are directed towards the haustoria.
Videos
Video 1
Rab8a localizes to small mobile vesicles and large ring-shaped structures.
GFP:Rab8a is co-expressed with the EHM marker RFP:REM1.3 via agroinfiltration in N. benthamiana leaf epidermal cells. Confocal laser scanning microscopy was used to monitor Rab8a-labeled vesicles 3 days post infiltration. The movie represents time-lapse of 76 frames acquired during 3 min 48 s (Frame interval: 3 s).
Video 2
Mobile PexRD54/Rab8a-positive puncta co-migrate with ATG9 vesicles.
RFP:Rab8a, BFP:PexRD54, and ATG9-GFP are co-expressed three via agroinfiltration in N. benthamiana leaf epidermal cells. Confocal laser scanning microscopy was used to monitor PexRD54/Rab8a-labeled vesicles and ATG9 compartments 3 days post infiltration. The movie represents time-lapse of 28 frames acquired during 4 min 12 s (Frame interval: 9 s).
Video 3
Mobile PexRD54/Rab8a-positive puncta co-migrate with Bopidy-C12-labeled lipid droplets.
GFP:Rab8a, BFP:PexRD54 are co-expressed three via agroinfiltration in N. benthamiana leaf epidermal cells stained with the lipid droplet dye Bodipy-C12. Confocal laser scanning microscopy was used to monitor PexRD54/Rab8a-labeled vesicles and lipid droplets 3 days post infiltration. The movie represents time-lapse of 56 frames acquired during 56 s (Frame interval: 1 s).
Video 4
Rab8a localizes to small mobile vesicles at haustoria during P. infestans infection.
GFP:Rab8a, RFP:ATG8CL, and BFP:PexRD54 are co-expressed via agroinfiltration in N. benthamiana leaf epidermal cells infected with P. infestans. Confocal laser scanning microscopy was used to monitor Rab8a-labeled vesicles 3 days post infection. The movie represents time-lapse of 45 frames acquired during 3 min (Frame interval: 4 s).
Video 5
Rab8a localizes to large vacuole-like structures at haustoria during P. infestans infection.
GFP:Rab8a is co-expressed with the EHM marker RFP:REM1.3 via agroinfiltration in N. benthamiana leaf epidermal cells infected with P. infestans. Confocal laser scanning microscopy was used to monitor Rab8a-labelled vesicles 3 days post infection. The movie represents time-lapse of 26 frames acquired during 26 min (Frame interval: 30 s).
Tables
Key resources table
| Reagent type (species) or resource | Designation | Source or reference | Identifiers | Additional information |
|---|---|---|---|---|
| Gene (Solanum Tuberosum) | StRab8a (Rab8a) | Sol Genomics Network | Sotub04g010260.1 | |
| Gene (Nicotiana benthamiana) | NbRab8a-1 | Sol Genomics Network | Niben101Scf07650g01021 | |
| Gene (Nicotiana benthamiana) | NbRab8a-2 | Sol Genomics Network | Niben101Scf09596g00001 | |
| Gene (Nicotiana benthamiana) | NbRab8a-3 | Sol Genomics Network | Niben101Scf00684g00002 | |
| Gene (Nicotiana benthamiana) | NbRab8a-4 | Sol Genomics Network | Niben101Scf03277g02014 | |
| Gene (Nicotiana benthamiana) | NbSeipin-A | Sol Genomics Network | Niben101Scf01983g13002 | |
| Gene (Nicotiana benthamiana) | NbSeipin-B | Sol Genomics Network | Niben101Scf03695g01004 | |
| Biological sample (Nicotiana benthamiana) | Nb-GFP-StRab8a seeds | This paper | Seeds are maintained at Bozkurt lab (ICL) | |
| Antibody | Anti-GFP (Rabbit polyclonal) | Chromotek | Cat# PABG1-100 RRID:AB_2749857 | WB: 1:1000 |
| Antibody | Anti-HA (Rat monoclonal) | Chromotek | Cat# 7c9-100 RRID:AB_2827568 | WB: 1:1000 |
| Antibody | Anti-RFP (Rat monoclonal) | Chromotek | Cat# 6g6-100 RRID:AB_2631395 | WB: 1:1000 |
| Antibody | Anti-FLAG (Mouse monoclonal) | Sigma-Aldrich | Cat# F3165 RRID:AB_259529 | WB: 1 µg/mL |
| Antibody | Anti-tRFP (Mouse monoclonal) | Evrogen | Cat# AB233, RRID:AB_2571743 | WB: 1:1000 |
| Peptide, recombinant protein | AIMpSyn | This paper | Peptide Sequence | RKKRRRESRKKRRRESKPLDFDWEIV |
| Peptide, recombinant protein | mAIMpSynAA | This paper | Peptide Sequence | RKKRRRESRKKRRRESKPLDFDAEIA |
| Sequence-based reagent | GA_RD54_F | This paper | PCR Primers | CTGGATCTGGAGAATTTGATGTTGGTCCCTCTTGGCT |
| Sequence-based reagent | GA_RD54_R | This paper | PCR Primers | TAGCATGGCCGCGGGATTTACACAATTTCCCAGTCG |
| Sequence-based reagent | GA_LIR2_R | This paper | PCR Primers | TAGCATGGCCGCGGGATTTAAGCAATTTCCGCGTCG |
| Sequence-based reagent | GA_AIMp_F | This paper | PCR Primers | CTGGATCTGGAGAATTTGATCGGGACAAAATTGACAAGA |
| Sequence-based reagent | GA_ATG8C_F | This paper | PCR Primers | CTGGATCTGGAGAATTTGATGCCAAAAGCTCCTTCAAA |
| Sequence-based reagent | GA_ATG8C_R | This paper | PCR Primers | TAGCATGGCCGCGGGATTCAAAAGGATCCGAAGGTAT |
| Sequence-based reagent | GAJoka2BFP_F | This paper | PCR Primers | CAGGCGGCCGCACTAGTGATATGGCTATGGAGTCATCTATTGTGATCAAGG |
| Sequence-based reagent | GAJoka2BFP_R | This paper | PCR Primers | GCAGATCCAGCAGATCCGATCTGCTCTCCAGCAATAAGATCCATCACAAC |
| Sequence-based reagent | NbRab8A_silF1 | This paper | PCR Primers | ACCAGGTCTCAGGAGGGCTTATATAAATGAAGCGAC |
| Sequence-based reagent | NbRab8A_silR1 | This paper | PCR Primers | ACCAGGTCTCATCGTACTTCTGCAATCGCGTGCGT CCGAAGGTAT |
| Sequence-based reagent | GW_StRab8a-1_F | This paper | PCR Primers | CACCATGGCCGCTCCACCCGCTAGAGCTCGAGCT |
| Sequence-based reagent | GW_StRab8a-1_R | This paper | PCR Primers | TTAAGAACCACAGCAAGCTGATTTTTGGGCG |
| Sequence-based reagent | Rab8aS29N_F | This paper | PCR Primers | GTTCTTACCCACACCGCTGTCGCCG |
| Sequence-based reagent | Rab8aS29N R | This paper | PCR Primers | TGCCTTCTTTTACGTTTCTCAGATG |
| Sequence-based reagent | Rab8aQ74L_F | This paper | PCR Primers | AAACCGGCGGTATCCCAGATTTGCAG |
| Sequence-based reagent | Rab8aQ74L_R | This paper | PCR Primers | GGAGCGGTTCCGAACAATTACAACT |
| Sequence-based reagent | Rab8aN128I_F | This paper | PCR Primers | ATGCCGACCAGAATTTTGTTGACATTG |
| Sequence-based reagent | Rab8aN128I_R | This paper | PCR Primers | CAAGGCTGACATGGATGAAAGCAAAAGG |
| Sequence-based reagent | Rab8a1-4-RNAi_F1 | This paper | PCR Primers | ACCAGGTCTCAGGAGGCAGCTCCACCAGCTAGG |
| Sequence-based reagent | Rab8a1-4-RNAi_R1 | This paper | PCR Primers | ACCAGGTCTCAGTGAAGGAACCATCTGAGAAC |
| Sequence-based reagent | Rab8a1-4-RNAi_F2 | This paper | PCR Primers | ACCAGGTCTCATCACACCACTATTGGTATTGAT |
| Sequence-based reagent | Rab8a1-4-RNAi_R2 | This paper | PCR Primers | ACCAGGTCTCAATTGTTCGGAAACGCTCCTGG |
| Sequence-based reagent | Rab8a1-4-RNAi_F3 | This paper | PCR Primers | ACCAGGTCTCACAATCAAGATAAGGACCATTGAGT |
| Sequence-based reagent | Rab8a1-4-RNAi_R3 | This paper | PCR Primers | ACCAGGTCTCATCGTCATGTCAGCCTTGTTGCCG |
| Sequence-based reagent | NYFP-Oleosin F | This paper | PCR Primers | GCAGAAGGTTATGAACCACGATGCAGATTACTATGGGCAGCAACATAC |
| Sequence-based reagent | Oleosin-CYFP R | This paper | PCR Primers | TCTGCTTAACCATGTTGTGGATACTCTGCTGGGTTCCAGTGACATG |
| Sequence-based reagent | GA_35S_HA_F | This paper | PCR Primers | GCCGCACTAGTGATATGTACCCA |
| Sequence-based reagent | GA_Term_R | This paper | PCR Primers | ATTTTTGCGGACTCTAGCATGG |
| Sequence-based reagent | GAPDH_F | This paper | PCR Primers | ATGGCTTCTCATGCAGCTTT |
| Sequence-based reagent | GAPDH_R | This paper | PCR Primers | ATCCTGTGGTCTTGGGAGTG |
| Sequence-based reagent | RFP F: | This paper | PCR Primers | CTGGACATCACCTCCCACAACGAGG |
| Sequence-based reagent | Term R: | This paper | PCR Primers | CACATGAGCGAAACCCTATAAGAACCCTA |
| Sequence-based reagent | GLOX- F | This paper | PCR Primers | CACCATGGCGGAGACGGTCACCAATGTAT |
| Sequence-based reagent | GLOX- R | This paper | PCR Primers | TTACATCCTCGGCAGGGG |
Additional files
-
Source data 1
Statistical_Summary for all figures.
- https://cdn.elifesciences.org/articles/65285/elife-65285-data1-v2.xlsx
-
Transparent reporting form
- https://cdn.elifesciences.org/articles/65285/elife-65285-transrepform-v2.docx
Download links
A two-part list of links to download the article, or parts of the article, in various formats.
Downloads (link to download the article as PDF)
Open citations (links to open the citations from this article in various online reference manager services)
Cite this article (links to download the citations from this article in formats compatible with various reference manager tools)
An oomycete effector subverts host vesicle trafficking to channel starvation-induced autophagy to the pathogen interface
eLife 10:e65285.
https://doi.org/10.7554/eLife.65285


