The corticospinal tract primarily modulates sensory inputs in the mouse lumbar cord
- Institut des Neurosciences Cellulaires et Intégrées, CNRS - Université de Strasbourg, France
Figures
Figure 1 with 3 supplements
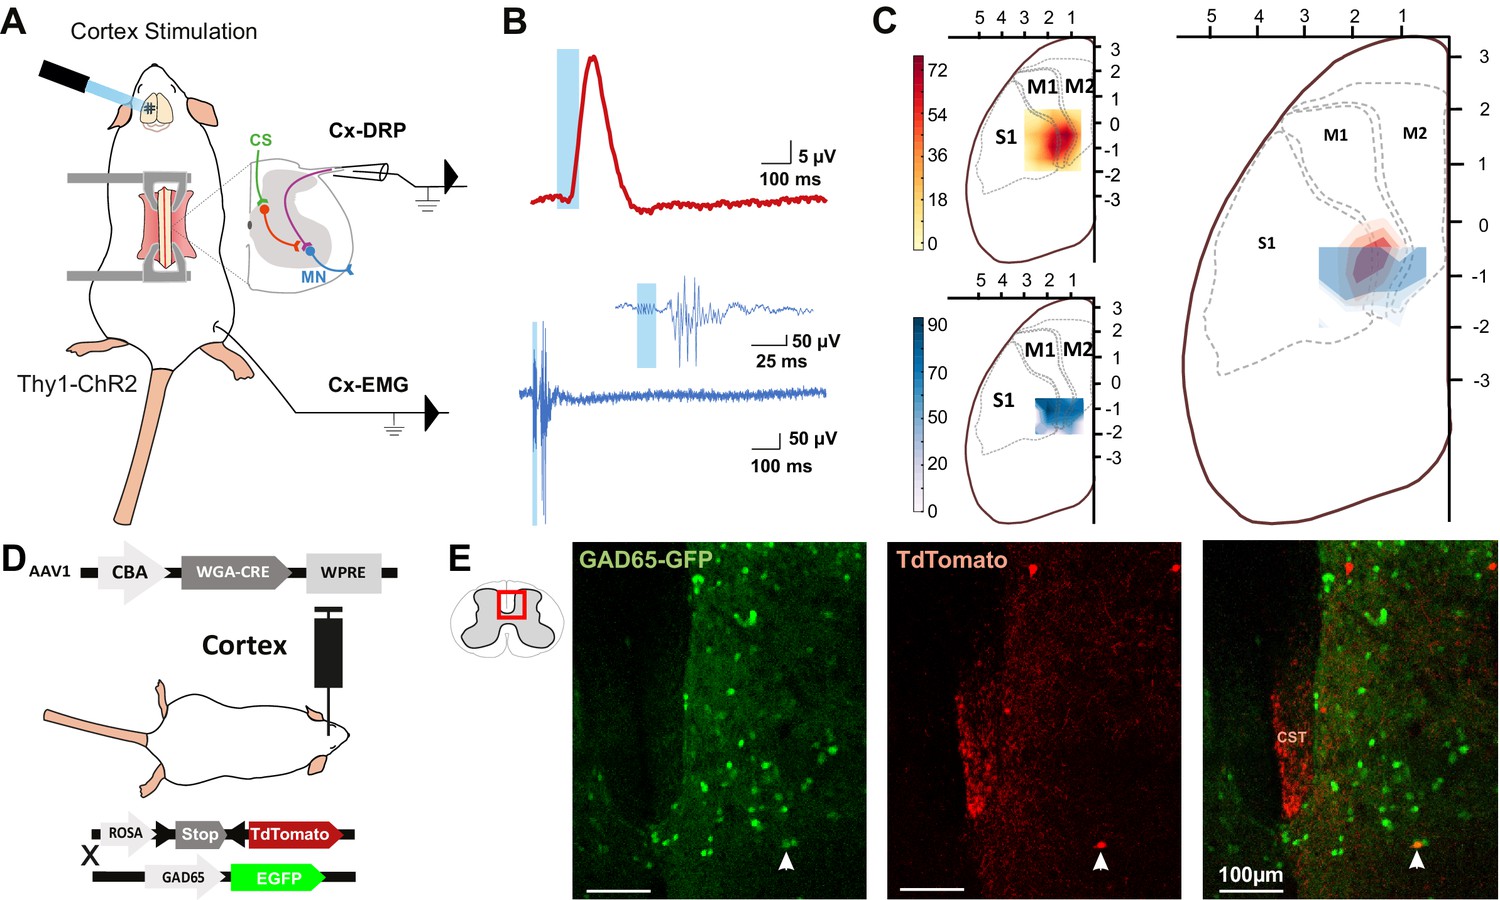
The same cortical area evokes dorsal root potentials (DRPs) and muscular contractions of the hindlimbs.
(A) Schematic experimental design for cortically evoked (Cx-) DRP and electromyographic (EMG) recordings elicited by photostimulation of the contralateral sensorimotor cortex of Thy1-ChR2 mice. DRPs correspond to the presynaptic depolarization of primary afferents propagating antidromically to the suction recording electrode containing a lumbar dorsal root, while EMGs are recorded in the tibialis anterior (TA) muscle. (B) Representative traces of a cortically evoked DRP (top red trace, average of 30 sweeps) and EMG (bottom blue trace, average of three sweeps) after photostimulation (blue window) of the contralateral cortex. (C) Left: heatmaps of the amplitude of the responses of cortically evoked DRPs (top) and EMGs (bottom) in % or the maximum response. Right: overlap of the two maps (red: DRP; blue: EMG) presented as isopotential contour plots (three color grades corresponding to 37, 50, and 63% of maximum value). Coordinates of the cortex are expressed in mm and centered on Bregma. M1: primary motor cortex; M2: secondary motor cortex; S1: primary sensory cortex, according to the Paxinos atlas (Kirkcaldie et al., 2012). (D) Schematic experimental design to identify GAD65-expressing neurons amongst corticospinal neurons targets: AAV2/1-CBA-WGA-CRE was injected in the sensorimotor cortex of TdTomato-flex X GAD65-GFP mice. Analysis of extend of the injection site is presented in Figure 1—figure supplement 1 and of the monosynaptic nature of the transynaptic tracing in Figure 1—figure supplement 2. (E) Photomicrographs (z-projection of confocal images) of a GAD65-GFP mouse lumbar dorsal horn (localization of the view indicated in the inset) after transynaptic labeling from the hindlimb sensorimotor contralateral cortex. A target of the CST (expressing TdTomato after transynaptic transfer of WGA-Cre) also expresses GAD65-GFP. CST: corticospinal tract. Similar experiment in ChAT-EGFP mice is presented in Figure 1—figure supplement 3.
Figure 1—figure supplement 1
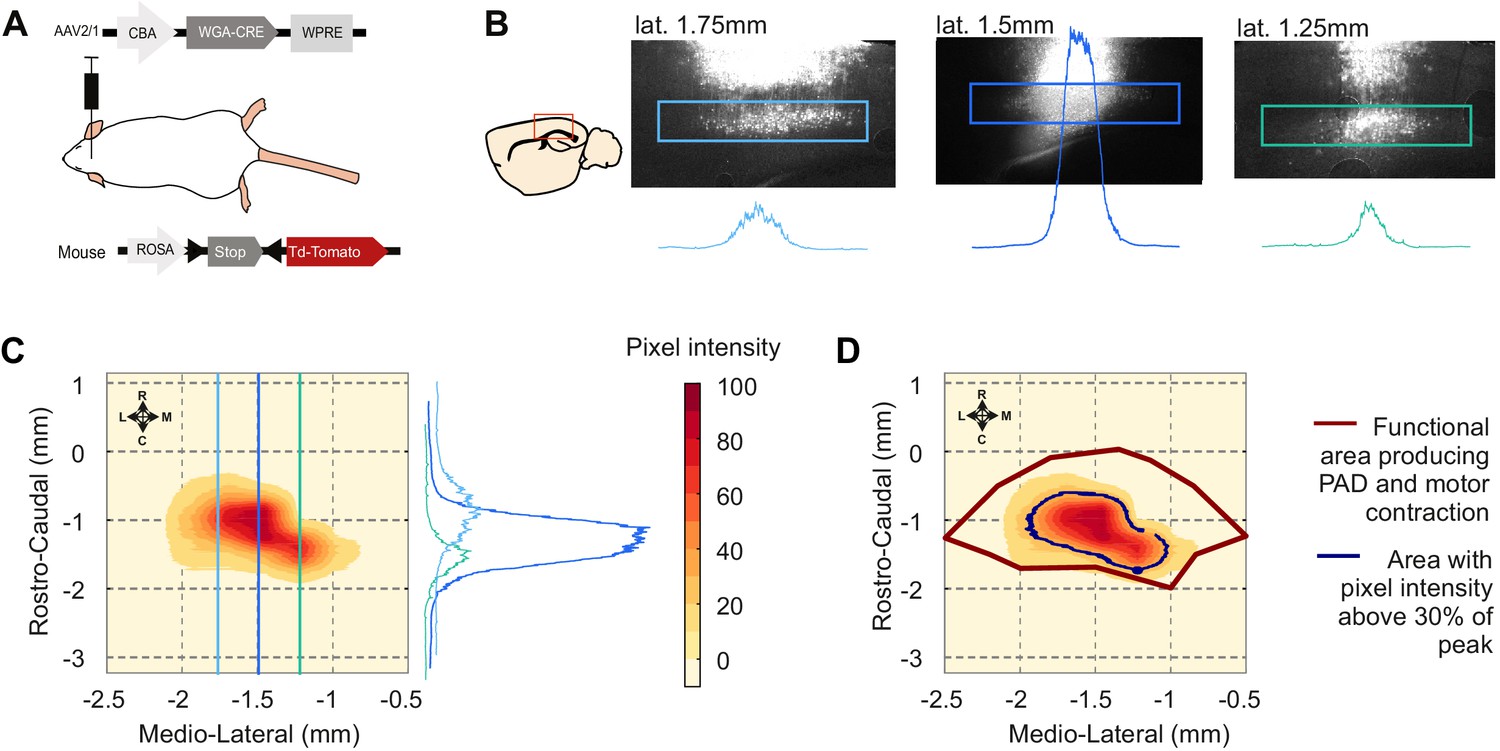
Sensorimotor injection site analyses: cortical layer V fluorescence quantification.
(A) Schematic of experimental design to transynaptically label cortical postsynaptic neurons. (B) Left: drawing of a sagittal slice of the mouse brain illustrating (red square) the localization of the pictures at the right. Right: images of the sensorimotor cortex of a single animal at different lateral positions from the midline. The blue squares show the analyzed area, comprising cortical layer V. The plots show the vertical averages of pixel intensity throughout each blue square. The three slices are localized in the sites indicated by the blue lines in (C). (C) Example of an injection site represented as a heatmap of the pixel intensity across the layer V of a cortex. The map was built using the three plots presented in (B) (illustrated here in the right to show their orientation) as well as additional ones from sequential brain sections on the same animal. (D) Overlap between the heatmap in (C) and the functional area eliciting motor contraction and primary afferent depolarization (PAD; red line). The black line indicates the area with a pixel intensity above 30% .
Figure 1—figure supplement 2
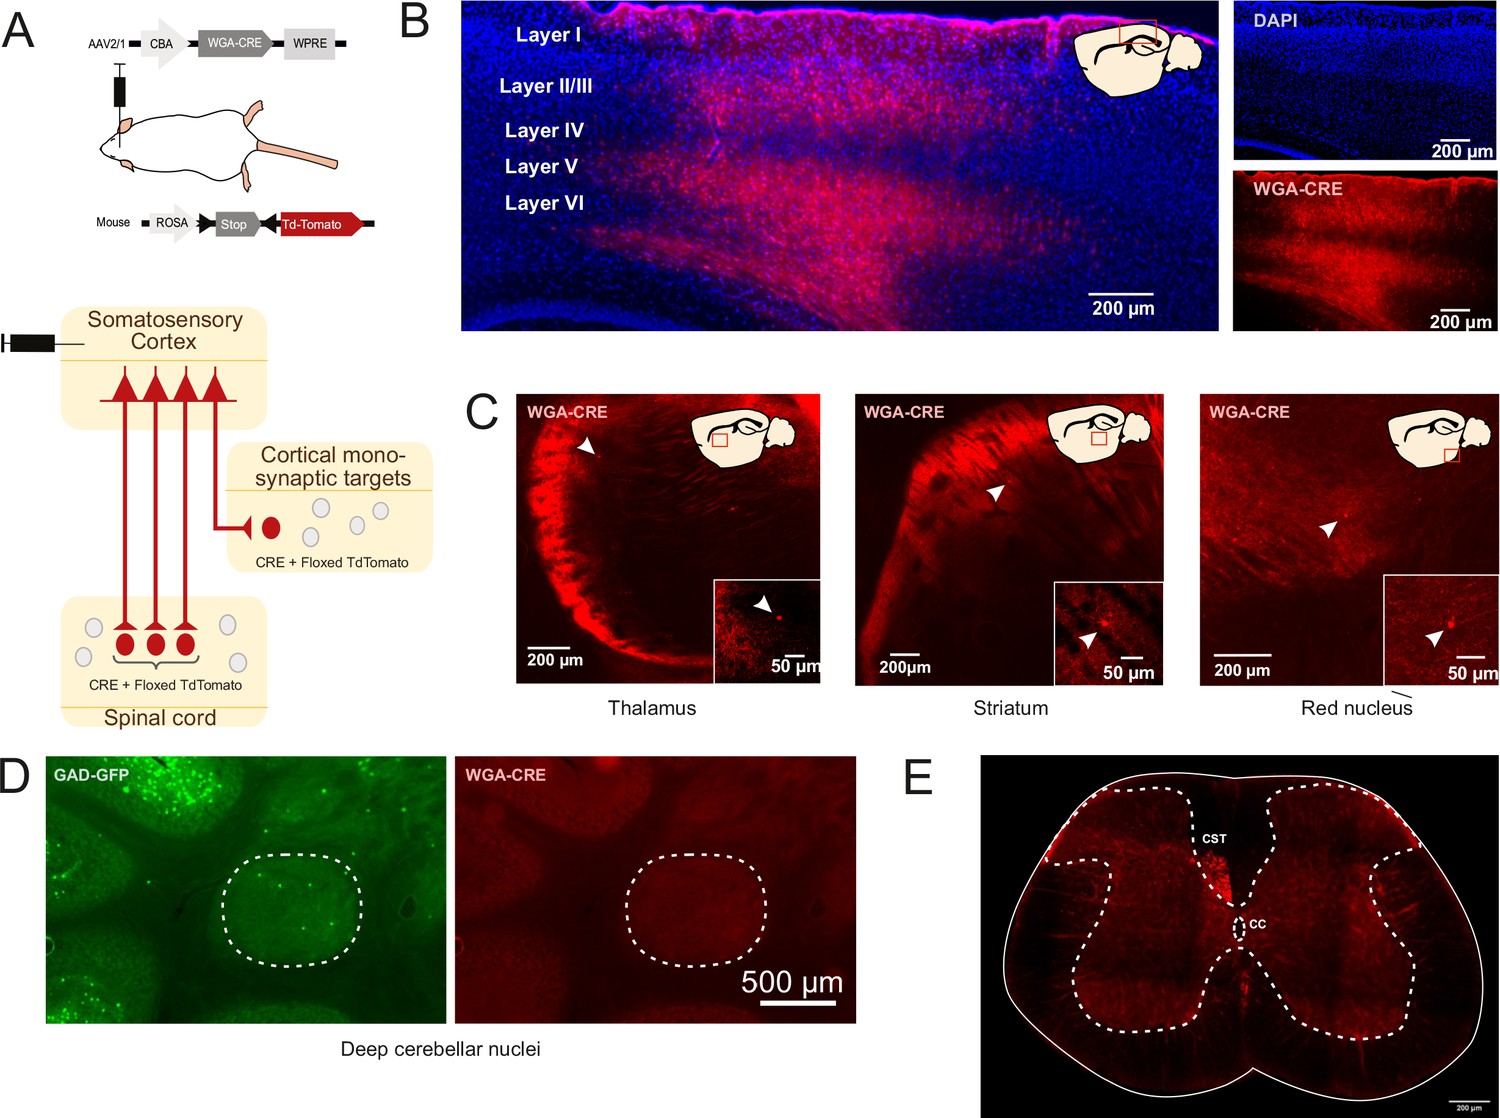
Monosynaptic transynaptic tracing from the cortex.
(A) Schematic of experimental design to transynaptically label cortical postsynaptic neurons. (B) Sagittal image of the injection site in the sensorimotor cortex illustrating TdTomato + neurons (red) and DAPI (blue). The drawing inset shows the area corresponding to the image. (C) Example of stained postsynaptic cortical neurons found in the brain, thalamus, striatum, and red nucleus. The arrow points to TdTomato + neurons. The drawing inset indicates the area corresponding to the image (red square). (D) Absence of TdTomato + neurons in the deep cerebellar nuclei (of a GAD65-GFP mice injected in the cortex as illustrated in A). (E) In the spinal cord, the labeling is restricted to the descending corticospinal tract (CST) (and to its targets) while the ascending tracts are devoided of labeling (CC: central canal). As illustrated in this figure, the targets of the CST are always located in nuclei directly innervated by the cortex, whatever the delay between the injection on me and the observation (see also Figure 4—figure supplement 1). The labeling observed in the spinal cord is exclusively derived from anterograde labeling as transynaptic retrograde transport is not observed in the spinal ascending tracts (nor in the deep cerebellar nuclei). This confirms previous data demonstrating that, when WGA is transgenically encoded (in transgenic mice or by AAVs), the transynaptic labeling is exclusively monosynaptic and anterograde (Libbrecht et al., 2017).
Figure 1—figure supplement 3
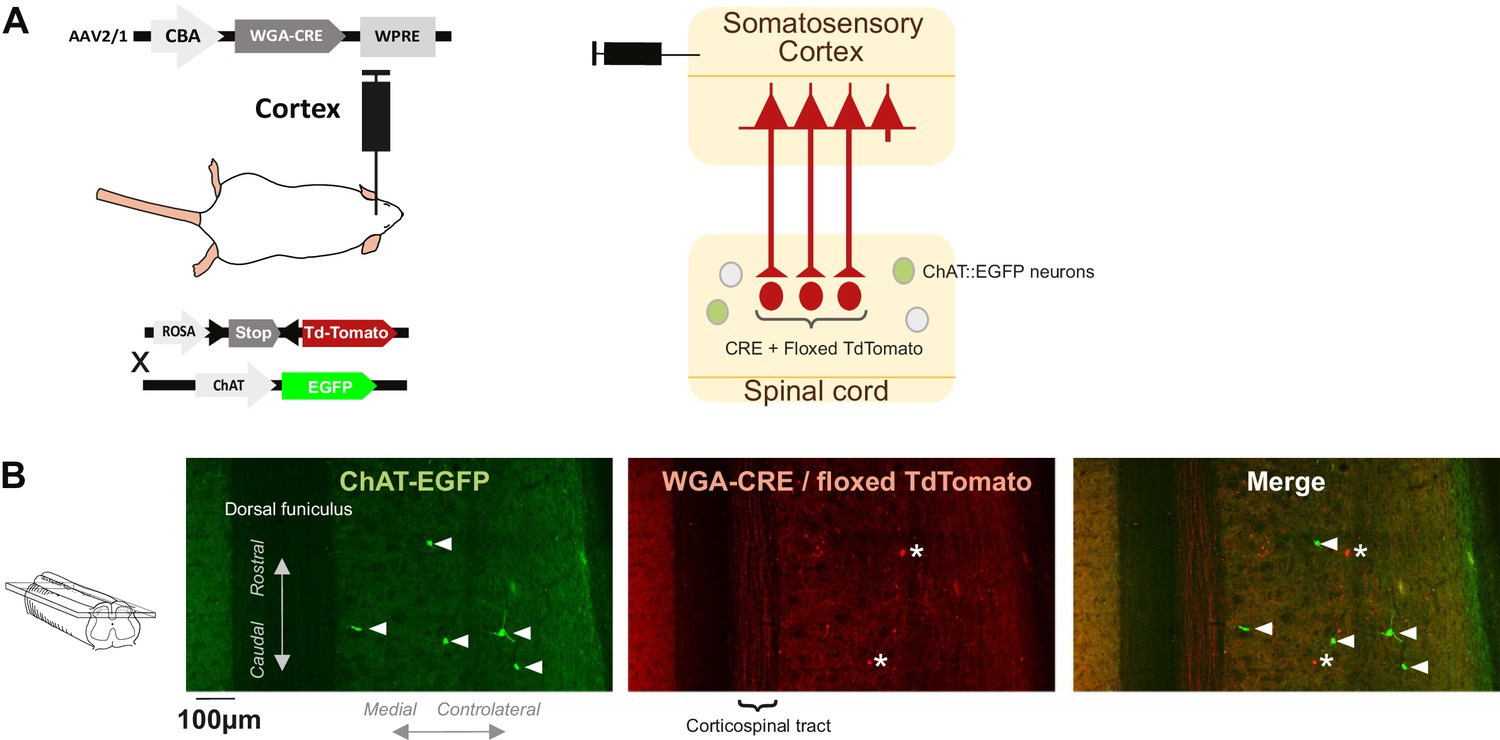
Postsynaptic corticospinal neurons do not colocalize with ChAT.
(A) Schematic of experimental design to transynaptically label the targets of the corticospinal tract (CST) in ChAT-GFP transgenic mice. WGA-Cre expressed in the sensorimotor cortex after AAV2/1 infection can be transferred to the targets of the cortex, for example, in the spinal cord; the mice express a Cre-dependent form of TdTomato, so TdTomato will be expressed in the CST targets after anterograde transynaptic transfer of WGA-Cre. In this experiment, the mice are also ChAT-EGFP, thus allowing to test whether (some) CST targets are cholinergic. (B) Images from the contralateral dorsal horn of the spinal cord (z-projection of a stack of confocal images, horizontal section located ~300 μm from the dorsal surface, see inset at the left) showing targets of the CST (TdTomato+, red) and ChAT-GFP+ neurons (green). The arrowheads point at ChAT-EGFP+ neurons located in lamina III and IV, none of which expressed TdTomato. The * points at targets of the CST that do not express ChAT-EGFP.
Figure 2 with 2 supplements
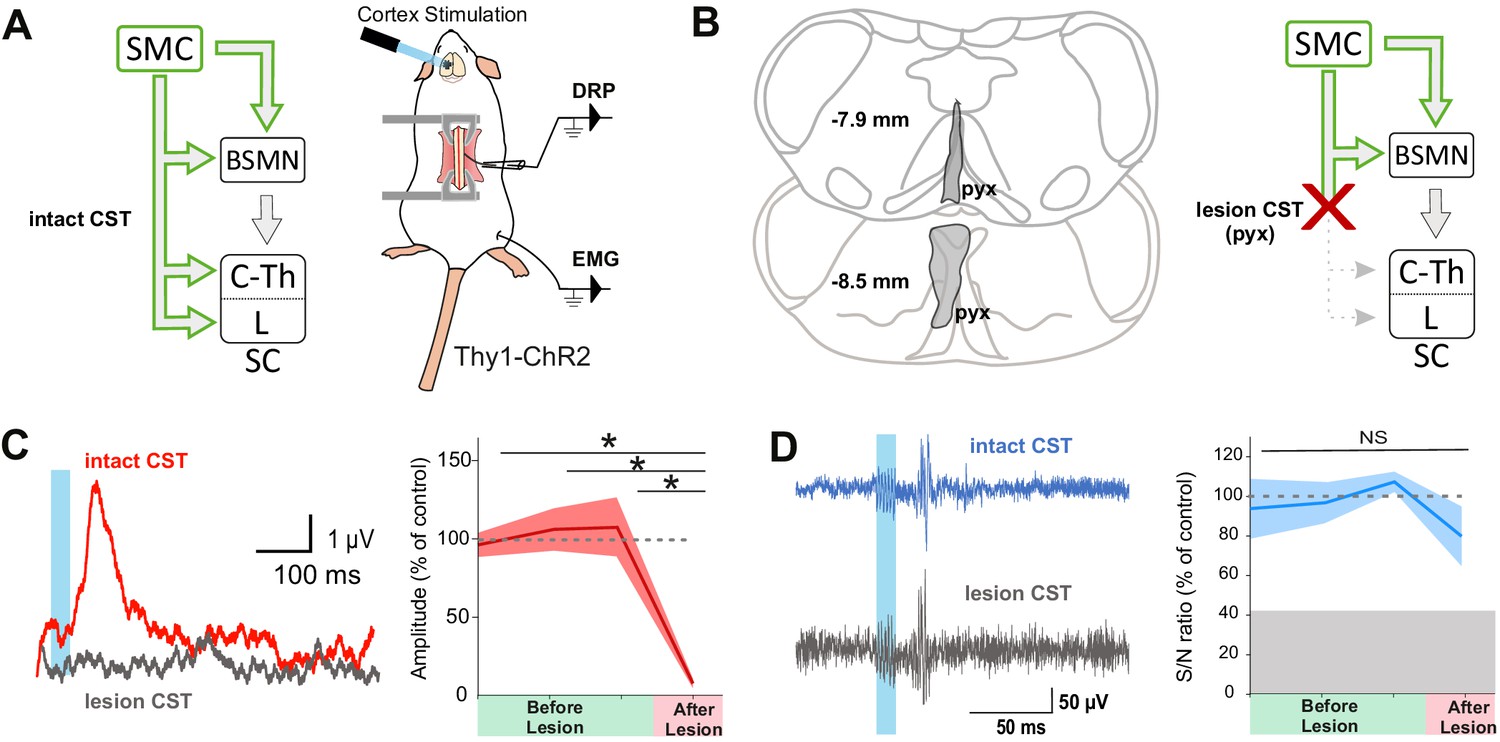
The corticospinal tract (CST) is essential for cortically evoked inhibition of primary afferents.
(A) Left: diagram showing direct and indirect cortical-to-spinal paths. In green: paths potentially activated by photostimulation in the cortex of Thy1-ChR2 mice. Right: experimental design. (B) Left: drawing showing the extent of the pyramidal lesion (in gray, pyx) in the frontal plane (distance to Bregma indicated) in two animals whose recordings are respectively illustrated in (C) and (D). Right: diagram showing the indirect cortical-to-spinal paths spared by the pyramidotomy. Systematic histological analysis of the pyramidotomies is presented in Figure 2—figure supplement 1. (C) Left: representative traces of cortically evoked dorsal root potentials (DRPs) recording before (red) and after (gray) CST lesion (average of 30 traces). Right: the pyramidotomy abolishes cortically evoked DRPs (p=0.006, one-way ANOVA, n = 3 mice). Post-hoc test Holm–Sidak, *p<0.05 (D) Left: representative traces of cortically evoked electromyographic (EMG) recording before (blue) and after (gray) pyramidal lesion (average of three traces). Right: there is no significant change in the S/N ratio of the EMG response before and after the pyramidal lesion (93,8, 96,9, and 109,3% prior to pyramidotomy to 77.2% after, p=0.517, one-way ANOVA, n = 4 mice). Gray zone: noise level (see Materials and methods). EMG Z-scores for individual mice before and after pyramidotomy are presented in Figure 2—figure supplement 2.
Figure 2—figure supplement 1
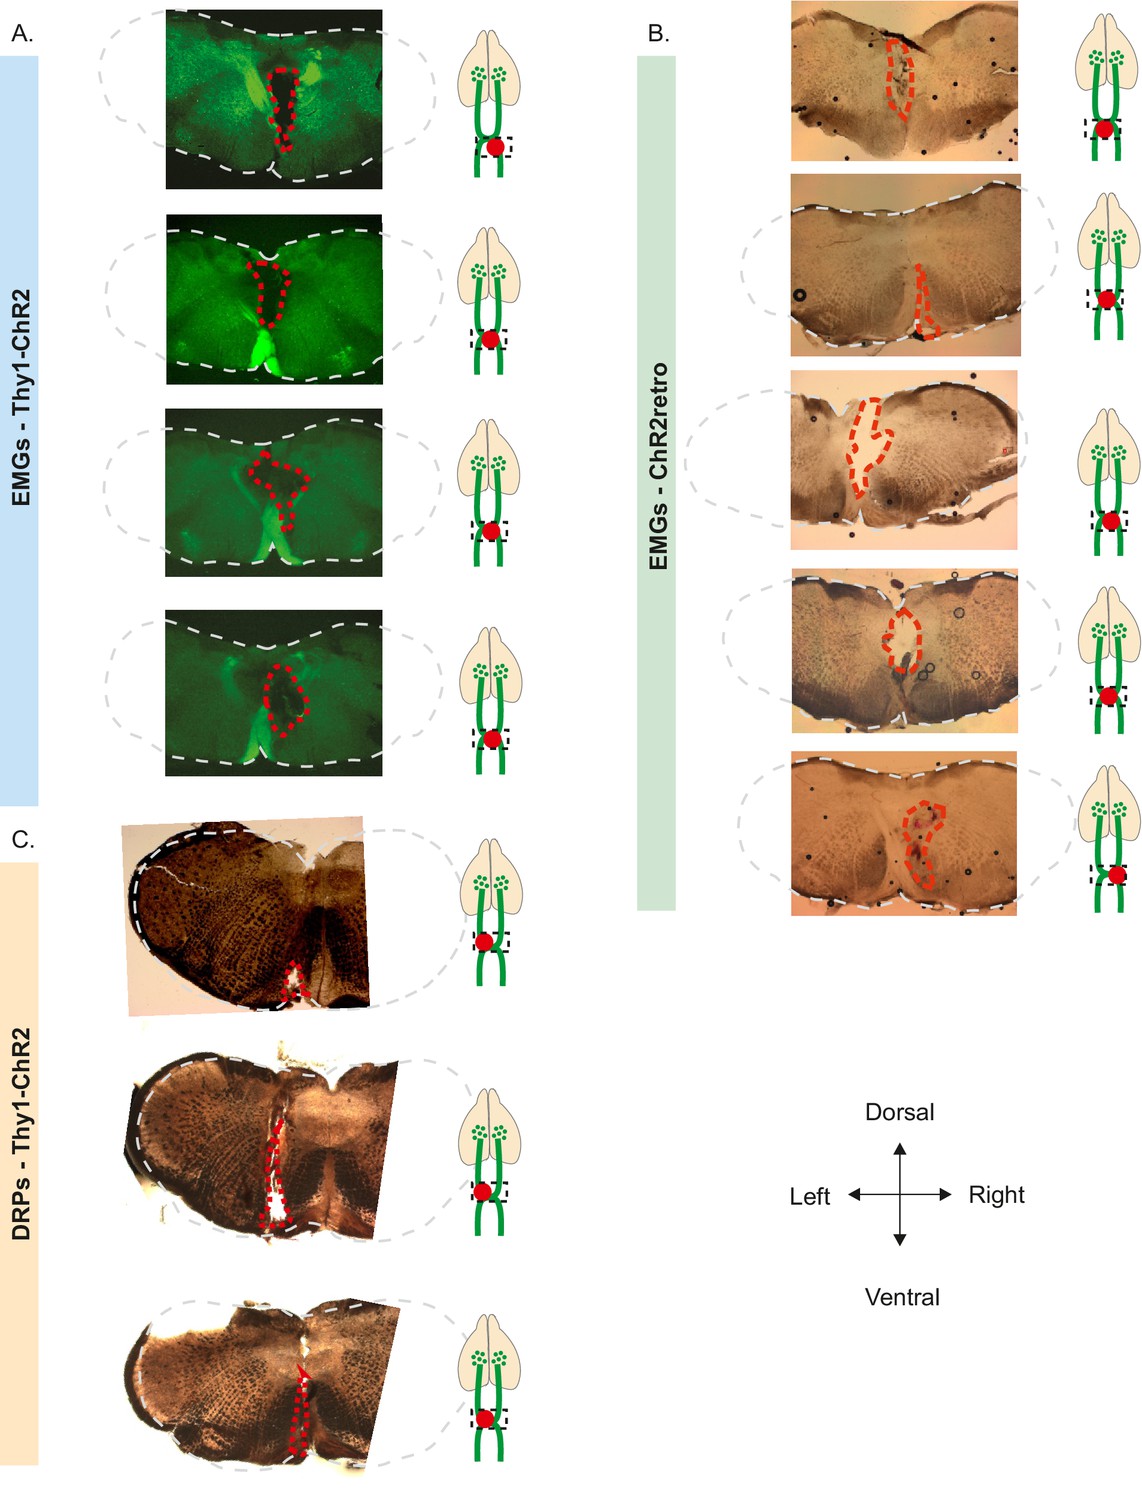
Histology of the pyramidotomies.
(A) Slices of Thy1-ChR2 mice used for electromyographic (EMG) recordings at the level of the decussation of the pyramids. Extent of the electrolytic lesion in hatched red. (B) Slices of ChR2 retrogradely labeled mice used for EMG recordings at the level of the decussation of the pyramids. Extent of the electrolytic lesion in hatched red. (C) Slices of Thy1-ChR2 mice used for dorsal root potential (DRP) recordings at the level of the decussation of the pyramids. Extent of the electrolytic lesion in hatched red.
Figure 2—figure supplement 2
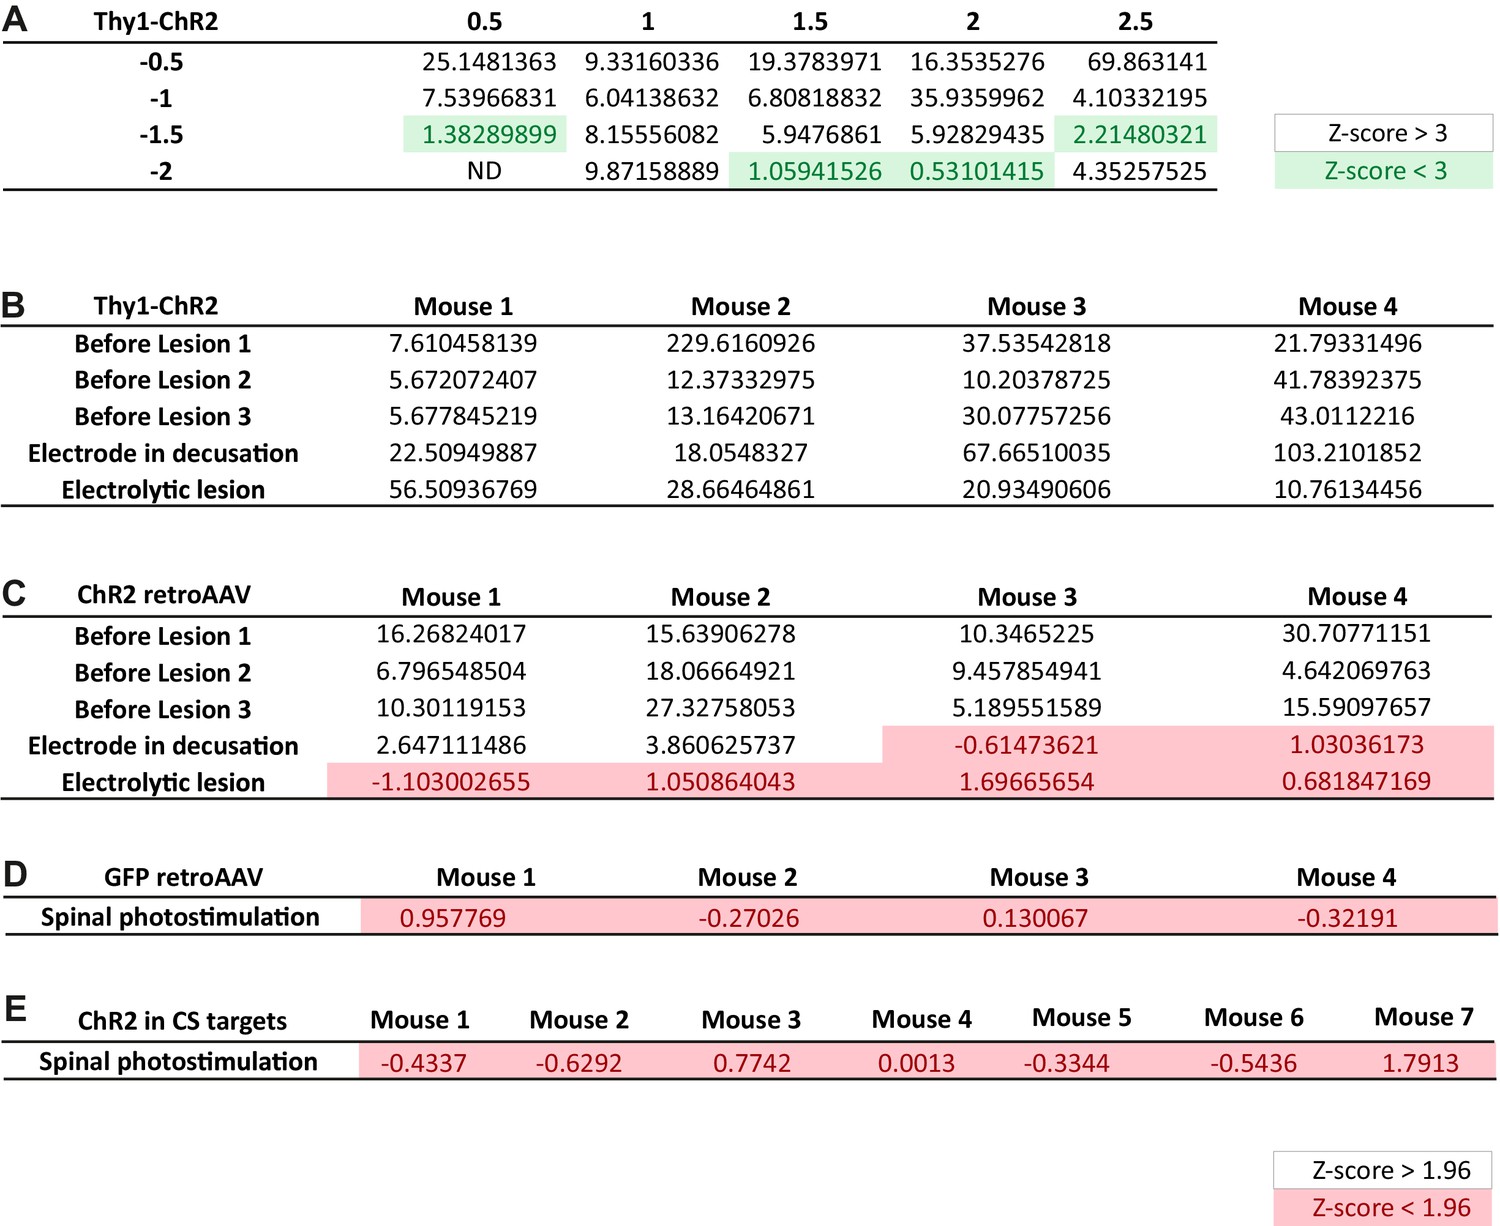
Z-score of individual electromyographic (EMG) responses assessing the significance of the corresponding S/N ratio.
(A) Matrix of the median Z-score (from five animals) for EMG responses recorded at each stimulated point of the cortex. Data presented in Figure 1C. Coordinates are expressed in mm from Bregma. (B) Z-score of the EMG response for each experimental condition in Thy1-ChR2. Data presented in Figure 2D. (C) Z-score of the EMG response for each experimental condition in mice injected with the ChETA expressing retroAAV. Data presented in Figure 3E. (D) Z-score of the EMG responses for each mouse expressing GFP in corticospinal (CS) neurons. Data presented in Figure 3—figure supplement 1. (E) Z-score of the EMG responses for each mouse expressing ChR2 in the lumbar targets of CS neurons. Data presented in Figure 4G.
Figure 3 with 1 supplement

The corticospinal (CS) tract can encode muscular contractions.
(A) Left: diagram illustrating CS neurons and their collaterals expressing ChR2 after retrograde infection in the lumbar cord with a ChR2-retro AAV. Right: experimental design: the photostimulation and electromyographic (EMG) recording session took place at least 3 weeks after the infection. (B) Sagittal image from the sensorimotor cortex (lateral = 0.68 mm), showing retrogradely labeled CS neurons (expressing ChR2-TdTomato). (C) Drawing of a cortex top view, showing the localization of retrogradely labeled CS neurons in the five animals (solid lines). They are within the area functionally determined as inducing dorsal root potentials (DRPs) and EMGs in the hindlimb (dashed lines). (D) Left: drawing showing the extent of the pyramidal lesion in the animal whose recordings are illustrated in (E). Right: diagram showing the supraspinal collaterals of ChR2-expressing CS neurons spared by the pyramidotomy. Systematic histological analysis of the pyramidotomies is presented in Figure 2—figure supplement 1. (E) Left: cortically evoked EMG recordings before (blue) and after (gray) the pyramidal lesion. Right: the pyramidotomy abolishes cortically evoked EMG (p=0.012, one-way ANOVA, n = 5 mice). Post-hoc test Holm–Sidak, *p<0.05. Gray zone: noise level (see Materials and methods). EMG Z-scores for individual mice before and after pyramidotomy are presented in Figure 2—figure supplement 2. The blue window on recording traces indicates photostimulation. SMC: sensorimotor cortex; BSMN: brain stem motor nuclei; C-Th: cervico-thoracic spinal cord; L-SC: lumbo-sacral spinal cord.
Figure 3—figure supplement 1
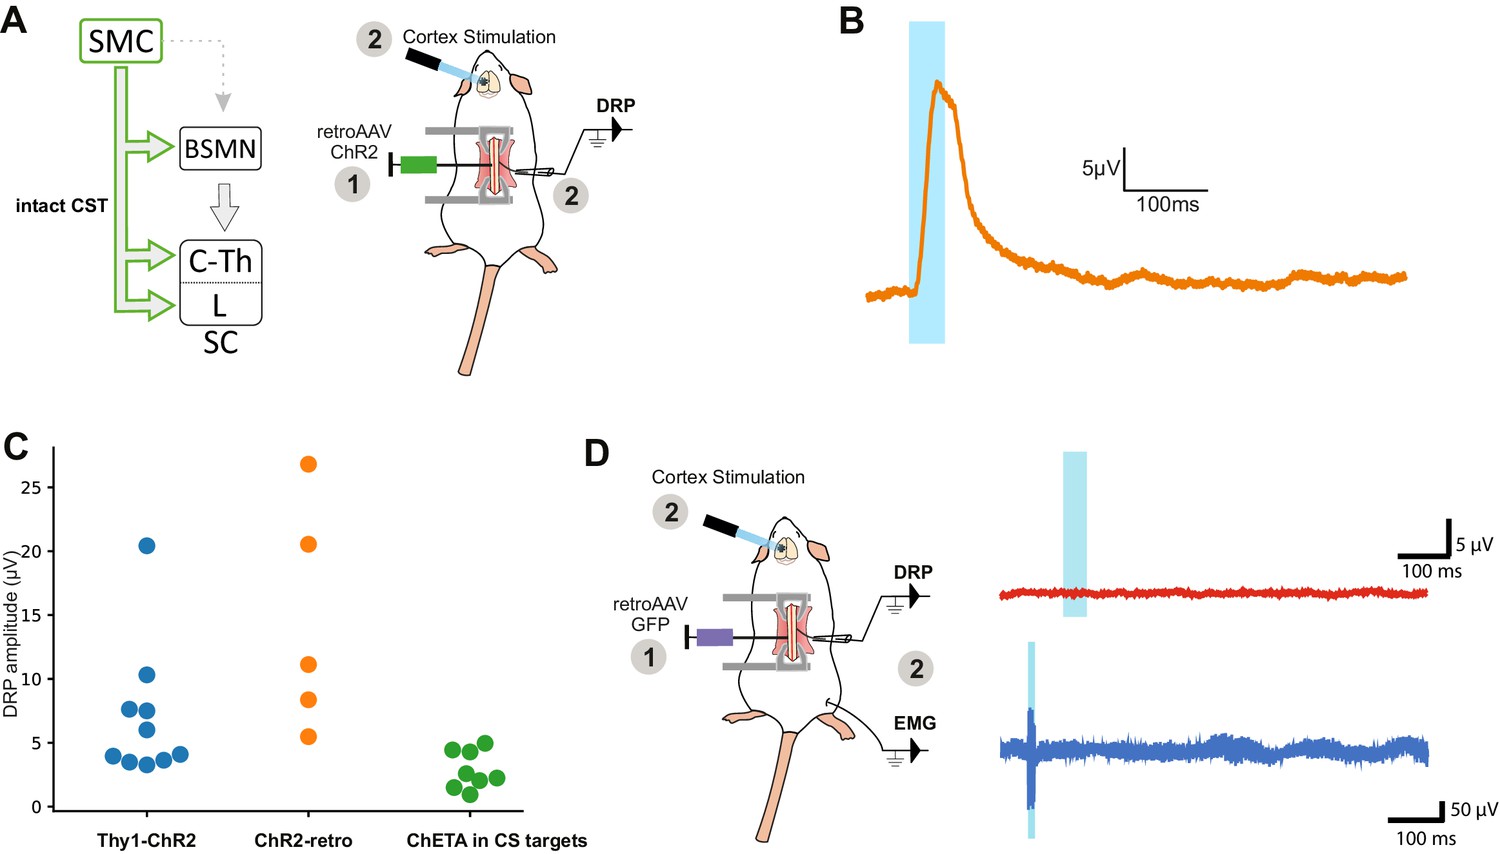
Dorsal root potentials (DRPs) are induced by photostimulation of ChR2-expressing corticospinal (CS) neurons (but not by GFP-expressing CS neurons).
(A) Left: diagram illustrating CS neurons and their collaterals expressing ChR2 after retrograde infection in the lumbar cord with a retroAAV. Right: experimental design: the photostimulation and DRP recording session took place at least 3 weeks after the infection. (B) Example of DRP recording obtained after cortical photostimula tion. (C) Analysis of DRP amplitude in the different animal models: THY1-ChR2 (recordings presented in Figures 1 and 2), ChR2-retro (recordings presented in A, B), ChETA expression in the targets of the CS tract (photostimulalation of the spinal cord, Figure 4). (D) Left: experimental design of control experiment consisting of the retrograde infection of CS neurons with a control, GFP-encoding, retrograde AAV. Right: cortical photostimulation induced no DRP or electromyographic signal.
Figure 4 with 3 supplements
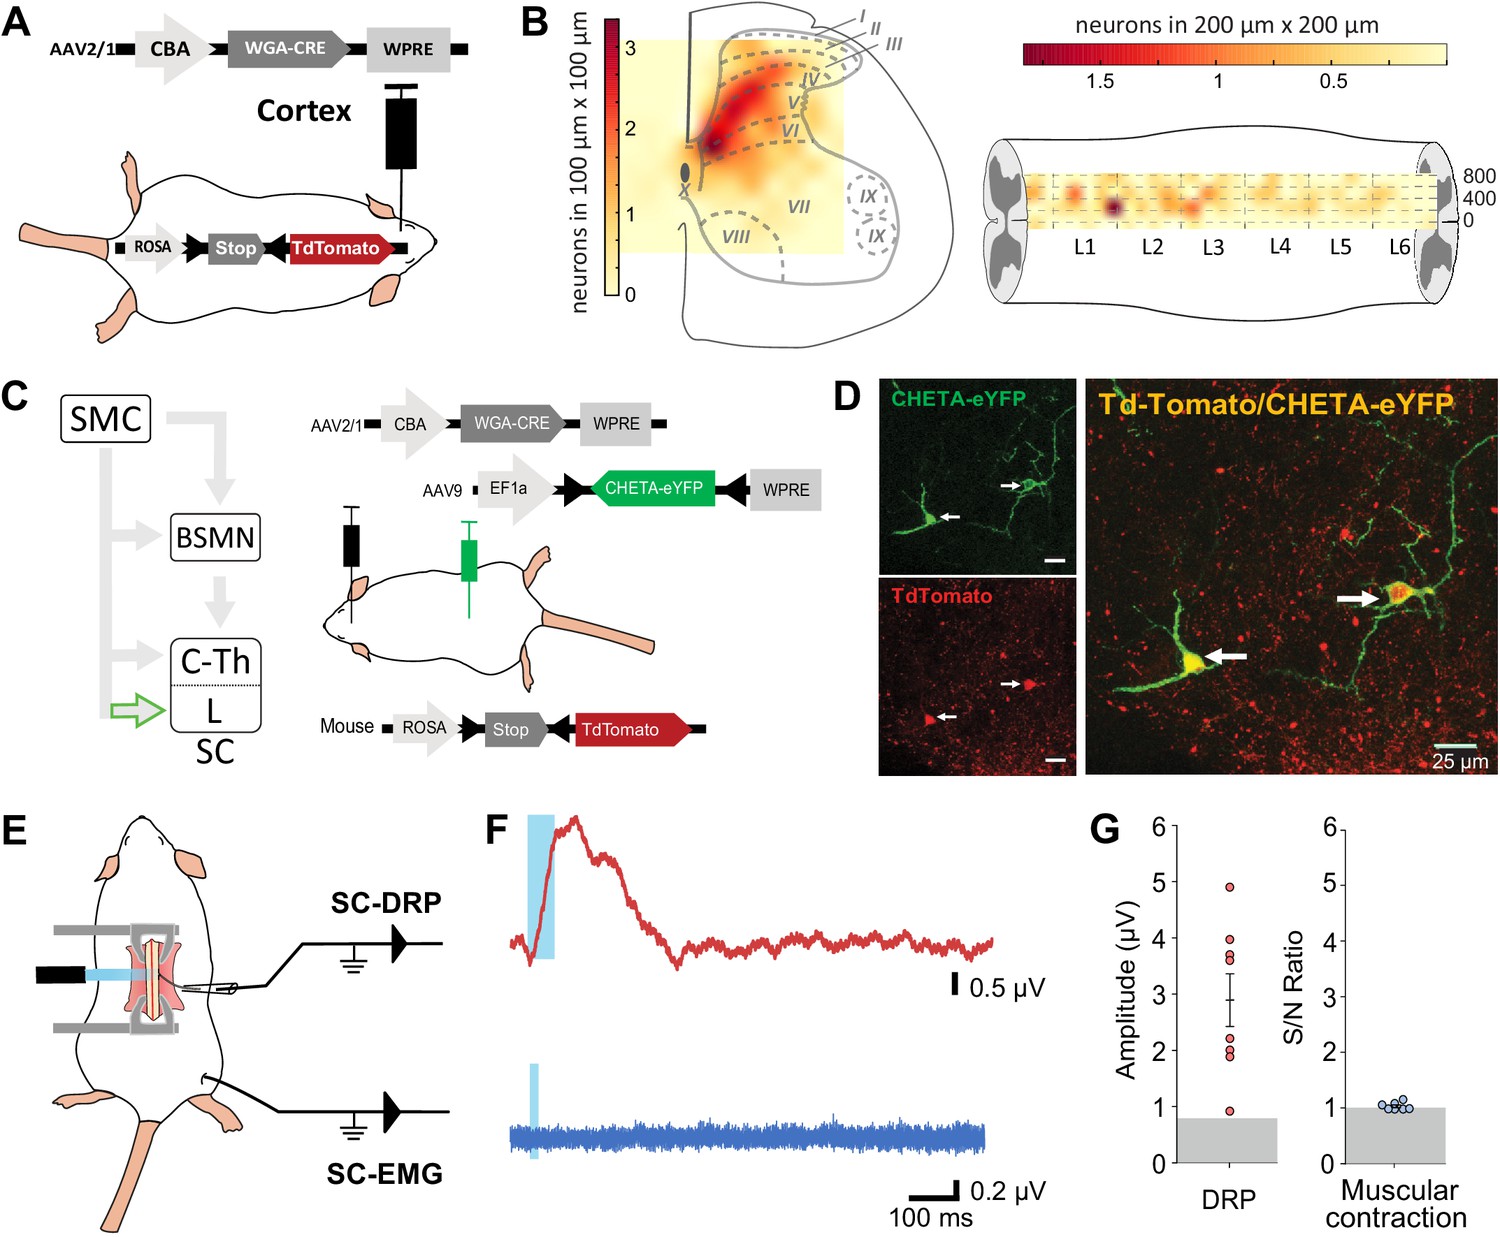
Lumbar corticospinal postsynaptic neurons encode dorsal root potentials (DRPs) but no movements.
(A) Experimental design: the targets of the corticospinal tract (CST) are labeled through a transynaptic approach consisting of AAV2/1-CBA-WGA-CRE injection in the hindlimb sensorimotor cortex of TdTomato-flex mice. (B) Localization of the spinal targets of the CST: heatmap showing the distribution of the neurons in the lumbar cord (6 mm long) projected into the transverse plane (average of nine mice; left) or horizontal plane (average of six mice; right) plane. (C) Left: diagram illustrating that only lumbar direct targets of the CST express CHETA in the following experiment. Right: experimental design: TdTomato-flex mice received an injection of AAV2/1-CBA-WGA-CRE in the hindlimb sensorimotor cortex and an injection of AAV9-Efl-flex-CHETA-eYFP in the L4 spinal segment. (D) Photomicrographs (z projection of confocal images) from the dorsal horn of the spinal cord (laminae V/VI); the arrows point at two targets of the CST expressing TdTomato+ and CHETA-eYFP. (E) Experimental design illustrating spinal photostimulation of the lumbar targets of the CST. (F) Representative traces of DRP (red trace, average of 60 traces) and electromyographic (EMG; blue trace, average of three traces) recordings from the same animal after photostimulation of the lumbar targets of the CST (blue window). (G) Photostimulation of the lumbar targets of the CST induces DRPs (left) but no EMG signal (right). Gray zone: noise level (see Materials and methods). EMG Z-scores for individual mice are presented in Figure 2—figure supplement 2. SMC: sensorimotor cortex; BSMN: brain stem motor nuclei; C-Th: cervico-thoracic spinal cord; L-SC: lumbo-sacral spinal cord.
Figure 4—figure supplement 1

Strategy to label the spinal targets of corticospinal (CS) neurons.
(A) Experimental design: the targets of the corticospinal tract (CST) are labeled through a transynaptic approach consisting of AAV2/1-CBA-WGA-CRE injection in the hindlimb sensorimotor cortex of TdTomato-flex mice. (B) Dorsoventral distribution of TdTomato neurons in the spinal cord after transynaptic labeling. N = 570 neurons from nine animals. The 0 coordinate corresponds to the center of the central canal. 85% of neurons are located dorsally to the central canal. (C) Total number of TdTomato neurons in the lumbar spinal cord (systematic counting) in the different animals considered for building Figure 4A, including indication of survival delay after cortical injection, and infected area (in mm2) in the cortex after histological analysis. These parameters do not correlate with the number of TdTomato neurons as demonstrated by the low Pearson coefficient.
Figure 4—figure supplement 2
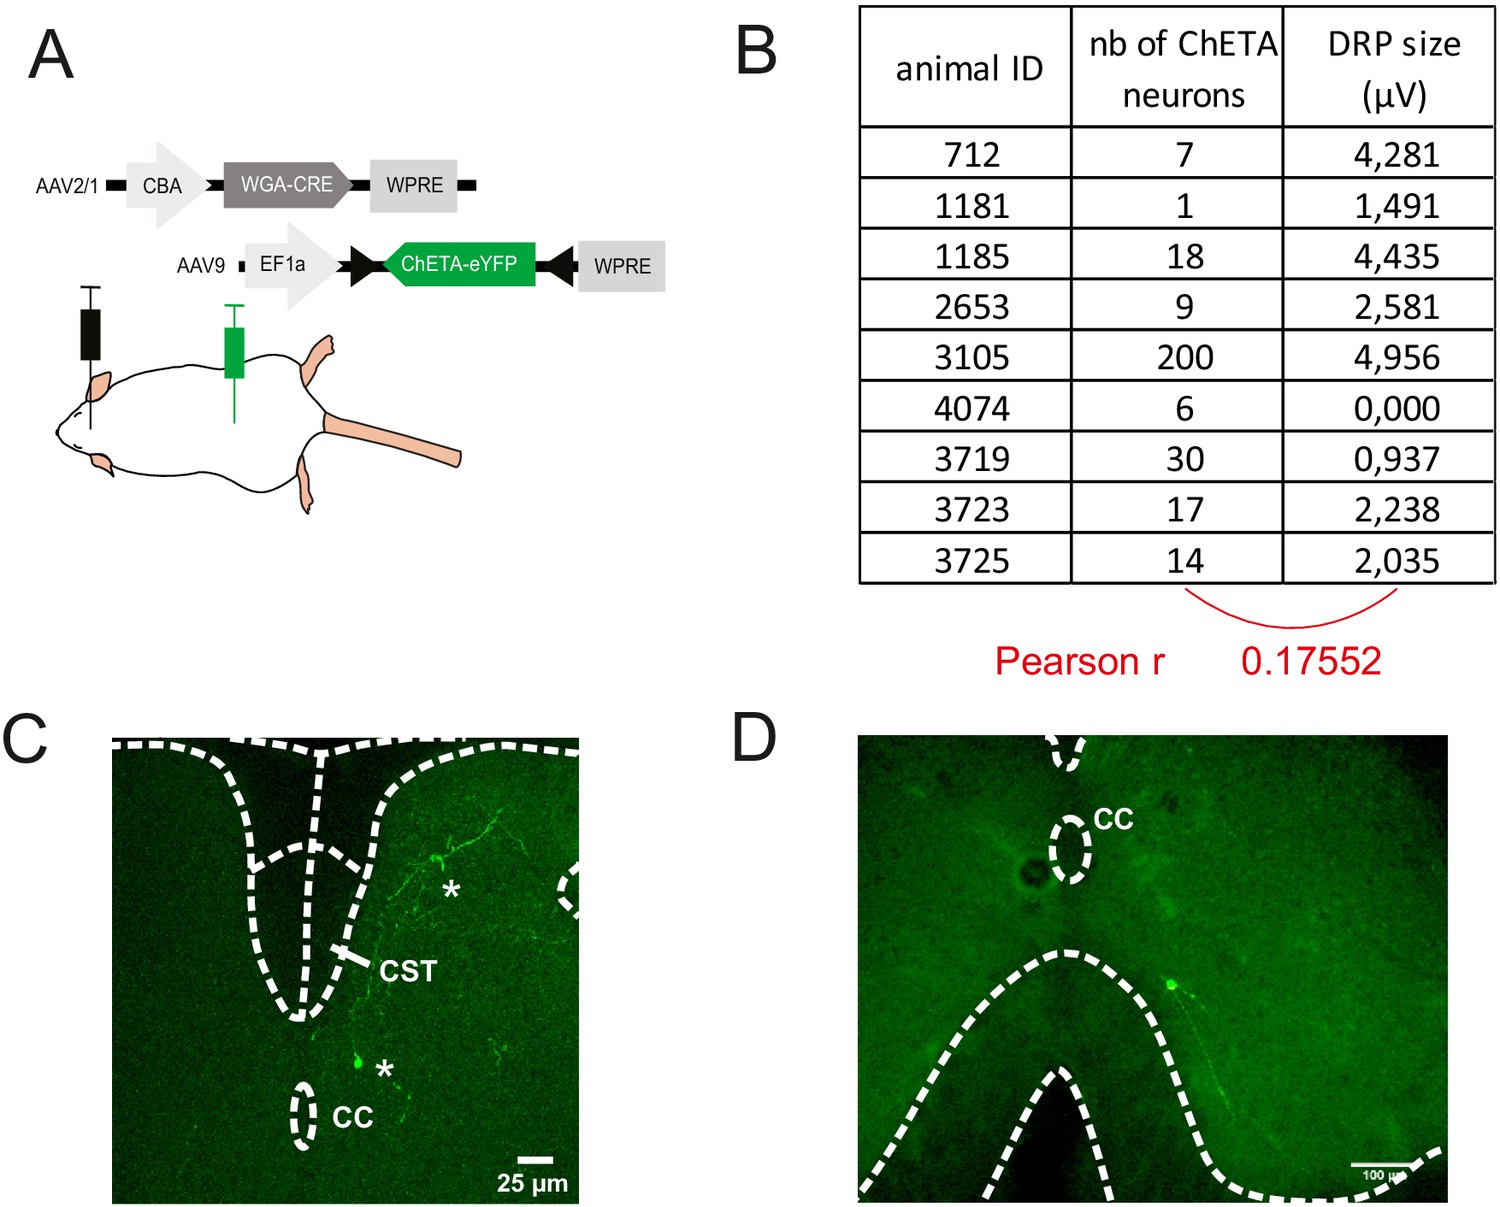
Strategy to stimulate exclusively the spinal targets of corticospinal (CS) neurons.
(A) Experimental design: the targets of the corticospinal tract (CST) are labeled through a transynaptic approach consisting of AAV2/1-CBA-WGA-CRE injection in the hindlimb sensorimotor cortex of TdTomato-flex mice. (B) Number of ChETA-expressing targets of the CST and size of dorsal root potential (DRP) signal recorded in the corresponding mice (no correlation). These numbers are underestimated as the histological analysis was performed after a long recording session, with only post-fixation (no intracardiac perfusion of fixative). (C) After the transectional approach presented in (A), the spinal postsynaptic targets of CS neurons express ChETA-eYFP (two *). Importantly, the dorsal funiculus, and in particular the CST, is not labeled by this approach. CC: central canal. (D) The spinal CS postsynaptic neurons (that received the transynaptic WGA-Cre) infected by the intraspinal AAV injection (encoding ChETA-flex) can be located in the ventral horn, as in this example of a neuron located at 180 μV ventral to the CC. Neurons up to –230 μV from the CC were infected, that is, a depth where 97% of the spinal targets of the CS neurons are found (Figure 4—figure supplement 1B).
Figure 4—figure supplement 3
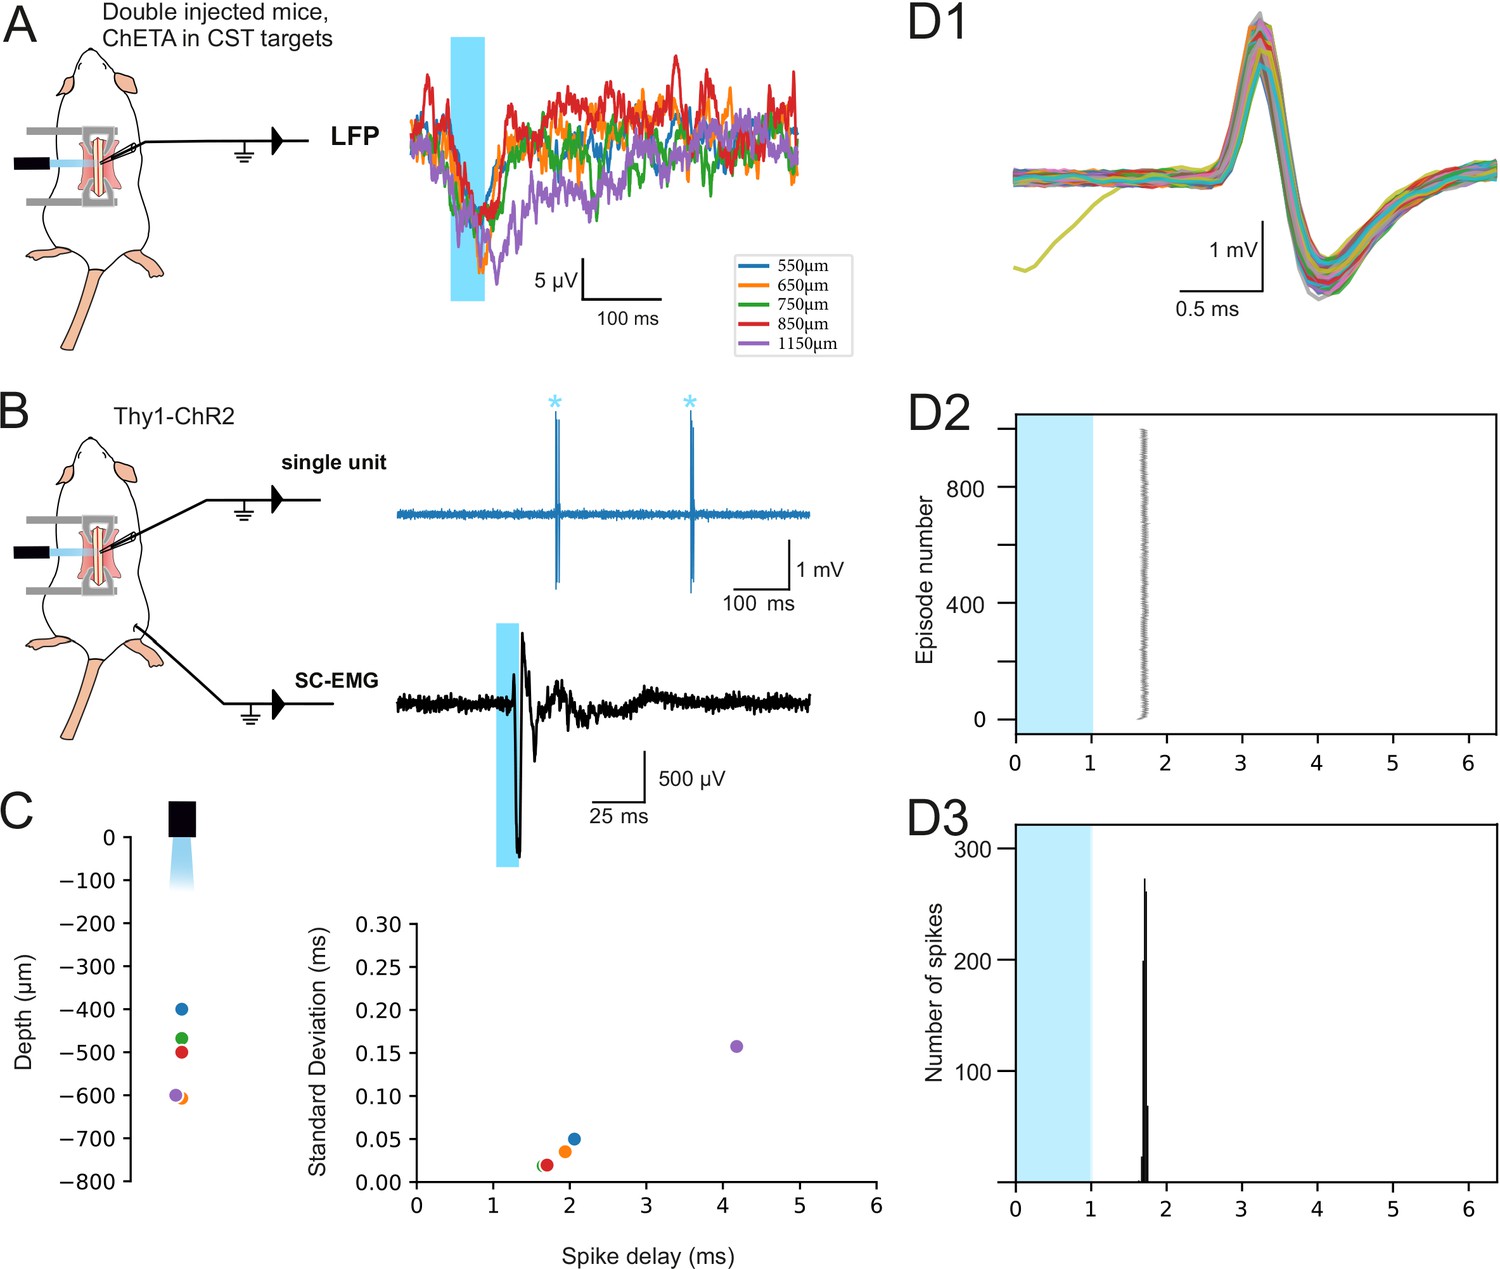
Efficacy of the surface spinal photostimulation.
(A) Experimental design (left) for LFP recordings (right): the lumbar targets of the corticospinal tract (CST) express ChETA after intersectional viral strategy, and LFP recording are obtained at different depth after spinal surface photostimulation. (B) Experimental design (left) for spinal single unit (right top) and electromyographic (EMG; right bottom) recordings in Thy1-ChR2 mice, after spinal surface photostimulation (isoflurane anesthesia). (C, left) Depth of neurons recorded by juxtacellular single-unit recordings, directly responding to the surface illumination (1 ms or 0.5 ms pulse). Right: Criteria to establish that these neurons were directly activated: the delay of the response was lower than 5 ms, the standard deviation of this delay was lower than 0.20 ms, and (not shown) there was no failure (or less than 0.5% of failure) when stimulated at 4 Hz. (D) Example of a spinal neuron located at 500 μm from the cord surface. (D1) Superimposition of electrophysiological traces of the photostimulated action potential. (D2) Raster plot of the 1000 episodes illustrating the stability of the response and of its delay. (D3) Peristimulus histogram presenting the distribution of the spike delay of this neuron in the 1000 episodes presented in (D2). Note: In contrast to the spinal photostimulation presented here, cortical photostimulation of THY1 animals under isoflurane anesthesia did not lead to an EMG signal; this was only obtained under ketamine/xylazine anesthesia.
Author response image 1

DRP amplitude as a function of experiment type and experimenter.
THY1: experiments on THY1-ChR2 animals (Fig. 1), THY1 prePYT: experiments on THY1-ChR2 where a pyramidotomy was performed (Fig. 2), measures taken before the pyramidotomy, Retro: animals injected with ChR2-retro AAV in the spinal cord (Fig 3-Figure supplement 1), N+1: animals with a double viral injection inducing ChETA expression in the CS lumbar targets (Fig. 4). The first three are responses to cortical photostimulations, the last one corresponds to responses to spinal photostimulations.YML, CB, GD: the three experimenters that performed the recordings
Tables
Author response table 1
| Mouse model | Stimulation site | N | Mean DRP ampl. | Range DRP ampl. |
|---|---|---|---|---|
| Thy1 mice | Cortex | 10 | 7.0 μV | 3.3 μV – 20.4 μV |
| ChR2 in CS targets | Spinal Cord | 8 | 2.9 μV | 0.9 μV – 5.0μV |
| ChR2 in CS neurons | Cortex | 5 | 14.5 μV | 8.4 μV – 26.8 μV |
Additional files
Download links
A two-part list of links to download the article, or parts of the article, in various formats.
Downloads (link to download the article as PDF)
Open citations (links to open the citations from this article in various online reference manager services)
Cite this article (links to download the citations from this article in formats compatible with various reference manager tools)
The corticospinal tract primarily modulates sensory inputs in the mouse lumbar cord
eLife 10:e65304.
https://doi.org/10.7554/eLife.65304


