Alcohol consumption in the general population is associated with structural changes in multiple organ systems
- Department of Epidemiology and Biostatistics, School of Public Health, Imperial College London, United Kingdom
- Department of Hygiene and Epidemiology, University of Ioannina Medical School, Greece
- Department of Cardiovascular Medicine, Tohoku University Hospital, Japan
- Tohoku Medical Megabank Organization, Tohoku University, Japan
- Department of Brain Sciences, Imperial College London, United Kingdom
- Data Science Institute, Imperial College London, United Kingdom
- MRC Centre for Environment and Health, School of Public Health, Imperial College London, United Kingdom
- Division of Biomedical Sciences, Department of Life Sciences, College of Health, Medicine and Life Sciences, Brunel University London, United Kingdom
- UK Dementia Research Institute at Imperial College London, United Kingdom
- National Institute for Health Research Imperial College Biomedical Research Centre, Imperial College London, United Kingdom
- British Heart Foundation Centre for Research Excellence, Imperial College London, United Kingdom
Figures
Figure 1
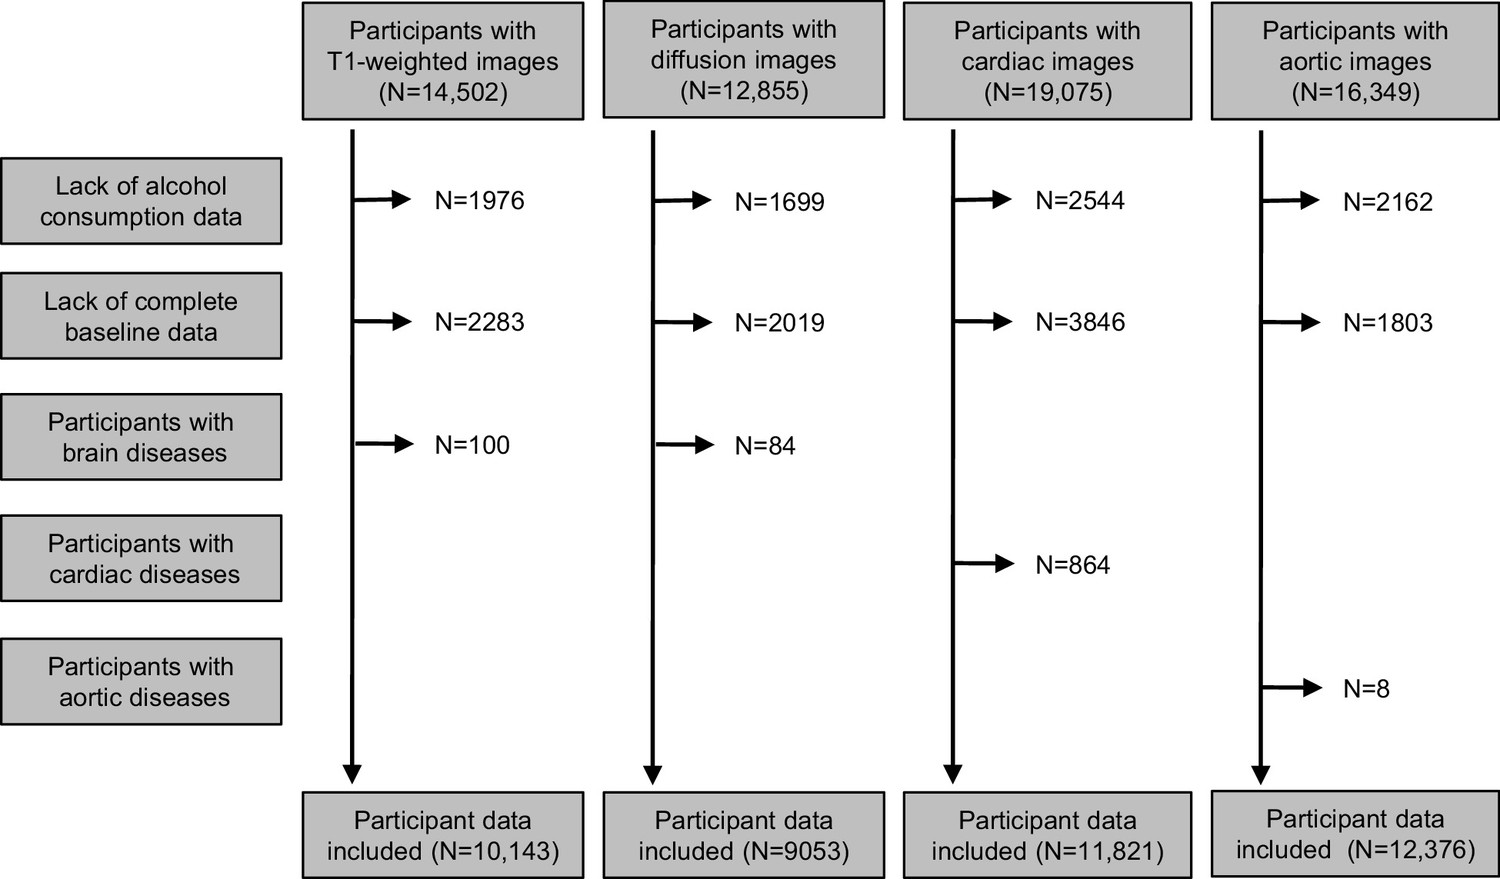
Flow chart of eligible participants included in analyses.
Figure 2

Partial residual plots for the imaging-derived phenotypes.
Partial residual plots for (a) normalised brain volume, (b) total grey volume, (c) total white volume, (d) left ventricular mass index, (e) left ventricular end-diastolic volume index, (f) left ventricular ejection fraction, (g) right ventricular end-diastolic volume index, (h) right ventricular ejection fraction, (i) left atrial volume index, (j) right atrial volume index, (k) ascending aortic area index, (l) descending aortic area index, (m) ascending aortic distensibility, (n) descending aborting distensibility, and (o) liver fat.
Figure 3
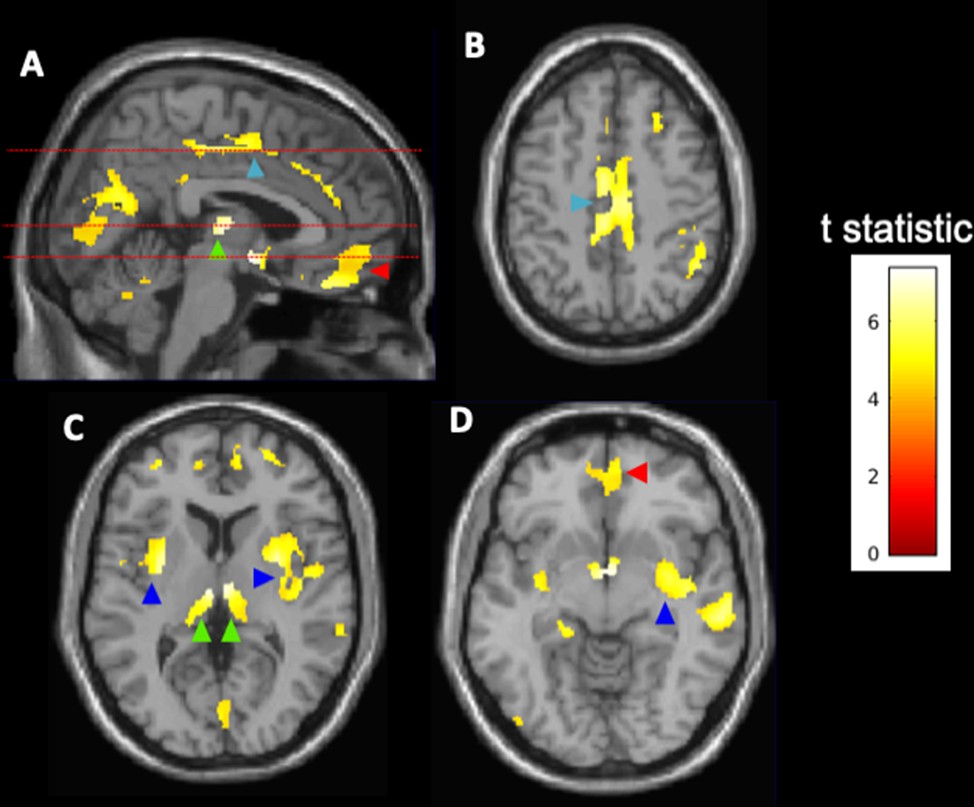
Voxel-wise associations of alcohol consumption with brain grey matter volumes (N = 10,143).
Highlighted clusters define regions in which reductions of spatially normalised grey matter volume are inversely correlated with log2-transformed alcohol consumption (g/d). The analysis suggests higher relative atrophy in the cingulate cortex (light blue arrowheads, A, B), thalamus (green arrowheads, A, C), orbital frontal cortex (red arrowheads, A, D), and insular cortex (dark blue arrowheads, C, D). Broken lines in (A) show levels for axial images in (B–D). The voxel-wise parametric model was adjusted for age, sex, ethnicity, body mass index, college degree education, hypertension, diabetes, and smoking history. The results are displayed on the MRI template available in SPM12 at axial slices of 46.5 mm (B), 6 mm (C), and –7.5 mm (D) relative to the bregma. The calibration bar provides the colour range use to describe t-scores calculated using a family-wise error (FWE)-corrected threshold of p<0.05.
Tables
Table 1
Participant characteristics.
| Brain grey matter | Brain white matter | Heart | Aorta | Liver | |
|---|---|---|---|---|---|
| N | 10,143 | 9053 | 11,821 | 12,376 | 3649 |
| Baseline characteristics | |||||
| Age (years) (mean ± SD) | 62.9 ± 7.4 | 62.9 ± 7.4 | 62.8 ± 7.4 | 63.0 ± 7.4 | 55.7 ± 7.5 |
| Male (%) | 49.8 | 49.4 | 49.9 | 50.2 | 50.5 |
| Caucasian (%) | 99.8 | 99.8 | 99.8 | 99.8 | 93.2 |
| Educational attainment (%) | 53.2 | 53.5 | 53.5 | 52.9 | 53.1 |
| Body mass index (mean ± SD) | 26.7 ± 4.4 | 26.6 ± 4.3 | 26.5 ± 4.3 | 26.5 ± 4.2 | 26.5 ± 4.1 |
| Hypertension (%) | 39.6 | 39.3 | 39.0 | 39.1 | 46.5 |
| Diabetes (%) | 5.2 | 5.0 | 4.7 | 4.9 | 2.5 |
| Smoking history (%) | 39.7 | 39.4 | 38.6 | 39.1 | 36 |
| Alcohol consumption (g/d) (median–IQR) | 14.29 (6.46–26.78) | 14.29 (6.26–26.79) | 14.29 (6.70–26.79) | 14.29 (6.69–26.79) | 16.61 (8.93–28.86) |
Table 2
Structural imaging phenotypes for brain (N = 10,143), heart (N = 11,821), and aorta (N = 12,376) in the UK Biobank.
| Imaging-derived phenotypes | Mean ± SD |
|---|---|
| Brain | |
| Normalised brain volume | 0.72 ± 0.045 |
| Normalised grey matter volume | 0.43 ± 0.034 |
| Normalised white matter volume | 0.29 ± 0.020 |
| Heart | |
| Left ventricular mass index (g/m2) | 46.2 ± 8.5 |
| Left ventricular end-diastolic volume index (ml/m2) | 80.0 ± 13.7 |
| Left ventricular ejection fraction (%) | 59.6 ± 5.9 |
| Left atrial volume index (ml/m2) | 38.8 ± 10.7 |
| Right ventricular end-diastolic volume index (ml/m2) | 84.5 ± 15.4 |
| Right ventricular ejection fraction (%) | 57.3 ± 6.0 |
| Right atrial volume index (ml/m2) | 46.1 ± 13.1 |
| Aorta | |
| Ascending aortic area index (mm2/m2) | 455.3 ± 91.9 |
| Ascending aortic distensibility (10−3mmHg−1) | 1.98 ± 1.17 |
| Descending aortic area index (mm2/m2) | 254.1 ± 43.3 |
| Descending aortic distensibility (10−3mmHg−1) | 2.64 ± 1.25 |
-
SD: standard deviation.
Table 3
Associations of age and alcohol consumption with cardiac (N = 11,821) and aortic (N = 12,376) imaging phenotypes.
| Aging/year, estimate* ± SE | p-value | Alcohol, estimate* ± SE | p-value | |
|---|---|---|---|---|
| Heart | ||||
| Left ventricular mass index | −0.10 ± 0.01 | 1.3 × 10⁻³¹ | 0.36 ± 0.04 | 8.5 × 10⁻²² |
| Left ventricular end-diastolic volume index | −0.33 ± 0.02 | 6.0 × 10−90 | 0.61 ± 0.07 | 4.1 × 10⁻¹⁷ |
| Left ventricular ejection fraction (%) | 0.04 ± 0.01 | 6.3 × 10⁻⁷ | 0.05 ± 0.03 | 0.16 |
| Left atrial volume index (ml/m2) | −0.12 ± 0.01 | 8.9 × 10⁻¹⁷ | 0.43 ± 0.06 | 6.0 × 10⁻¹² |
| Right ventricular end-diastolic volume index (ml/m2) | −0.33 ± 0.02 | 5.6 × 10−80 | 0.57 ± 0.08 | 2.5 × 10⁻¹³ |
| Right ventricular ejection fraction (%) | 0.04 ± 0.01 | 1.6 × 10⁻⁸ | 0.05 ± 0.03 | 0.13 |
| Right atrial volume index (ml/m2) | 0.04 ± 0.02 | 6.9 × 10⁻³ | 0.26 ± 0.07 | 3.0 × 10⁻⁴ |
| Aorta | ||||
| Ascending aortic area index (mm2/m2) | 2.75 ± 0.11 | 4.0 × 10−130 | 2.64 ± 0.50 | 1.5 × 10⁻⁷ |
| Ascending aortic distensibility (10−3mmHg−1) | −0.09 ± 0.001 | <1 × 10−300 | −0.006 ± 0.005 | 0.22 |
| Descending aortic area index (mm2/m2) | 1.86 ± 0.05 | 2.0 × 10−291 | 1.34 ± 0.22 | 2.1 × 10⁻⁹ |
| Descending aortic distensibility (10−3mmHg−1) | −0.09 ± 0.001 | <1 × 10−300 | –0.02 ± 0.005 | 7.5 × 10⁻⁴ |
-
*Estimates ± SE define coefficients for cardiac and aortic imaging phenotype changes per year age or per doubling of alcohol consumption (g/d) with their standard errors. The aging model was adjusted for sex, ethnicity, body mass index, and prevalence of college degree education, hypertension, diabetes, and smoking history. The alcohol consumption model was adjusted for age, sex, ethnicity, body mass index, and prevalence of college degree education, hypertension, diabetes, and smoking history. SE, standard error.
Additional files
-
Supplementary file 1
Alcohol consumption (g/d) in all and males and females for brain grey matter (N = 10,143), brain white matter (N = 9053), heart (N = 11,821), aorta (N = 12,376), and liver (N = 3649).
- https://cdn.elifesciences.org/articles/65325/elife-65325-supp1-v2.docx
-
Supplementary file 2
Coefficients for log2 alcohol and age in an expanded model for cardiac (N = 11,821) and aortic (N = 12,376) imaging phenotypes including tests of interactions between log2 alcohol and age.
- https://cdn.elifesciences.org/articles/65325/elife-65325-supp2-v2.docx
-
Transparent reporting form
- https://cdn.elifesciences.org/articles/65325/elife-65325-transrepform-v2.docx
-
Reporting standard 1
STROBE checklist.
- https://cdn.elifesciences.org/articles/65325/elife-65325-repstand1-v2.docx
Download links
A two-part list of links to download the article, or parts of the article, in various formats.
Downloads (link to download the article as PDF)
Open citations (links to open the citations from this article in various online reference manager services)
Cite this article (links to download the citations from this article in formats compatible with various reference manager tools)
Alcohol consumption in the general population is associated with structural changes in multiple organ systems
eLife 10:e65325.
https://doi.org/10.7554/eLife.65325


