Image3C, a multimodal image-based and label-independent integrative method for single-cell analysis
- Stowers Institute for Medical Research, United States
- Howard Hughes Medical Institute, Stowers Institute for Medical Research, United States
- Institute for Evolution and Biodiversity, University of Münster, Germany
- Department of Molecular and Integrative Physiology, KU Medical Center, United States
Figures
Figure 1 with 1 supplement
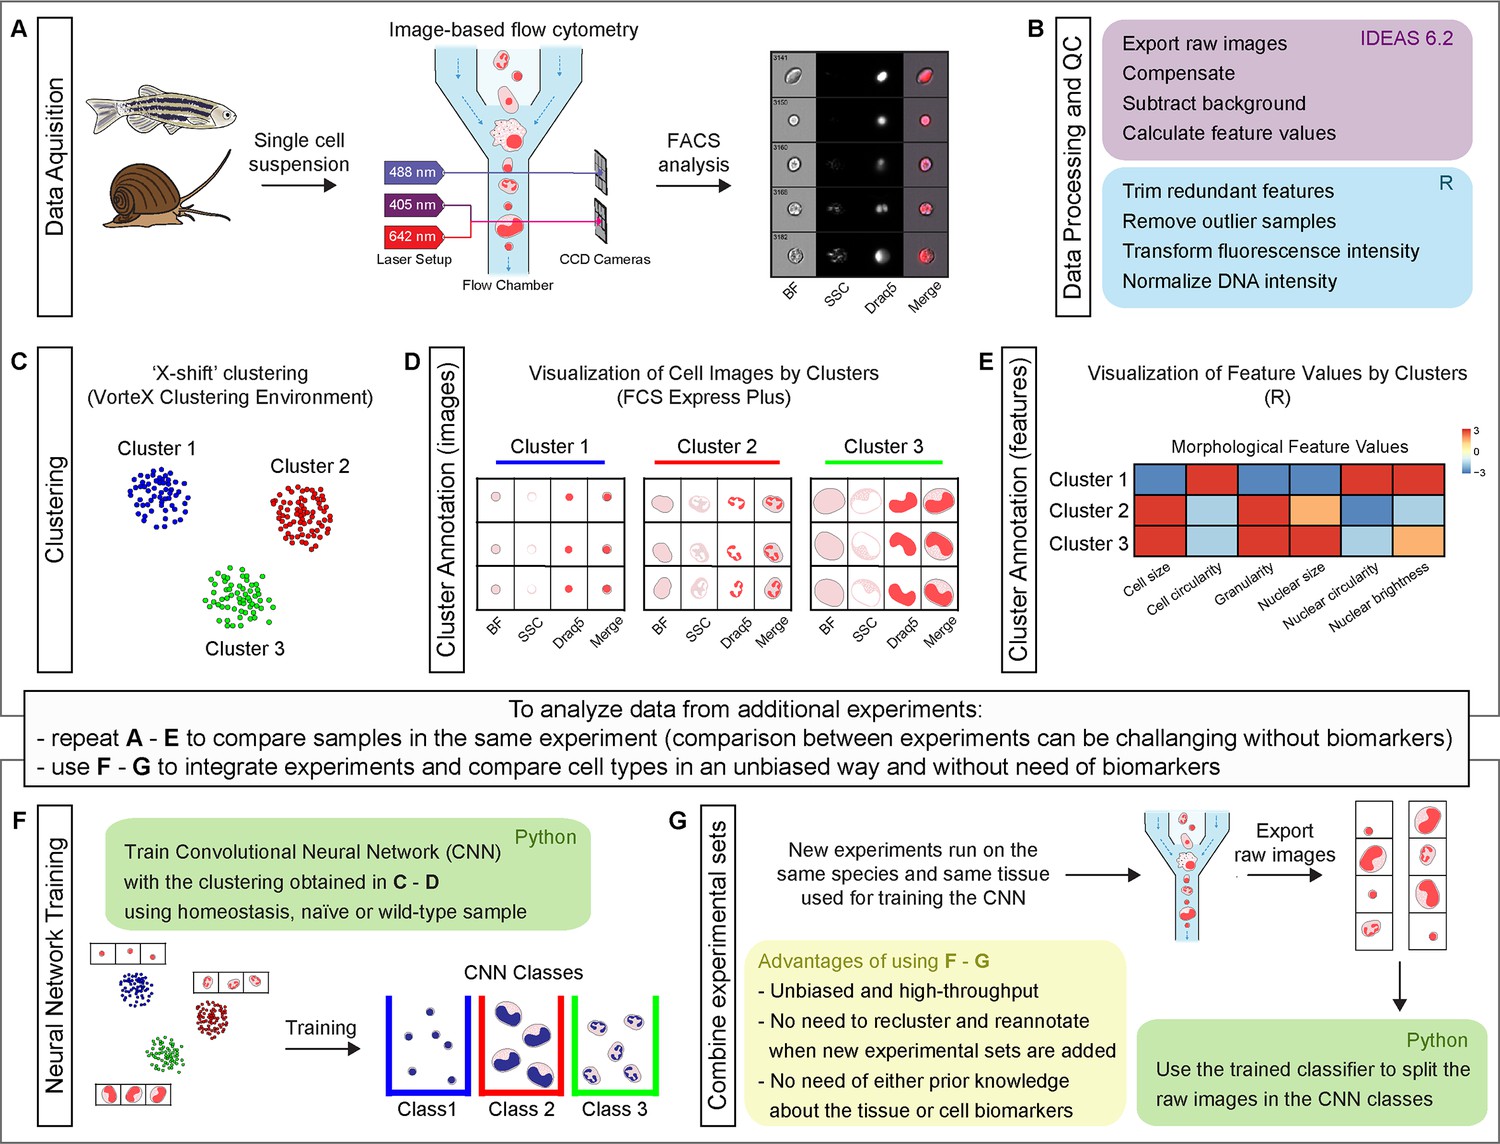
Schematic representation of Image3C workflow, a method for cell clustering based on morphological features.
(A) A single cell suspension is prepared for image-based flow cytometric analyses. The cells can be labeled with any reagent working for the species of interest. The signal can highlight specific cell components (e.g., nuclei), metabolic cell states, or specific cell functions. The samples are run on the ImageStreamX Mark II, and 10,000 nucleated and focused events are saved for each sample as individual raw images. (B) IDEAS software is used to open the raw images, compensate for correcting fluorescent spillover, subtract background, and quantify values for intrinsic morphological and fluorescent features. R (or R studio) is used to calculate the correlation between features to allow to trim the features that are redundant with others. Samples that are outliers among replicates are also removed prior to the final normalization of the fluorescence intensities. (C) Images are clustered based on morphological and fluorescent feature values and visualized as a force-directed layout (FDL) graph where each dot represents one event. (D) R integration in FCS Express Plus software allows the visualization of cell images by clusters or specifically selected with a gate. This step allows to evaluate the morphological homogeneity of the clusters, determine if the number of clusters is appropriate, and explore the phenotype/function of the cells based on visualization of individual channels. (E) Spearman’s correlation plot of feature values by clusters is one of the options available in Image3C for plotting integrated data. This heatmap shows feature similarities and differences between cells belonging to different clusters. (F) If new experiments are run and new data needs to be analyzed, two approaches can be taken. (1) If the goal is comparing samples belonging to the same experiment (e.g., treatment vs. control), the steps described so far from (A) to (E) can be reapplied to the new dataset including a statistical analysis to compare cluster relative abundance. This approach will produce a new set of clusters that will need to be reannotated. Compare sets of clusters coming from multiple experiments and multiple rounds of analysis can be challenging without pre-existing knowledge of cell types, clearly different morphologies or biomarkers that would allow to establish a unique correlation between clusters coming from different FDL graphs. (2) If the goal is integrating experiments and comparing cell type abundance between them, the use of steps (F) and (G) is suggested. A CNN classifier is trained using the images obtained from homeostasis, naïve or wild-type (WT) cells, and already organized in clusters in an unbiased way through the first part of our method. This will generate a trained classifier with CNN classes based on FDL clusters. (G) This classifier is then used for deconvoluting data from new experimental sets and assigning each event to a CNN class with a given probability. This provides high-throughput and unbiased way to compare different experiment sets without the requirement for pre-existing knowledge about the tissue cell types, cell biomarkers, or the need to cross-annotate clusters increasing the probability to introduce errors. The entire pipeline chart and step-by-step technical information, such as software used, time required for processing, and exported file format, are reported in the interactive map Figure 1—figure supplement 1 that automatically directs to the specific sections of the GitHub.
Figure 1—figure supplement 1
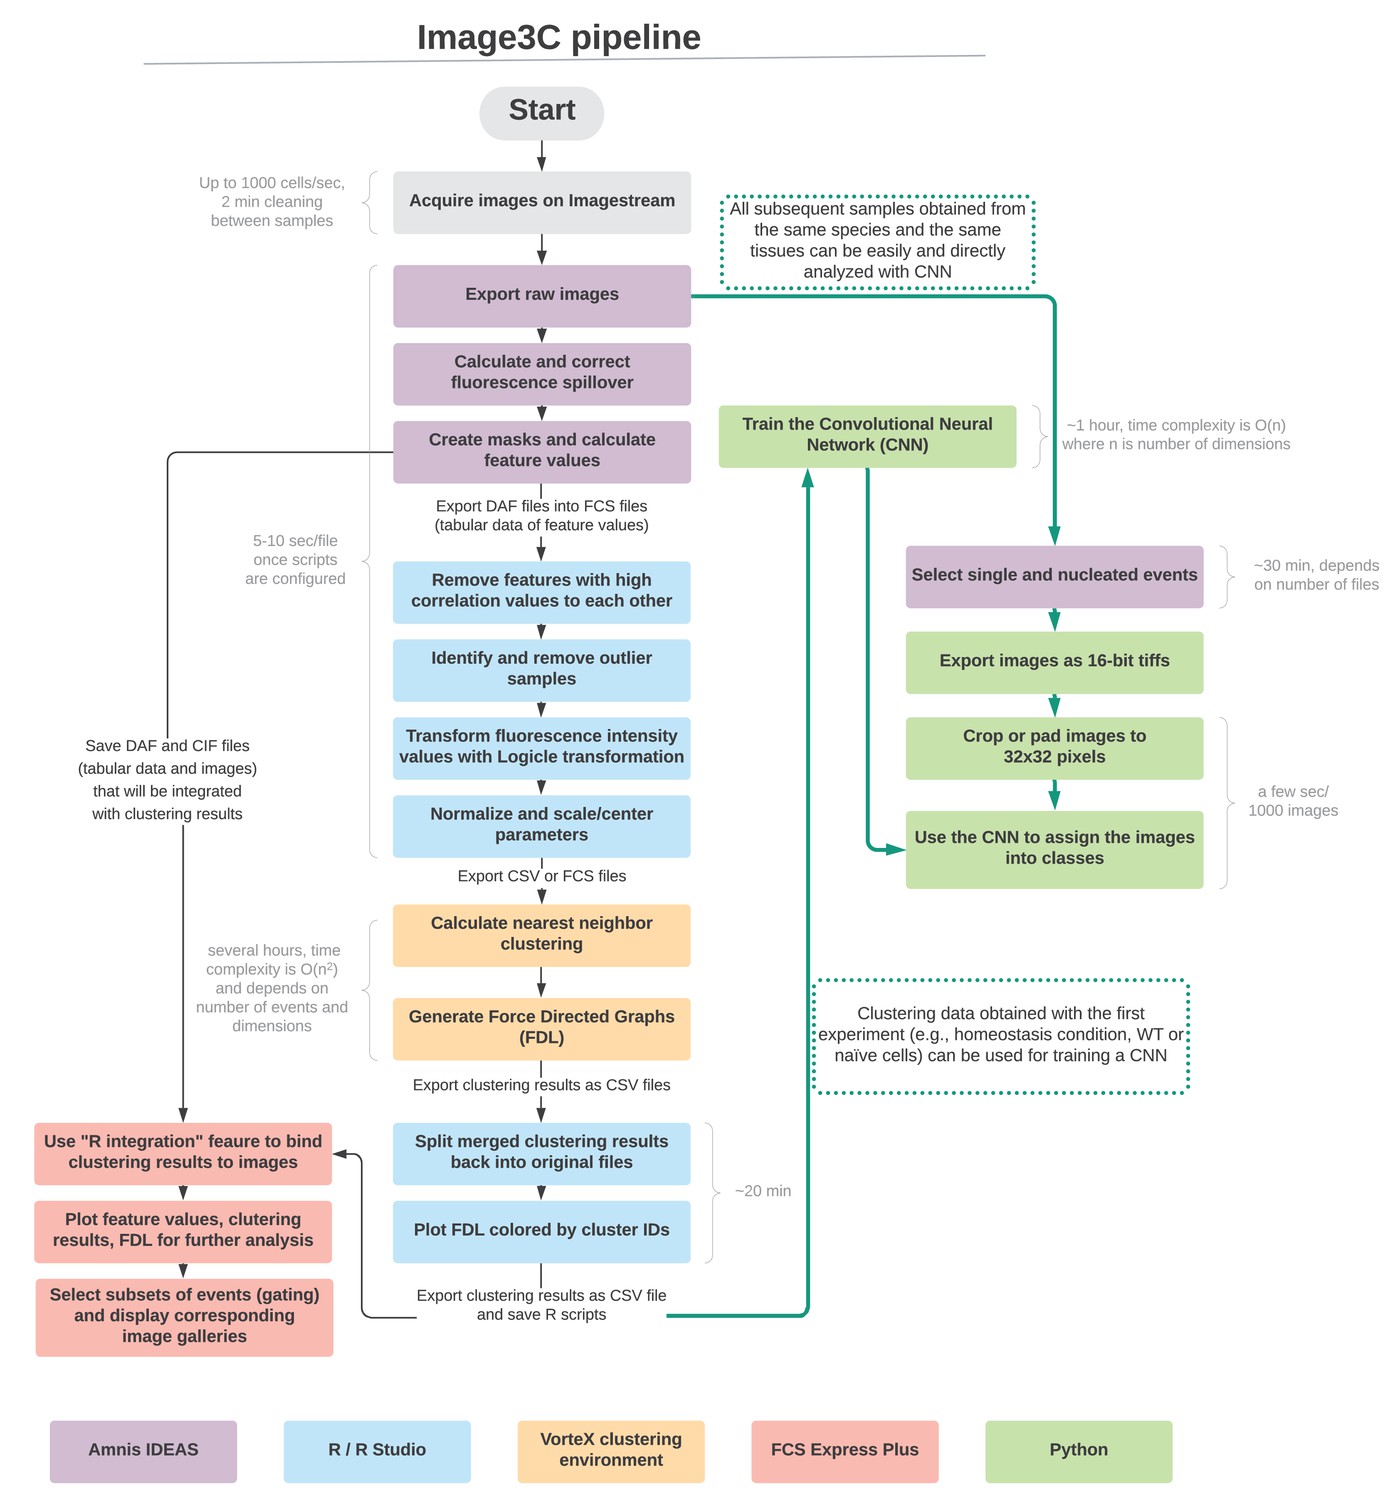
Interactive map of Image3C pipeline. Once the images are collected, this pipeline can be followed step-by-step.
Through this interactive map, it is possible to click on the different portions of the pipeline and be automatically directed to the corresponding section of the GitHub repository (https://github.com/stowersinstitute/LIBPB-1390-Image3C), where a detailed step-by-step description of the processing, sample scripts, workflow files, and example datasets are provided. The software used are color-coded throughout the pipeline, and approximation of the time needed to run the individual steps is provided in light gray. The central column and the left side represent the de novo clustering portion of the pipeline, while the right side (green arrows) represents the use of the convolutional neural network (CNN), being trained with the clusters defined in an unbiased way from the de novo clustering and able to process new samples.
Figure 2 with 3 supplements
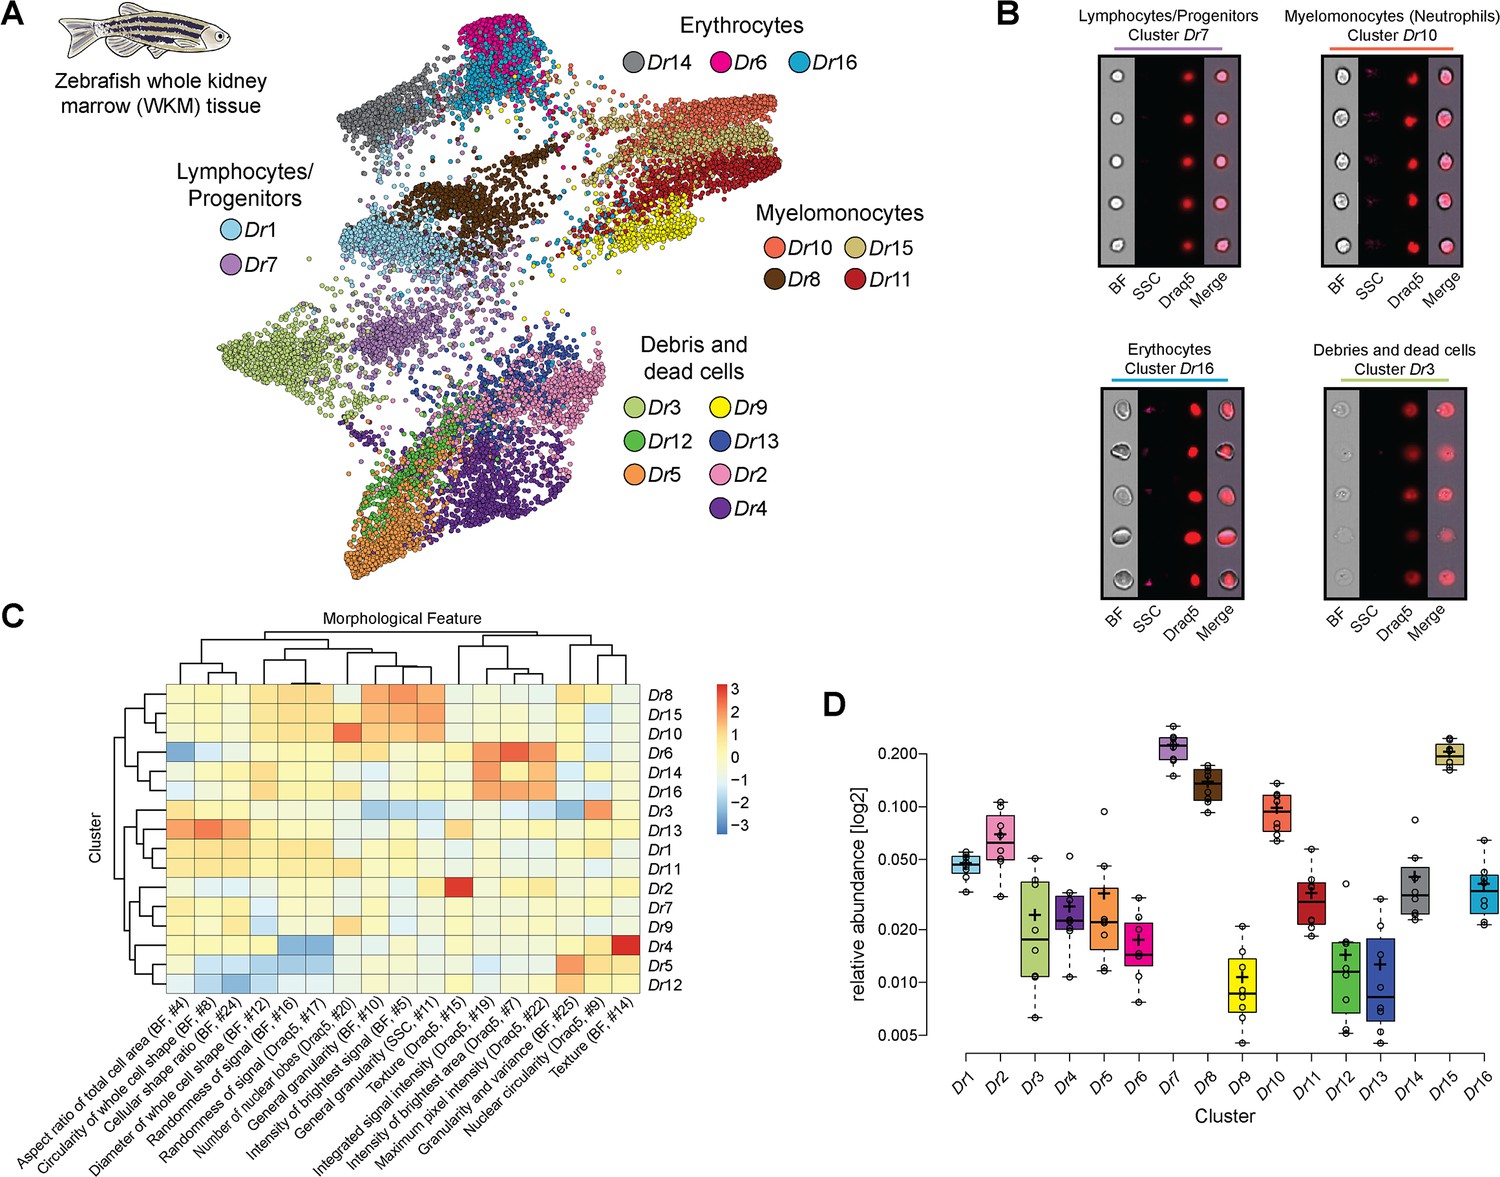
Analysis of cell composition of adult zebrafish whole kidney marrow (WKM).
(A) WKM tissue obtained from zebrafish is prepared for image-based flow cytometric analyses and run on the ImageStreamX Mark II (n = 8). Standard gating of focused and nucleated events and manual outgating of most erythrocytes was performed using IDEAS software. The selected images were processed through the pipeline described in Figure 1 and clustered based only on intrinsic morphological and fluorescent feature values. Force-directed layout (FDL) graph visualizes 16 clusters, and each color represents a unique cell cluster. (B) Representative cell images belonging to each cluster are shown to evaluate the homogeneity of the cluster and determine morphology of the cells for cluster annotation. Representative cells for all the identified clusters are shown in Supplementary file 4. Merge represents the overlay of brightfield (BF) and Draq5 (nuclear staining) signal. (C) Spearman’s correlation plot shows the average feature values of the images in each cluster to highlight morphological similarities and differences between events belonging to different clusters, such as cell size or cytoplasm granularity (Supplementary file 1). (D) Box plot of relative abundance of events within each cluster follows the same color code used in (A).
Figure 2—figure supplement 1

Feature correlation for morphology assay on adult zebrafish whole kidney marrow (WKM).
An example of feature correlation and feature trimming step is shown. The correlation between feature is calculated (A) and the redundant features are removed in order to leave only one representative feature for each group of features with high correlation (B).
Figure 2—figure supplement 2

Sample correlation for morphology assay on adult zebrafish whole kidney marrow (WKM).
Sample correlation and outlier sample removal step performed on samples of adult zebrafish WKM. The correlation between samples is calculated, and samples with clear outlier profile are removed from the subsequent analysis.
Figure 2—figure supplement 3
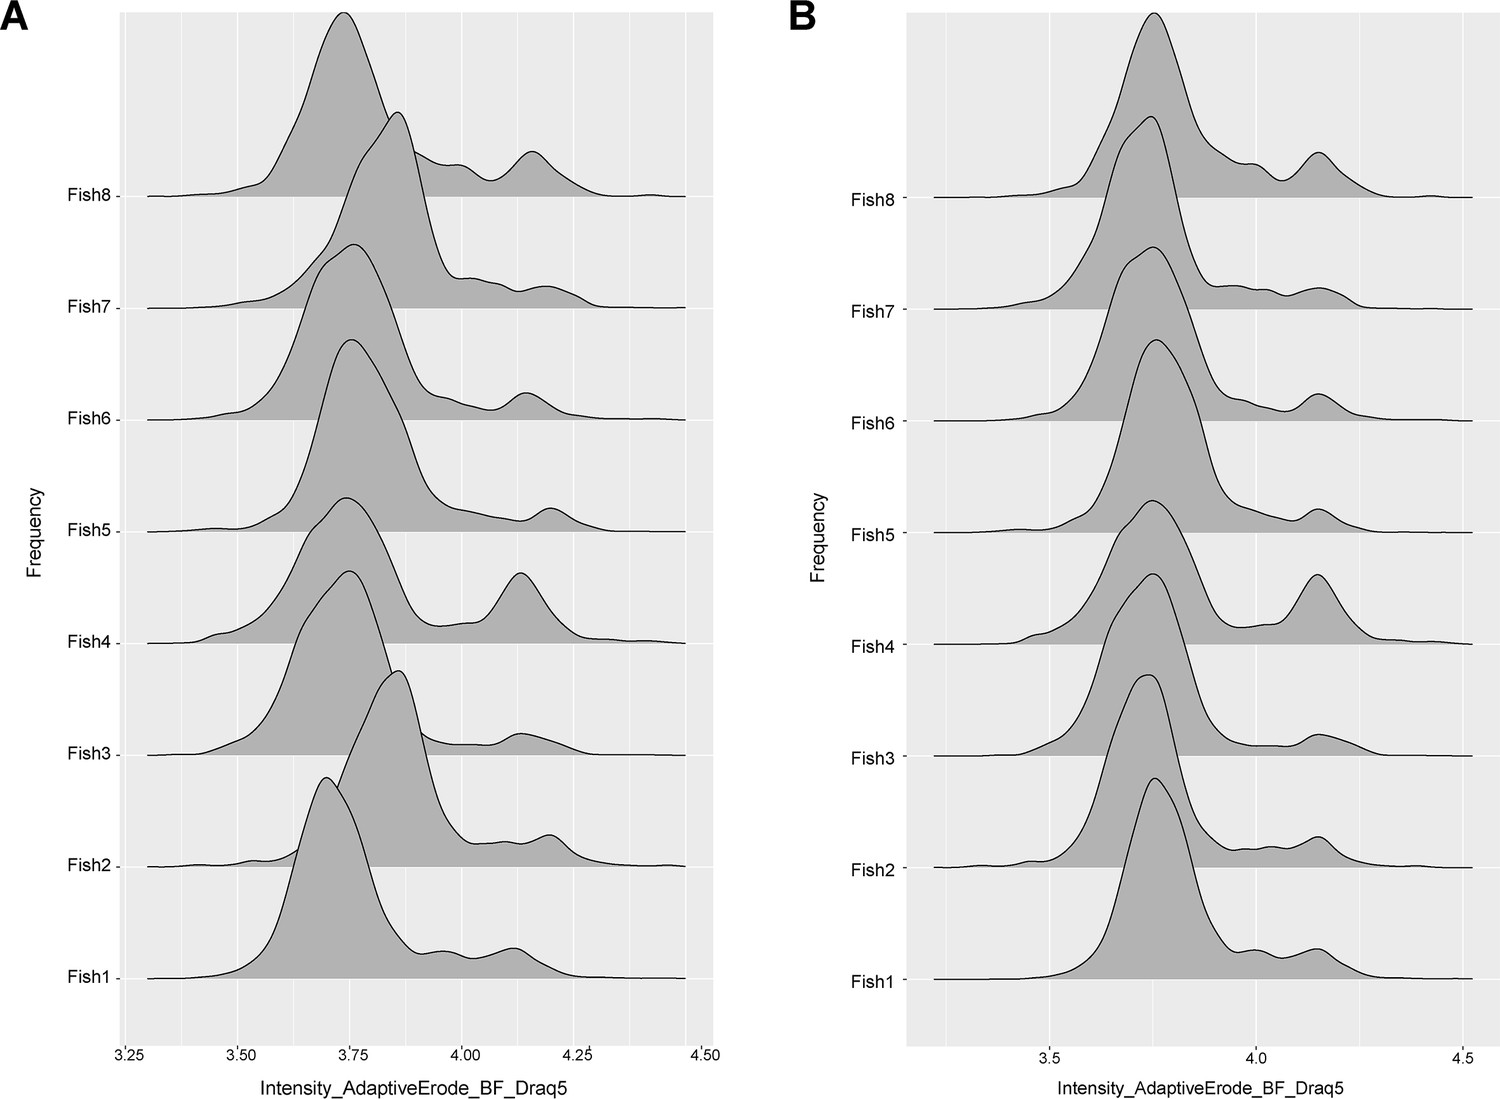
DNA normalization for morphology assay on adult zebrafish whole kidney marrow (WKM).
An example of DNA normalization step is shown. The fluorescent peaks of DNA staining for all the samples of one experiment are shown before (A) and after (B) normalization that aims to align the 2N and 4N peaks across samples.
Figure 3 with 2 supplements
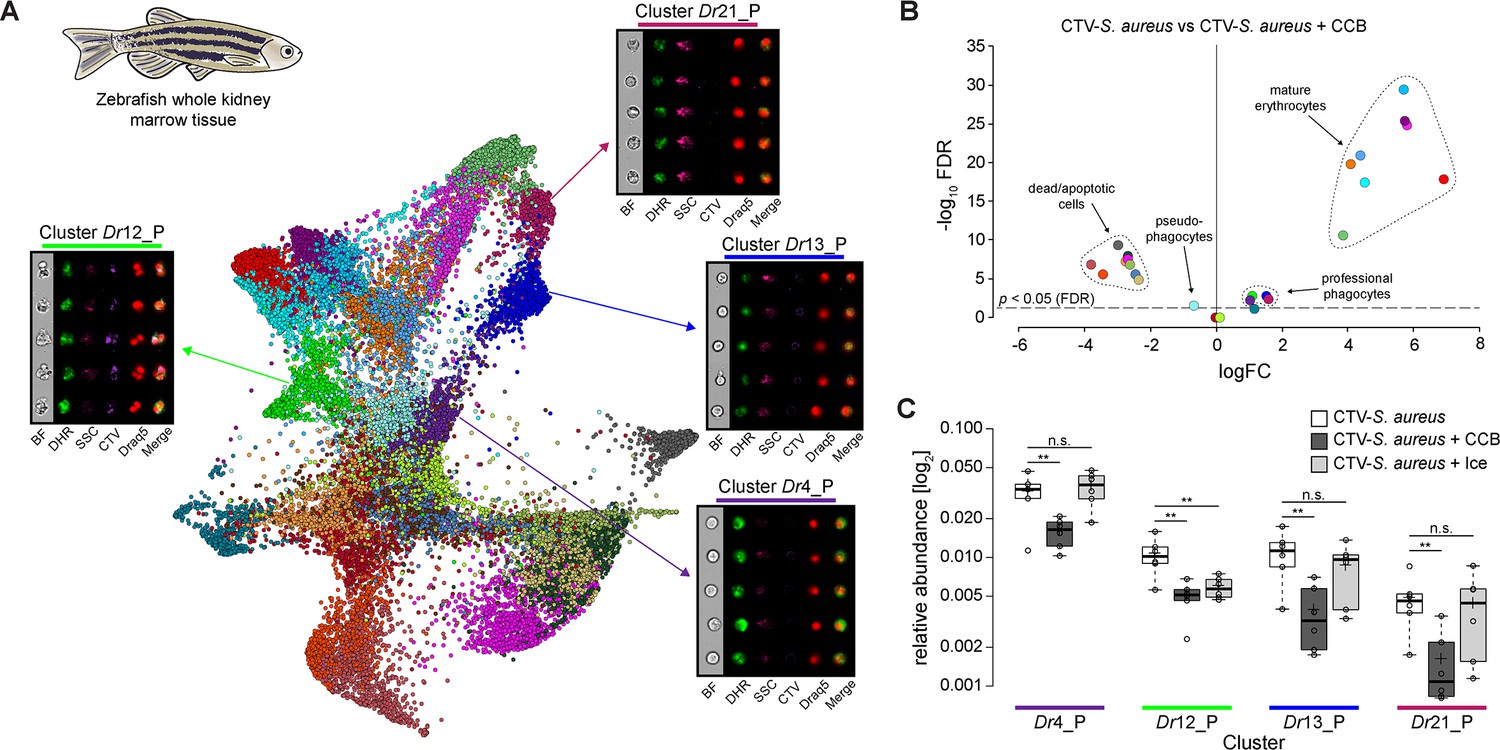
Identification of professional phagocytes in zebrafish whole kidney marrow (WKM).
(A) A phagocytosis assay was performed on a cell suspension obtained from zebrafish WKM tissue and the samples were subsequently run on the ImageStreamX Mark II (n = 6). Force-directed layout (FDL) graph shows 26 clusters, and each color represents a unique cell cluster. Representative cell images belonging to the 4 clusters containing professional phagocytes are shown. Representative cells for all the identified clusters are shown in Supplementary file 7. Merge represents the overlay of dihydrorhodamine-123 (DHR) (reactive oxygen species indicator), CellTrace Violet (CTV) (S. aureus labeling), and Draq5 (nuclear staining) channels. Supplementary file 2 reports the features used for this clustering. (B) Volcano plot illustrates comparison of cluster relative abundance between phagocytosis samples (CTV-S. aureus) and inhibited phagocytosis samples (CTV-S. aureus + CCB). The log fold change (logFC) is plotted in relation to the false discovery rate (FDR)-corrected p-value (-log10) of each individual cluster calculated with negative binomial regression model (n = 6) (Supplementary file 5). Dot color follows the same color code used in (A). (C) Box plot of relative abundances of events within the 4 clusters containing professional phagocytes in the 3 samples: phagocytosis samples (CTV-S. aureus), CCB-inhibited phagocytosis samples (CTV-S. aureus + CCB), and ice-inhibited phagocytosis samples (CTV-S. aureus + Ice) (Figure 3—figure supplement 2). Statistically significant differences are calculated using the negative binomial regression model between the phagocytosis and the inhibited phagocytosis samples (Supplementary files 5 and 6). ** indicates p≤0.01 and n.s. indicates not significantly different after FDR (n = 6).
Figure 3—figure supplement 1

Sample correlation for phagocytosis assay on adult zebrafish whole kidney marrow (WKM).
Sample correlation and outlier sample removal step performed on samples of adult zebrafish WKM after phagocytosis assay. The correlation between samples is calculated, and samples with clear outlier profile are removed from the subsequent analysis.
Figure 3—figure supplement 2
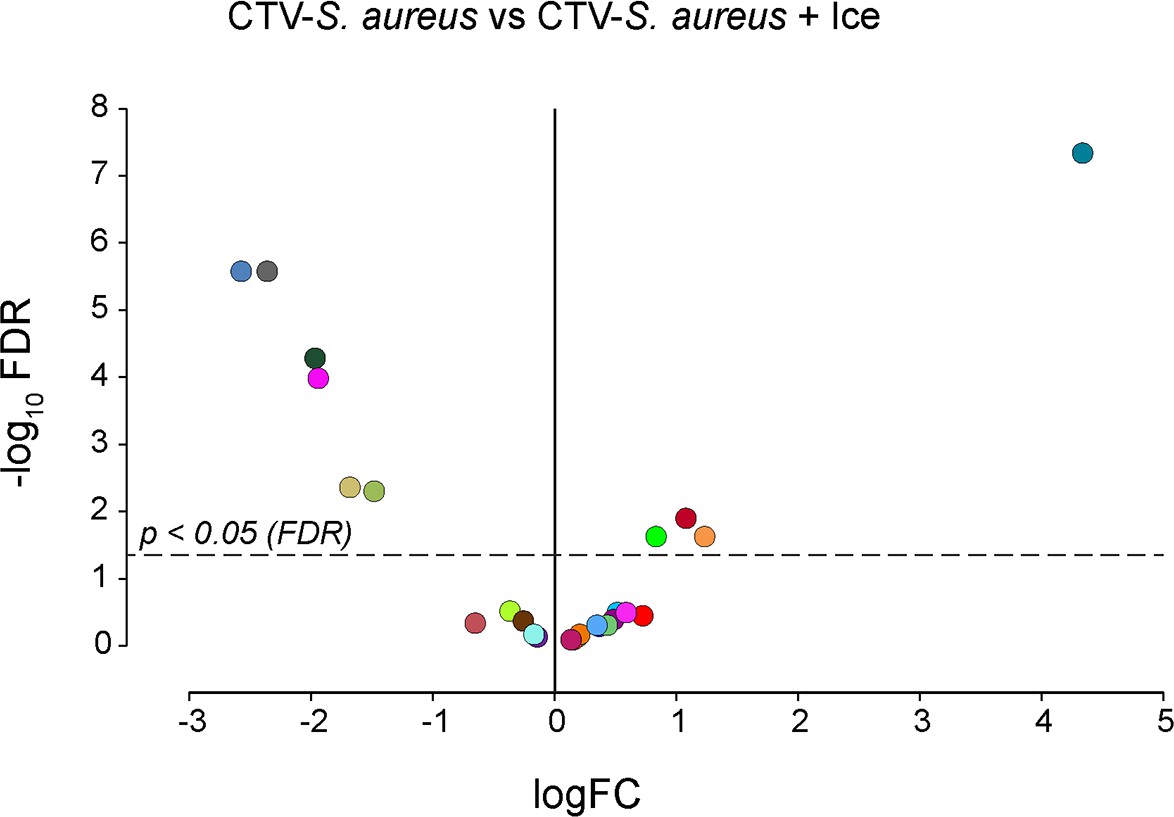
Phagocytosis assay on adult zebrafish whole kidney marrow (WKM) (ice phagocytosis inhibition).
Volcano plot illustrates comparison between phagocytosis samples (CellTrace Violet labeled Staphylococcus aureus [CTV-S. aureus]) and ice-inhibited phagocytosis samples (CTV-S. aureus + Ice). The log fold change (logFC) is plotted in relation to the false discovery rate (FDR)-corrected p-value (-log10) of each individual cluster calculated with negative binomial regression model (n = 6) (Supplementary file 6). Dot color follows the same color code used in Figure 3A.
Figure 4 with 1 supplement
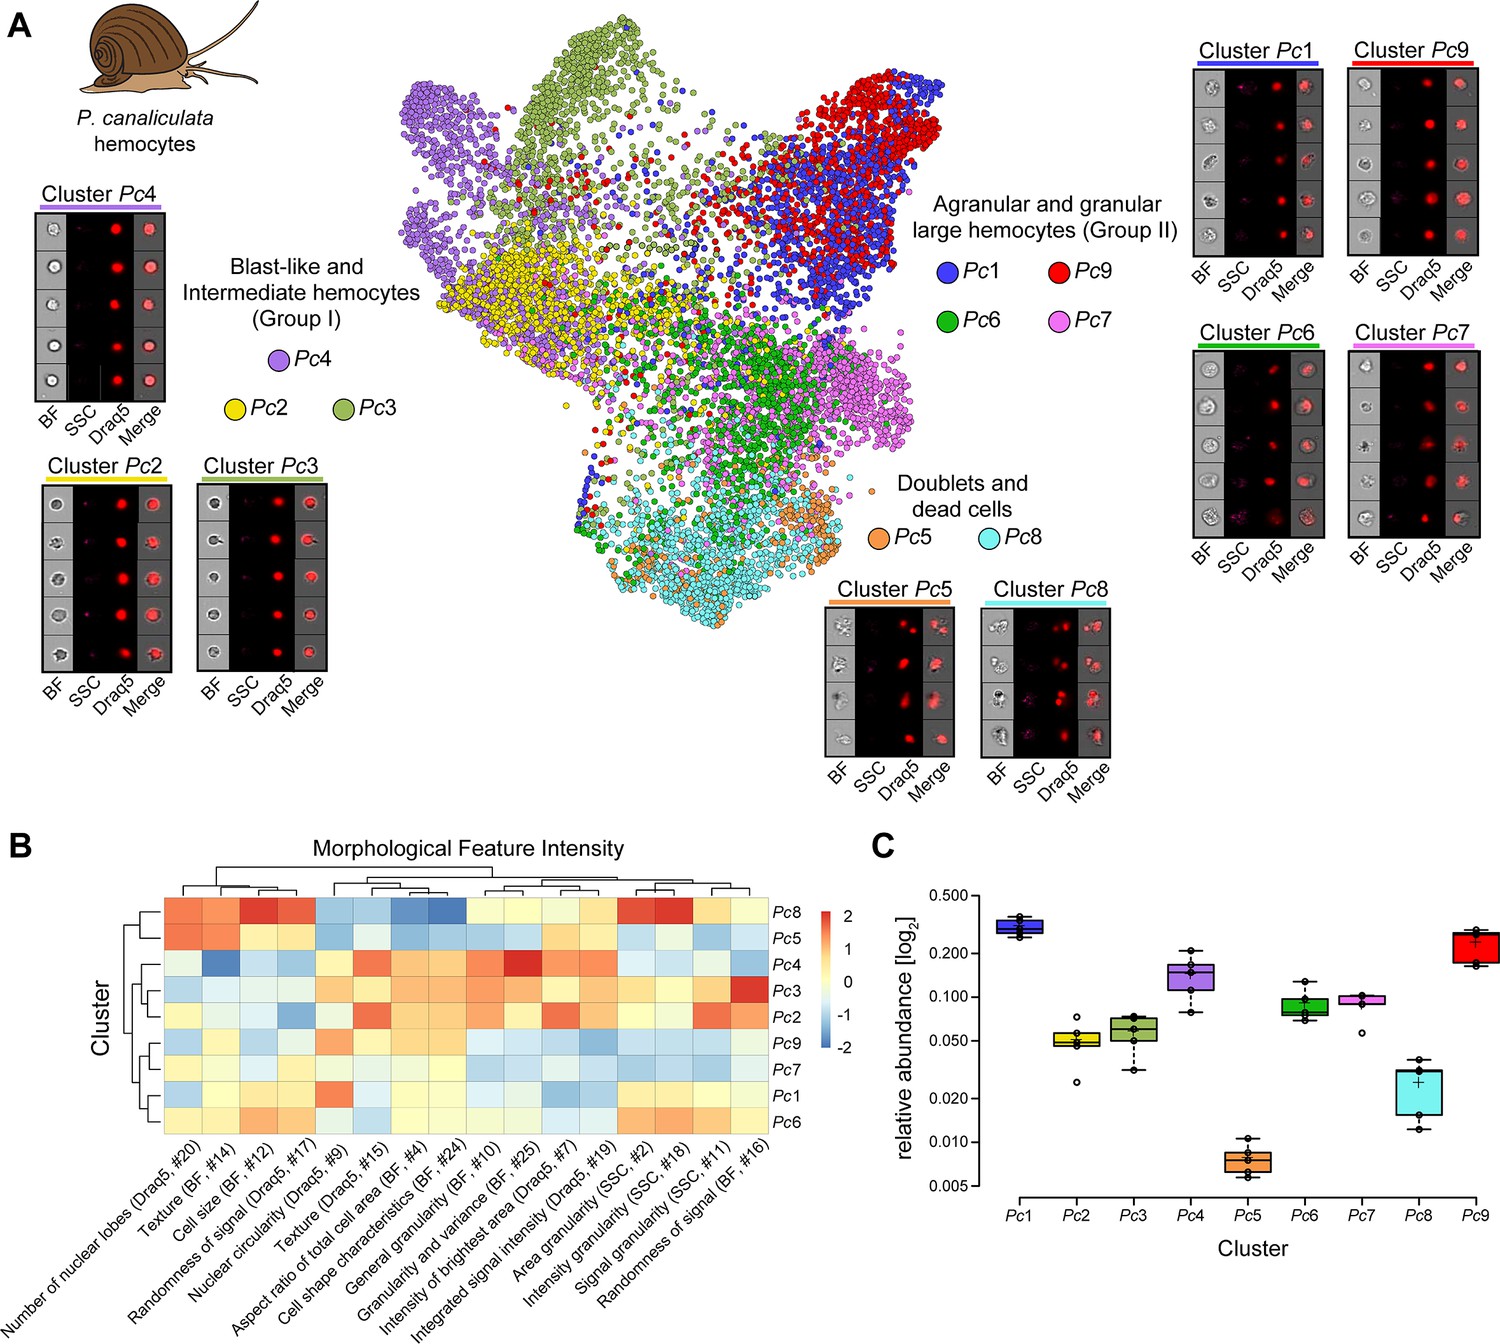
Analysis of P. canaliculata hemocyte population using only intrinsic morphological features of the cells.
(A) Hemocytes obtained from the apple snail P. canaliculata are prepared for image-based flow cytometric analyses and run on the ImageStreamX Mark II (n = 5). Standard gating of focused and nucleated events was performed using IDEAS software. The selected images were processed through the pipeline described in Figure 1 and clustered based only on intrinsic morphological and fluorescent feature values. Force-directed layout (FDL) graph is used to visualize the 9 identified clusters, and each color represents a unique cell cluster. Representative cell images belonging to each cluster are shown to evaluate the homogeneity of the cluster and determine morphology of the cells for cluster annotation. Additional representative cells for all the identified clusters are shown in Supplementary file 8. Merge represents the overlay of brightfield (BF) and Draq5 (nuclear staining) signal. (B) Spearman’s correlation plot shows the average feature values of the images in each cluster to highlight morphological similarities and differences between events belonging to different clusters, such as cell size or cytoplasm granularity (Supplementary file 1). Cluster Pc6 is the one among large hemocytes with higher values in features describing cytoplasm granularity (i.e., area granularity #2, intensity granularity #18, and signal granularity #11). (C) Box plot of relative abundance of events within each cluster following the same color code used in (A). Clusters Pc5 and Pc8, constituted by duplets and dead cells, are those with the lowest number of events, validating the protocol used to prepare these samples.
Figure 4—figure supplement 1

Sample correlation for morphology assay on P. canaliculata hemocytes.
Sample correlation and outlier sample removal step performed on samples of P. canaliculata hemocytes. The correlation between samples is calculated, and samples with clear outlier profile are removed from the subsequent analysis.
Figure 5 with 4 supplements
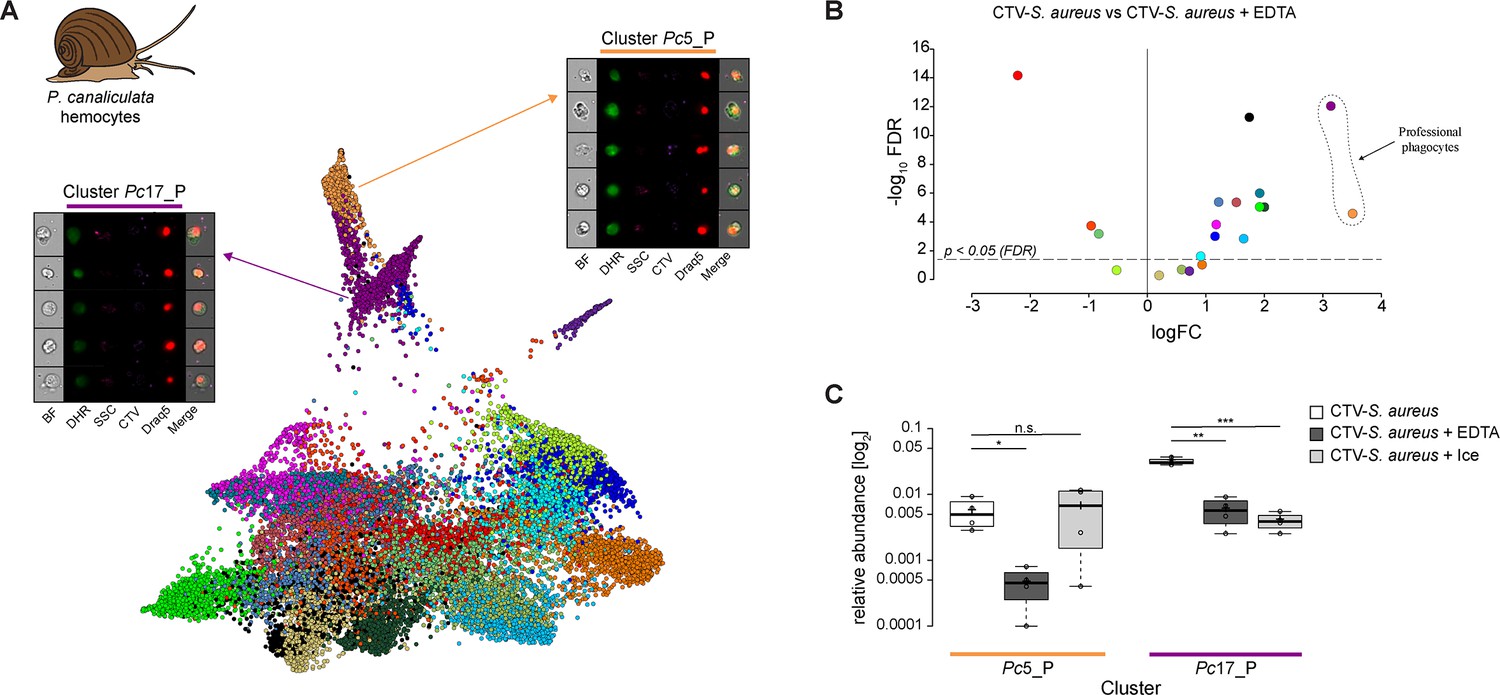
Identification of professional phagocytes among P. canaliculata hemocytes.
(A) A phagocytosis assay was performed on a cell suspension obtained from apple snail P. canaliculata hemolymph, and the samples were subsequently run on the ImageStreamX Mark II (n = 5). Force-directed layout (FDL) graph shows 20 clusters, and each color represents a unique cell cluster. Representative cell images belonging to the two clusters containing professional phagocytes are shown. Representative cells for all the identified clusters are shown in Supplementary file 11. Merge represents the overlay of dihydrorhodamine-123 (DHR) (reactive oxygen speciesindicator), CellTrace Violet (CTV) (S. aureus labeling), and Draq5 (nuclear staining) channels. Supplementary file 2 reports the features used for this clustering. (B) Volcano plot illustrates comparison of cluster relative abundance between phagocytosis samples (CTV-S. aureus) and inhibited phagocytosis samples (CTV-S. aureus + EDTA). The log fold change (logFC) is plotted in relation to the false discovery rate (FDR)-corrected p-value (-log10) of each individual cluster calculated with negative binomial regression model (n = 4) (Supplementary file 9). Dot color follows the same color code used in (A). (C) Box plot of relative abundances of events within the two clusters containing professional phagocytes in the 3 samples: phagocytosis samples (CTV-S. aureus), EDTA-inhibited phagocytosis samples (CTV-S. aureus + EDTA), and ice-inhibited phagocytosis samples (CTV-S. aureus + Ice) (Figure 5—figure supplement 2). Statistically significant differences are calculated using the negative binomial regression model between the phagocytosis and the inhibited phagocytosis samples (Supplementary files 9 and 10). ** indicates p≤0.01 and n.s. indicates not significantly different after FDR (n = 4).
Figure 5—figure supplement 1
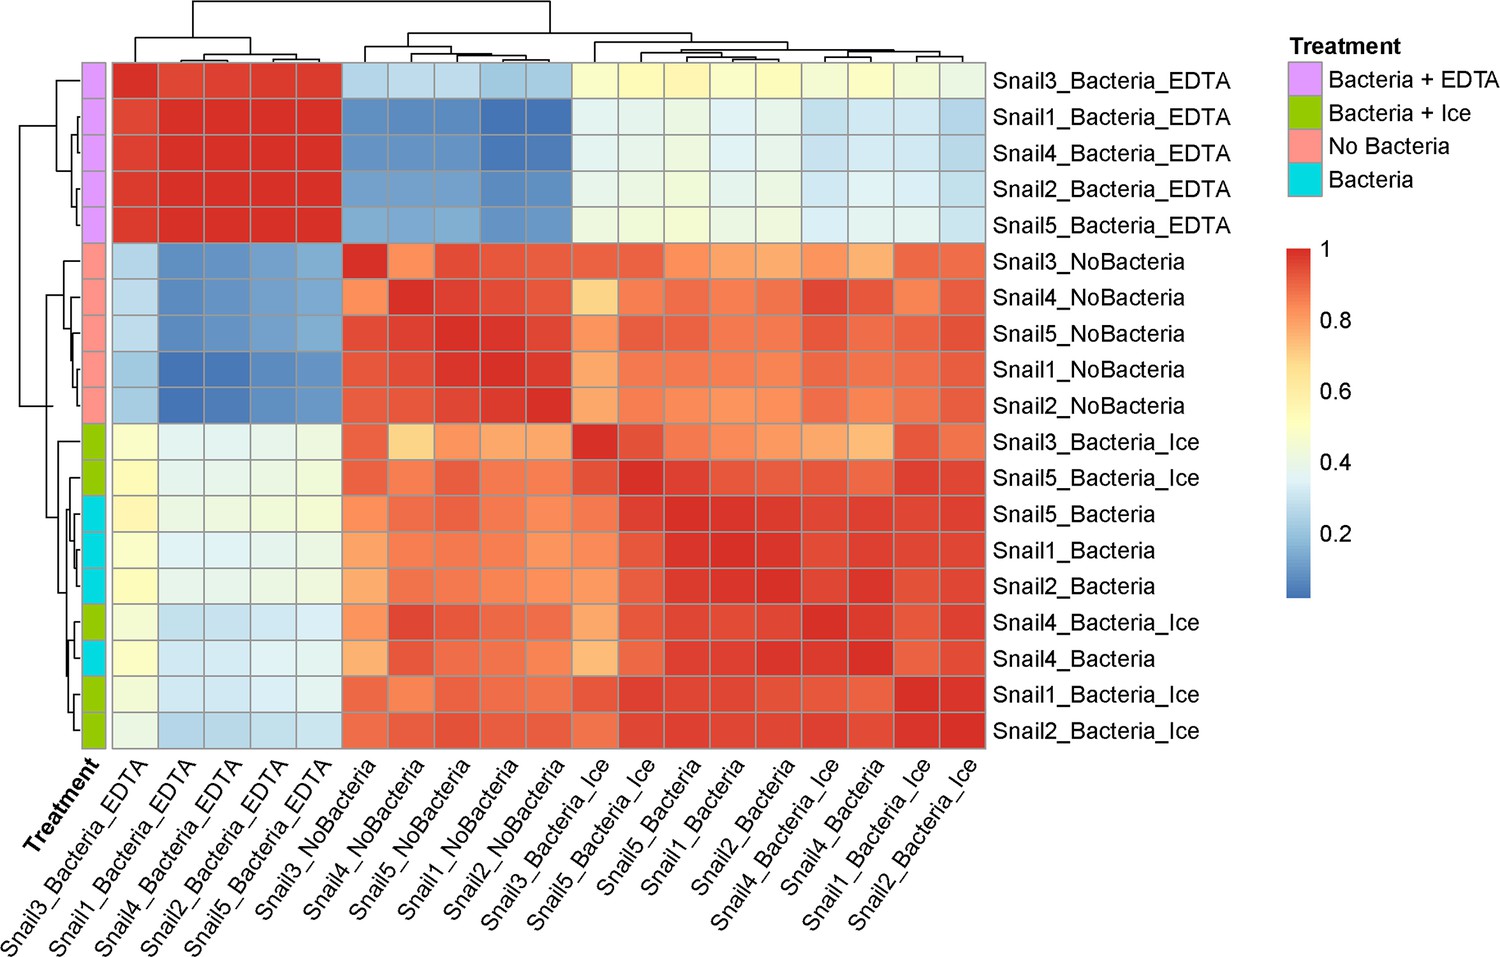
Sample correlation for phagocytosis assay on P. canaliculata hemocytes.
Sample correlation and outlier sample removal step performed on samples of P. canaliculata hemocytes after phagocytosis assay. The correlation between samples is calculated, and samples with clear outlier profile are removed from the subsequent analysis.
Figure 5—figure supplement 2
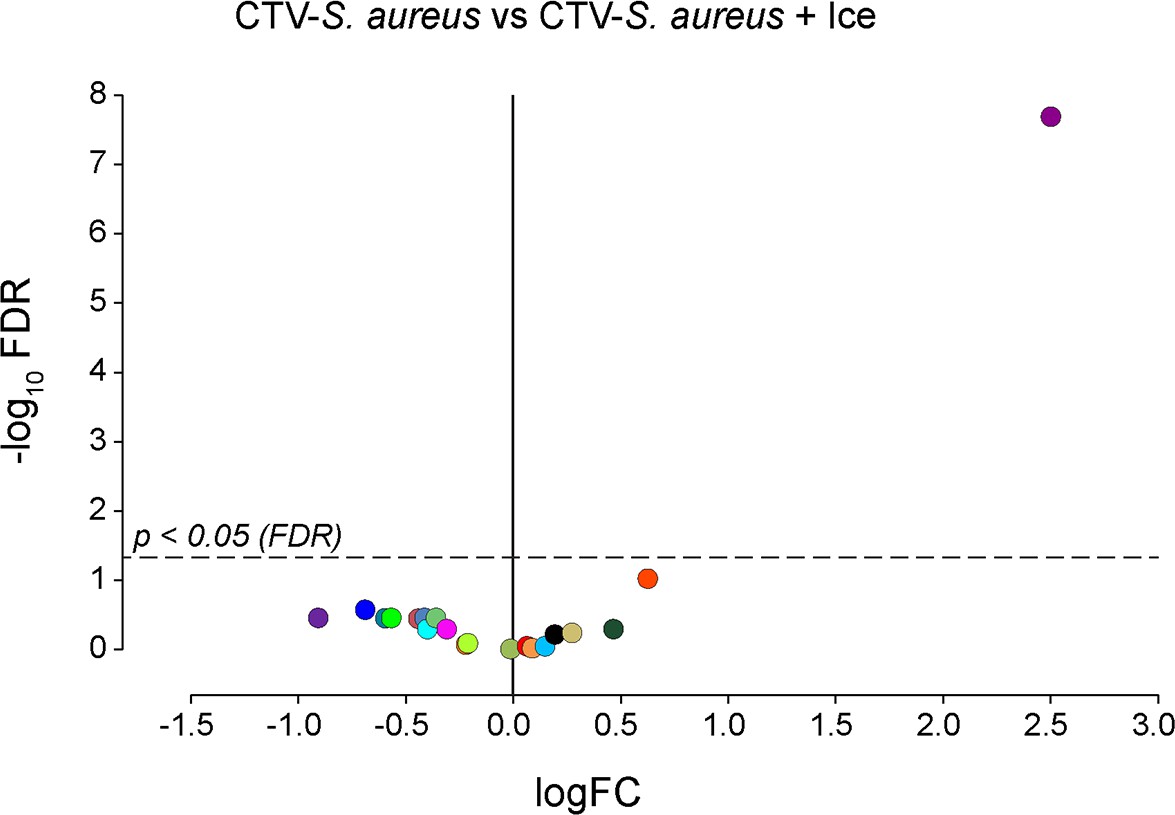
Phagocytosis assay on P. canaliculata hemocytes (ice-inhibited phagocytosis).
Volcano plot illustrates comparison between phagocytosis samples (CellTrace Violet labeled Staphylococcus aureus [CTV-S. aureus]) and inhibited phagocytosis samples (CTV-S. aureus + Ice). The log fold change (logFC) is plotted in relation to the false discovery rate (FDR)-corrected p-value (-log10) of each individual cluster calculated with negative binomial regression model (n = 4) (Supplementary file 10). Dot color follows the same color code used in Figure 5A.
Figure 5—figure supplement 3
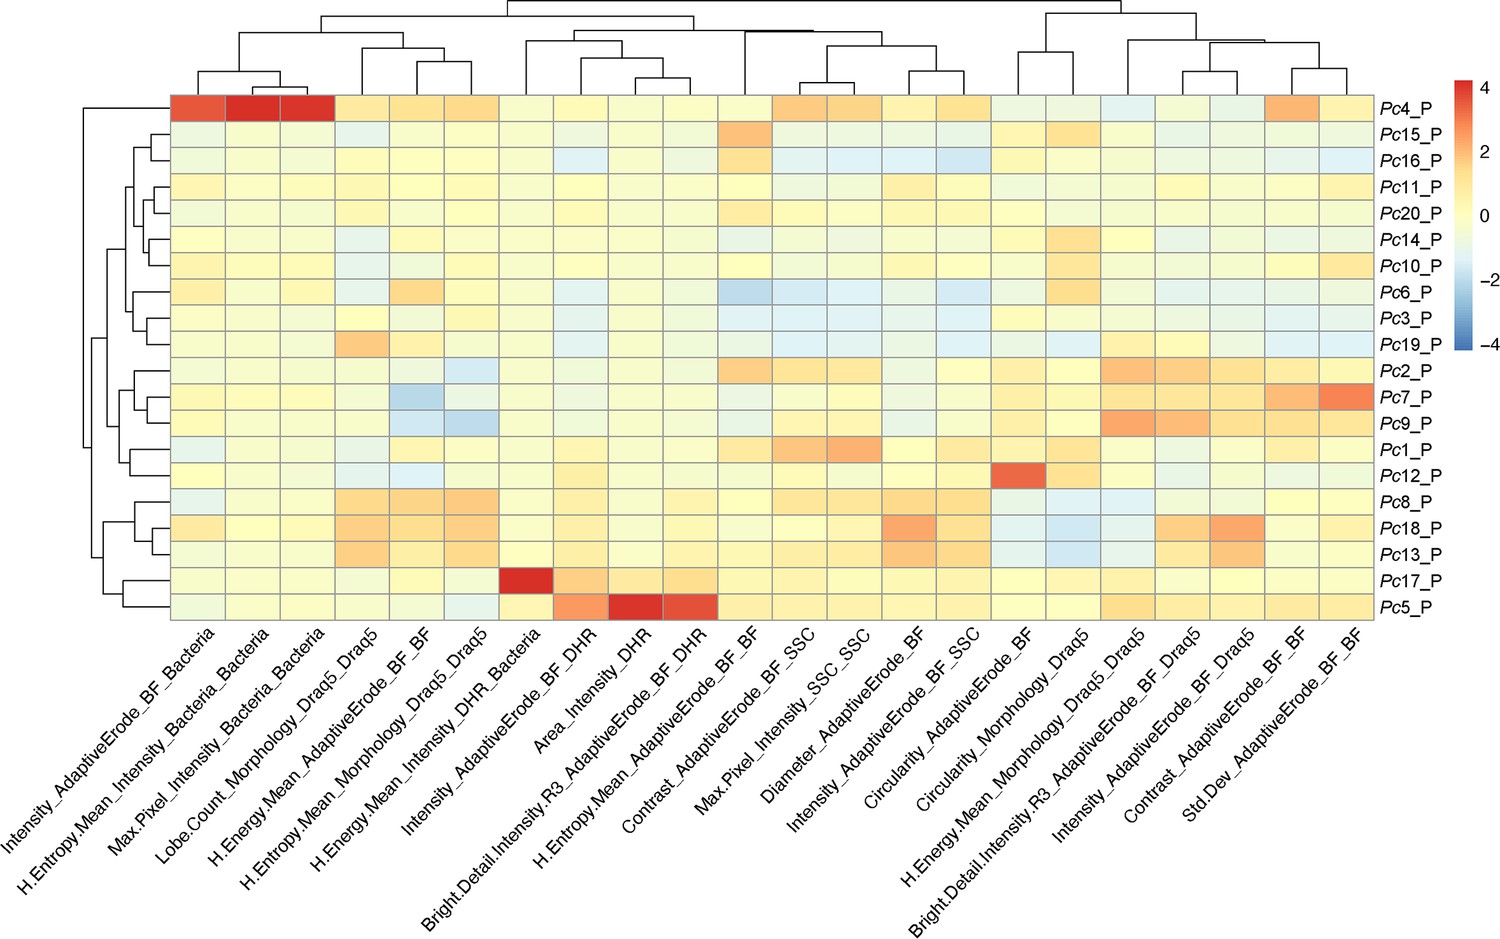
Feature heatmap after phagocytosis assay on P. canaliculata hemocytes.
Spearman’s correlation plot shows the average feature values of the images in each cluster to highlight morphological similarities and differences between events belonging to different clusters, such as cell size or cytoplasm granularity (Supplementary file 2). The clusters with higher dihydrorhodamine-123 (DHR) signal and high bacteria are the one identified as containing professional phagocytes (Pc5_P and Pc17_P). This is also confirmed by the statistical analysis performed between the phagocytosis samples (CellTrace Violet labeled Staphylococcus aureus [CTV-S. aureus]) and inhibited phagocytosis samples (CTV-S. aureus + EDTA) (Figure 5B; Supplementary file 9).
Figure 5—figure supplement 4
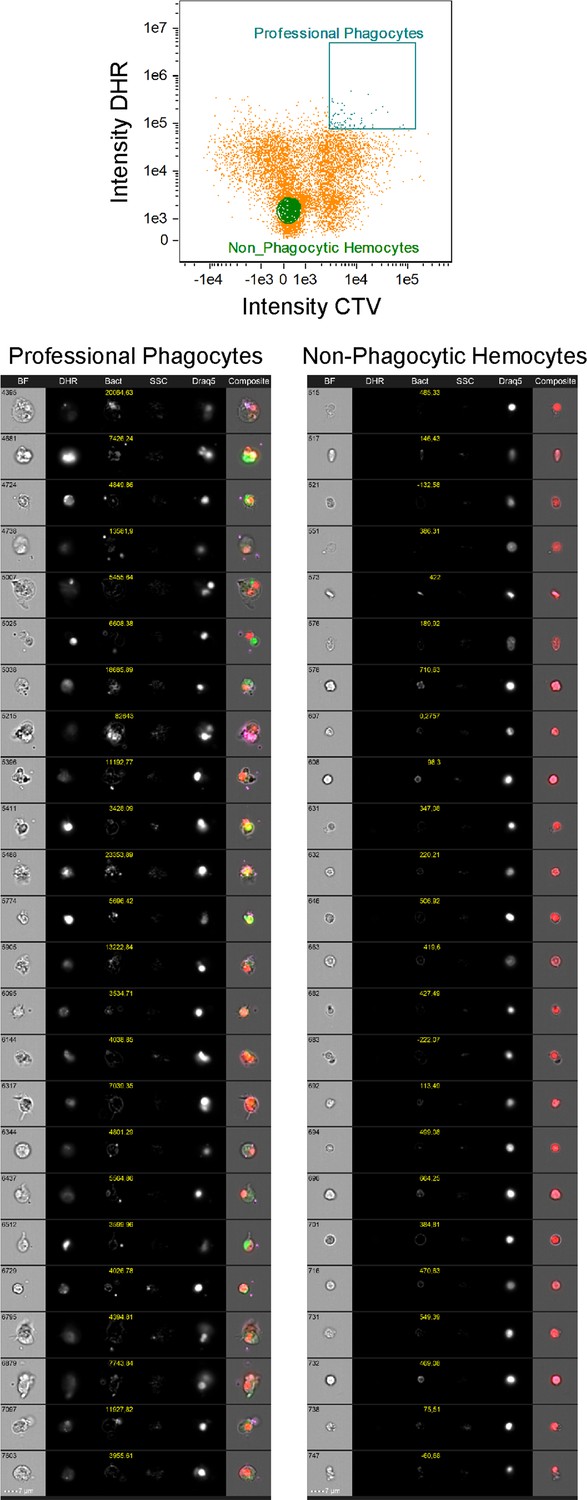
Gallery of P. canaliculata hemocytes after phagocytosis assay.
Representative cell images side-by-side of professional phagocytes and non-phagocytic hemocytes from apple snail samples after phagocytosis assay. The signal of the bacteria labeled with CellTrace Violet is showed in yellow, and the value for the signal intensity has been reported on the top of each individual image. These images were obtained using the gallery function of the Amnis IDEAS software and manually gating either events double positive for dihydrorhodamine-123 (DHR) and bacteria or events double negative.
Figure 6
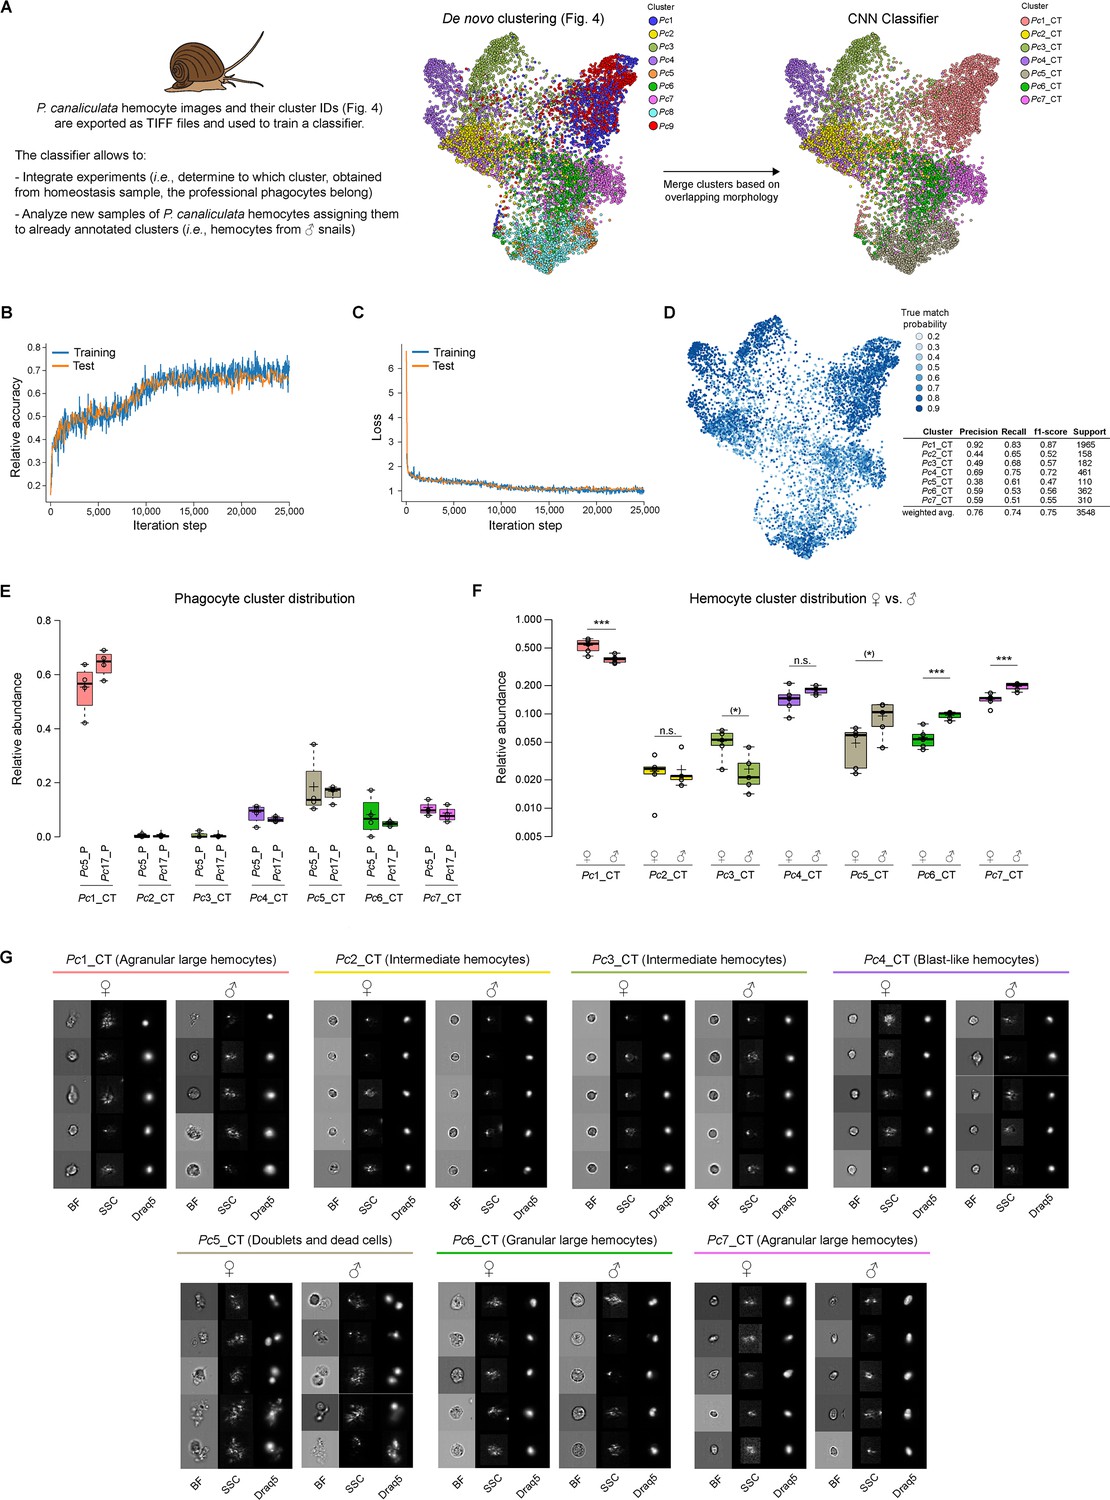
Classifier training and use of convolutional neural network (CNN) for integrating multiple experiments.
(A) The CNN portion of Image3C allows the integration of multiple experiments and the analysis of additional samples assigning new events to already defined and annotated clusters without manual and potentially biased matching of clusters by the user. Images of cells obtained from homeostasis, naïve, or WT samples and already de novo clustered in an unbiased way by Image3C are exported as TIFF files together with their cluster IDs. P. canaliculata hemocytes in homeostasis condition obtained from female apple snails (35,000 images) is the dataset used for training the CNN classifier. Before the training, clusters with cells with strongly overlapping morphology were merged (Pc1 was merged with Pc9 and named Pc1_CT; Pc5 was merged with Pc8 and named Pc5_CT). CT: classifier training. (B) The training was performed on 80% of the exported images, and the testing during the training was performed on 10% of the exported images. Relative accuracy was recorded every 100 iterations for 25,000 iterations total. (C) Loss calculation was recorded every 100 iterations for 25,000 iterations total and indicates that the training set is not memorized. (D) The True match probability (probability that trained classifier-assigned cluster matches original cluster ID) is given for each cell of the remaining 10% of the original exported images. The detailed precision score for each cluster together with the weighted average (correcting for support) is reported in the table. (E) The CNN classifier allows for integrating experiments, such as phagocytosis assay and morphological assay, with minimal probability of introducing errors because of lack of biomarkers. The plot shows the distribution of the cells belonging to the snail professional phagocytes clusters (Pc5_P and Pc17_P from Figure 5, phagocytosis assay) among the clusters defined by morphological features using homeostasis conditions. (F) The CNN classifier allows also for the analysis of new samples obtained from the same species and the same tissue used for the training. The new events obtained running male P. canaliculata hemocytes are assigned to clusters defined by the de novo clustering step, allowing for comparison between samples (females vs. males) and statistical analysis for cluster relative abundance differences. The box plot shows the comparison of the hemocyte population composition between females and males (n = 5). *** are clusters with abundances robustly significantly different between female and male animals. * are clusters with p-value lower than 0.05, but whose abundances are no more significantly different after the correction for multiple testing (false discovery rate [FDR]). (G) Representative cell images for each cluster belonging to female and male hemocytes dataset allow to visually compare the cells used to train the classifier (female) with cells assigned by the classifier and coming from a new set of samples (males). Brightfield (BF), side scatter signal (SSC), and Draq5 (nuclear staining) signal are shown in individual channels.
Tables
Table 1
Extensive overview on label-free cell clustering tools including a comparison of their main features.
| Tool name | Was tested on multiple cell types? | Requires a priori knowledge of the sample and/or species-specific reagents for the clustering? | Uses commercially available hardware? | Uses free or open source softwares? |
|---|---|---|---|---|
| Image3C (present work) | YES (Zebrafish whole kidney marrow; Apple snail hemolymph) | NO Does not require previous knowledge or species-specific reagents to cluster cell images and train the neural network. If available, they can be used/integrated. | YES (ImageStream) | YES (IDEAS; Vortex; R; Python) NO (FCS Express Plus) |
| CellProfiler * | YES (Fixed Jurkat cells; Live Jurkat cells; Fission yeast; Human white blood cells) | YES Requires annotated datasets to train the machine learning algorithms, either by staining the samples with known markers, or by manually clustering the cells. | YES (ImageStream; Microscope) | YES (IDEAS; CellProfiler) NO (MATLAB) |
| CellProfiler Analyst † | NO (Jurkat cells) | YES Requires the use of fluorescent markers to annotate the cells and use them as the ground truth to train the machine learning algorithms. | YES (ImageStream) | YES (IDEAS; CellProfiler/ Phyton) |
| Label-free reflectance microscopy ‡ | NO (Fixed HeLa cells) | YES Requires immunofluorescence images with known markers to use as ground truth and for training multiple deep learning models. | NO (Custom-built multimodal light-emitting diode (LED) array reflectance microscope) | YES (Deep neural networks) |
| Optofluidic time-stretch microscopy § | NO (Human breast adenocarcinoma cell line, MCF-7) | YES Does not provide cell clustering and single-cell resolution analysis. The changes are analyzed overall in the sample without assigning it to a cell type. | NO (Optofluidic time-stretch microscope and microfluidic devices) | NO (MATLAB) |
| Raman scattering ¶ | YES (Microalgal cells; Circulating tumor cells in human blood) | YES Requires homogenous cell cultures. After different treatments, these samples are used to create databases for training deep learning models. | NO (High-speed multicolor stimulated Raman scattering (SRS) microscope and microfluidic platform) | YES (Deep learning, neural network structure, VGG-16) |
| Fluorescence lifetime imaging ** | NO (Human white blood cells) | YES Depends on other techniques to identify cell types to compare their autofluorescence signals and fluorescence decay for further analysis. | YES (Fluorescence microscopy; FLIM; Flowcytometer) | YES (Python) |
Key resources table
| Reagent type (species) or resource | Designation | Source or reference | Identifiers | Additional information |
|---|---|---|---|---|
| Strain, strain background (Staphylococcus aureus) | Wood strain without protein A | Thermo Fisher Scientific | S2859 | |
| Biological sample (Danio rerio) | Whole kidney marrow | Stowers Institute for Medical Research | Wild type, adult females | Freshly isolated from Danio rerio |
| Biological sample (Pomacea canaliculata) | Hemolymph | Stowers Institute for MedicalResearch | Wild type,adult females and males | Freshly isolated fromPomacea canaliculata |
| Chemical compound, drug | Dihydrorhodamine-123 (DHR) | Thermo Fisher Scientific | D23806 | 5 µM |
| Software, algorithm | IDEAS | Amnis Millipore Sigma | Version 6.2 | |
| Software, algorithm | R code | This paper | https://github.com/stowersinstitute/LIBPB-1390-Image3C (Box, 2021) | |
| Software, algorithm | VorteX clustering environment | https://github.com/nolanlab/vortex/releases | ||
| Software, algorithm | FSC Express | De Novo Software | Image or Plus configurations - Version 7 | |
| Software, algorithm | Python script | This paper | https://github.com/stowersinstitute/LIBPB-1390-Image3C | |
| Other | Draq5 | Thermo Fisher Scientific | 62251 | 5 µM |
| Other | CellTrace Violet (CTV) | Thermo Fisher Scientific | C34571 | 5 µM |
Additional files
-
Supplementary file 1
Features used for the morphology assay.
Names and descriptions of the features quantified by IDEAS software and used for clustering events based on cell morphology in the homeostasis cell composition experiment. BF: brightfield; CI: cell intrinsic; CF: cell function.
- https://cdn.elifesciences.org/articles/65372/elife-65372-supp1-v2.docx
-
Supplementary file 2
Features used for the phagocytosis assay.
Names and descriptions of the features quantified by IDEAS software and used for clustering events based on cell morphology and function in the phagocytosis experiment. BF: brightfield; CI: cell intrinsic; CF: cell function.
- https://cdn.elifesciences.org/articles/65372/elife-65372-supp2-v2.docx
-
Supplementary file 3
Cell cluster properties.
Cell cluster properties (e.g., cell numbers per cluster, cell features used for clustering, feature values for each cluster) for zebrafish whole kidney marrow (WKM) morphology and phagocytosis assay and for P. canaliculata hemocyte morphology and phagocytosis assay.
- https://cdn.elifesciences.org/articles/65372/elife-65372-supp3-v2.xlsx
-
Supplementary file 4
Cell gallery for zebrafish whole kidney marrow (WKM) in homeostasis condition.
Representative cell images belonging to each individual cluster identified by Image3C for zebrafish WKM in homeostasis condition are shown. BF: brightfield; SSC: side scatter signal; Draq5: nuclear staining. Merge represents the overlay of BF, SSC, and Draq5.
- https://cdn.elifesciences.org/articles/65372/elife-65372-supp4-v2.pdf
-
Supplementary file 5
Phagocytosis vs. phagocytosis inhibited with CCB on zebrafish whole kidney marrow (WKM).
Results of negative binomial regression analysis comparing cluster relative abundance between phagocytosis samples (CTV-S. aureus) and phagocytosis inhibited with CCB samples (CTV-S. aureus + CCB) in the zebrafish phagocytosis experiment. FC: fold change; CPM: count per million; LR: likelihood ratio; FDR: false discovery rate. Relative graph is reported in Figure 3B.
- https://cdn.elifesciences.org/articles/65372/elife-65372-supp5-v2.docx
-
Supplementary file 6
Phagocytosis vs. phagocytosis inhibited with ice on zebrafish whole kidney marrow (WKM).
Results of negative binomial regression analysis comparing cluster relative abundance between phagocytosis samples (CTV-S. aureus) and phagocytosis inhibited with ice samples (CTV-S. aureus + Ice) in the zebrafish phagocytosis experiment. FC: fold change; CPM: count per million; LR: likelihood ratio; FDR: false discovery rate. Relative graph is reported in Figure 3—figure supplement 2.
- https://cdn.elifesciences.org/articles/65372/elife-65372-supp6-v2.docx
-
Supplementary file 7
Cell gallery for zebrafish whole kidney marrow (WKM) after phagocytosis assay.
Representative cell images belonging to each individual cluster identified by Image3C for zebrafish WKM after phagocytosis assay are shown. BF: brightfield; DHR: fluorescent reactive oxygen species indicator; SSC: side scatter signal; Bac: CTV signal (S. aureus labeling); Draq5: nuclear staining. Merge represents the overlay of DHR, Bac, and Draq5.
- https://cdn.elifesciences.org/articles/65372/elife-65372-supp7-v2.pdf
-
Supplementary file 8
Cell gallery for P. canaliculata hemocytes in homeostasis condition.
Representative cell images belonging to each individual cluster identified by Image3C for snail hemocytes in homeostasis condition are shown. Ch01 is brightfield, Ch06 is side scatter signal, and Ch11 is Draq5 (nuclear staining). Merge represents the overlay of Ch01, Ch06, and Ch11.
- https://cdn.elifesciences.org/articles/65372/elife-65372-supp8-v2.pdf
-
Supplementary file 9
Phagocytosis vs. phagocytosis inhibited with EDTA on P. canaliculata hemocytes.
Results of negative binomial regression analysis comparing cluster relative abundance between phagocytosis samples (CTV-S. aureus) and phagocytosis inhibited with EDTA samples (CTV-S. aureus + EDTA) in the apple snail P. canaliculata phagocytosis experiment. FC: fold change; CPM: count per million; LR: likelihood ratio; FDR: false discovery rate. Relative graph is reported in Figure 5B.
- https://cdn.elifesciences.org/articles/65372/elife-65372-supp9-v2.docx
-
Supplementary file 10
Phagocytosis vs. phagocytosis inhibited with ice on P. canaliculata hemocytes.
Results of negative binomial regression analysis comparing cluster relative abundance between phagocytosis samples (CTV-S. aureus) and phagocytosis inhibited with ice samples (CTV-S. aureus + Ice) in the apple snail P. canaliculata phagocytosis experiment. FC: fold change; CPM: count per million; LR: likelihood ratio; FDR: false discovery rate. Relative graph is reported in Figure 5—figure supplement 2.
- https://cdn.elifesciences.org/articles/65372/elife-65372-supp10-v2.docx
-
Supplementary file 11
Cell gallery for P. canaliculata hemocytes after phagocytosis assay.
Representative cell images belonging to each individual cluster identified by Image3C for snail hemocytes after phagocytosis assay are shown. Ch01 is brightfield, Ch02 is DHR signal (reactive oxygen species indicator), Ch06 is side scatter signal, Ch07 is CTV signal (S. aureus labeling), and Ch11 is Draq5 (nuclear staining). Merge represents the overlay of Ch02, Ch06, Ch07, and Ch11.
- https://cdn.elifesciences.org/articles/65372/elife-65372-supp11-v2.pdf
-
Transparent reporting form
- https://cdn.elifesciences.org/articles/65372/elife-65372-transrepform-v2.docx
Download links
A two-part list of links to download the article, or parts of the article, in various formats.
Downloads (link to download the article as PDF)
Open citations (links to open the citations from this article in various online reference manager services)
Cite this article (links to download the citations from this article in formats compatible with various reference manager tools)
Image3C, a multimodal image-based and label-independent integrative method for single-cell analysis
eLife 10:e65372.
https://doi.org/10.7554/eLife.65372


