Neural effects of continuous theta-burst stimulation in macaque parietal neurons
- Laboratorium voor Neuro- en Psychofysiologie, The Leuven Brain Institute, Belgium
- Faculty of Life Sciences and Medicine, King's College London, United Kingdom
Figures
Figure 1
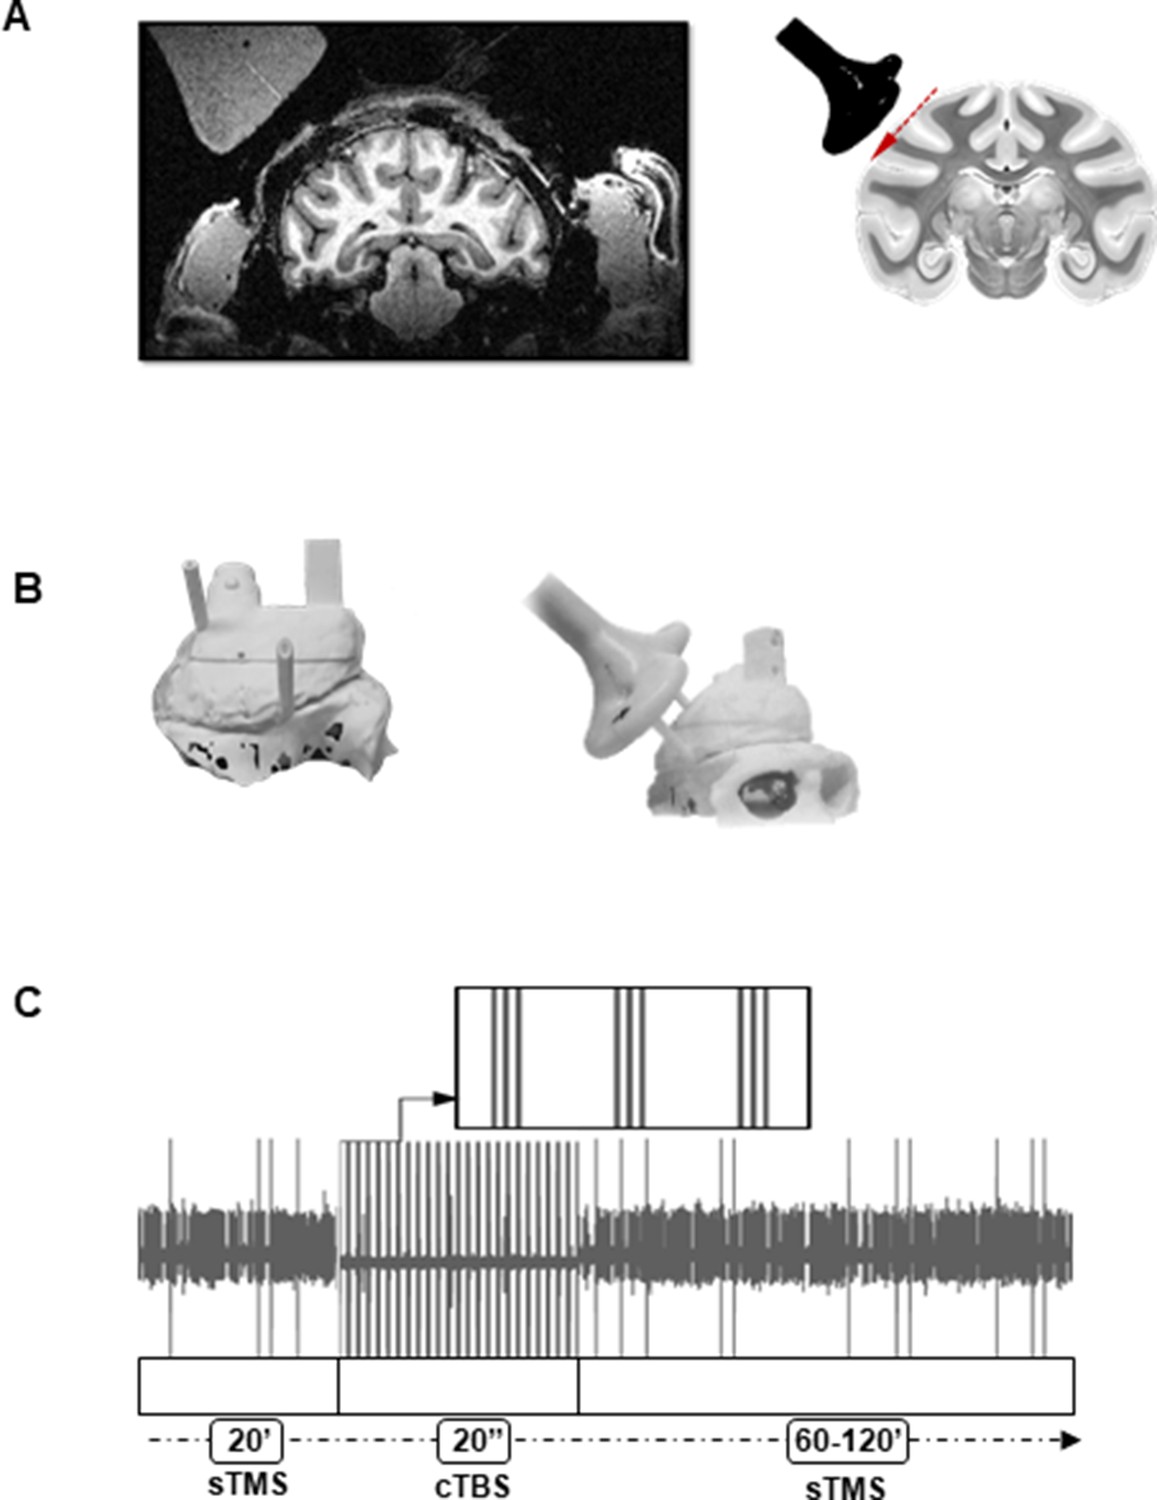
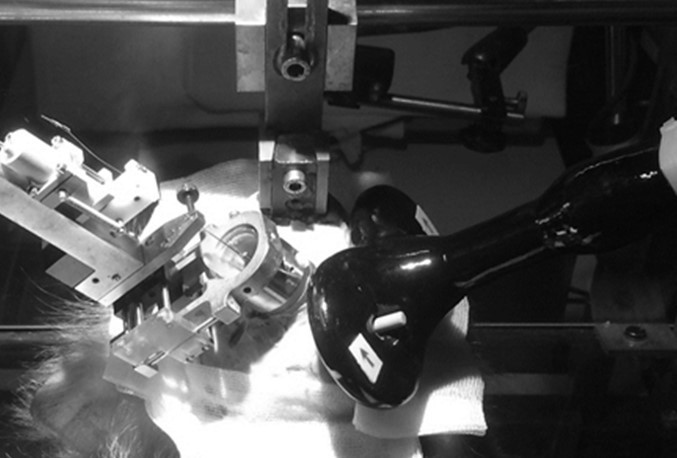
Brain targeting and stimulation protocol.
(A) Left: Anatomical magnetic resonance image performed with a dummy coil, reproducing the position and angle of the Magstim coil during recordings (45°ee angle with respect to the vertical). Right: Coronal view of the monkey brain indicating the location of the TMS coil with respect to parietal area PFG. The red, dashed line indicates the trajectory of the electrode during recordings. For every experiment, a D25 mm figure-of-eight TMS coil (in black) was rigidly anchored to the monkey’s implant. (B) Three-dimensional models of the monkey’s skull and implant (left: top view, right: lateral view). Prior to the experiment, two guiding rods were attached to the monkey’s head implant based on MRI estimations of the cortical target coordinates. This allowed a precise and reproducible coil positioning across experimental sessions. (C) Example of the raw signal recorded during a typical stimulation session. The high voltage, saturated peaks indicate the stimulation time stamps. TMS was administered in three different epochs corresponding, in this order, to: single-pulse TMS (sTMS) applied at light onset (20 min), cTBS (20 s), and again, sTMS (60–120 min). cTBS, continuous theta-burst stimulation; MRI, magnetic resonance imaging; TMS, transcranial magnetic stimulation.
Figure 2

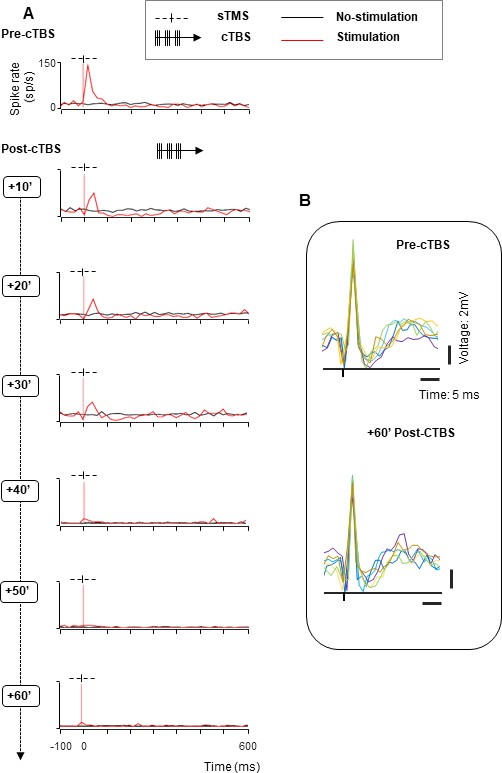
Effect of cTBS on neuronal excitability: example neurons with recovery.
We tested the excitability of each neuron using single-pulse TMS (sTMS) administered before and after cTBS. Stimulation (red line plots) and no-stimulation trials (black line plots) were randomly interleaved during the passive fixation task. The red, dotted line indicates the sTMS onset (aligned to light onset). (A). Spike rate of an example neuron exhibiting a short-lasting, excitatory response to sTMS (top row). cTBS caused a marked and immediate reduction in excitability (row 2), which disappeared over the course of 1 hr (rows 3–7). (B). Second example neuron. As in (A), this neuron responded to sTMS before cTBS. However, there was no effect of cTBS until 20 min post-stimulation (row 3). During the recovery phase, the neuron showed a period of hyperexcitability (40–50 min post-cTBS; rows 5 and 6). cTBS, continuous theta-burst stimulation; sTMS, single-pulse transcranial magnetic stimulation.
Figure 3
Effect of cTBS on neuronal excitability: example neuron without recovery.
(A) Spike rate of an example neuron with immediate reduced excitability after cTBS (rows 2–4). A stronger reduction, accompanied by a significant decrease of the baseline activity appeared later (40 min post-cTBS; row 4), continuing until the end of the session (60 min post-cTBS; row 7). Same conventions as in Figure 2. (B) Waveforms of the example neuron. Voltage graph showing the overlapped spike waveforms extracted from six consecutive trials (represented in different colors), recorded at two different time intervals (upper panel: pre-cTBS; lower panel: 60 min post-cTBS). cTBS, continuous theta-burst stimulation.
Figure 4 with 1 supplement

Population response to cTBS.
Average sTMS responses for all neurons at different time periods post-cTBS (green) compared to pre-cTBS (black), when sTMS was applied at light onset during passive fixation. Shading displays ±the standard error across neurons (N=86). The red, dashed line indicates the sTMS pulse, aligned to light onset. The asterisks specify the statistical significance (two-sided Wilcoxon rank sum test; *p≤0.05; **p≤0.01) for changes in both the baseline activity (red) and the sTMS-evoked response (black). cTBS, continuous theta-burst stimulation; sTMS, single-pulse transcranial magnetic stimulation.
Figure 4—figure supplement 1
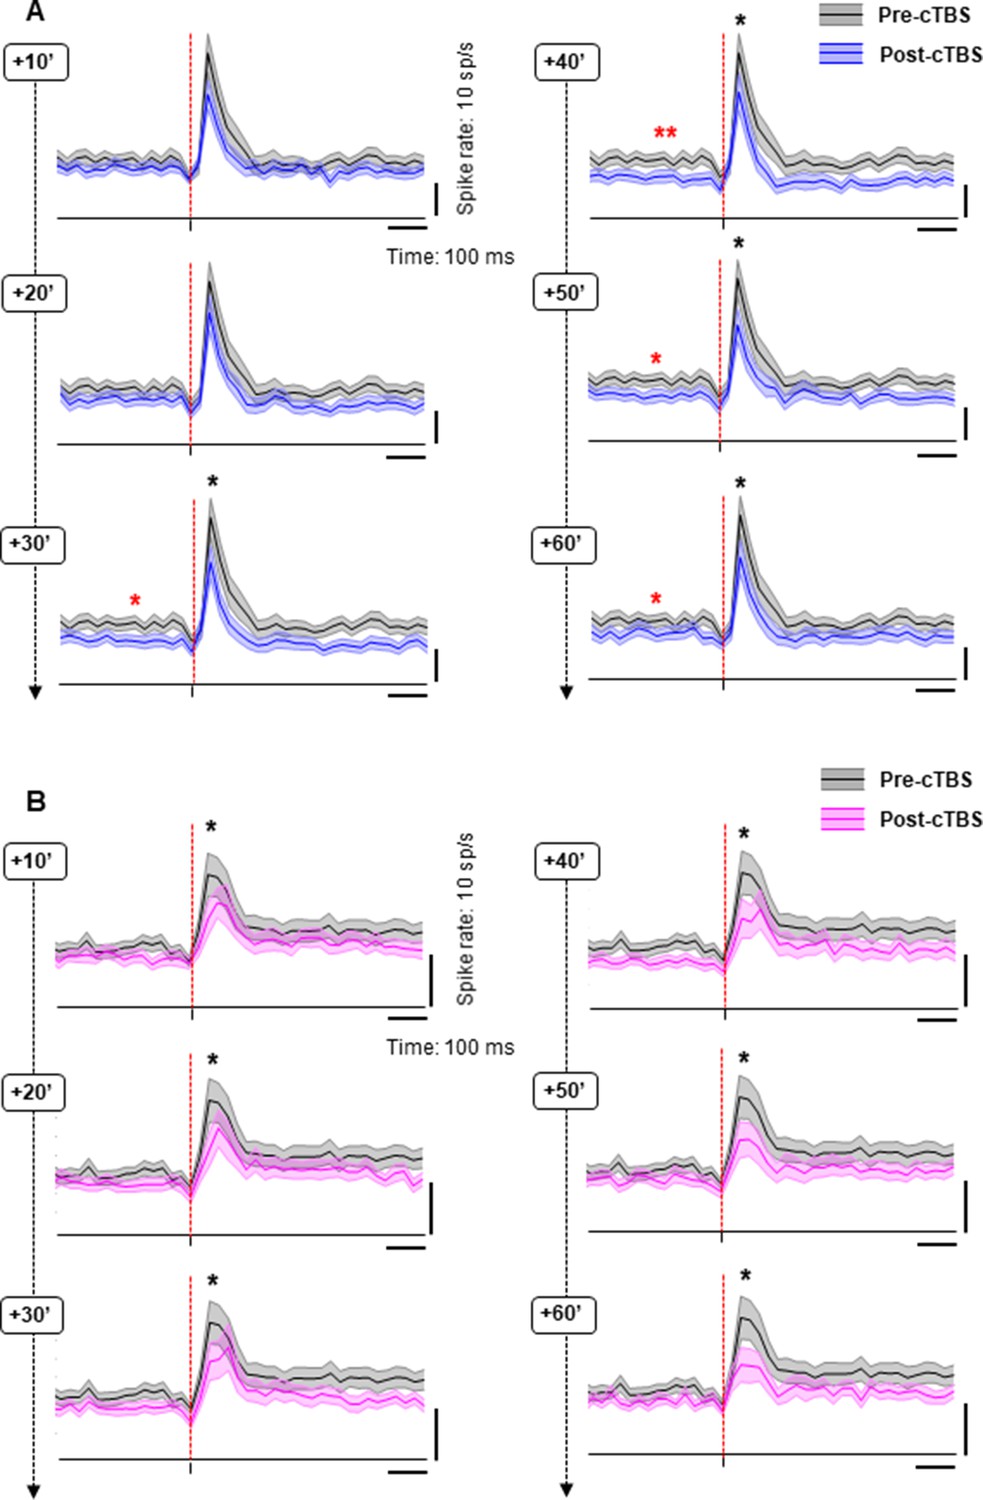
Population response to cTBS for monkeys Y and A, separately.
(A) Average spike rate of the sTMS response averaged across all neurons recorded in monkey Y at different time periods post-cTBS (blue) compared to pre-cTBS (black), when sTMS was applied at light onset during passive fixation. Shading displays ±the standard error (N=51). The red, dashed line indicates the sTMS pulse, aligned to light onset. The asterisks specify the statistical strength (two-sided Wilcoxon rank sum test; *p≤0.05; **p≤0.01) for changes in both the baseline activity (red) and the sTMS-evoked response (black). (B) Equivalent graph for monkey A (N=35), plotting the average spike rate of the sTMS response recorded at different time periods post-cTBS (magenta) compared to pre-cTBS (black). Same conventions as in (A).
Figure 5
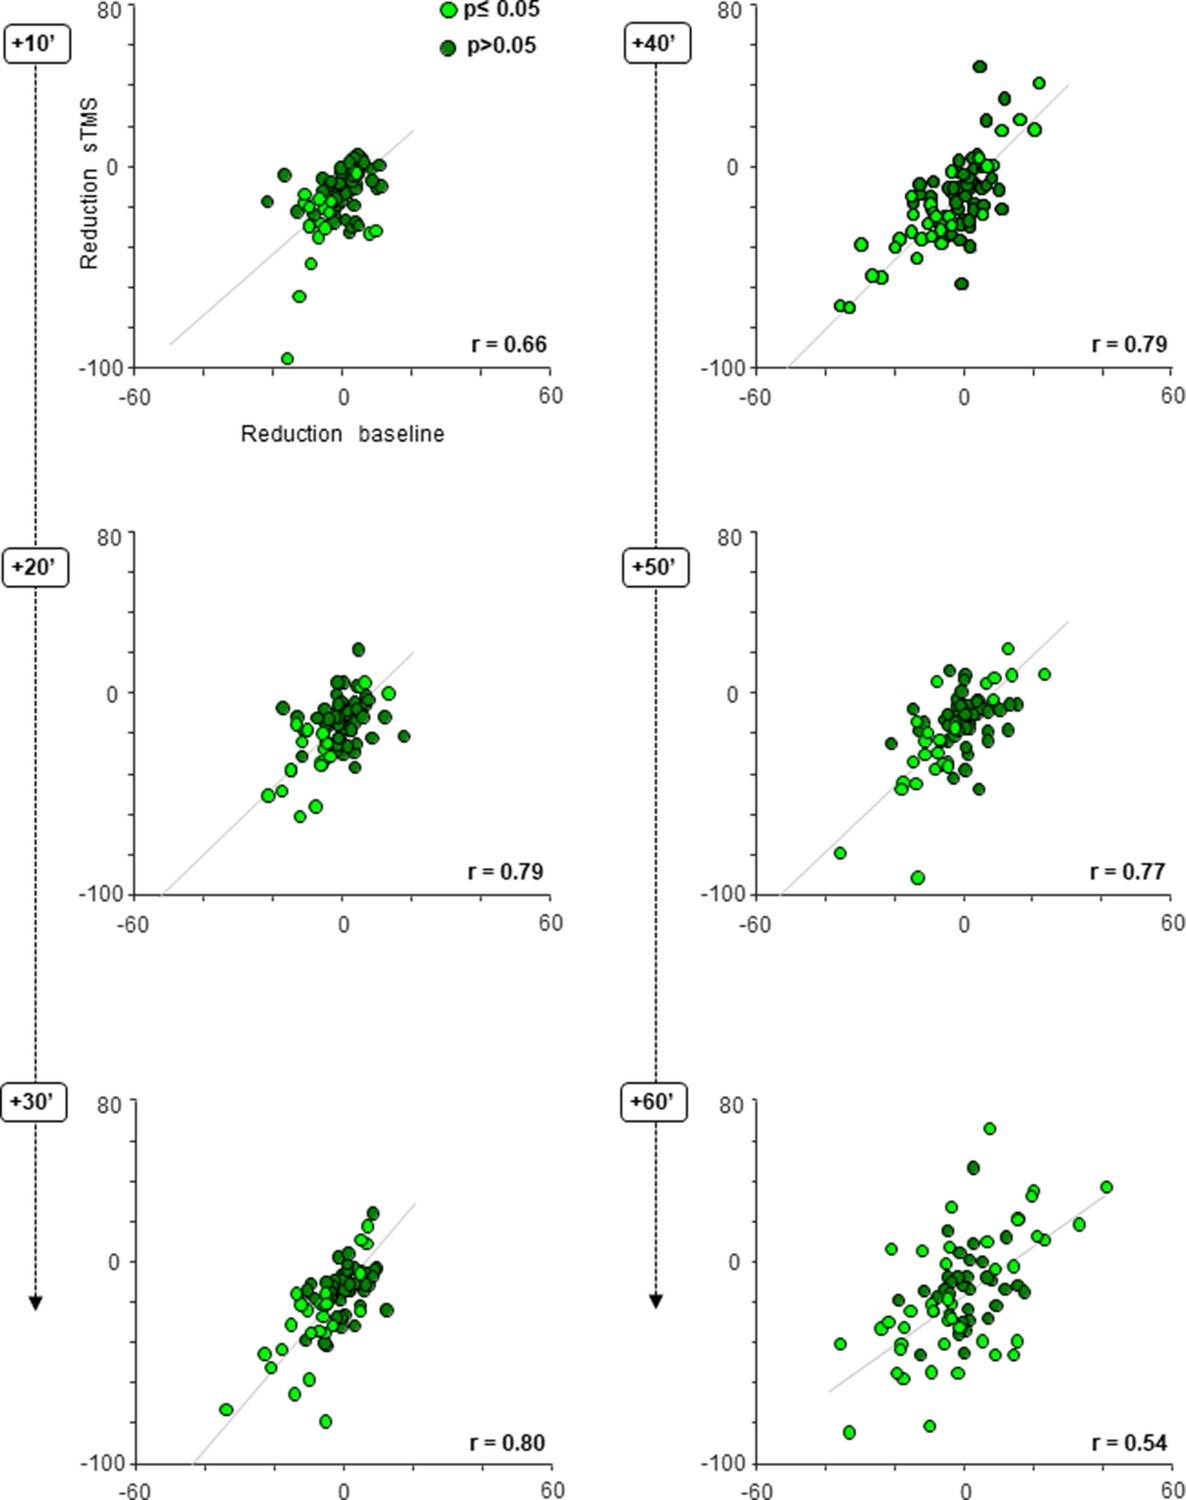
cTBS effect on neuronal excitability; scatter plots.
Average response difference between the pre- and post-cTBS period plotted against the difference in the baseline activity pre- versus post-cTBS, at six consecutive, 10 min intervals post-cTBS. Each gray line indicates the least squares line (best fit). For every panel, each colored dot represents a PFG neuron. Light green dots reflect neurons showing a statistically significant (two-sided Wilcoxon rank sum test p≤0.05) change in both their sTMS and baseline response (either hypo- or hyperexcitability) post-cTBS. Dark green dots indicate neurons without statistically significant effect (two-sided Wilcoxon rank sum test p>0.05). cTBS, continuous theta-burst stimulation; sTMS, single-pulse transcranial magnetic stimulation.
Figure 6
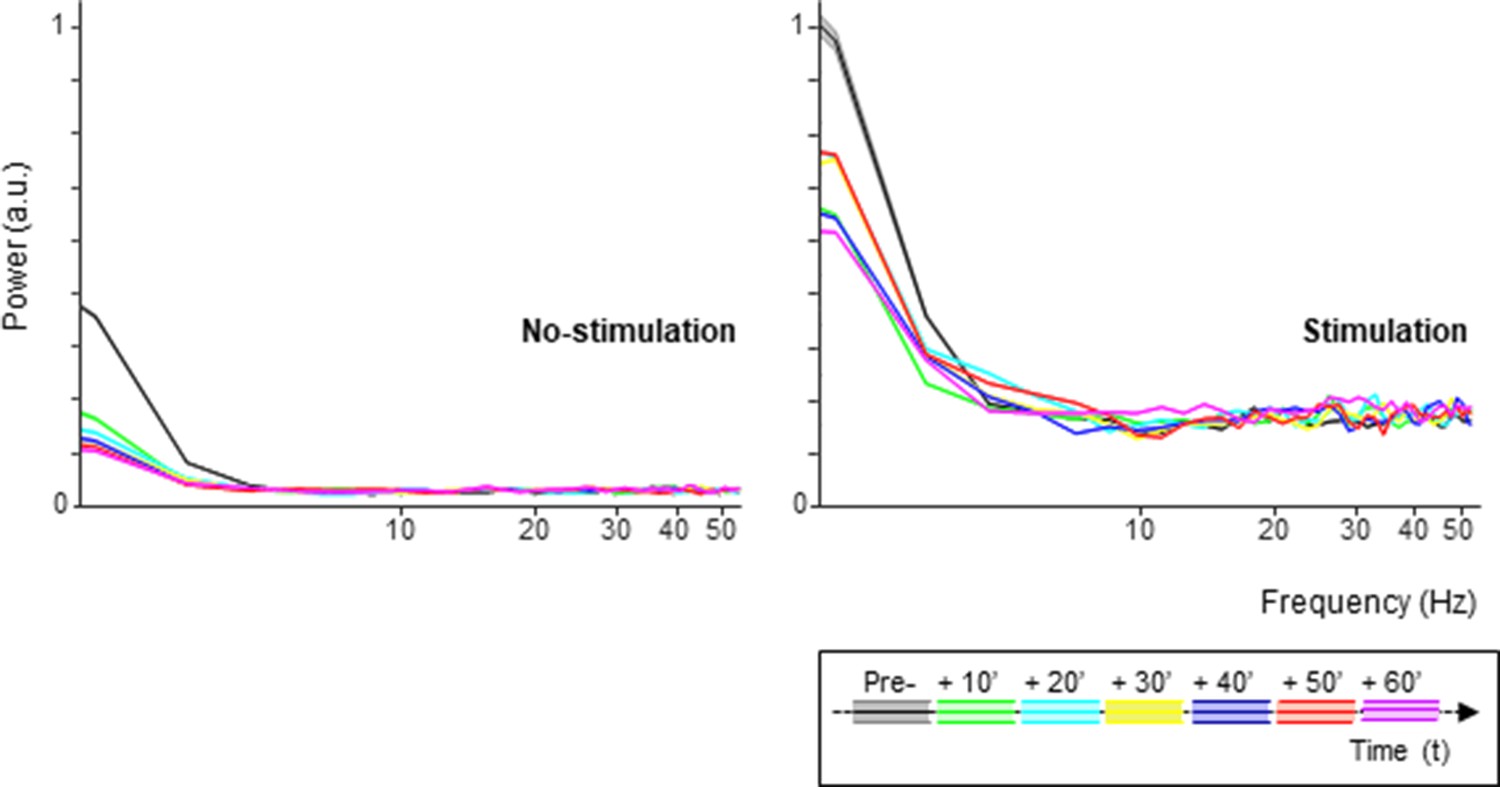
Spike oscillations analysis.
Spectral power of the single-unit activity in both the no-stimulation (left panel) and stimulation (sTMS) trials (right panel), divided in 10 min intervals pre- and post-cTBS. Each color line indicates a different time interval. The shading in the graph represents ±the standard error. cTBS, continuous theta-burst stimulation; sTMS, single-pulse transcranial magnetic stimulation.
Figure 7
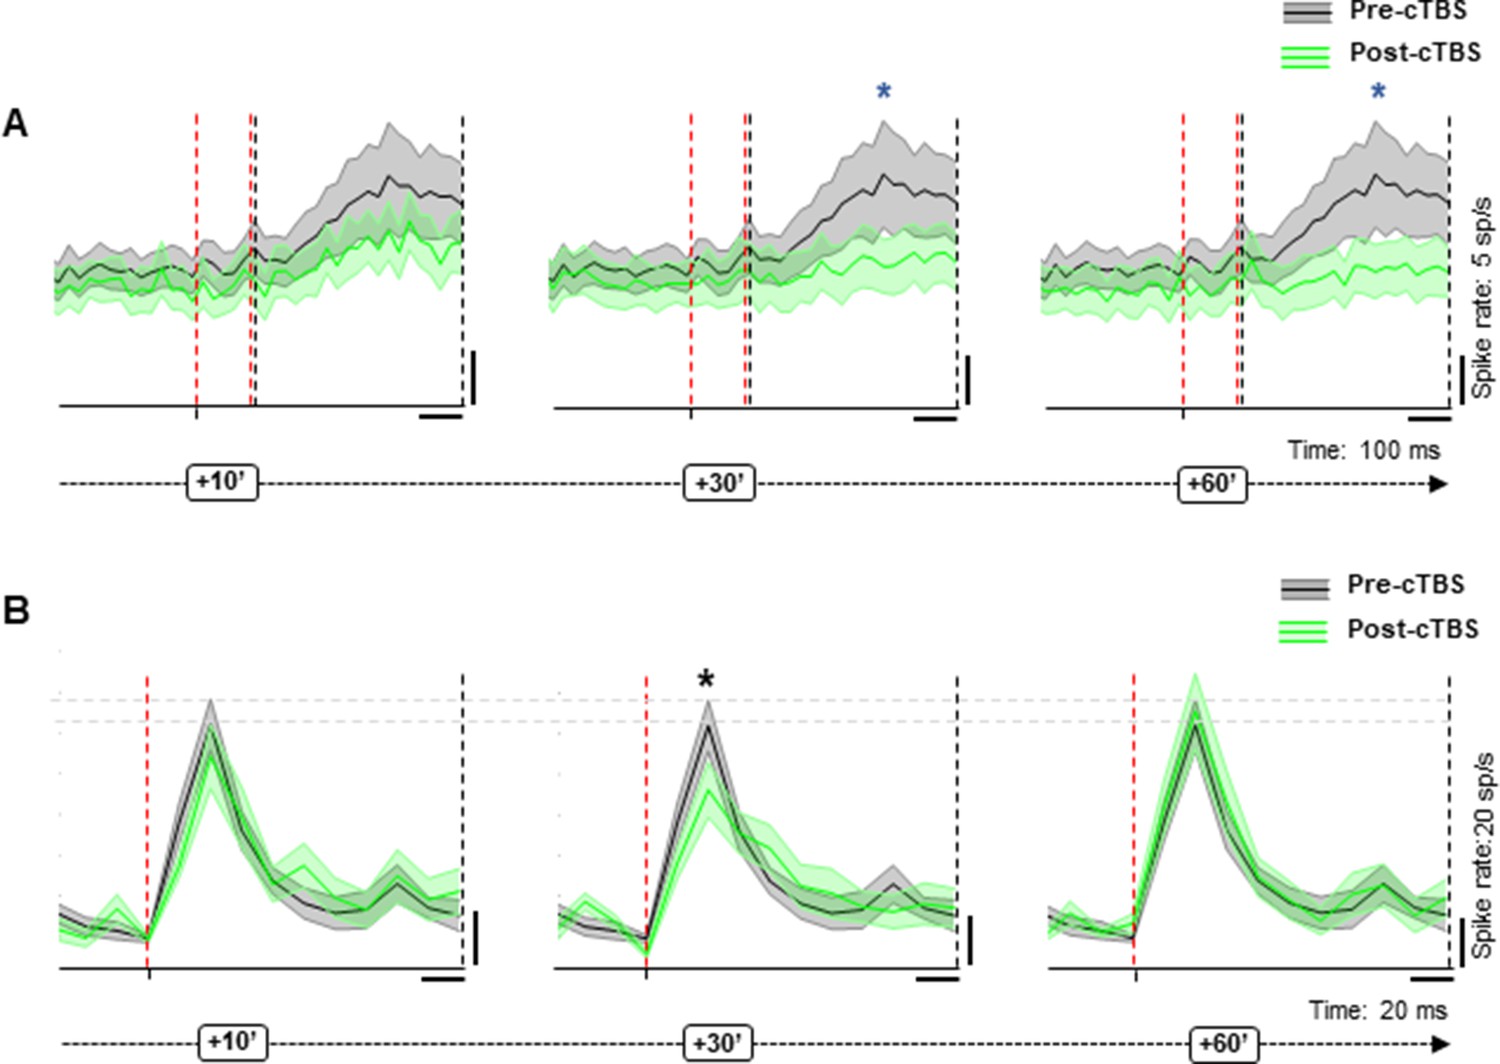
Effect of cTBS on task-related activity.
(A) Pre (black)- versus post-cTBS (green) activity in no-stimulation (sTMS) trials at two different response intervals (30 and 60 min post-cTBS). Shading displays ±the standard error across neurons (N=18). The red, dashed line indicates the onset and offset of the first interval analyzed (early interval: 20–100 ms after light onset); the black, dashed line delimits the second interval of analysis (late: 120–500 ms after light onset). The blue asterisks specify the statistical significance (two-sided Wilcoxon signed rank test; *p≤0.05). (B) Response of the same neuronal subpopulation during sTMS trials. Shading displays ±the standard error (N=18). The red, dashed line indicates the sTMS pulse, aligned to light onset. The asterisks specify the statistical significance (two-sided Wilcoxon rank sum test; *p≤0.05). cTBS, continuous theta-burst stimulation; sTMS, single-pulse transcranial magnetic stimulation.
Figure 8

Population response to cTBS up to 90 min post-cTBS.
(A) Average normalized (to the peak of the sTMS-evoked response) spike rate of all neurons recorded for up to 90 min post-cTBS (green) compared to pre-cTBS (black). Shading displays ±the standard error across neurons (N=34). Same conventions as in Figure 7. (B) Raw signal. Example voltage graph showing the pre- and post-cTBS spike waveforms from a representative neuron, monitored over time. In each panel, we plotted six consecutive spike waveforms (represented in different colors), recorded at four different time intervals (from left to right: pre-cTBS and 30, 60, and 90 min post-cTBS). cTBS, continuous theta-burst stimulation; sTMS, single-pulse transcranial magnetic stimulation.
Author response image 1
Tables
Table 1
Proportions of neurons with a cTBS effect in different time epochs.
| 10 min post-cTBS | 20 min post-cTBS | 40 min post-cTBS | 60 min post-cTBS | |
|---|---|---|---|---|
| sTMS effect | 43% (37/86) *24% (21/86) Y: 20/51; A: 17/35 *Y: 9/51; A: 12/35 | 53% (46/86) *33% (28/86) Y: 23/51; A: 23/35 *Y: 14/51; A: 14/35 | 86% (74/86) *57% (49/86) Y: 43/51; A: 31/35 *Y: 26/51; A: 23/35 | 99% (85/86) *62% (53/86) Y: 50/51; A: 35/35 *Y: 29/51; A: 24/35 |
| Baseline effect | 34% (29/86) *22% (19/86) Y: 17/51; A: 12/35 *Y: 12/51; A: 7/35 | 50% (43/86) *33% (28/86) Y: 24/51; A: 19/35 *Y: 18/51; A: 10/35 | 77% (66/86) *44% (38/86) Y: 40/51; A: 26/35 *Y: 24/51; A: 14/35 | 93% (80/86) *50% (43/86) Y: 48/51; A: 32/35 *Y: 30/51; A: 13/35 |
| Hyperexcitability in sTMS response | 10% (9/86) *3% (3/86) Y: 6/51; A: 3/35 *Y: 2/51; A: 1/35 | 10% (9/86) *7% (6/86) Y: 6/51; A: 3/35 *Y: 4/51; A: 2/35 | 19% (16/86) *15% (13/86) Y: 10/51; A: 6/35 *Y: 8/51; A: 5/35 | 28% (24/86) *23% (20/86) Y: 15/51; A: 9/35 *Y: 12/51; A: 8/35 |
| Hyperexcitability in baseline activity | *10% (9/86) 6% (5/86) Y: 5/51; A: 4/35 *Y: 3/51; A: 2/35 | *12% (10/86) 10% (9/86) Y: 5/51; A: 5/35 *Y: 5/51; A: 4/35 | *15% (13/86) 13% (11/86) Y: 8/51; A: 5/35 *Y: 7/51; A: 4/35 | *24% (21/86) 21% (18/86) Y: 13/51; A: 8/35 *Y: 11/51; A: 7/35 |
-
Results on the Wilcoxon test without Bonferroni correction calculated for 10’ intervals.
-
*
Results on the Wilcoxon test with Bonferroni correction calculated for 10’ intervals.
Table 2
Correlations between the sTMS-evoked and the baseline effect with confidence intervals in different time epochs.
| 95% CI | +10′ | +20′ | +30′ | +40′ | +50′ | +60′ |
|---|---|---|---|---|---|---|
| Lower bound | 0.51 | 0.69 | 0.70 | 0.69 | 0.67 | 0.36 |
| r | 0.66 | 0.79 | 0.80 | 0.79 | 0.77 | 0.54 |
| Upper bound | 0.76 | 0.86 | 0.86 | 0.86 | 0.85 | 0.68 |
Additional files
Download links
A two-part list of links to download the article, or parts of the article, in various formats.
Downloads (link to download the article as PDF)
Open citations (links to open the citations from this article in various online reference manager services)
Cite this article (links to download the citations from this article in formats compatible with various reference manager tools)
Neural effects of continuous theta-burst stimulation in macaque parietal neurons
eLife 11:e65536.
https://doi.org/10.7554/eLife.65536


