Septal cholinergic input to CA2 hippocampal region controls social novelty discrimination via nicotinic receptor-mediated disinhibition
- European Brain Research Institute (EBRI), Fondazione Rita Levi-Montalcini, Italy
- Department of Biology and Biotechnology ‘C. Darwin’, Center for Research in Neurobiology ‘D. Bovet’, Sapienza University of Rome, Italy
- Institute of Molecular Biology and Pathology of the National Council of Research (IBPM-CNR), Italy
- Department of Fundamental Neurosciences, University of Lausanne, Switzerland
- Department of Clinical Neurobiology of the Medical Faculty of Heidelberg University and German Cancer Research Center (DKFZ), Germany
- Institute of Neuroscience of the National Research Council (IN-CNR), Italy
Figures
Figure 1
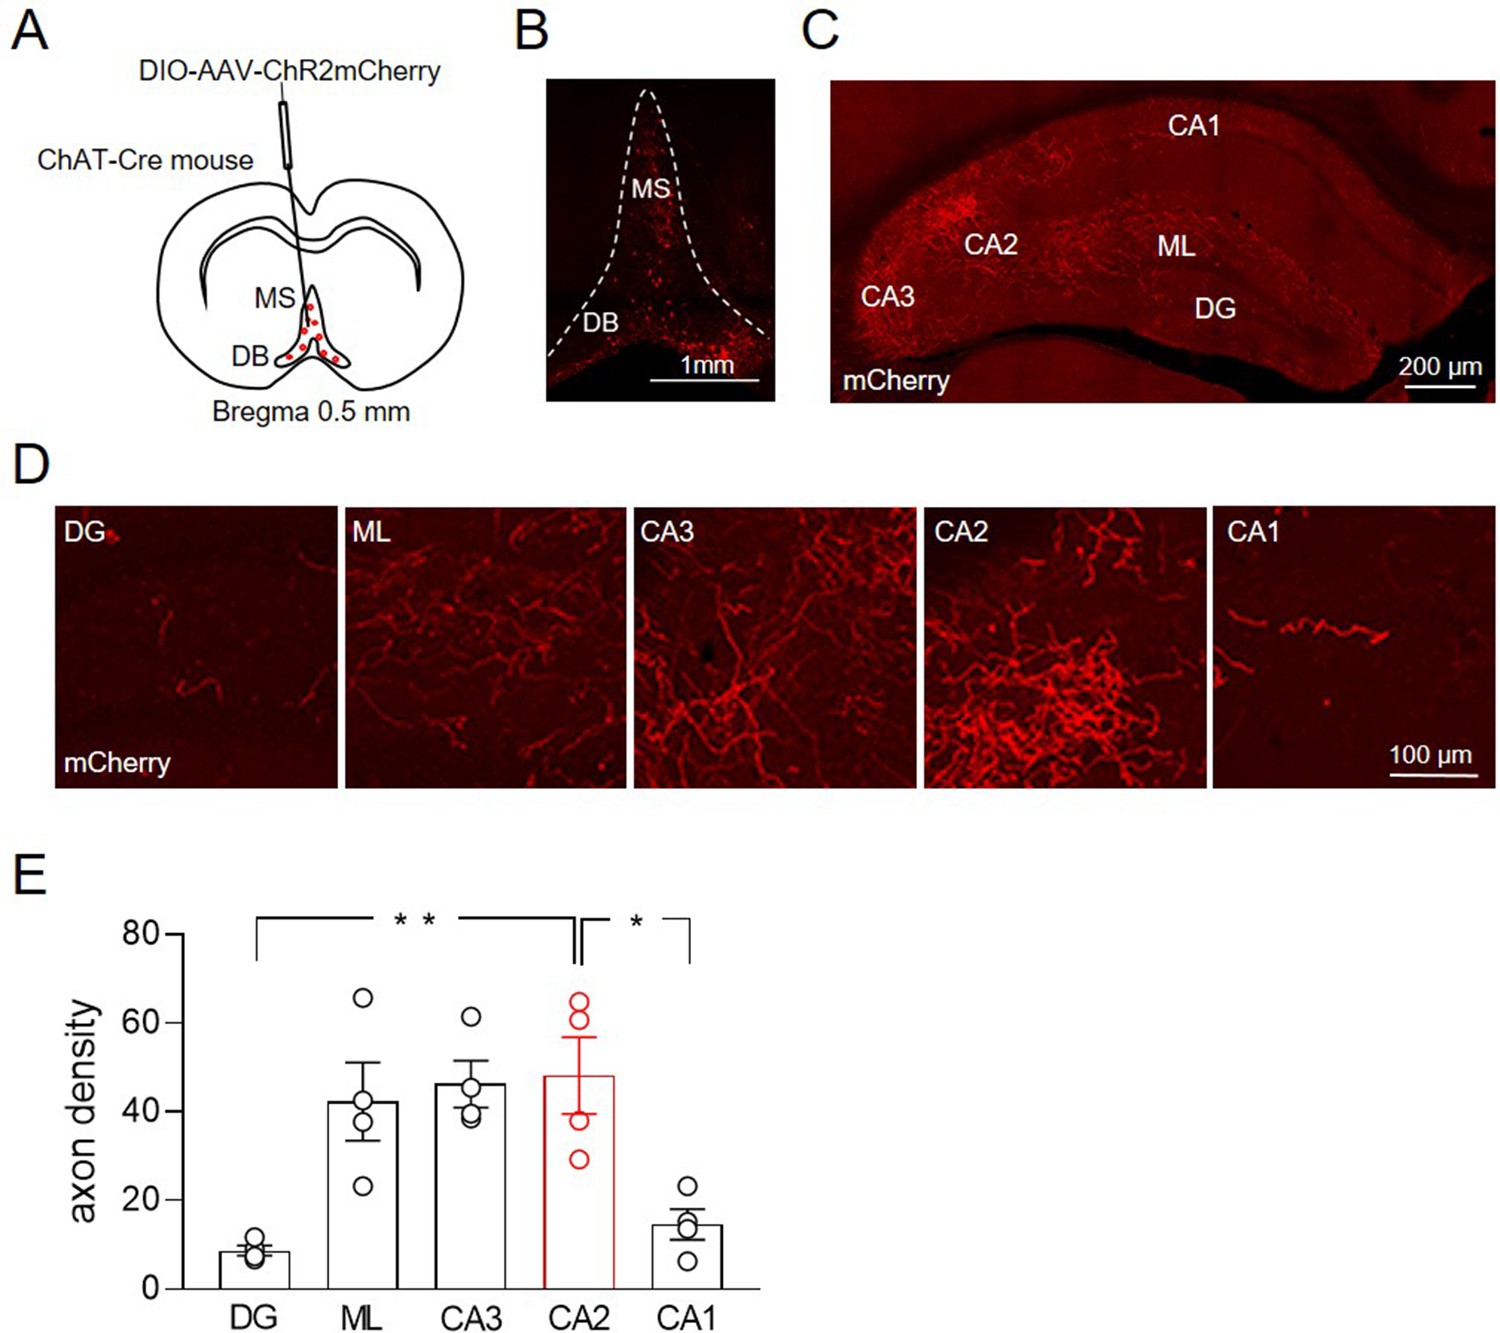
Distribution of ChAT+ neurons in the medial septum/diagonal band of Broca (MSDB) and their axon fibers in the hippocampus.
(A) Schematic drawing showing the injection site of DIO-AAV-ChR2mCherry delivered in the MSDB of ChAT-Cre mice. (B) Confocal fluorescent image showing ChR2-mCherry expression in ChAT+ neurons in the MSDB. (C) Confocal fluorescent image showing the distribution of ChAT+ axon fibers, which express ChR2-mCherry and innervate different hippocampal regions. (D) High magnification images showing ChAT+ axon fibers in the DG, molecular layer (ML), CA3, CA2, and CA1 regions. (E) Quantification of septal cholinergic axon densities in the DG, ML, CA3, CA2, and CA1 regions (n = 4 animals; four hippocampal slices/animal; DG: 8.73 ± 1.1; ML: 42.3 ± 8.8; CA3: 46.3 ± 5.3; CA2: 48.2 ± 8.6; CA1: 14.6 ± 3.5; p = 0.0006; one-way ANOVA). Open circles are values from single animals and bars are mean ± SEM. *: p < 0.05; **: p < 0.01.
Figure 2
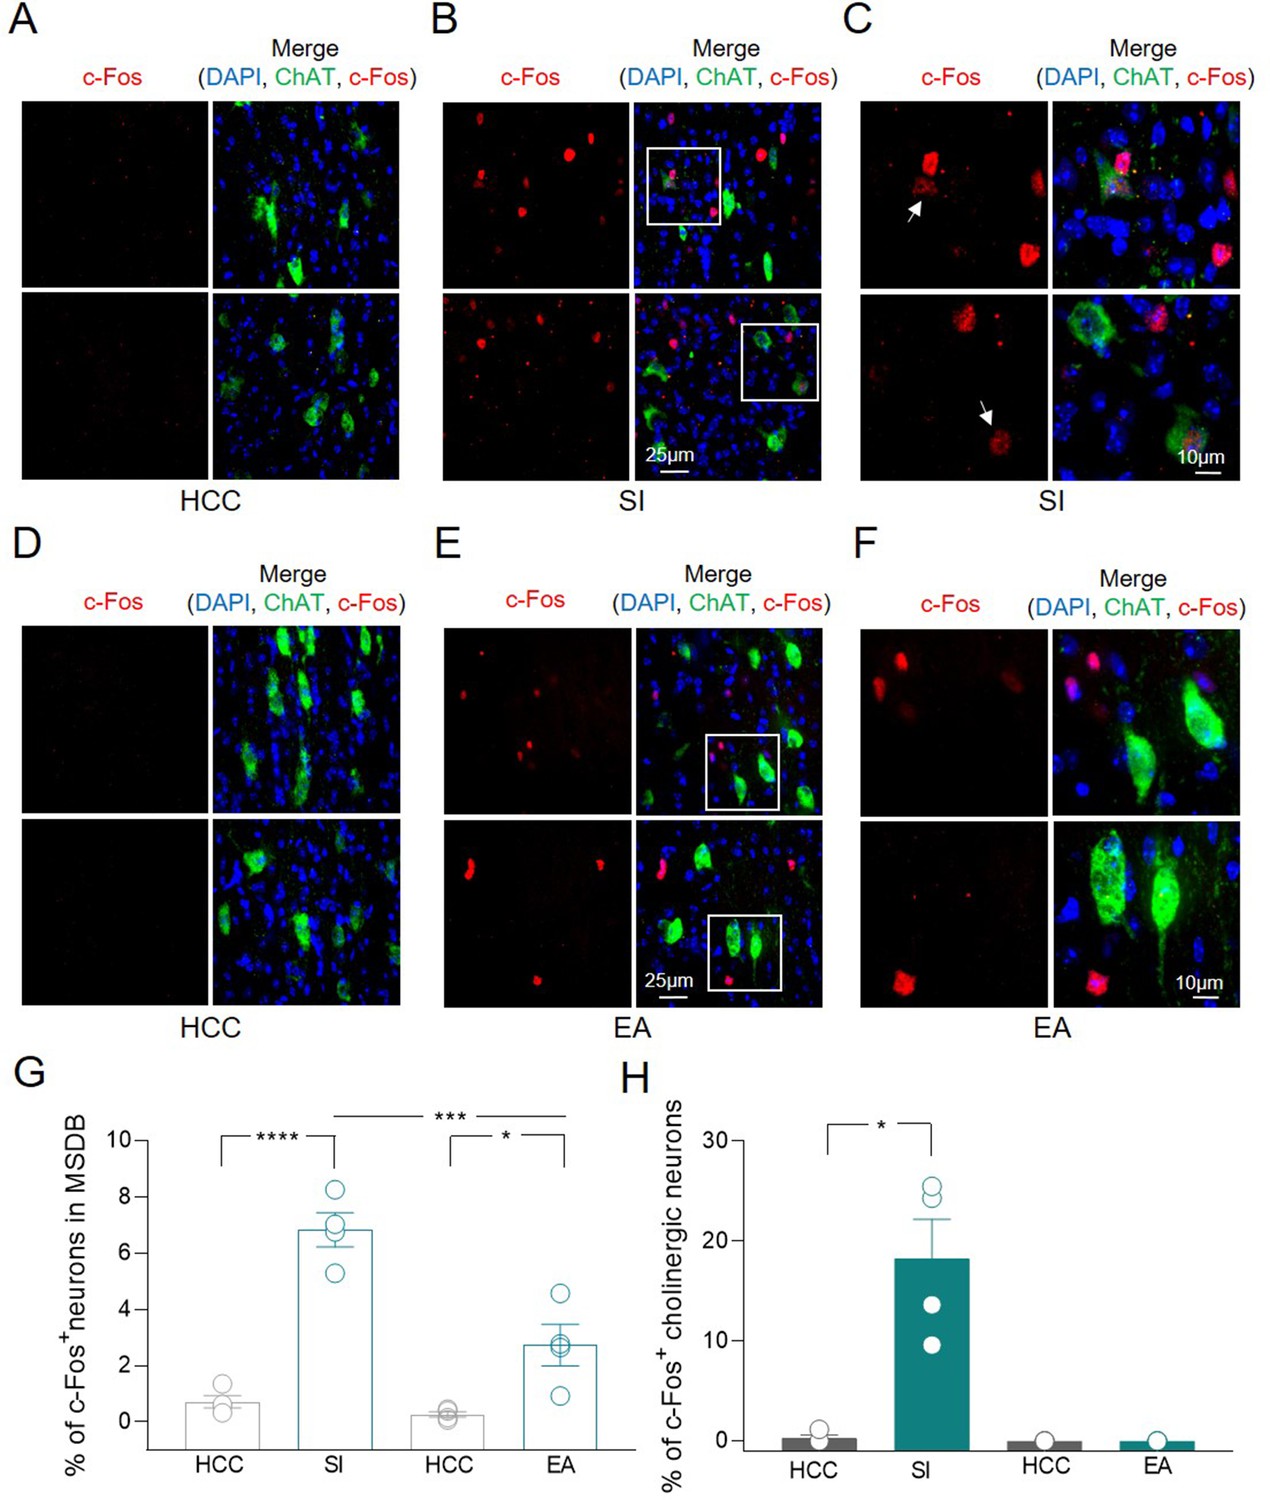
c-Fos detection in a subset of medial septum/diagonal band of Broca (MSDB) ChAT+ neurons following social behavior and environment exposure.
(A–F) Confocal images of MSDB coronal slices, immunolabeled for ChAT (green) and c-Fos (red) to detect behavior-dependent activation of cholinergic neurons. (A) No c-Fos+ neurons were detected in the MSDB of home-caged controls (HCCs). (B) c-Fos labeling of the MSDB from animals subjected to the three-chamber test (social interaction, SI) and sacrificed 1 h later, revealed sparse activation of cells including ChAT+ neurons. (C) High magnification of insets in (B) showing representative c-Fos+ nuclei of cholinergic neurons (white arrows). (D) No c-Fos+ neurons were detected in the MSDB of HCCs. (E) c-Fos labeling of the MSDB from animals subjected to three-chamber exploration (empty arena, EA) and sacrificed 1 h later, revealed sparse activation of cells not including ChAT+ neurons. (F) High magnification of insets in (E) showing representative c-Fos+ nuclei of MSDN ChAT− neurons. (G) Aligned dot plot showing the mean percentage of c-Fos+ nuclei detected in the MSDB of HCC, SI, and EA experimental groups (n = 4 animals/group; HCC: 0.72% ± 0.2%; SI: 6.83% ± 0.6%, p < 0.0001; HCC: 0.26% ± 0.1%; EA: 2.73% ± 0.8%, p = 0.02; SI vs EA, p = 0.0004, one-way ANOVA). (H) Aligned dot plot showing the mean percentage of c-Fos+ nuclei detected in ChAT+ neurons of HCC, SI and EA experimental groups (n = 4 animals/group; HCC: 0.29% ± 0.3%; SI: 18.3% ± 3.9%, p = 0.03; Mann–Whitney test). Open circles are values from single animals and bars are mean ± SEM. *: p < 0.05; ***: p < 0.001; ****: p < 0.0001.
-
Figure 2—source data 1
Raw data of c-Fos quantification in the MSDB.
- https://cdn.elifesciences.org/articles/65580/elife-65580-fig2-data1-v1.xlsx
Figure 3 with 2 supplements

Inhibition of acetylcholine (ACh) release from medial septum/diagonal band of Broca (MSDB) ChAT+ neurons impairs social novelty but not object recognition.
(A) Top: schematic illustration of the sociability task in the three-chamber test. Bottom: representative heat map showing the time spent by an eYFP (left) or a TeNT (right) mouse in exploring the animal (left) and the object (right). (B) Left: aligned dot plot showing interaction time spent to explore the animal and the object during sociability task in eYFP (control, green, n = 9) and TeNT mice (orange, n = 11) (eYFP: 187 ± 12 vs 121 ± 7.7 s, p = 0.018; TeNT: 197 ± 20 vs 127 ± 12 s, p = 0.005; one-way ANOVA). Right: aligned dot plot showing the sociability score in eYFP (control, green, n = 9) and TeNT mice (orange, n = 11) (eYFP: 66.8 ± 15 s; TeNT: 70.5 ± 21 s, p = 0.94; Mann–Whitney test). (C) Top: schematic illustration of the social novelty task in the three-chamber test. Bottom: representative heat map showing the time spent by an eYFP (left) or a TeNT (right) mouse in exploring the novel animal (left) and the familiar one (right). (D) Left: aligned dot plot showing interaction time spent to explore the novel and the familiar animal in the social novelty task in eYFP (control, green, n = 9) and TeNT (orange, n = 11) mice (eYFP: 145 ± 10 vs 81.2 ± 10 s, p = 0.002; TeNT: 79.8 ± 13 vs 101 ± 10 s, p = 0.47; one-way ANOVA). Right: aligned dot plot showing the social novelty score in eYFP (control, green, n = 9) and TeNT (orange, n = 11) mice (eYFP: 64.1 ± 12 s; TeNT: −21.7 ± 5.8 s, p < 0.0001; Mann–Whitney test). (E) Top: schematic illustration of the novel object recognition (NOR) test. Bottom: representative heat map showing the time spent by an eYFP (left) or a TeNT (right) mouse in exploring the novel (left) and the familiar (right) object. (F) Left: aligned dot plot showing the exploration time spent to explore the familiar and the novel object during NOR task in eYFP (control, green, n = 11) and TeNT (orange, n = 12) mice (eYFP: 76.6 ± 8.8 vs 39 ± 3.6 s, p = 0.03; TeNT: 99.9 ± 16 vs 37.6 ± 9.8 s, p = 0.0002; one-way ANOVA). Right: aligned dot plot showing the exploration score in eYFP (control, green, n = 11) and TeNT (orange, n = 12) mice (eYFP: 37.6 ± 9.8 s; TeNT: 62.7 ± 17 s, p = 0.38; Mann–Whitney test). Open circles are values from single animals and bars are mean ± SEM. *: p < 0.05; **: p < 0.01; ***: p < 0.001.
-
Figure 3—source data 1
Interaction times and scores for three-chamber and novel object recognition tests.
- https://cdn.elifesciences.org/articles/65580/elife-65580-fig3-data1-v1.xlsx
Figure 3—figure supplement 1
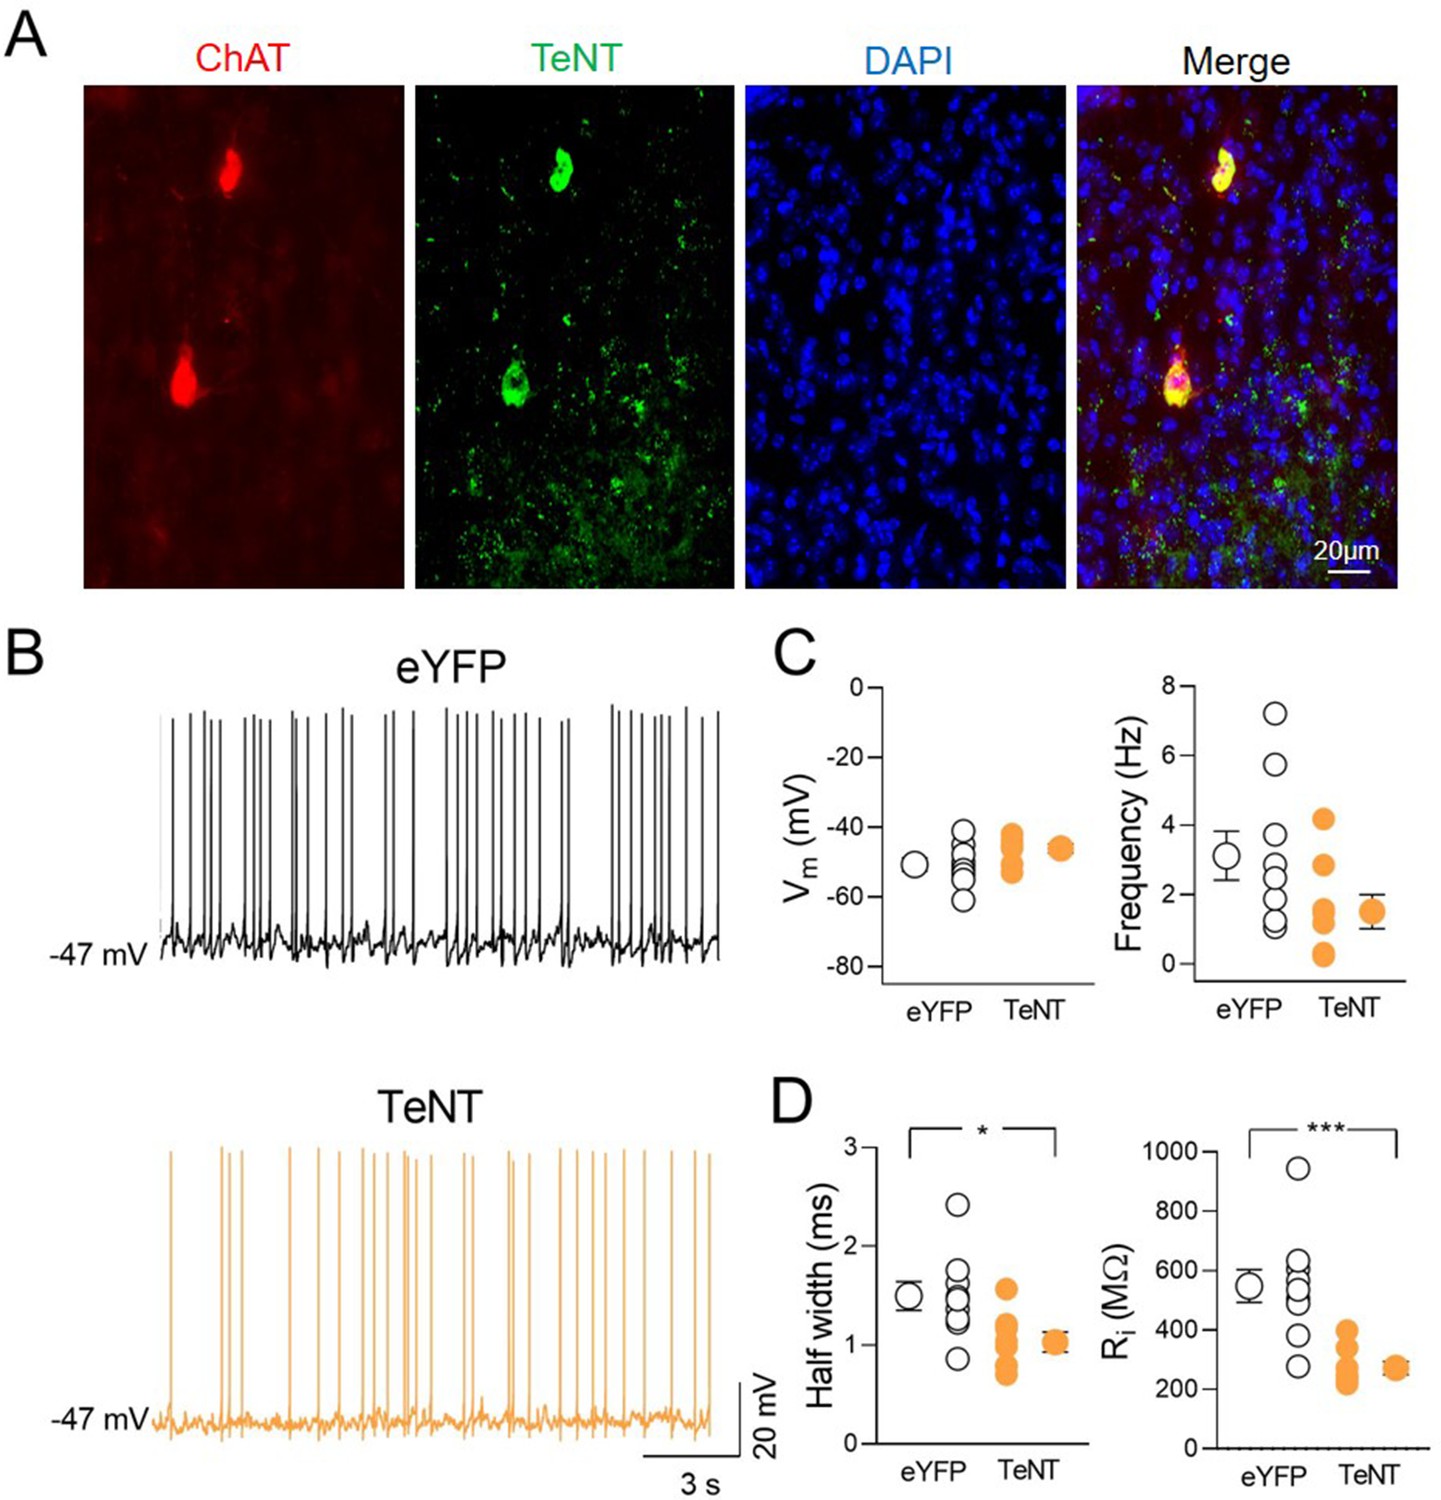
Intrinsic properties of TeNT-expressing ChAT+ neurons in the medial septum/diagonal band of Broca (MSDB).
(A) Confocal fluorescent images illustrating (from left to right): ChAT immunostaining, TeNT-GFP, nuclear-staining DAPI, and merge image of MSDB neurons. (B) Sample traces showing the spontaneous firing recorded from ChAT+ neurons expressing eYFP (black) or TeNT (orange). (C) Aligned dot plots showing Vm (left) and spontaneous firing frequency (right) of eYFP (control, black, n = 9)- and TeNT (orange, n = 8)-expressing neurons in the MSDB (Vm: eYFP, −50.7 ± 1.9 mV and TeNT, −46.1 ± 1.3 mV; p = 0.09; frequency: eYFP, 3.1 ± 0.7 Hz and TeNT, 1.51 ± 0.5 Hz; p = 0.07; Mann–Whitney test). (D) Aligned dot plots showing the half-width (left) and the input resistance (Ri, right) of eYFP (control, black, n = 9)- and TeNT (orange, n = 8)-expressing neurons in the MSDB (half-width: eYFP, 1.5 ± 0.1 ms and TeNT, 1.03 ± 0.1 ms; p = 0.011; Ri: eYFP, 549 ± 62 MΩ and TeNT, 272 ± 23 MΩ; p = 0.0006; Mann–Whitney test). Open or closed circles represent values from single cells. Laterally located circles represent mean ± SEM. *: p < 0.05; ***: p < 0.001.
Figure 3—figure supplement 2

TeNT expression in ChAT+ neurons in the medial septum/diagonal band of Broca (MSDB) does not affect locomotor activity.
(A) Schematic illustration of the open-field arena with the outer zone (yellow, left) and the inner zone (green, right). (B) Aligned dot plot showing the total distance traveled by eYFP (control, green, n = 8) and TeNT (orange, n = 10) mice during the open-field test (distance: eYFP, 35.2 ± 3.5 m; TeNT, 37.2 ± 1.3 m, p = 0.69). (C) Aligned dot plot showing the speed reached by eYFP (control, green, n = 8) and TeNT (orange, n = 10) mice (speed: eYFP, 0.059 ± 0.006 m/s; TeNT, 0.061 ± 0.002 m/s, p = 0.63). (D) Aligned dot plots showing the time spent in the inner (inner time: eYFP, 36.1 ± 7.1 s; TeNT, 29 ± 3 s, p = 0.41; Mann–Whitney test) and outer (outer time: eYFP, 564 ± 7.1 s; TeNT, 571 ± 3 s, p = 0.39) zones by eYFP (control, green, n = 8) and TeNT mice (orange, n = 10). (E) Schematic illustration of the three-chamber apparatus. (F) Aligned dot plots showing the distance traveled (left) and the speed reached (right) by eYFP (control, green, n = 9) and TeNT (orange, n = 11) mice (distance: eYFP, 30.6 ± 2.2 m; TeNT, 26.6 ± 1.9 m, p = 0.20; speed: eYFP, 0.052 ± 0.003 m/s; TeNT, 0.046 ± 0.004 m/s, p = 0.27; Mann–Whitney test). Open circles represent values from single animals and bars are mean ± SEM.
Figure 4 with 5 supplements
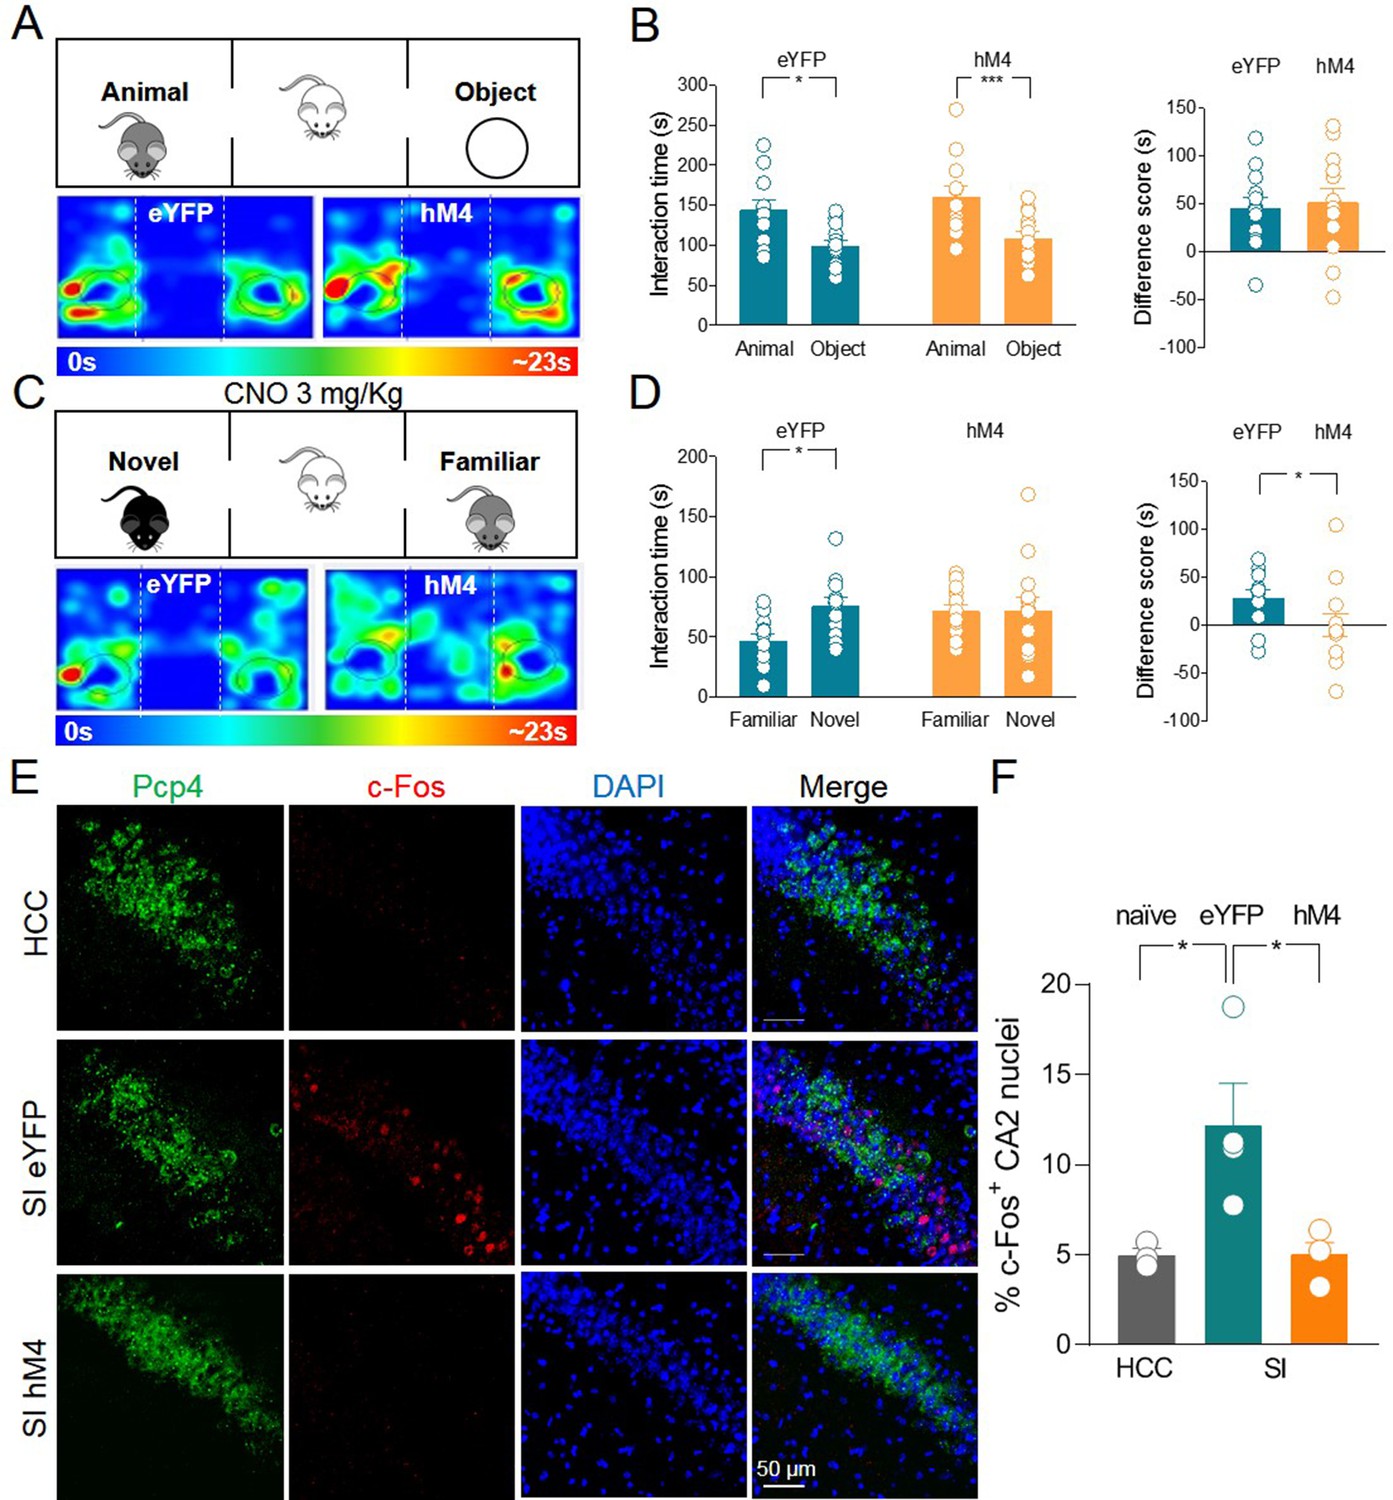
Silencing of hM4-expressing ChAT+ neurons via systemic delivery of clozapine N-oxide (CNO) inhibits social novelty and c-Fos expression in the CA2 region.
(A) Top: schematic illustration of the sociability task in the three-chamber test. Bottom: representative heat map showing the time spent by an eYFP (left) or a hM4 (right) mouse in exploring the animal (left) and the object (right). (B) Left: aligned dot plot showing interaction time spent to explore the animal and the object during sociability task in eYFP (control, green, n = 12) and hM4 mice (orange, n = 13) (eYFP: 144 ± 12 vs 99.1 ± 7.8 s, p = 0.02; hM4: 160 ± 13 vs 109 ± 8.2 s, p = 0.006; one-way ANOVA). Right: aligned dot plot showing the sociability score in eYFP (control, green, n = 12) and hM4 mice (orange, n = 13) (eYFP: 45 ± 12 s; hM4: 51 ± 15 s, p = 0.69; Mann–Whitney test). (C) Top: schematic illustration of the social novelty task in the three-chamber test performed 30 min after i.p. injection of CNO (3 mg/kg). Bottom: representative heat map showing the time spent by an eYFP (left) or a hM4 (right) mouse in exploring the novel (left) and the familiar (right) mouse. (D) Left: aligned dot plot showing interaction time spent to explore the novel and the familiar animal in the social novelty task in eYFP (control, green, n = 12) and hM4 (orange, n = 13) mice (eYFP: 75.5 ± 7.3 vs 46.8 ± 5.8 s, p = 0.01; hM4: 71.5 ± 11 vs 71.4 ± 5.4 s, p = 0.99; one-way ANOVA). Right: aligned dot plot showing the social novelty score in eYFP (control, green, n = 12) and hM4 (orange, n = 13) mice (eYFP: 28.7 ± 8.2 s; hM4: 0.15 ± 12 s, p = 0.03; Mann–Whitney test). (E) Confocal images showing (from left to right): Pcp4 (CA2 marker, in green), c-Fos (in red), nuclear-staining DAPI (blue), and merge images of CA2 hippocampal neurons. One hour after social novelty test, mice-expressing eYFP or hM4 in MSDB ChAT+ neurons were sacrificed. The behavioral-dependent (social interaction, SI) activation of CA2 (detected by c-Fos immunostaining) was observed in eYFP mice but not in hM4 mice. Data were compared with those obtained from home-caged controls (HCCs). (F) Aligned dot plot showing the average percentage of c-Fos+ nuclei detected in the CA2 region in the experimental groups (n = 3–4 animals/group; HCC: 4.9% ± 0.4%; SI: 12.2% ± 2.3%; hM4: 5.02% ± 0.7%; p = 0.015, one-way ANOVA); open circles are values from single animals and bars are mean ± SEM. *:p < 0.05; ***: p < 0.001.
-
Figure 4—source data 1
Interaction times and scores for three-chamber and c-Fos quantification in CA2.
- https://cdn.elifesciences.org/articles/65580/elife-65580-fig4-data1-v1.xlsx
Figure 4—figure supplement 1
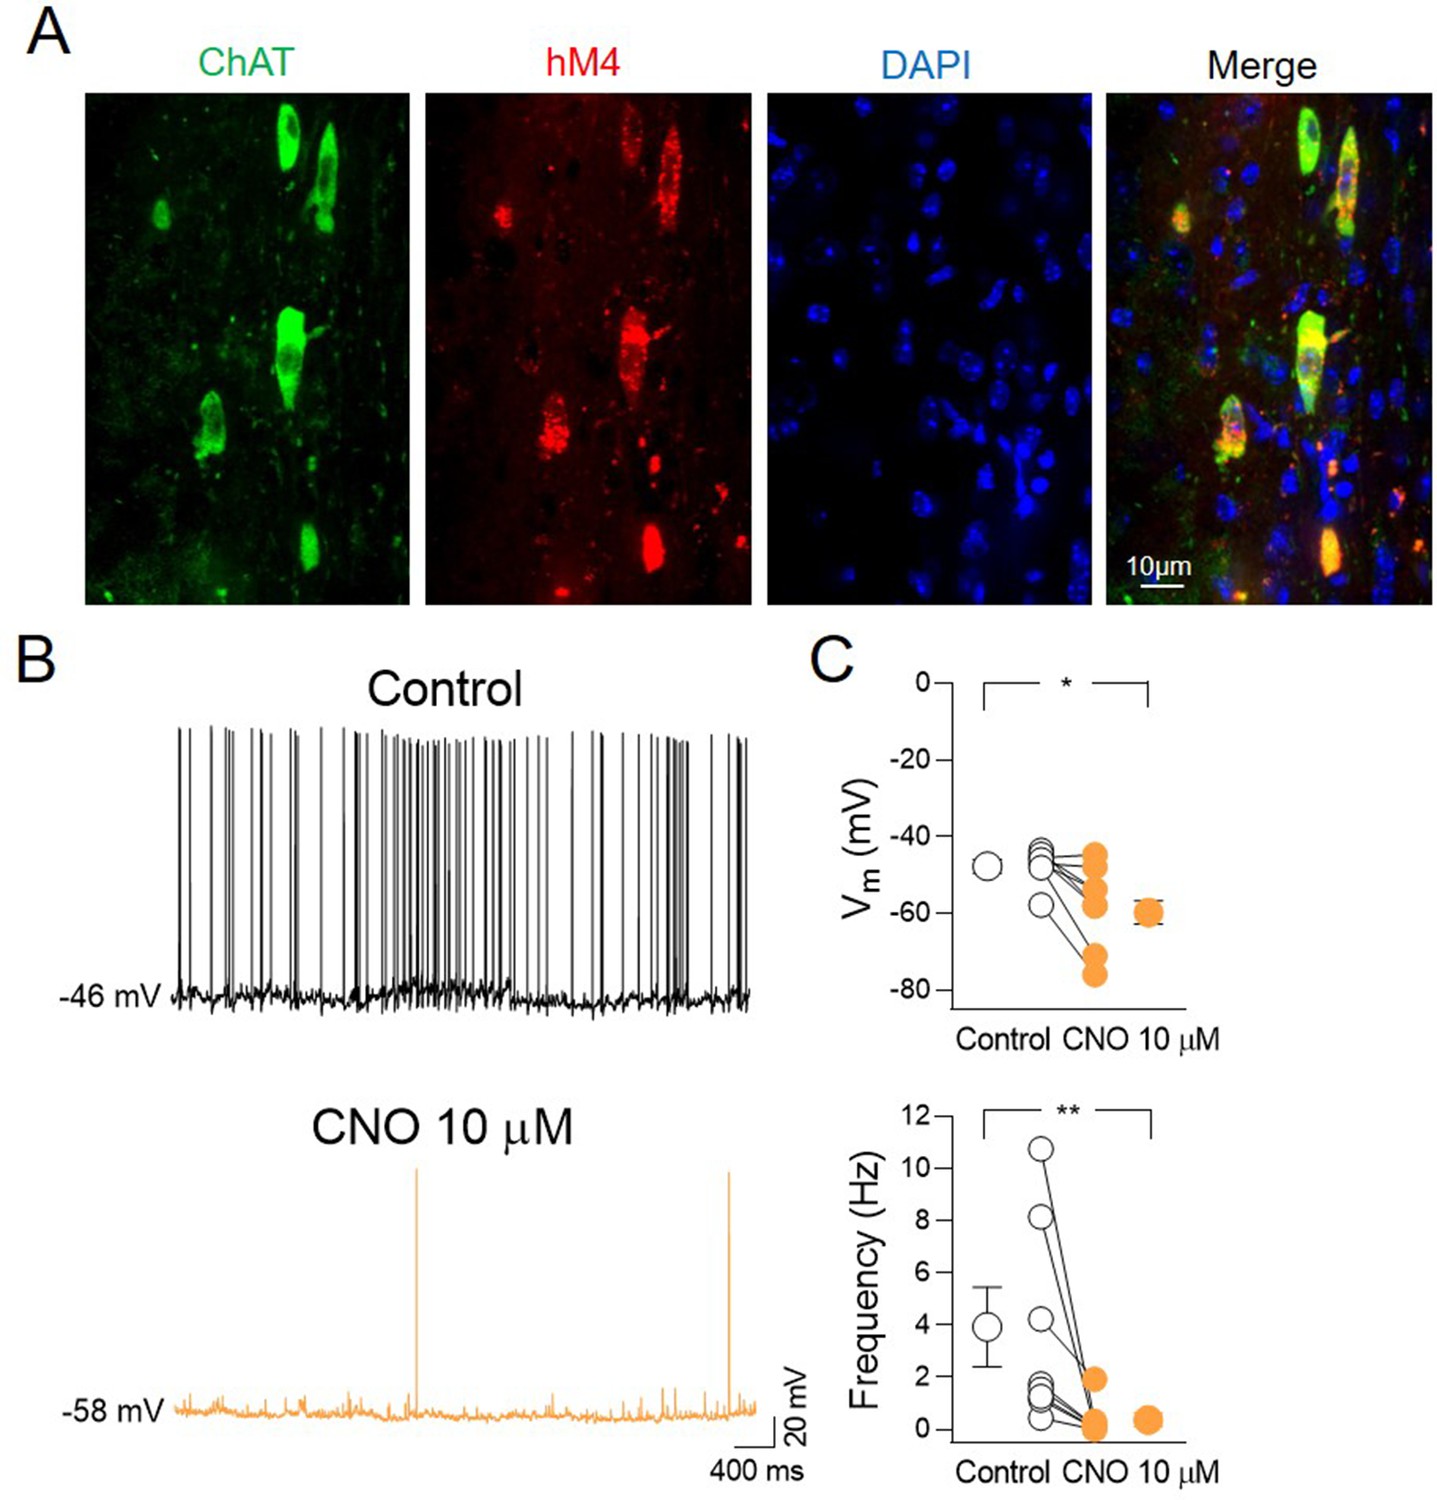
Clozapine N-oxide (CNO) application inhibits the spontaneous firing of hM4-expressing ChAT+ neurons in the medial septum/diagonal band of Broca (MSDB).
(A) Confocal fluorescent images illustrating (from left to right): ChAT immunostaining, hM4-mCherry, nuclear-staining DAPI, and merge image of MSDB neurons. (B) Sample traces showing spontaneous firing of ChAT+ neurons expressing hM4 in the MSDB in control (black) and in the presence of CNO (orange). (C) Aligned dot plots showing Vm (top) and spontaneous firing frequency (bottom) in control (black) and in the presence of CNO (orange) (n = 8 cells; Vm: control, −47.4 ± 1.6 mV; CNO, −57.8 ± 3.8 mV; p = 0.016; frequency: control, 3.66 ± 1.3 Hz; CNO, 0.34 ± 23 Hz; p = 0.008; Wilcoxon test). Open and closed circles represent values from single cells. Laterally located circles represent mean ± SEM. *: p < 0.05; **: p < 0.01.
Figure 4—figure supplement 2
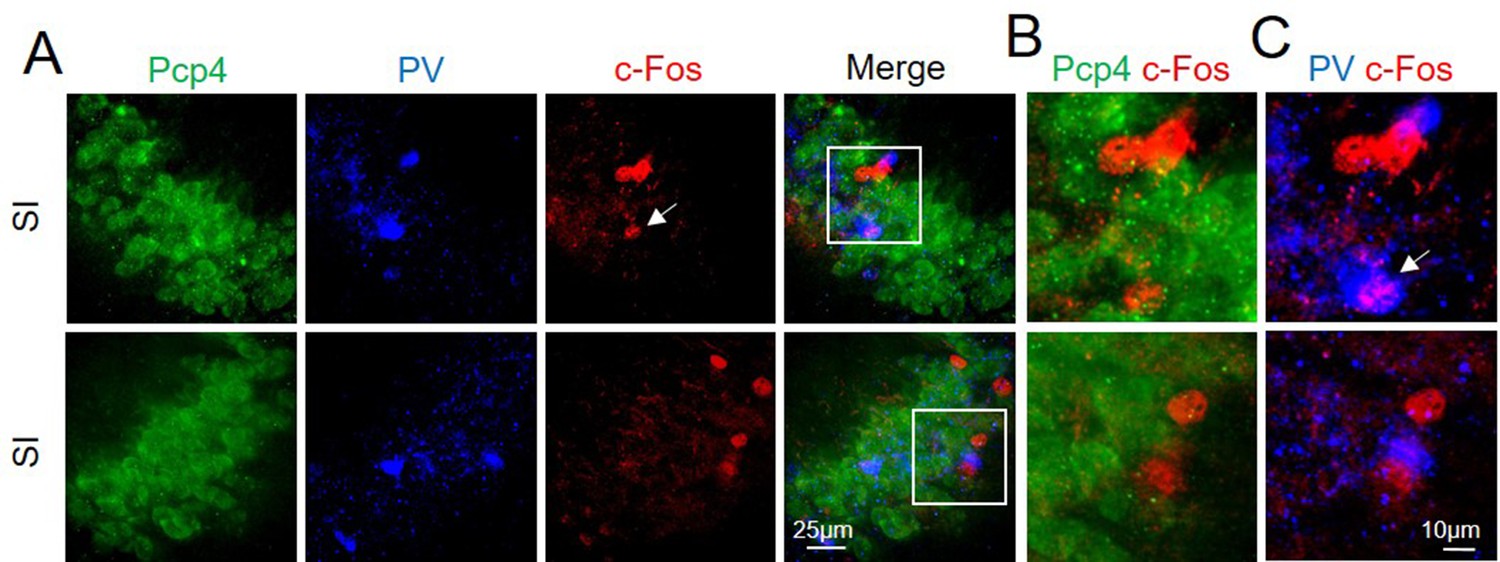
c-Fos activation of PCP4− neurons after social interaction.
(A) Confocal images showing (from left to right): Pcp4 (CA2 marker, in green), parvalbumin (PV, in blue), c-Fos (in red), and merge images of CA2 hippocampal neurons. (B) High magnification of double staining for Pcp4 and c-Fos markers. (C) High magnification of double staining for PV and c-Fos markers showing c-Fos+ nucleus of a PV neuron (white arrow). The behavioral-dependent (social interaction, SI) activation of c-Fos in CA2 was mainly observed in Pcp4− neurons (n = 3 animals, 94.1% ± 3.0%; average n = 8 c-Fos+ nuclei/animal) and PV− neurons (n = 3 animals, 91.5% ± 4.5%; average n = 8 c-Fos+ nuclei/animal).
Figure 4—figure supplement 3

c-Fos activation in CA2 after empty arena exploration.
(A) Confocal images showing (from left to right): Pcp4 (CA2 marker, in green), c-Fos (in red), nuclear-staining DAPI (blue), and merge images of CA2 hippocampal neurons in home-caged control (HCC) and empty arena (EA) conditions. (B) Aligned dot plot showing the mean percentage of c-Fos+ nuclei detected in the CA2 of HCC and EA experimental groups (n = 4 animals/group; HCC: 2.0% ± 0.2%; EA: 2.15% ± 0.1%, p = 0.97; Mann–Whitney test).
Figure 4—figure supplement 4
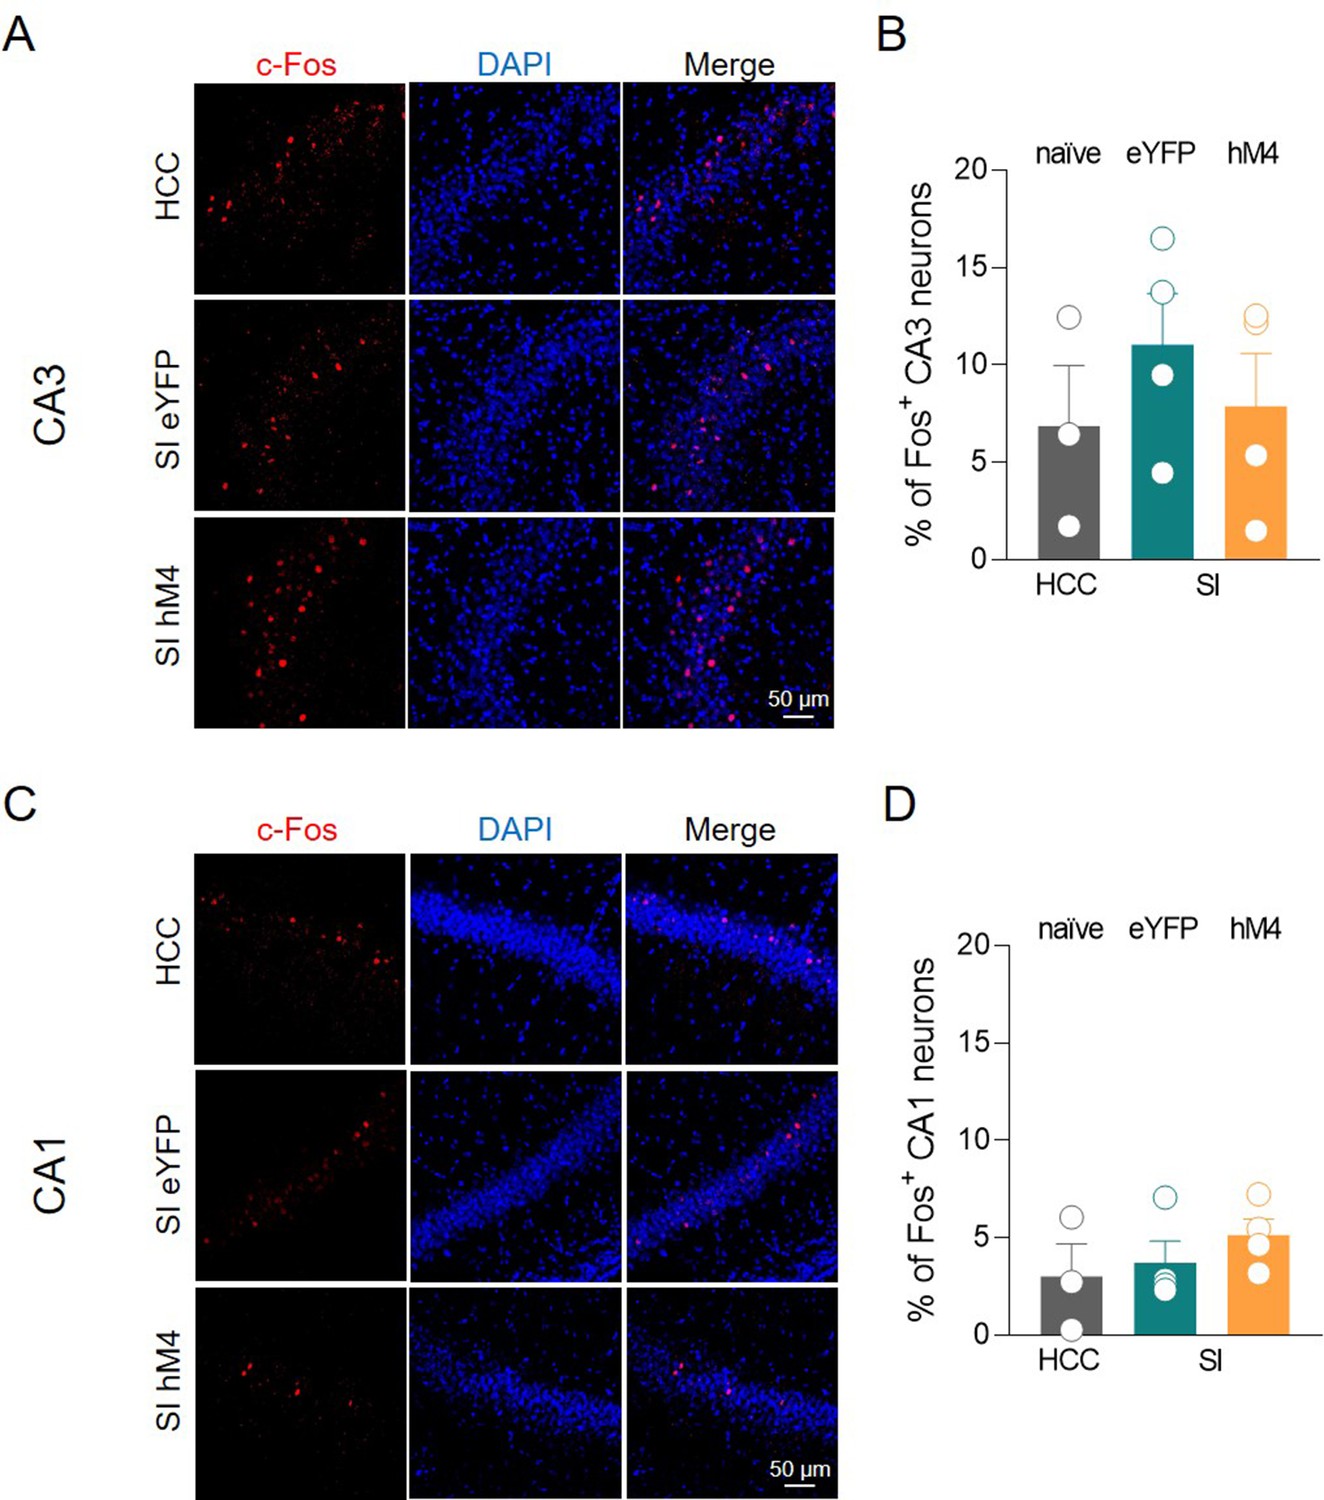
The inhibition of medial septum/diagonal band of Broca (MSDB) ChAT+ neurons does not affect c-Fos expression in the CA3 and CA1 regions.
(A) Confocal images showing (from left to right): c-Fos (in red), nuclear-staining DAPI (blue), and merge images of CA3 hippocampal neurons in home-caged control (HCC), social interaction (SI) eYFP, and SI hM4 experimental groups. (B) Aligned dot plot showing the average percentage of c-Fos+ nuclei detected in the CA3 region in the experimental groups (n = 3–4 animals/group; HCC: 6.88% ± 3.1%; SI: 11% ± 2.6%; hM4: 7.9% ± 2.7%; p = 0.6; one-way ANOVA). (C) Confocal images showing (from left to right): c-Fos (in red), nuclear-staining DAPI (blue), and merge images of CA1 hippocampal neurons in HCC, SI eYFP, and SI hM4 experimental groups. (D) Aligned dot plot showing the average percentage of c-Fos+ nuclei detected in the CA1 region in the experimental groups (n = 3–4 animals/group; HCC: 3.03% ± 1.7%; SI: 3.72% ± 1.1%; hM4: 5.14% ± 0.8%; p = 0.47; one-way ANOVA). Open circles are values from single animals and bars are mean ± SEM.
Figure 4—figure supplement 5
Silencing of hM4-expressing ChAT+ neurons via systemic delivery of clozapine N-oxide (CNO) affects spatial memory.
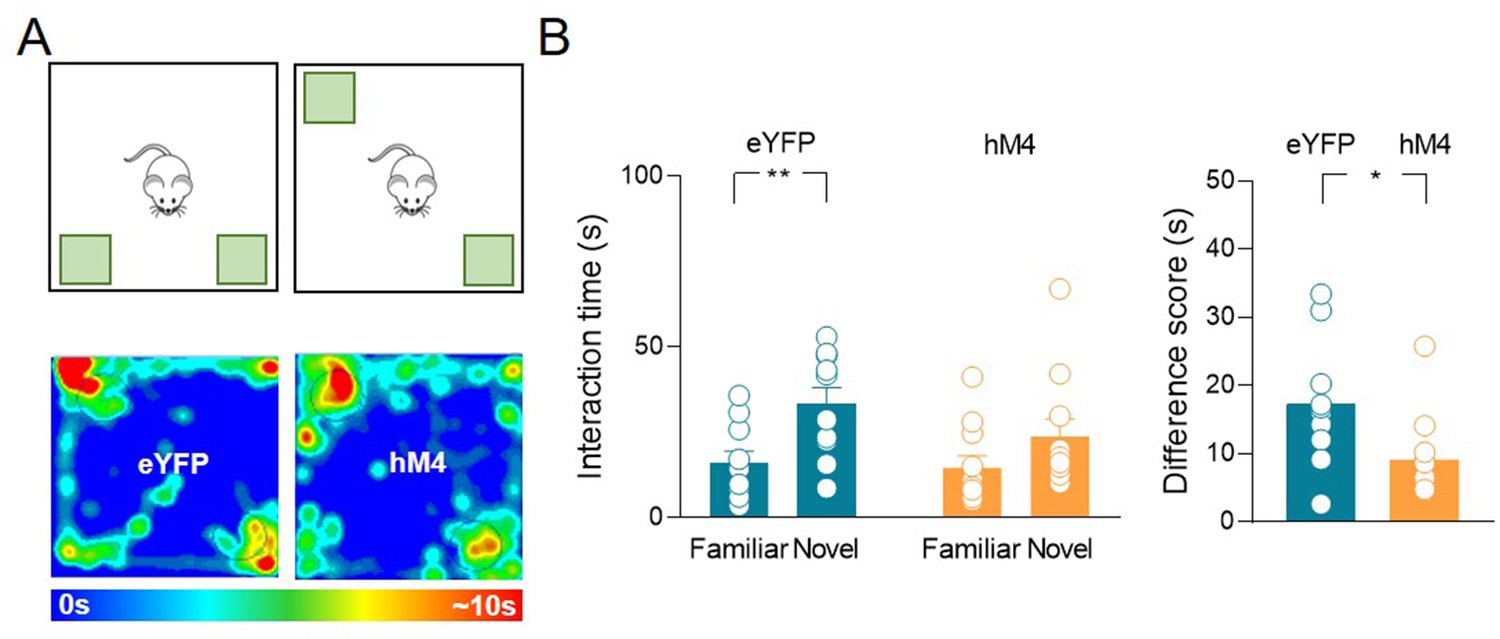
(A) Top: schematic illustration of the novel object location test (OLT). Bottom: representative heat map showing the time spent by an eYFP (left) or hM4 (right) mouse in exploring the novel (upper left) and the familiar (bottom right) object location. (B) Left: aligned dot plots showing the exploration time spent to explore the familiar and the novel object location during OLT task in eYFP (control, green, n = 9) and hM4 (orange, n = 11) mice (eYFP: 17.1 ± 3.7 vs 36.0 ± 4.5 s, p = 0.03; hM4: 14.5 ± 3.6 s vs 23.7 ± 5.2 s, p = 0.4; one-way ANOVA). Right: aligned dot plot showing the exploration score in eYFP (control, green, n = 9) and hM4 (orange, n = 11) mice (eYFP: 18.9 ± 2.7 s; hM4: 9.1 ± 1.9 s, p = 0.016; Mann–Whitney test). Open circles are values from single animals and bars are mean ± SEM. *: p < 0.05; **: p = 0.01.
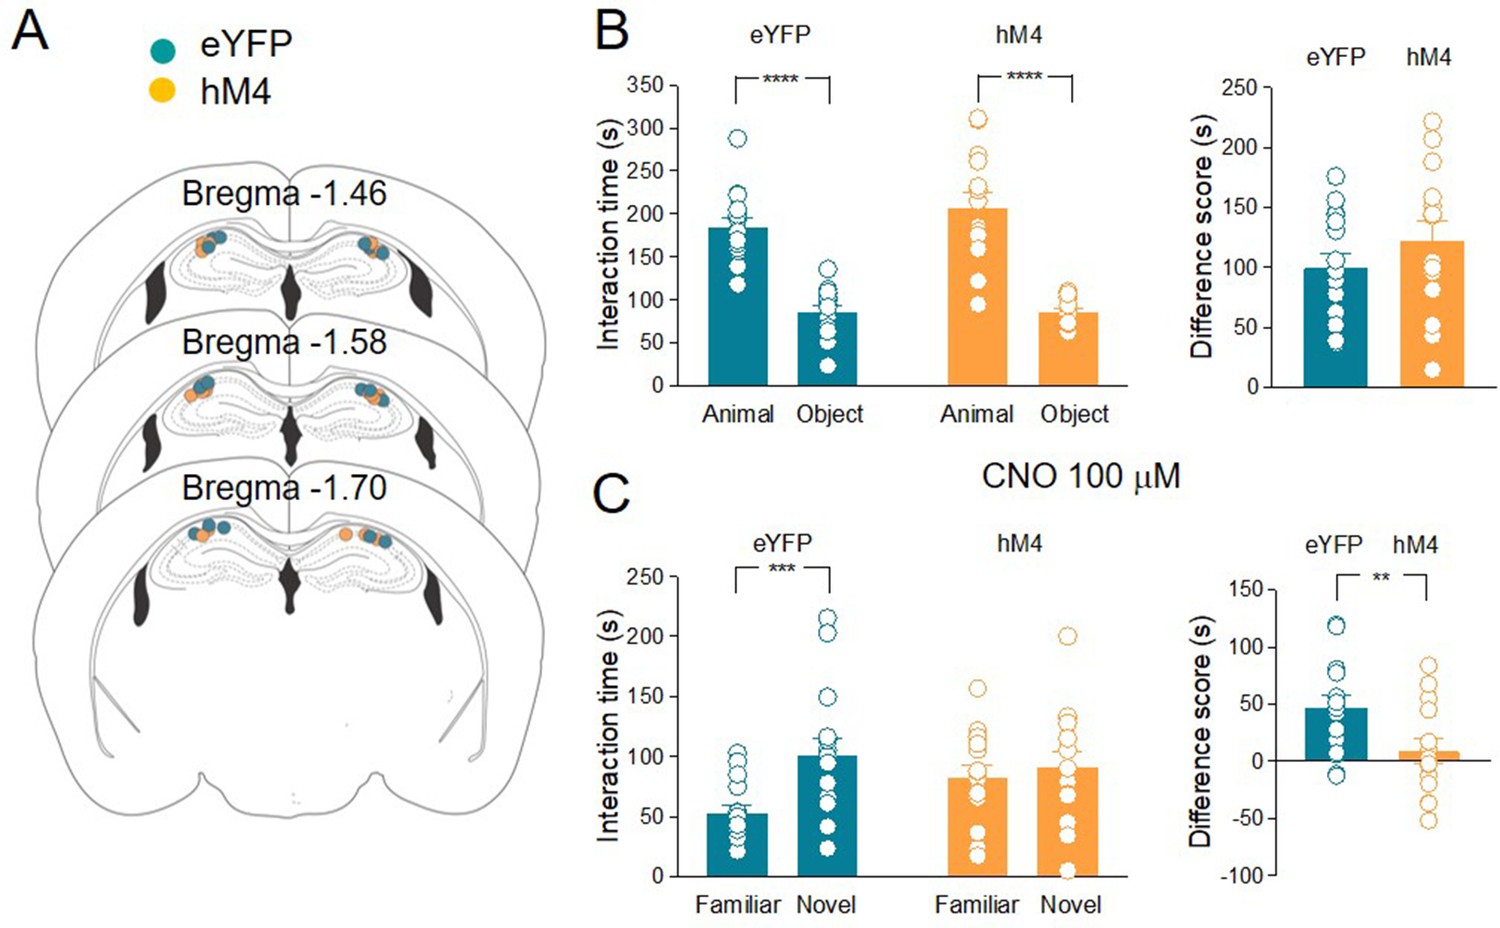
Figure 5 with 2 supplements
The inhibition of acetylcholine (ACh) release in the hippocampus impairs social novelty.
(A) Schematic representations of cannula placements in the dorsal hippocampus of eYFP (control, green, n = 15) and hM4 (orange, n = 14) mice. (B) Left: aligned dot plots showing interaction time spent to explore the animal and the object during sociability task in eYFP (control, green, n = 15) and hM4 (orange, n = 14) mice (eYFP: 185 ± 10 vs 85.3 ± 7.3 s, p < 0.0001; hM4: 207 ± 17 vs 85 ± 3.7 s, p < 0.0001; one-way ANOVA). Right: aligned dot plot showing the sociability score in eYFP (control, green, n = 15) and hM4 (orange, n = 14) mice (eYFP: 99.4 ± 12 s; hM4: 122 ± 17 s, p = 0.27; Mann–Whitney test). (C) Left: aligned dot plots showing interaction time spent to explore the novel and the familiar animal in the social novelty task in eYFP (control, green, n = 15) and hM4 (orange, n = 14) mice following CNO (100 µM) delivery to the CA2 area of the hippocampus (30 min before social novelty task) (eYFP: 53 ± 6.6 vs 100 ± 14 s, p = 0.0009; hM4: 82.2 ± 10 vs 90.9 ± 13 s, p = 0.9; one-way ANOVA). Right: aligned dot plot showing the social novelty score in eYFP (control, green, n = 15) and hM4 (orange, n = 14) mice (eYFP: 47.4 ± 8.7 s; hM4: 8.7. ± 11 s, p = 0.3; Mann–Whitney test). Open circles are values from single animals and bars are mean ± SEM. **: p < 0.01; ***p < 0.001; ****: p < 0.0001.
-
Figure 5—source data 1
Interaction times and scores for three-chamber test.
- https://cdn.elifesciences.org/articles/65580/elife-65580-fig5-data1-v1.xlsx
Figure 5—figure supplement 1
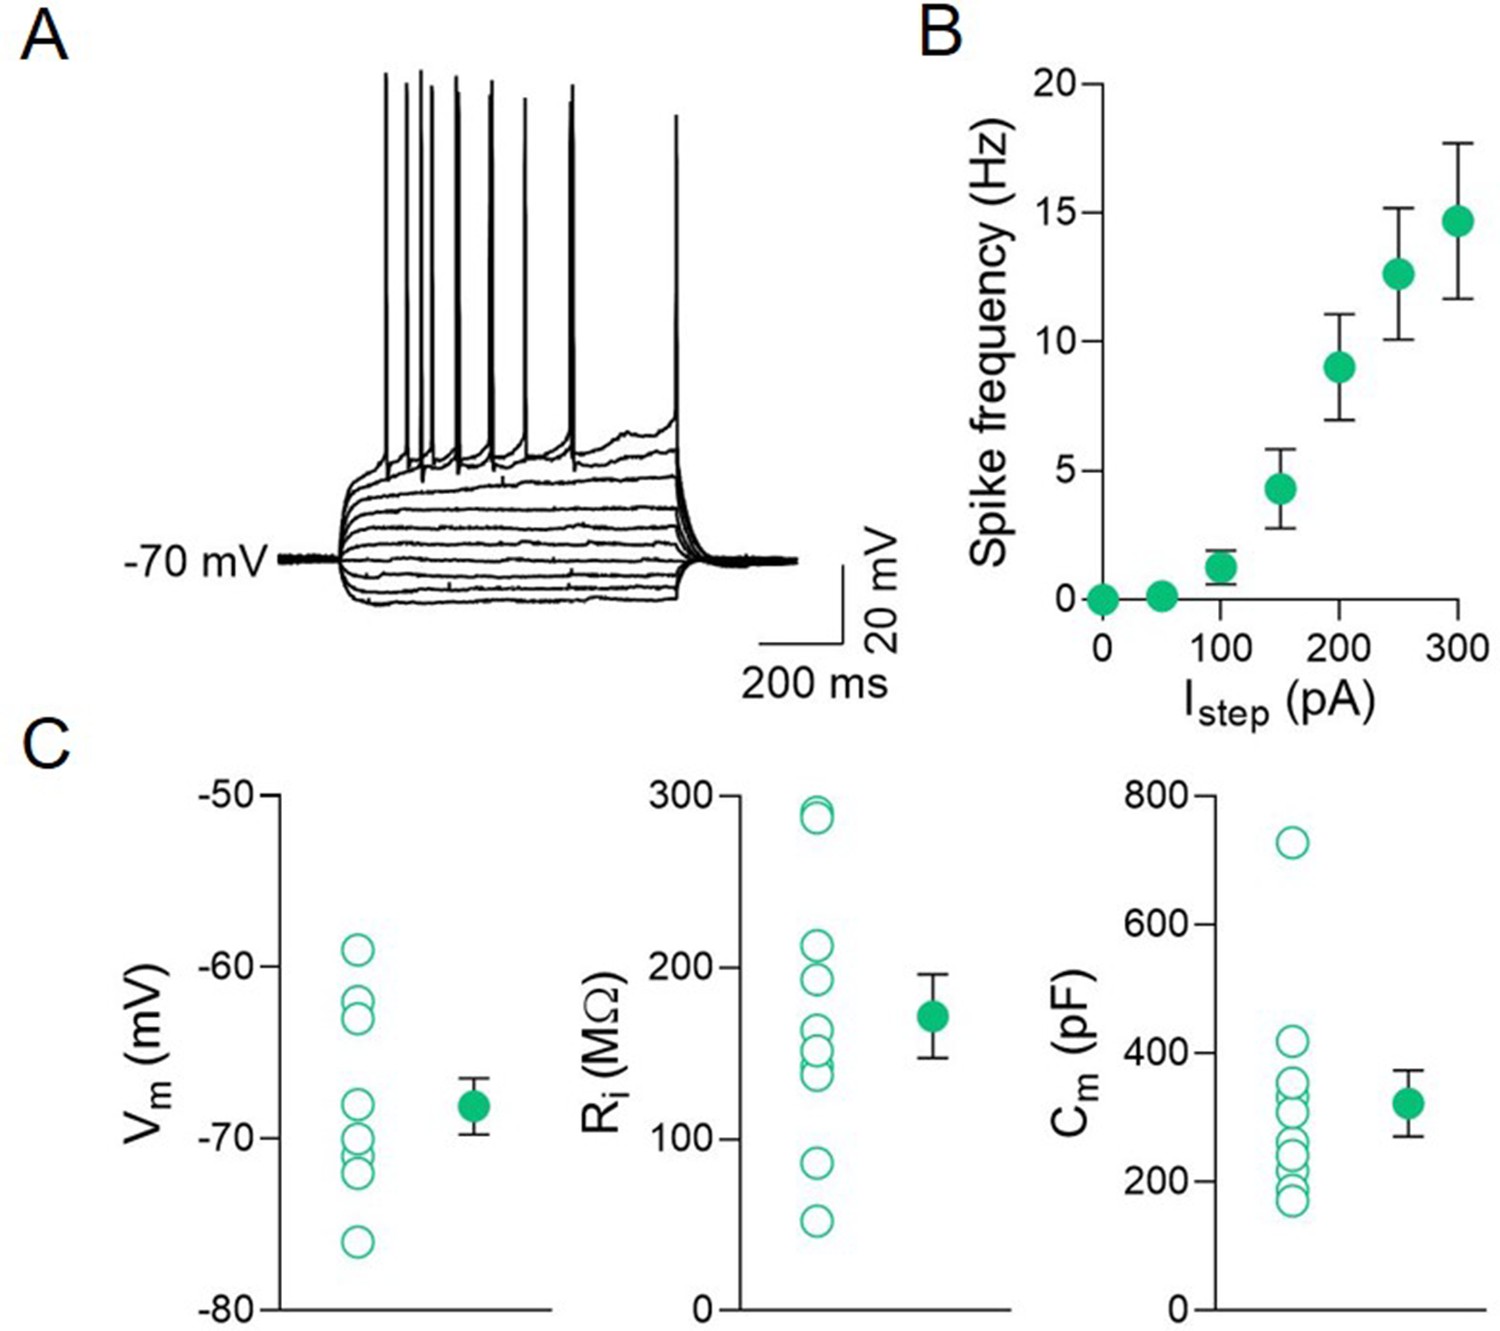
CA2 principal neuron properties.
(A) Sample traces showing membrane voltage responses of a CA2 principal neuron to hyperpolarizing and depolarizing current steps. (B) Plot showing the average spike frequency of CA2 principal cells in response to depolarizing current steps of different amplitude (n = 9 cells; 50 pA: 0.14 ± 0.14 Hz; 100 pA: 1.25 ± 0.7 Hz; 150 pA: 4.3 ± 1.5 Hz; 200 pA: 9.03 ± 2.1 Hz; 250 pA: 12.6 ± 2.6 Hz; 300 pA: 14.7 ± 3.0 Hz). (C) Aligned dot plots showing the resting membrane potentials (Vm, left), the input resistance (Ri), and the membrane capacitance (Cm, right) of CA2 principal neurons (n = 10 cells; Vm: 68.1 ± 1.6 mV; Ri: 127 ± 24 MΩ; Cm: 322 ± 51 pF). Open circles are values from single cells and closed circles are mean ± SEM.
Figure 5—figure supplement 2

Clozapine N-oxide (CNO) affects both inhibitory and excitatory neurotransmission in CA2 from ChAT-Cre mice-expressing hM4 in medial septum/diagonal band of Broca (MSDB) neurons but not from naive mice.
(A) Sample traces showing spontaneous inhibitory postsynaptic currents (sIPSCs) from a CA2 pyramidal neuron of a naive animal in control (black) and during bath application of CNO (10 µM; green). (B) Aligned dot plots showing the frequency (left, n = 10) and the amplitude (right, n = 10) of sIPSCs, recorded in CA2 principal neurons from naive mice, in control and during bath application of CNO (10 µM) (frequency: control: 6.6 ± 1.1 Hz, CNO: 7.24 ± 1.3 Hz, p = 0.38; amplitude: control: 30 ± 3.4 pA, CNO: 29.5 ± 2.9 pA, p = 0.82; Wilcoxon test). (C) Top: sample traces showing spontaneous excitatory postsynaptic currents (sEPSCs) from a CA2 pyramidal neuron of a naive animal in control (black) and during bath application of CNO (10 µM; green). (D) Aligned dot plots showing the frequency (left, n = 9) and the amplitude (right, n = 9) of sEPSCs, recorded in CA2 principal neurons from naive mice, in control and during bath application of CNO (10 µM) (frequency: control: 0.96 ± 0.3 Hz, CNO: 1.0 ± 0.3 Hz, p > 0.99; amplitude: control: 18.9 ± 1.4 pA, CNO: 17.6 ± 1.1 pA, p = 0.36; Wilcoxon test). (E) Sample traces showing sIPSCs recorded from a CA2 pyramidal neuron of a hM4 mouse in control (black) and in the presence of CNO (10 µM; orange). (F) Aligned dot plots showing the mean frequency (left) and amplitude (right) of sIPSCs recorded in control (black, n = 11) and in the presence of CNO (10 μM; orange, n = 11) (frequency: control: 8.61 ± 1.6 Hz, CNO: 5.1 ± 1.3 Hz, p = 0.01; amplitude: control: 35.2 ± 4.3 pA, CNO: 27.8 ± 2.2 pA, p = 0.21; Wilcoxon test). (G) Sample traces showing sEPSCs from a CA2 pyramidal neurons of a hM4 mouse in control (black) and in the presence of CNO (10 μM; orange, n = 8). (H) Aligned dot plots showing the mean frequency (left) and amplitude (right) of sEPSCs in control (black, n = 8) and in the presence of CNO (10 μM; orange, n = 8) (frequency: control: 2.1 ± 0.5 Hz, CNO: 0.8 ± 0.3 Hz, p = 0.008; amplitude: control: 21.9 ± 2.5 pA, CNO: 15.5 ± 1.4 pA, p = 0.016; Wilcoxon test). (I) Aligned dot plots showing the changes (%) in frequency (left) and amplitude (right) of sIPSCs in naive (green, n = 9) and hM4 (orange, n = 11) mice in the presence of CNO (frequency: naive: 109% ± 6.9%, hM4: 60.5% ± 9.8%, p = 0.001; amplitude: naive: 103% ± 9.3%, hM4: 86.5% ± 1.4%, p = 0.51; Mann–Whitney test). (J) Aligned dot plots showing the changes (%) in frequency (left) and amplitude (right) of sEPSCs in naive (green, n = 9) and hM4 (orange, n = 8) mice in the presence of CNO (frequency: naive: 106% ± 16%, hM4: 41.6% ± 8.9%, p = 0.001; amplitude: naive: 95.3% ± 6.1%, hM4: 74.8% ± 5.3%, p = 0.03; Mann–Whitney test). Open or closed circles represent values from single cells. Laterally located circles and bars represent mean ± SEM. *: p < 0.05; **: p < 0.01; ***: p < 0.001.
Figure 6 with 1 supplement
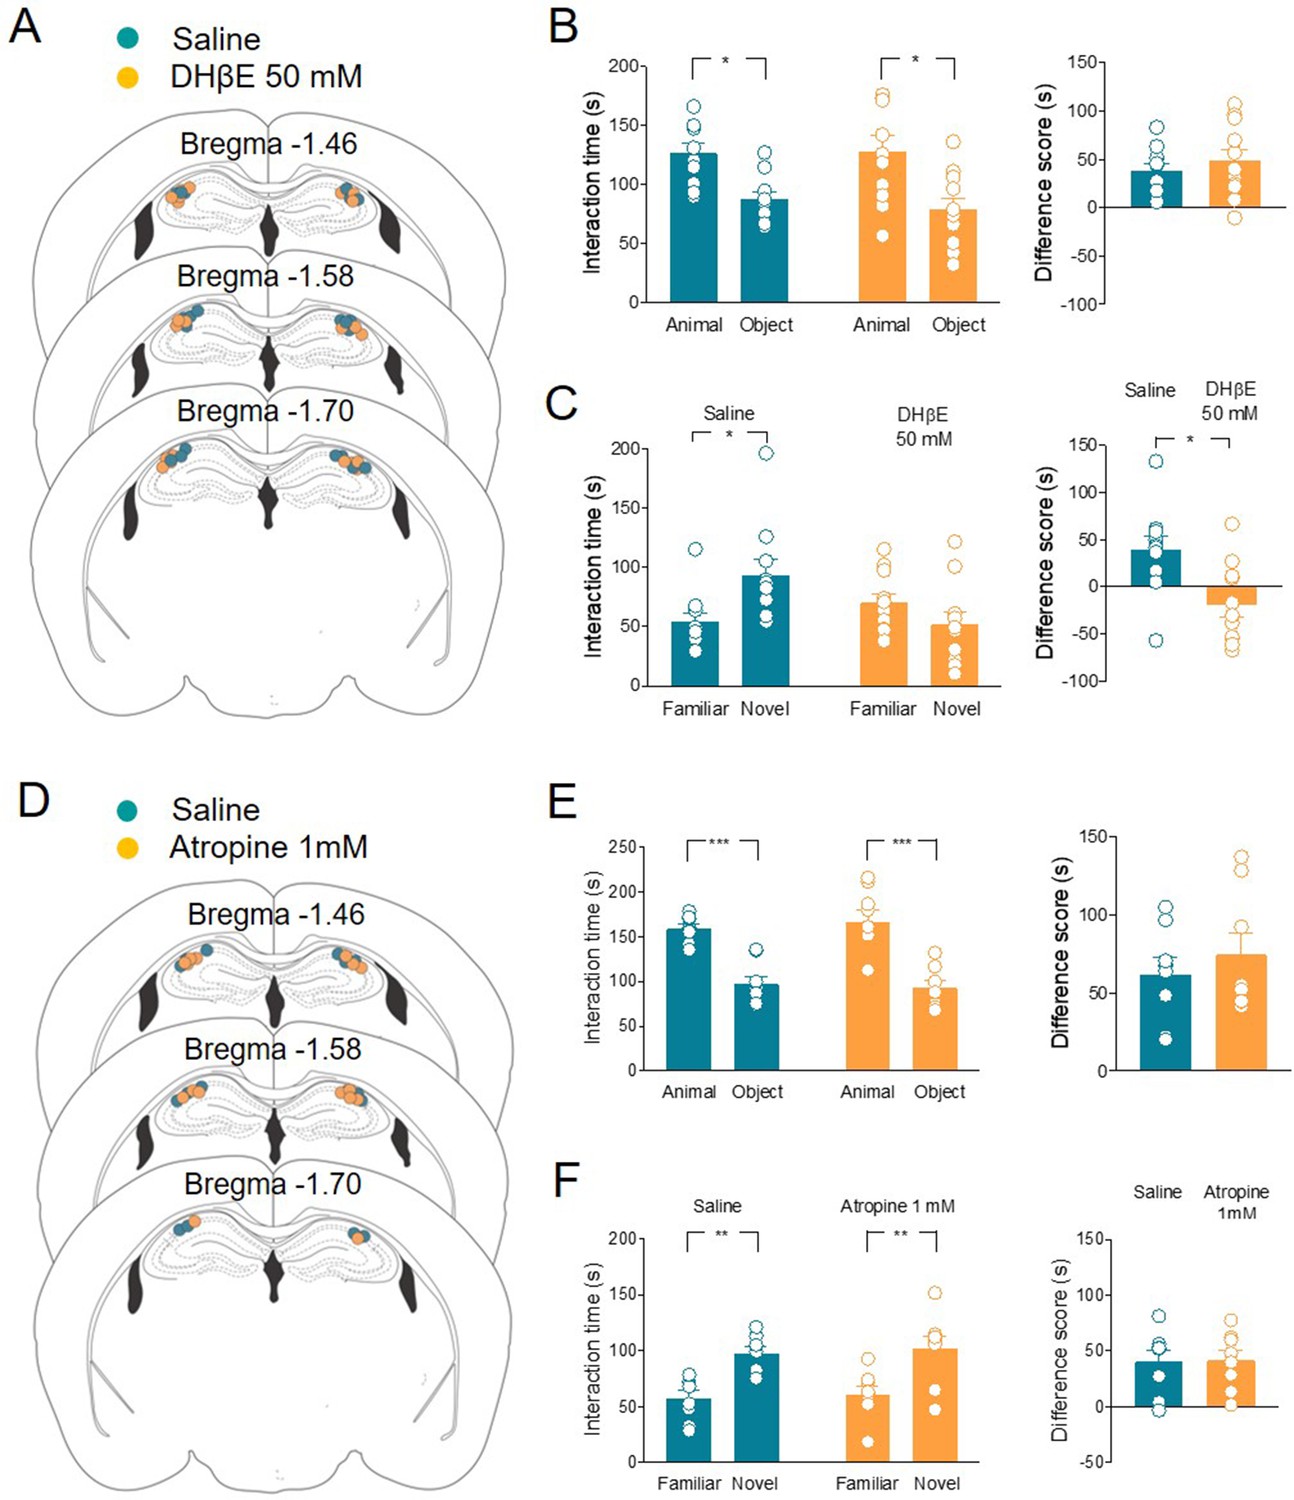
Local application of nAChRs, but not mAChRs antagonists in CA2 affects social novelty.
(A) Schematic representations of cannula placements in the dorsal hippocampus of mice receiving a solution containing saline (control, green, n = 10) or dihydro-β-erythroidine (DHβE) (50 mM, orange, n = 11). (B) Left: aligned dot plots showing interaction time spent to explore the animal and the object during sociability task in the two groups of mice (green, n = 10 and orange, n = 11) (green: 126 ± 8 vs 87.3 ± 6.3 s, p = 0.03; orange: 128 ± 13 vs 79 ± 9 s, p = 0.005; one-way ANOVA). Right: aligned dot plot showing the sociability score in the two groups of mice (green, n = 10 and orange, n = 11) (green: 38.7 ± 7.3 s; orange: 48.8 ± 12 s, P = 0.6; Mann–Whitney test). (C) Left: aligned dot plot showing interaction time spent to explore the novel and the familiar animal in the social novelty task in saline- (control, green, n = 10) and DHβE-treated (orange, n = 11) mice (saline: 93.2 ± 14 vs 54.2 ± 7.7 s, p = 0.05; DHβE: 51.7 ± 10 vs 70.3 ± 7.5 s, p = 0.54; one-way ANOVA). Right: aligned dot plot showing the social novelty score saline- (control, green, n = 10) and DHβE-treated (orange, n = 11) mice (saline: 39 ± 15 s; DHβE: –18.6 ± 13 s, p = 0.016; Mann–Whitney test). (D) Schematic representations of cannula placements in mice that received saline solution (control, green, n = 8) or atropine (1 mM, orange, n = 8). (E) Left: aligned dot plot showing interaction time spent to explore the animal and the object during sociability task in the two groups of mice (green, n = 8 and orange, n = 8) (green: 159 ± 5.2 vs 97.3 ± 8.9 s, p = 0.0003; orange: 167 ± 14 vs 92.4 ± 8 s, p < 0.0001; one-way ANOVA). Right: aligned dot plot showing the sociability score in the two groups of mice (green, n = 8 and orange, n = 8) (green: 61.7 ± 11 s; orange: 74.4 ± 14 s, p > 0.99; Mann–Whitney test). (F) Left: aligned dot plot showing interaction time spent to explore the novel and the familiar animal in the social novelty task in saline- (control, green, n = 8) and atropine-treated (orange, n = 8) mice (saline: 97.9 ± 5.9 vs 57.4 ± 7.04 s, p = 0.009; atropine: 102 ± 11 vs 60.6 ± 7.6 s, p = 0.007; one-way ANOVA). Right: aligned dot plot showing the social novelty score in saline- (control, green, n = 8) and atropine-treated (orange, n = 8) mice (saline: 40.5 ± 10 s; atropine: 41.5 ± 9 s, p = 0.96; Mann–Whitney test). Open circles are values from single animals and bars are mean ± SEM. *: p < 0.05; **: p < 0.01; ***: p < 0.001.
-
Figure 6—source data 1
Interaction times and scores for three-chamber test.
- https://cdn.elifesciences.org/articles/65580/elife-65580-fig6-data1-v1.xlsx
Figure 6—figure supplement 1
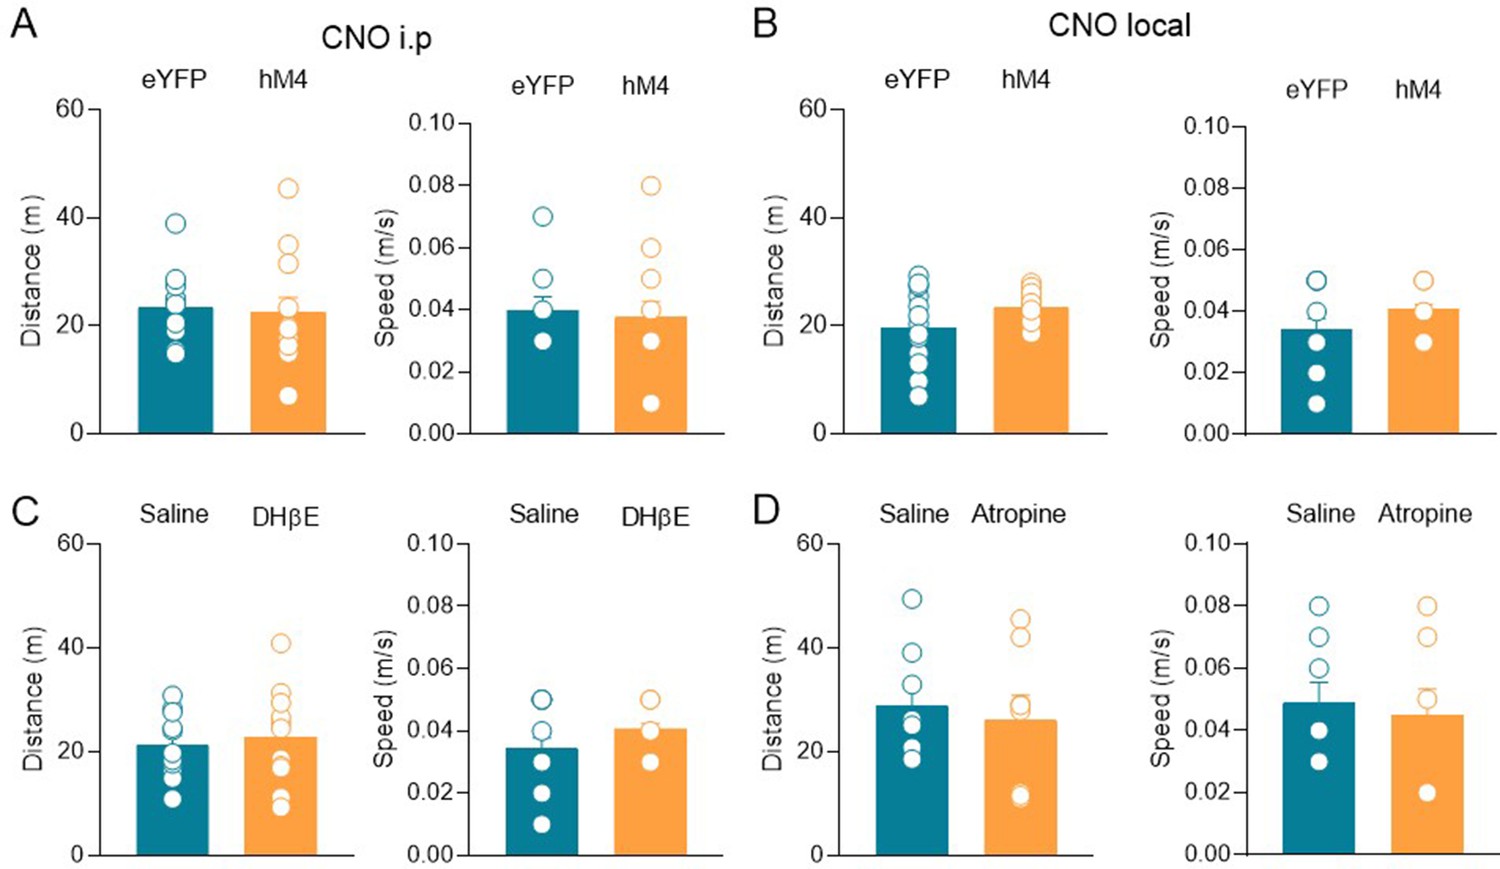
Clozapine N-oxide (CNO) or cholinergic receptor antagonists did not affect locomotor activity within the social context (three chamber).
(A) Aligned dot plots showing the distance traveled (left) and the speed (right) reached by eYFP and hM4 mice during social novelty task after receiving CNO i.p. injection (n = 12 animals/eYFP; n = 13 animals/hM4 distance: eYFP, 23.1 ± 1.9 m; hM4, 22.6 ± 2.7 m, p = 0.5; speed: eYFP, 0.04 ± 0.003 m/s; hM4, 0.04 ± 0.005 m/s, p = 0.4; Mann–Whitney test). (B) Aligned dot plots showing the distance traveled (left) and the speed (right) reached by eYFP and hM4 mice during social novelty task after receiving CNO local injection in the CA2 region (n = 12 animals/eYFP; n = 10 animals/hM4 distance: eYFP, 19.3 ± 2.4 m; hM4, 22.6 ± 0.7 m, p = 0.11; speed: eYFP, 0.03 ± 0.004 m/s; hM4, 0.04 ± 0.001 m/s, p = 0.12; Mann–Whitney test). (C) Aligned dot plots showing the distance traveled (left) and the speed (right) reached by mice during social novelty task after local injection of saline or dihydro-β-erythroidine (DHβE) in the CA2 region (n = 10 animals/saline; n = 11 animals/DHβE; distance: saline, 21.3 ± 2.1 m; DHβE, 22.8 ± 2.8 m, p = 0.70; speed: saline, 0.04 ± 0.003 m/s; DHβE, 0.04 ± 0.004 m/s, p > 0.99; Mann–Whitney test). (D) Aligned dot plots showing the distance traveled (left) and the speed (right) reached by mice during social novelty task after local injection of saline or atropine in the hippocampus (n = 8 animals/group; distance: saline, 28.8 ± 3.9 m; atropine, 26 ± 4.8 m, p = 0.80; speed: saline, 0.05 ± 0.007 m/s; atropine, 0.05 ± 0.008 m/s, p = 0.80; Mann–Whitney test). Open circles are values from single animals and bars are mean ± SEM.
Figure 7 with 2 supplements
nAChR-mediated modulation of synaptic transmission in CA2.
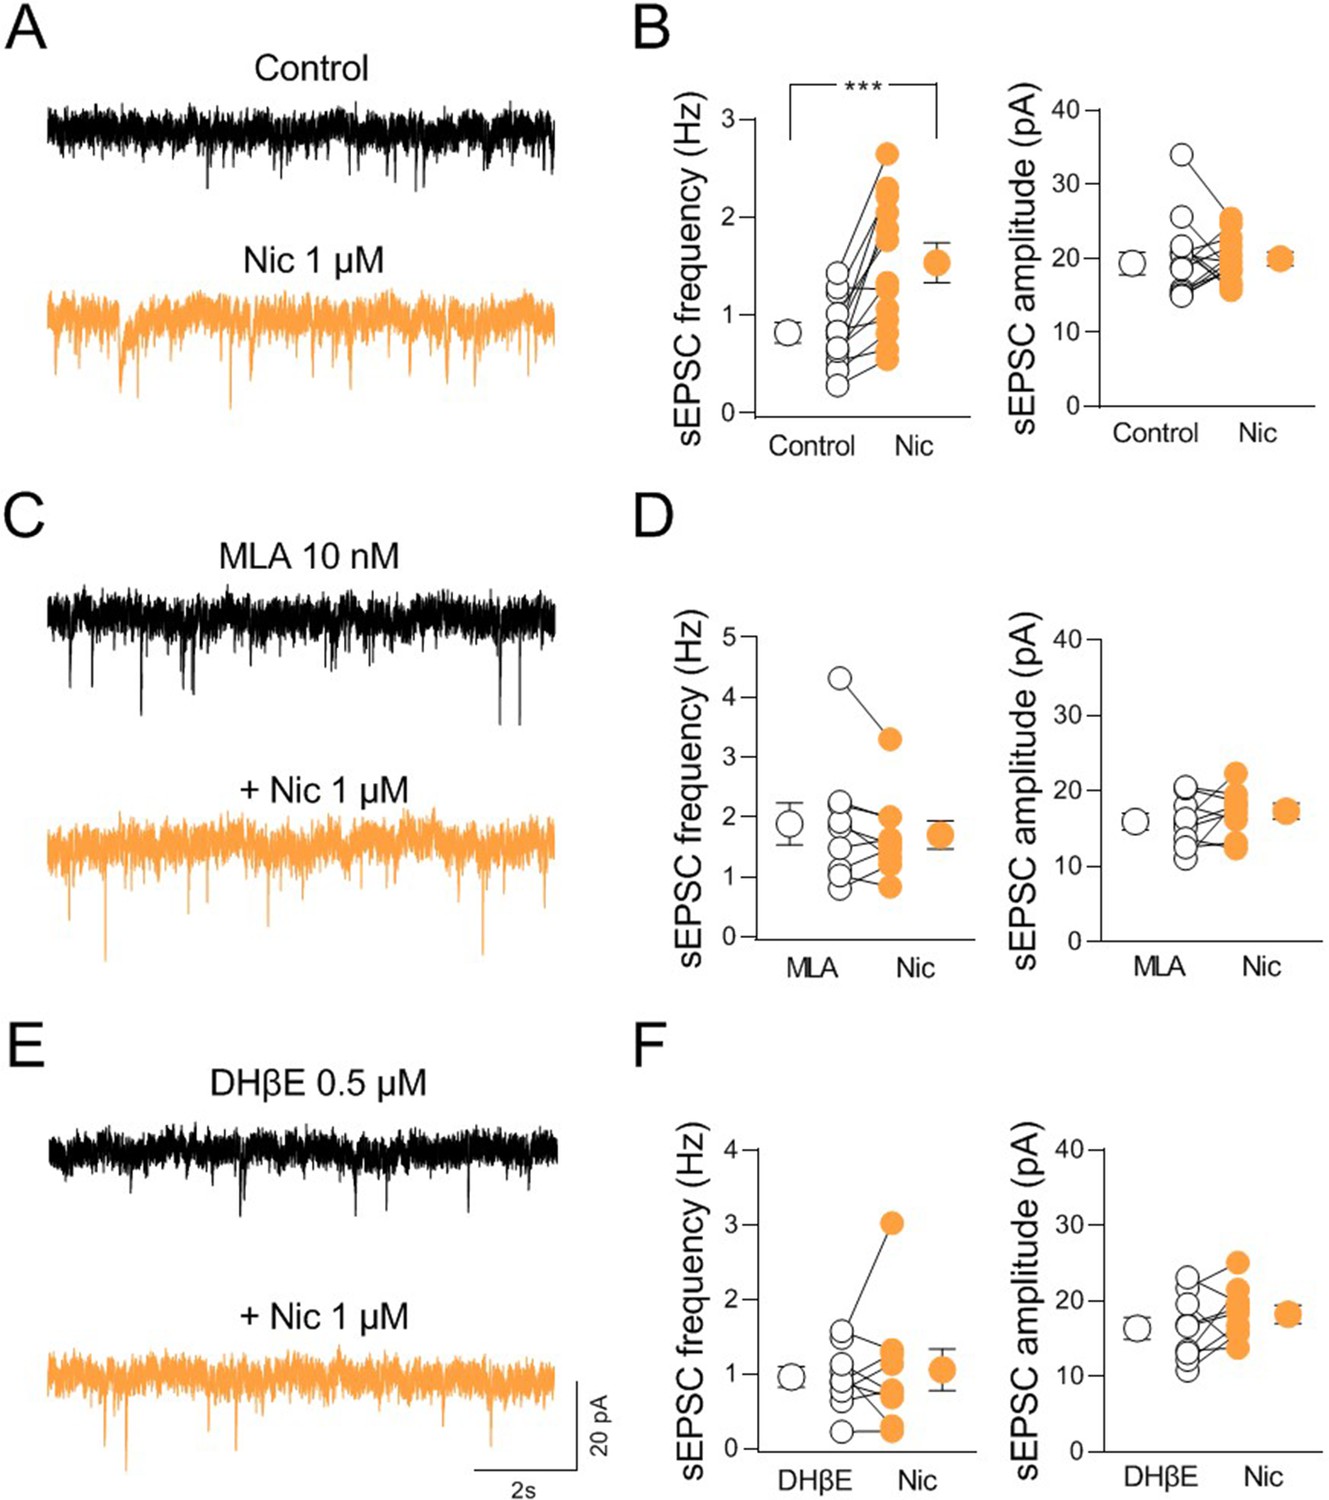
(A) Sample traces showing spontaneous excitatory postsynaptic currents (sEPSCs) of a CA2 pyramidal neuron recorded at ECl− in control (black) and in the presence of nicotine (1 μM; orange). (B) Aligned dot plots showing the mean frequency (left) and amplitude (right) of sEPSCs recorded from CA2 pyramidal neurons in control (black) and in the presence of nicotine (1 μM; orange) (n = 13 cells; frequency: control: 0.81 ± 0.1 Hz, Nic: 1.5 ± 0.2 Hz; p = 0.0005; amplitude: control: 19.9 ± 1.4 pA, Nic: 19.7 ± 0.8 pA; p = 0.76; Wilcoxon test). (C) Sample traces showing sEPSCs of a CA2 pyramidal neuron recorded at ECl− in the presence of α7 nAChR antagonist methyllycaconitine (MLA, (10 nM; black)) and in the presence of MLA plus nicotine (1 μM; orange). (D) Aligned dot plots showing the mean frequency (left) and amplitude (right) of sEPSCs recorded from CA2 pyramidal neurons in the presence of MLA (10 nM; black) and in the presence of MLA plus nicotine (1 μM; orange) (n = 9 cells; frequency: MLA: 1.9 ± 0.3 Hz, MLA+ Nic: 1.7 ± 0.2 Hz; p = 0.34; amplitude: MLA: 15.9 ± 1.1 pA, MLA+ Nic: 17.3 ± 1.0 pA; p = 0.36; Wilcoxon test). (E) Sample traces showing sEPSCs of a CA2 pyramidal neuron recorded at ECl− in the presence of non-α7 nAChR antagonist dihydro-β-erythroidine (DHβE, 0.5 μM; black) and in the presence of DHβE plus nicotine (1 μM; orange). (F) Aligned dot plots showing the mean frequency (left) and amplitude (right) of sEPSCs recorded from CA2 pyramidal neurons in the presence of DHβE (0.5 μM; black) or DHβE plus nicotine (1 μM; orange) (n = 9 cells; frequency: DHβE: 0.9 ± 0.1 Hz, DHβE + Nic: 1.05 ± 0.3 Hz; p > 0.99; amplitude: DHβE: 16.3 ± 1.5 pA, DHβE + Nic: 18.2 ± 1.2 pA; p = 0.25; Wilcoxon test). Open or closed circles represent values from single cells. Laterally located circles represent mean ± SEM. ***: p < 0.001.
-
Figure 7—source data 1
Frequency and amplitude of spontaneous excitatory postsynaptic currents .
- https://cdn.elifesciences.org/articles/65580/elife-65580-fig7-data1-v1.xlsx
Figure 7—figure supplement 1
nAChR-mediated modulation of miniature synaptic events in CA2.
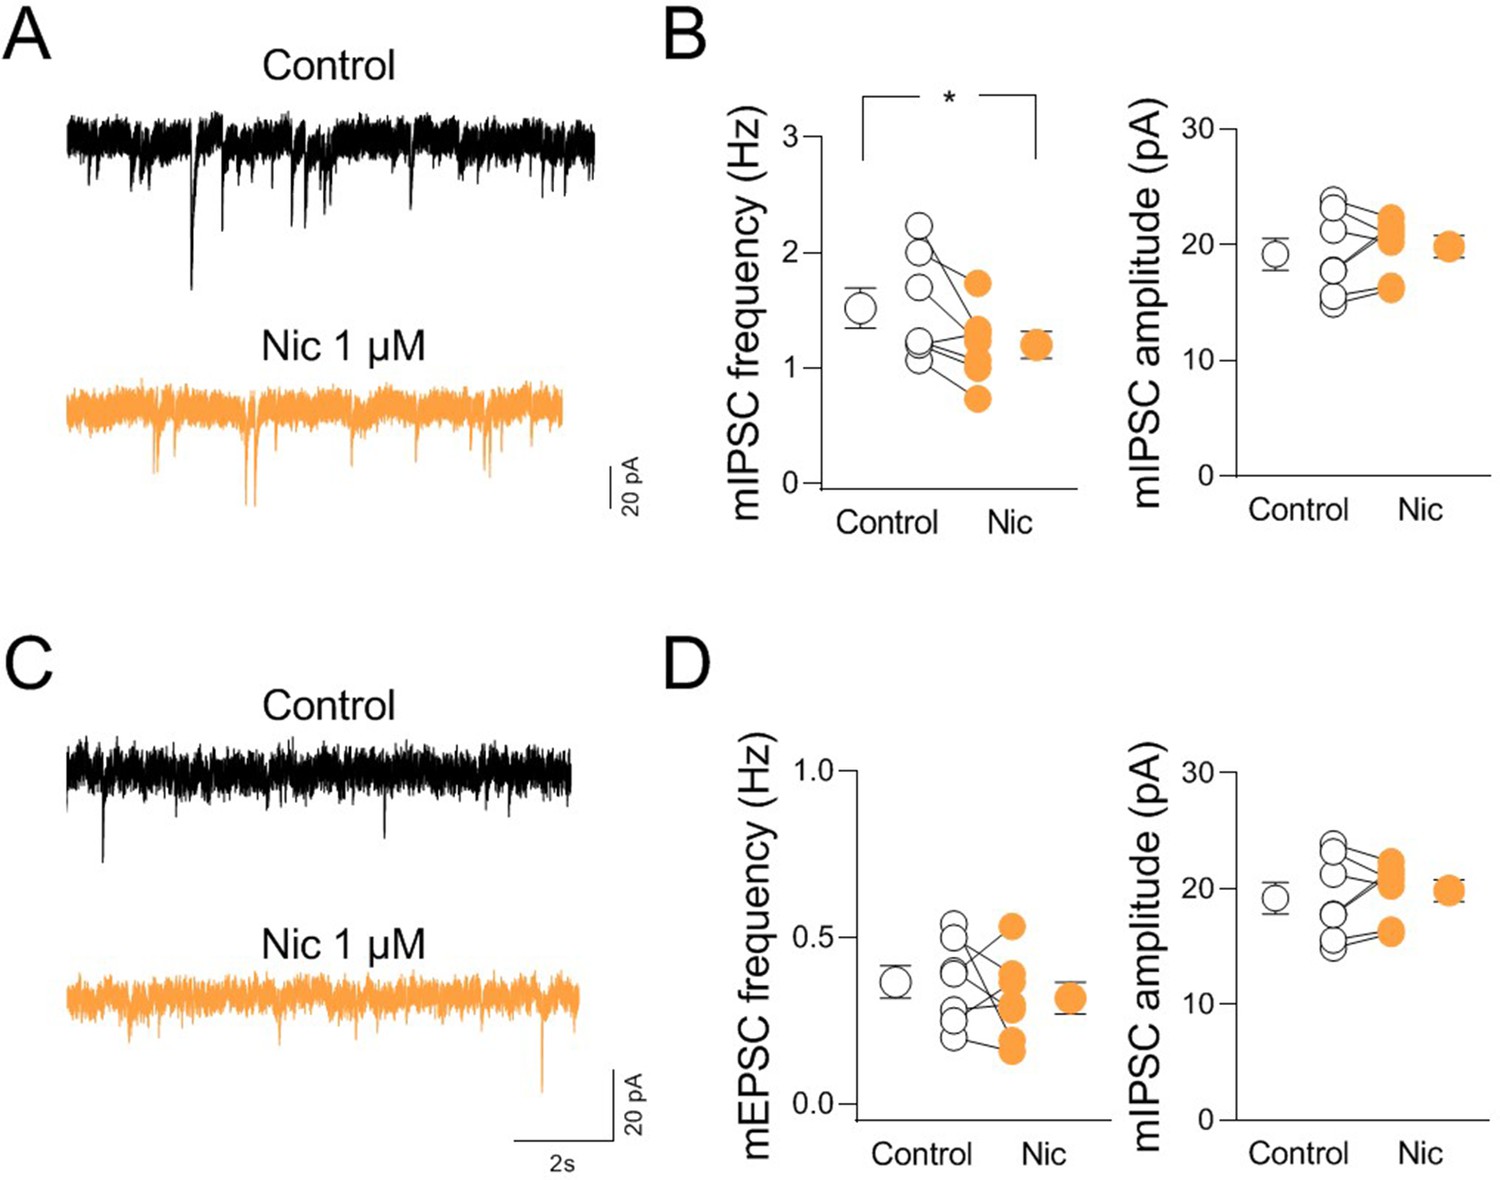
(A) Sample traces showing miniature inhibitory and excitatory postsynaptic currents (mIPSCs) from a CA2 pyramidal neuron before (black) and in the presence of nicotine (Nic 1 µM; orange). (B) Aligned dot plots showing the mean frequency (left) and amplitude (right) of mIPSC recorded from CA2 pyramidal neurons in control (black) and in the presence of nicotine (1 µM; orange) (n = 7 cells; frequency: control: 1.5 ± 0.2 Hz, Nic: 1.2 ± 0.1 Hz; p = 0.03; amplitude: control: 19.2 ± 1.4 pA, Nic: 19.8 ± 0.9 pA; p = 0.69; Wilcoxon test). (C) Sample traces showing mEPSCs from a CA2 pyramidal neuron in control (black) and in the presence of nicotine (Nic 1 µM; orange). (D) Aligned dot plots showing the mean frequency (left) and amplitude (right) of mEPSCs recorded from CA2 pyramidal neurons in control (black) and in the presence of nicotine (Nic 1 µM; orange) (n = 8 cells; frequency: control: 0.37 ± 0.05 Hz, Nic: 0.32 ± 0.05 Hz; p = 0.72; amplitude: control: 16.4 ± 0.6 pA, Nic: 16.3 ± 1.3 pA; p = 0.69; Wilcoxon test). Open or closed circles represent values from single cells. Laterally located circles represent mean ± SEM. *: p < 0.05.
Figure 7—figure supplement 2

nAChR-mediated modulation of synaptic transmission in CA3 and CA1 regions.
(A) Sample traces showing spontaneous excitatory postsynaptic currents (sEPSCs) of a CA3 pyramidal neuron in control (black) and in the presence of nicotine (1 µM; orange) recorded at ECl−. (B) Aligned dot plots showing the mean frequency (left) and amplitude (right) of sEPSCs recorded from CA3 pyramidal neurons in control (black) and in the presence of nicotine (1 µM; orange) (n = 9 cells; frequency: control: 5.3 ± 0.7 Hz, Nic: 4.1 ± 0.6 Hz; p = 0.004; amplitude: control: 27.1 ± 1.6 pA, Nic: 27.2 ± 2.2 pA; p = 0.9; Wilcoxon test). (C) Sample traces showing sEPSCs of a CA1 pyramidal neuron in control (black) and in the presence of nicotine (1 µM; orange) recorded at ECl−. (D) Aligned dot plots showing the mean frequency (left) and amplitude (right) of sEPSCs recorded from CA1 pyramidal neurons in control (black) and in the presence of nicotine (1 µM; orange) (n = 10 cells; frequency: control: 1.7 ± 0.5 Hz, Nic: 1.3 ± 0.4 Hz; p = 0.039; amplitude: control: 20.3 ± 1.3 pA, Nic: 19.4 ± 0.7 pA; p = 0.9; Wilcoxon test). Open or closed circles represent values from single cells. Laterally located circles represent mean ± SEM. *: p < 0.05; **: p < 0.01.
Figure 8 with 1 supplement
Activation of hM3-expressing cholinergic axon fibers modulates synaptic transmission in CA2 and CA3 but not CA1.
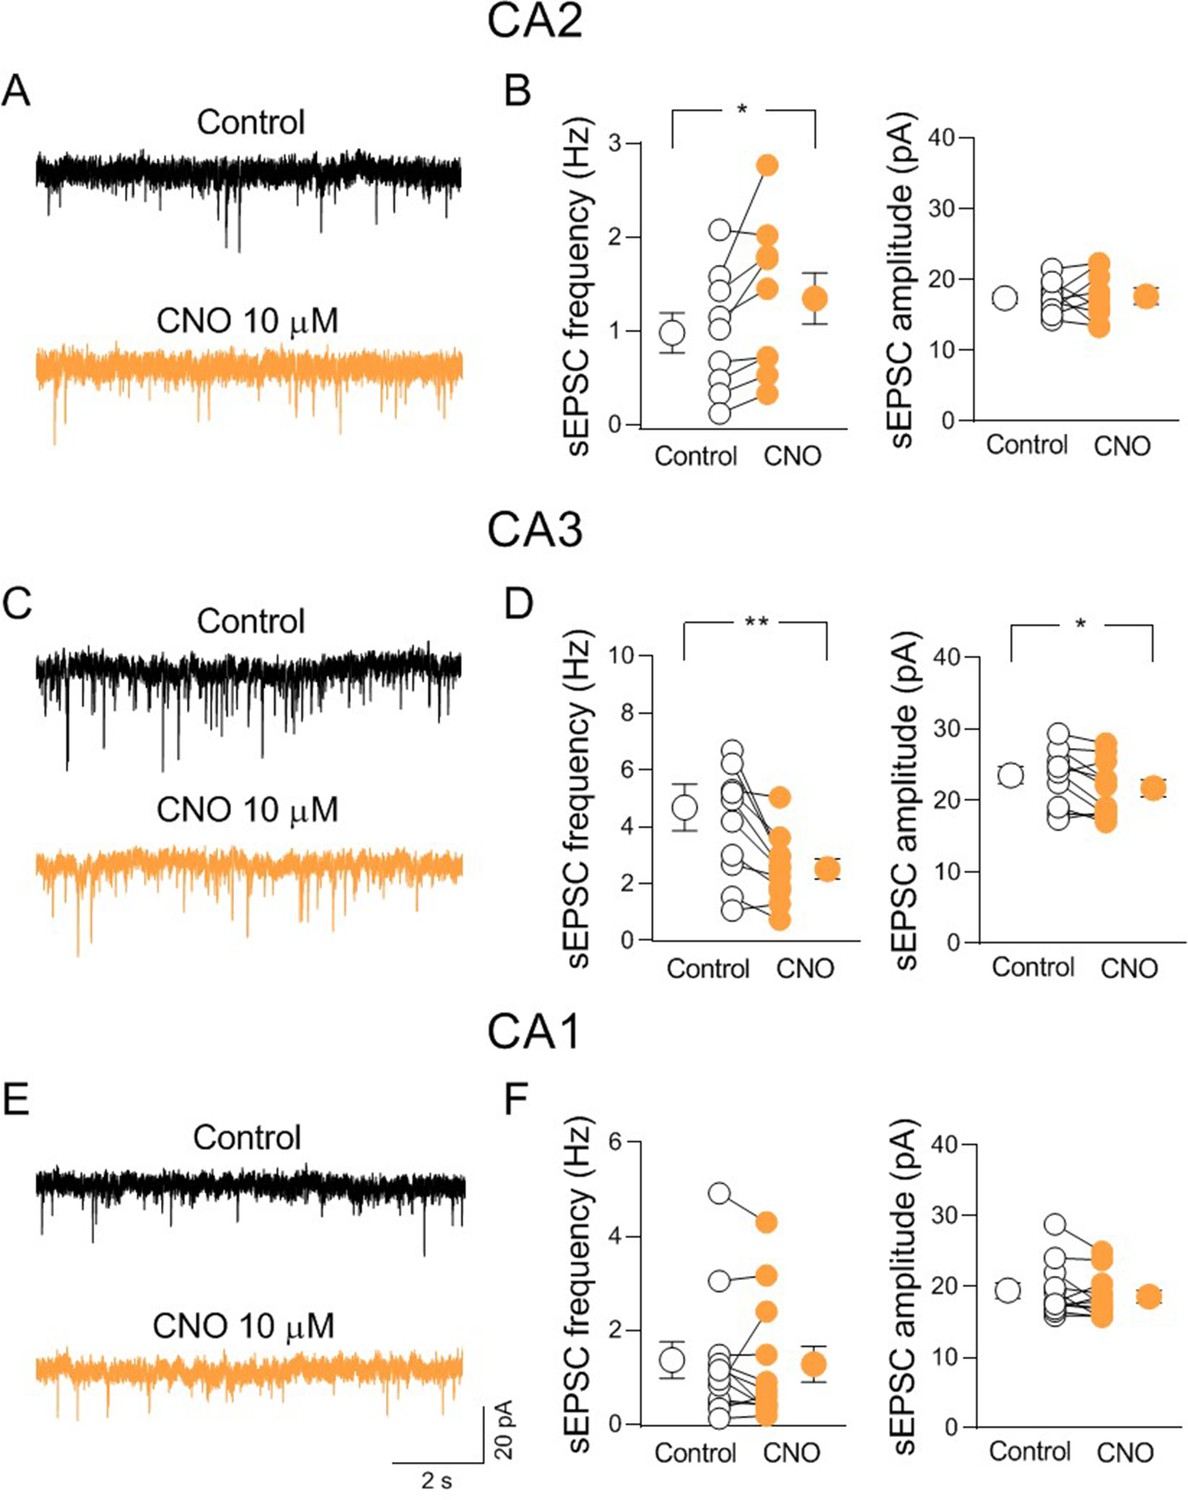
(A) Sample traces showing spontaneous excitatory postsynaptic currents (sEPSCs) of a CA2 pyramidal neuron recorded at ECl− in control (black) and in the presence of clozapine N-oxide (CNO, 10 μM; orange). (B) Aligned dot plots showing the mean frequency (left) and amplitude (right) of sEPSCs recorded from CA2 pyramidal neurons in control (black) and in the presence of CNO (10 μM; orange) (n = 8 cells; frequency: control: 0.98 ± 0.2 Hz, CNO: 1.3 ± 0.3 Hz; p = 0.02; amplitude: control: 17.7 ± 0.8 pA, CNO: 17.7 ± 1.3 pA; p = 0.94; Wilcoxon test). (C) Sample traces showing sEPSCs of a CA3 pyramidal neuron recorded at ECl− in control (black) and in the presence of CNO (10 μM; orange). (D) Aligned dot plots showing the mean frequency (left) and amplitude (right) of sEPSCs recorded from CA3 pyramidal neurons in control (black) and in the presence of CNO (10 μM; orange) (n = 11 cells; frequency: control: 4.7 ± 0.8 Hz, CNO: 2.5 ± 0.3 Hz; p = 0.002; amplitude: control: 23.6 ± 1.2 pA, CNO: 21.7 ± 1.2 pA; p = 0.03; Wilcoxon test). (E) Sample traces showing sEPSCs of a CA1 pyramidal neuron recorded at ECl− in control (black) and in the presence of CNO (10 μM; orange). (F) Aligned dot plots showing the mean frequency (left) and amplitude (right) of sEPSCs recorded from CA1 pyramidal neurons in control (black) and in the presence of CNO (10 μM; orange) (n = 12 cells; frequency: control: 1.36 ± 0.4 Hz, CNO: 1.3 ± 0.4 Hz; p = 0.35; amplitude: control: 19.4 ± 1.1 pA, CNO: 18.6 ± 0.9 pA; p = 0.2; Wilcoxon test). Open or closed circles represent values from single cells. Laterally located circles represent mean ± SEM. *: p < 0.05; **: p < 0.01.
-
Figure 8—source data 1
Frequency and amplitude of spontaneous excitatory postsynaptic currents.
- https://cdn.elifesciences.org/articles/65580/elife-65580-fig8-data1-v1.xlsx
Figure 8—figure supplement 1
Clozapine N-oxide (CNO) application enhances the spontaneous firing of hM3-expressing ChAT+ neurons in the medial septum/diagonal band of Broca (MSDB).
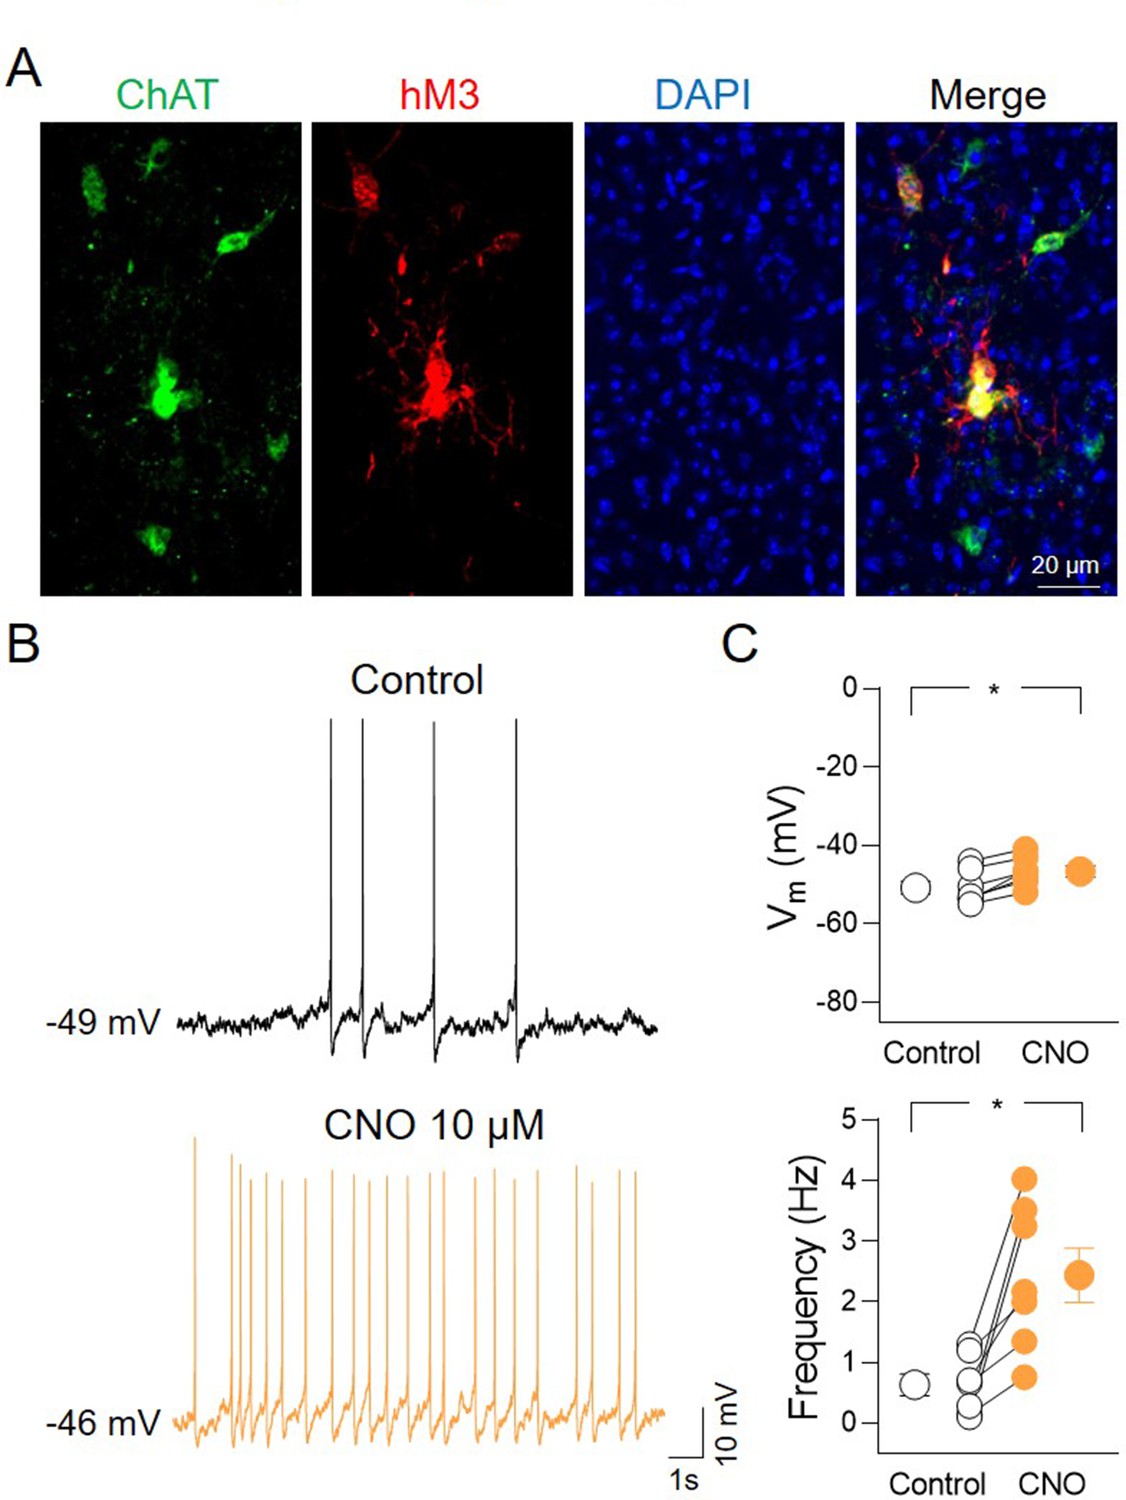
(A) Confocal fluorescent images illustrating (from left to right): ChAT immunostaining, hM3-mCherry, nuclear-staining DAPI, and merge image of MSDB neurons. (B) Sample traces showing spontaneous firing of ChAT+ neurons expressing hM3 in the MSDB in control (black) and in the presence of CNO (10 µM; orange). (C) Aligned dot plots showing Vm (top) and spontaneous firing frequency (bottom) in control (black) and in the presence of CNO (10 µM; orange) (n = 7 cells; Vm: control, −50.7 ± 1.6 mV; CNO, −46.6 ± 1.4 mV; p = 0.016; frequency: control, 0.63 ± 0.2 Hz; CNO, 2.44 ± 0.4 Hz; p = 0.016, Wilcoxon test). Open and closed circles represent values from single cells. Laterally located circles represent average± SEM. *: p < 0.05.
Figure 9 with 2 supplements
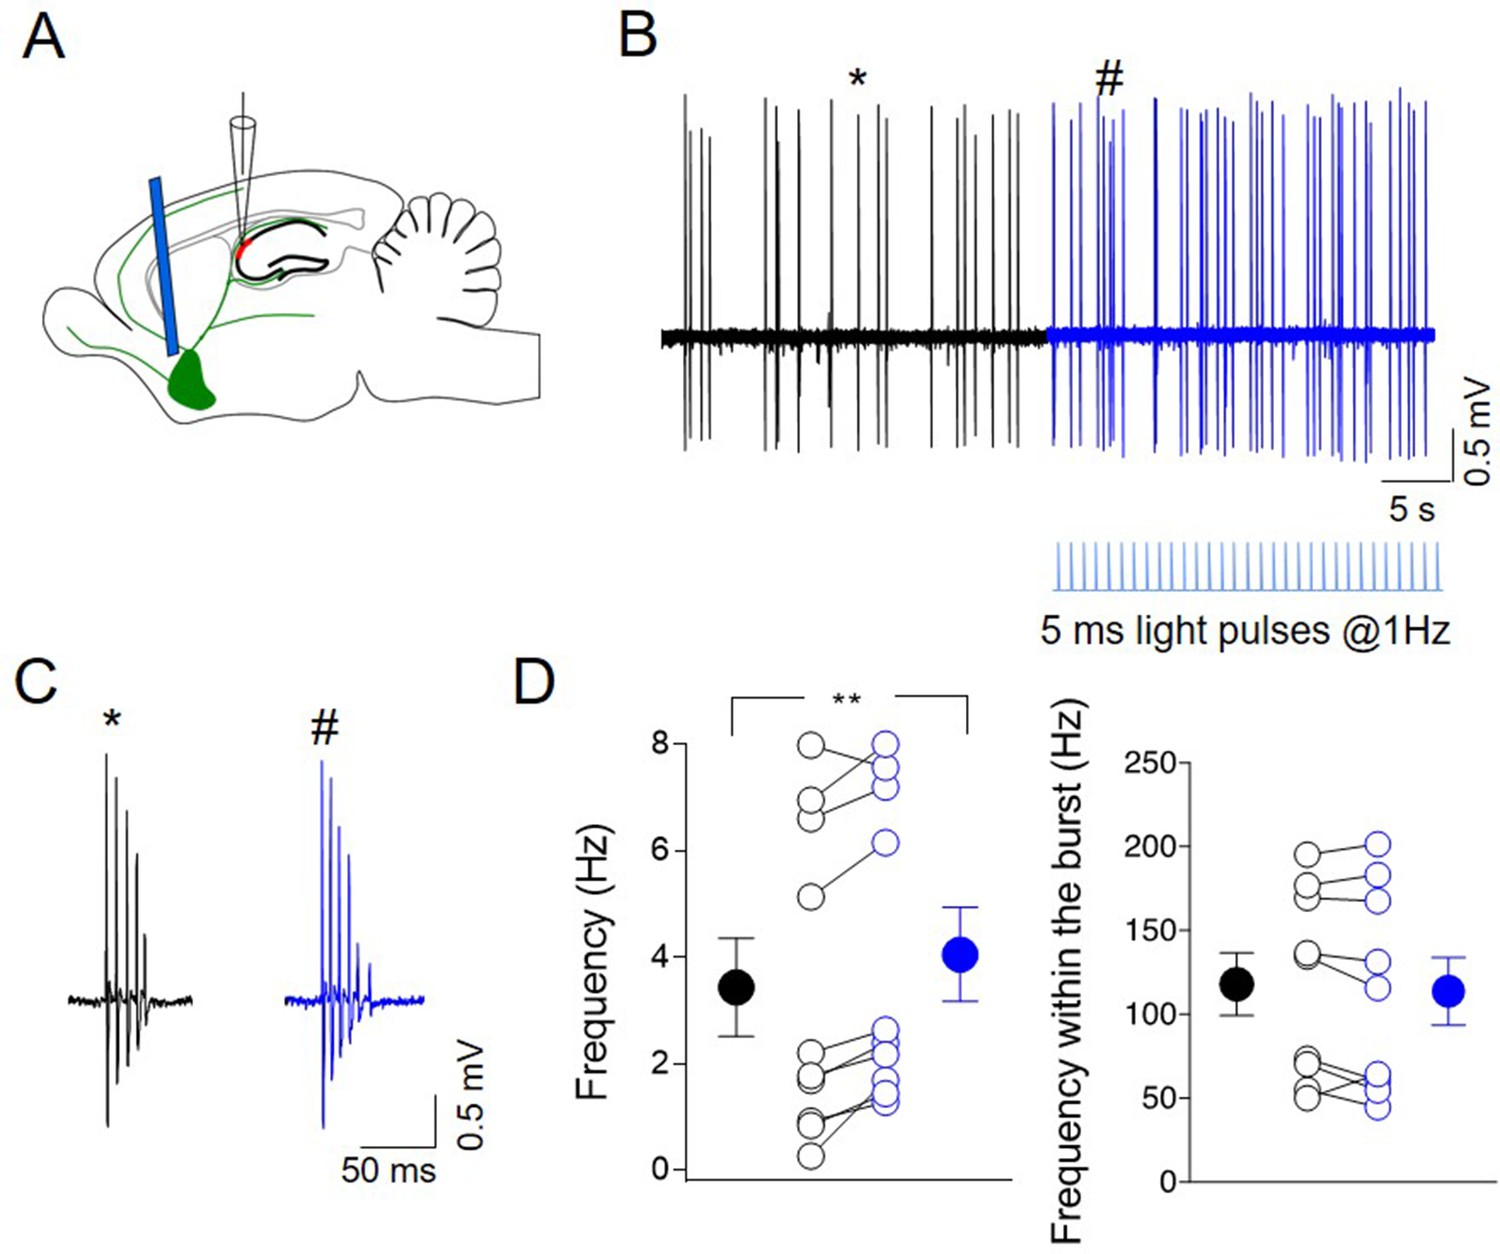
Photoactivation of ChAT+ neurons in medial septum/diagonal band of Broca (MSDB) controls CA2 output.
(A) Schematic illustration showing the experimental settings of in vivo juxtacellular recordings combined with light stimulation of MSDB ChAT+ neurons expressing channelrhodopsin (ChR2). (B) Representative trace showing spontaneous firing from a CA2 bursting neuron in control (black) and during ChR2 activation (blue) via light pulses (below the trace). (C) Individual bursts in (B) (asterisk and hashtag for control and light activation, respectively) shown on an expanded time scale. (D) Left: aligned dot plot showing the frequency of spikes in control (black) and during light activation of ChAT+ neurons in the MSDB (blue) (n = 9 cells; control: 3.62 ± 1.0 Hz; light: 4.26 ± 0.97 Hz; p = 0.012, Wilcoxon test); right: aligned dot plot showing the frequency of spikes within the bursts in control and during light activation of ChAT+ neurons in the MSDB (n = 9 cells; control: 118 ± 19 Hz; light: 114 ± 20 Hz; p = 0.36, Wilcoxon test). Open circles represent values from single cells. Closed circles represent mean ± SEM. **: p = 0.01.
-
Figure 9—source data 1
Spike analysis.
- https://cdn.elifesciences.org/articles/65580/elife-65580-fig9-data1-v1.xlsx
Figure 9—figure supplement 1
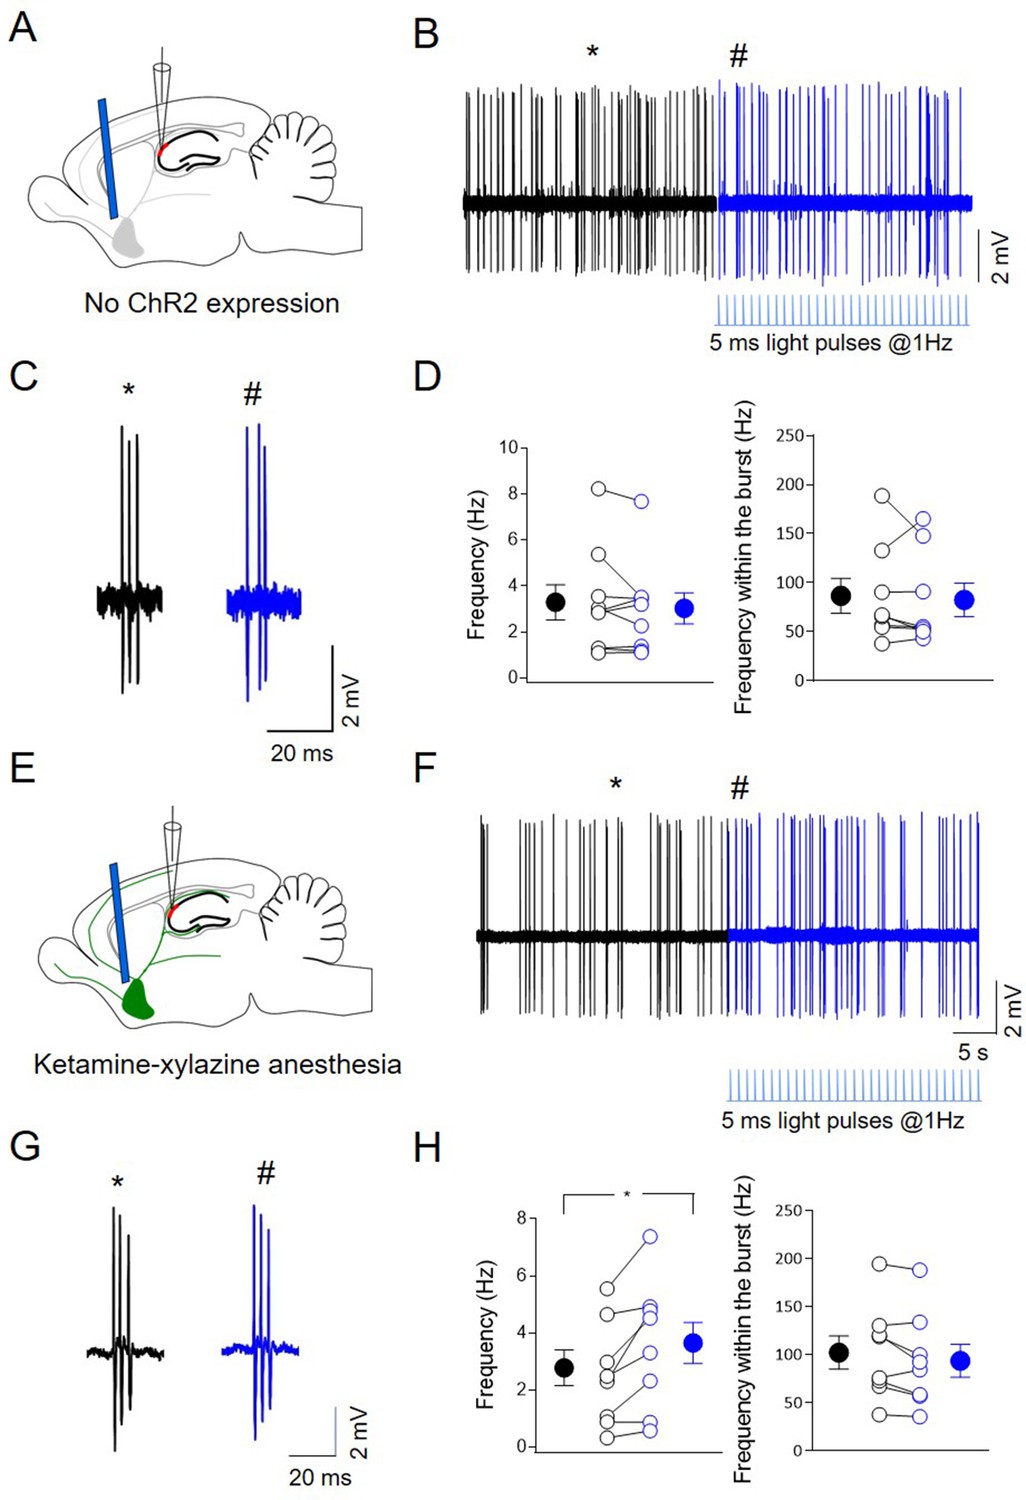
Light delivery in MSDB combined with CA2 recordings in not injected or ChR2-expressing mice under ketamine–xylazine anesthesia.
(A) Schematic illustration showing the experimental settings of in vivo juxtacellular recordings in animals not expressing channelrhodopsin (ChR2) combined with light delivery in the medial septum/diagonal band of Broca (MSDB). (B) Representative trace showing spontaneous firing from a CA2 bursting neuron in control (black) and during light delivery (blue; below the trace). (C) Individual bursts in (B) (asterisk and hashtag for control and light activation, respectively) shown on an expanded time scale. (D) Left: aligned dot plot showing the frequency of spikes in control (black) and during light delivery in the MSDB (blue) (n = 9 cells; control: 3.3 ± 0.8 Hz; light: 3.03 ± 0.7 Hz; p = 0.38, Wilcoxon test). Right: aligned dot plot showing the frequency of the spikes within the bursts in control and during light delivery in the MSDB (n = 9 cells; control: 86.6 ± 18 Hz; light: 82.4 ± 17 Hz; p = 0.46; Wilcoxon test). (E) Schematic illustration showing the experimental settings of in vivo juxtacellular recordings combined with light stimulation of MSDB ChAT+ neurons expressing channelrhodopsin (ChR2) under ketamine–xylazine anesthesia. (F) Representative trace showing spontaneous firing from a CA2 bursting neuron in control (black) and during ChR2 activation (blue) via light pulses (below the trace). (G) Individual bursts in (F) (asterisk and hashtag for control and light activation, respectively) shown on an expanded time scale. (H) Left: aligned dot plot showing the frequency of spikes in control (black) and during light activation of ChAT+ neurons in the MSDB (blue) (n = 8 cells; control: 2.53 ± 0.7 Hz; light: 3.58 ± 0.8 Hz; p = 0.016, Wilcoxon test). Right: aligned dot plot showing the frequency of the spikes within the bursts in control and during light delivery in the MSDB (n = 8 cells; control: 102 ± 17 Hz; light: 93.4 ± 17 Hz; p = 0.11; Wilcoxon test). Open circles represent values from single cells. Closed circles represent mean ± SEM. *: p < 0.05.
Figure 9—figure supplement 2
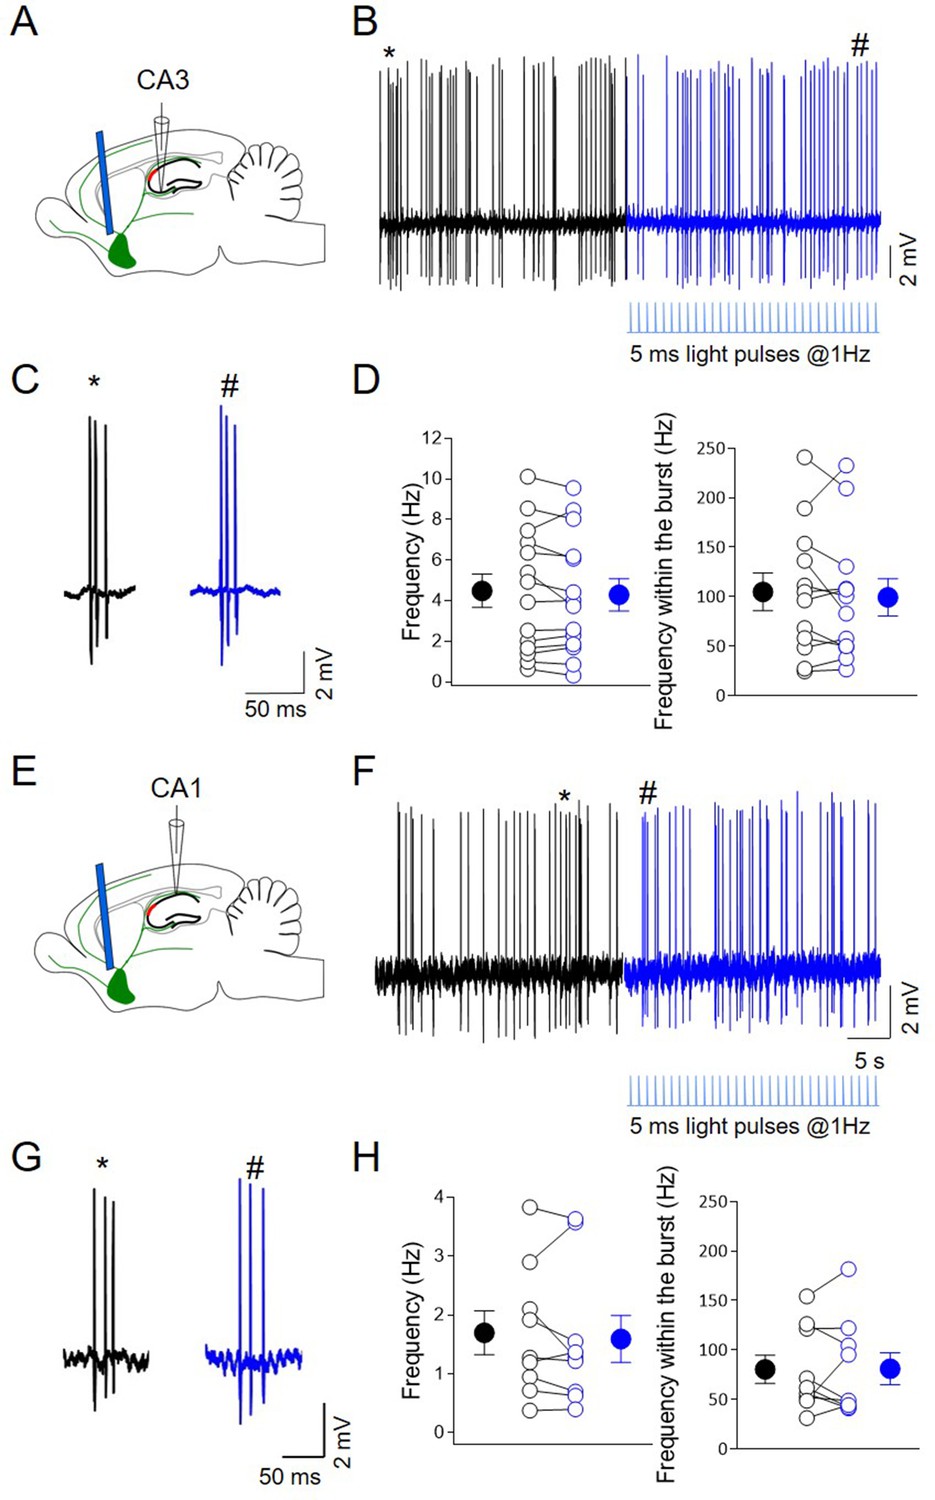
Photoactivation of ChAT+ neurons in MSDB does not affect CA3 and CA1 output.
(A) Schematic illustration showing the experimental settings of in vivo juxtacellular recordings from CA3 region combined with light stimulation of medial septum/diagonal band of Broca (MSDB) ChAT+ neurons expressing channelrhodopsin (ChR2). (B) Representative trace showing spontaneous firing from a CA3 bursting neuron in control (black) and during light delivery (blue; below the traces). (C) Individual bursts in (B) (asterisk and hashtag for control and light activation, respectively) shown on an expanded time scale. (D) Left: aligned dot plot showing the frequency of spikes in control (black) and during light activation of ChAT+ neurons in the MSDB (blue) (n = 14 cells; control: 4.5 ± 0.82 Hz; light: 4.3 ± 0.8 Hz; p = 0.24; Wilcoxon test). Right: aligned dot plot showing the frequency of spikes within the bursts in control and during light delivery in the MSDB (n = 14 cells; control: 105 ± 19 Hz; light: 99.4 ± 19 Hz; p = 0.52; Wilcoxon test). (E) Schematic illustration showing the experimental settings of in vivo juxtacellular recordings from CA1 region combined with light stimulation of MSDB ChAT+ neurons expressing channelrhodopsin (ChR2). (F) Representative trace showing spontaneous firing from a CA1 bursting neuron in control (black) and during light delivery (blue; below the traces). (G) Individual bursts in (F) (asterisk and hashtag for control and light activation, respectively) shown on an expanded time scale. (H) Left: aligned dot plot showing the frequency of spikes in control (black) and during light activation of ChAT+ neurons in the MSDB (blue) (n = 9 cells; control: 1.7 ± 0.4 Hz; light: 1.59 ± 0.4 Hz; p = 0.3; Wilcoxon test). Right: aligned dot plot showing the frequency of spikes within the bursts in control and during light delivery in the MSDB (n = 9 cells; control: 80.4 ± 14 Hz; light: 81 ± 16 Hz; p = 0.91; Wilcoxon test). Open circles represent values from single cells. Closed circles represent mean ± SEM.
Additional files
Download links
A two-part list of links to download the article, or parts of the article, in various formats.
Downloads (link to download the article as PDF)
Open citations (links to open the citations from this article in various online reference manager services)
Cite this article (links to download the citations from this article in formats compatible with various reference manager tools)
Septal cholinergic input to CA2 hippocampal region controls social novelty discrimination via nicotinic receptor-mediated disinhibition
eLife 10:e65580.
https://doi.org/10.7554/eLife.65580


