Predominantly linear summation of metabotropic postsynaptic potentials follows coactivation of neurogliaform interneurons
- MTA-SZTE Research Group for Cortical Microcircuits of the Hungarian Academy of Sciences,, Department of Physiology, Anatomy and Neuroscience, University of Szeged, Hungary
Figures
Figure 1 with 1 supplement
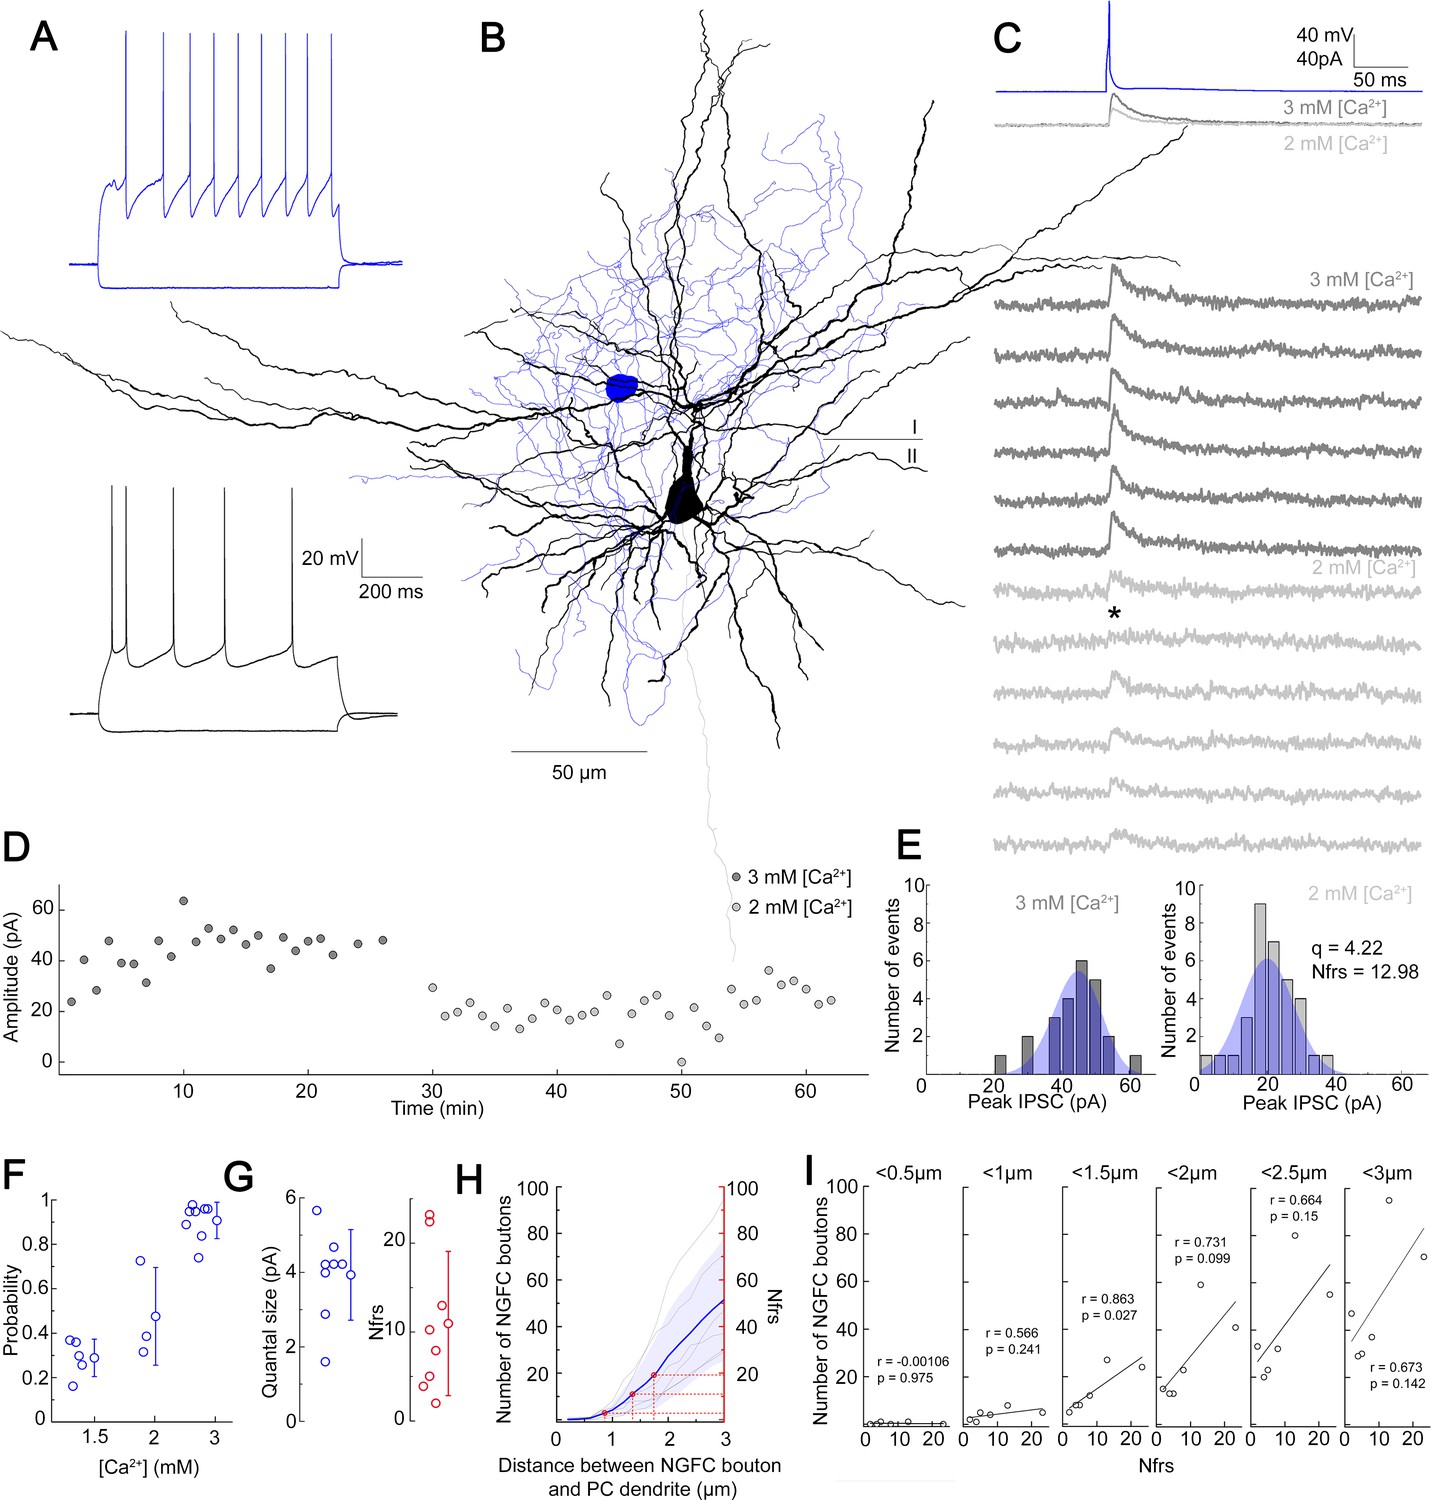
Quantal and structural characteristics of GABAergic connections established by individual neurogliaform cells (NGFCs).
(A–E) Quantal and structural properties of a neurogliaform to pyramidal cell (PC) connection. (A) Firing patterns of the presynaptic L1 NGFC (blue) and postsynaptic L2/3 PC (black). (B) Three-dimensional anatomical reconstruction of a recorded L1 NGFC (soma and axon blue) and L2/3 PC (soma and dendrites black, axon gray). Horizontal line indicates the border of layer 1 (I) and layer 2 (II). (C) Presynaptic action potentials of the L1 NGFC (top, blue) elicited of unitary induced pluripotent stem cells (IPSCs) in the postsynaptic L2/3 PC at −50 mV holding potential in different Ca2+ concentrations (middle, dark gray: 3 mM Ca2+, 1.5 mM Mg2+, light gray: 2 mM Ca2+, 2 mM Mg2+). Bottom: Representative consecutive traces of elicited unitary IPSCs. Asterisk marks synaptic transmission failure. (D) Single IPSC peak amplitudes recorded in high (3 mM Ca2+, 1.5 mM Mg2+, dark gray) and low release probability conditions (2 mM Ca2+, 2 mM Mg2+, light gray), respectively. (E) Distribution of IPSC peak amplitudes in 3 mM Ca2+, 1.5 mM Mg2+ (left) and 2 mM Ca2+, 2 mM Mg2+ (right), with projected binomial fits (blue). (F) Estimated release probability values in different experimental conditions (n = 8). (G) Estimated quantal size (3.93 ± 1.22 pA) and number of functional release sites (Nfrs; 10.96 ± 8.1) derived from Bayesian quantal analysis in each experiment (n = 8). (H) Number of NGFC boutons in the proximity of postsynaptic PC dendrites from anatomical reconstructions of connected NGFC to PC pairs (n = 8; gray, individual pairs; blue, average, and SD). For comparison, red lines indicate mean ± SD of Nfrs shown on panel F corresponding to distances between presynaptic NGFC boutons and PC dendrites. (I) Number of NGFC boutons counted at increasing distances from PC dendrites in NGFC to PC pairs. Correlation to Nfrs in the same pairs is best when counting boutons closer than 1.5 µm from PC dendrites.
Figure 1—figure supplement 1
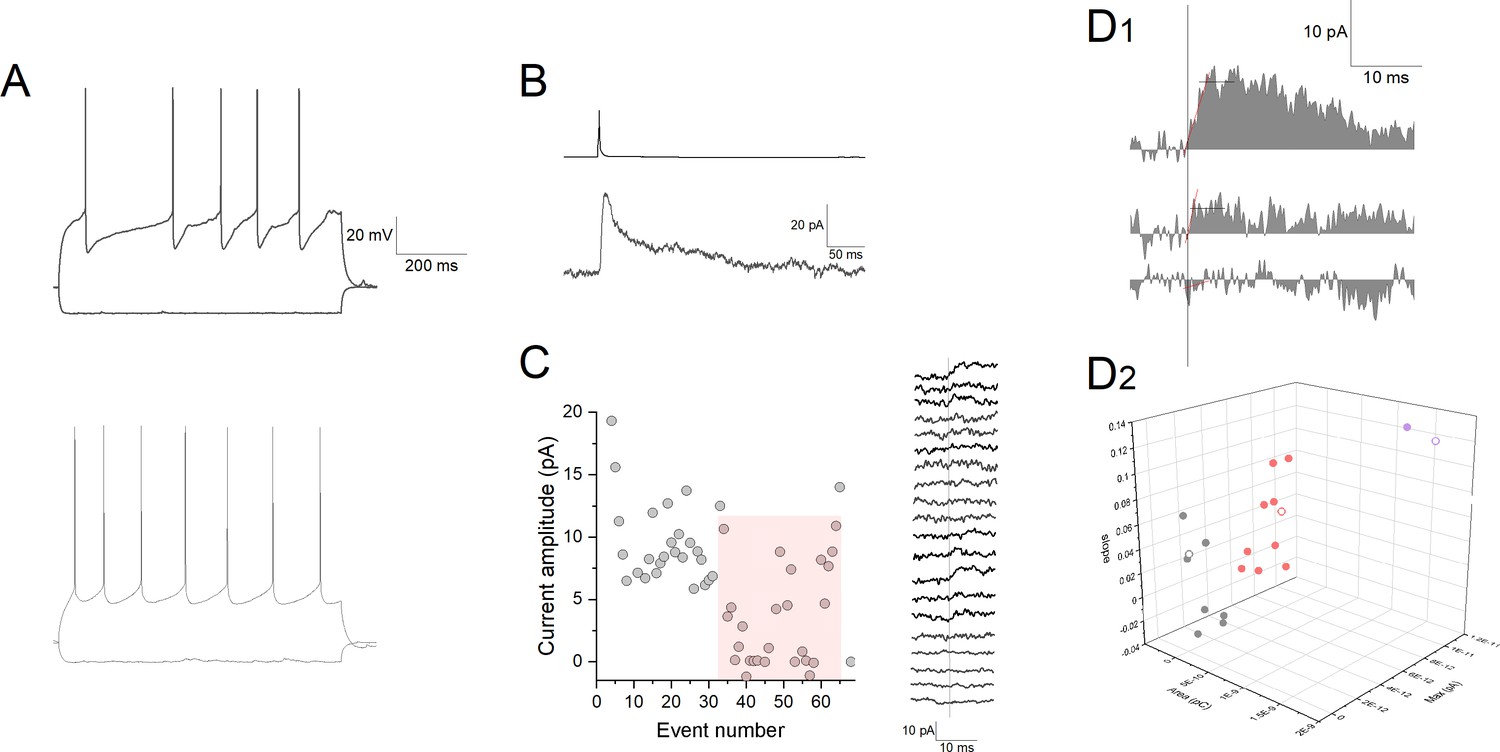
A representative single experiment for quantal amplitude measurement during low release probability.
(A) Firing patterns of a presynaptic neurogliaform cell (top) and postsynaptic pyramidal cell (bottom). (B) Action potential in the neurogliaform cell (top trace) triggers an inhibitory postsynaptic current in the postsynaptic cell (bottom trace). Extracellular solution contained 40 μM CGP 35348 and 10 μM NBQX (2,3-dioxo-6-nitro-1,2,3,4-tetrahydrobenzo[f]quinoxaline-7-sulfonamide) throughout the experiment. Stimulation interval was 60 s. (C) Left: Amplitudes of postsynaptic currents during application of low Ca2+ (1 mM) containing extracellular solution. Stimulation interval was 60 s. Red shading highlights the responses used for determining single quantum release. Right: Sequence of consecutive current traces from event number 34. (D1) Sample traces of postsynaptic currents in 1 mM [Ca2+] extracellular solution. Vertical line denotes onset, horizontal line shows amplitude measured as average within a 5 ms time window, red line shows linear fit for determining onset slope. (D2) Individual trials are shown on a 3D plot of area, amplitude, and slope. Gray, red, and purple data points correspond to grouping with K-means cluster analysis for failures, uniquantal, and multiquantal events, respectively. Each point refers to a unitary inhibitory postsynaptic potential (IPSP) or failure shown by the traces on panel C, open symbols show data corresponding current traces shown on panel D1.
Figure 2 with 1 supplement
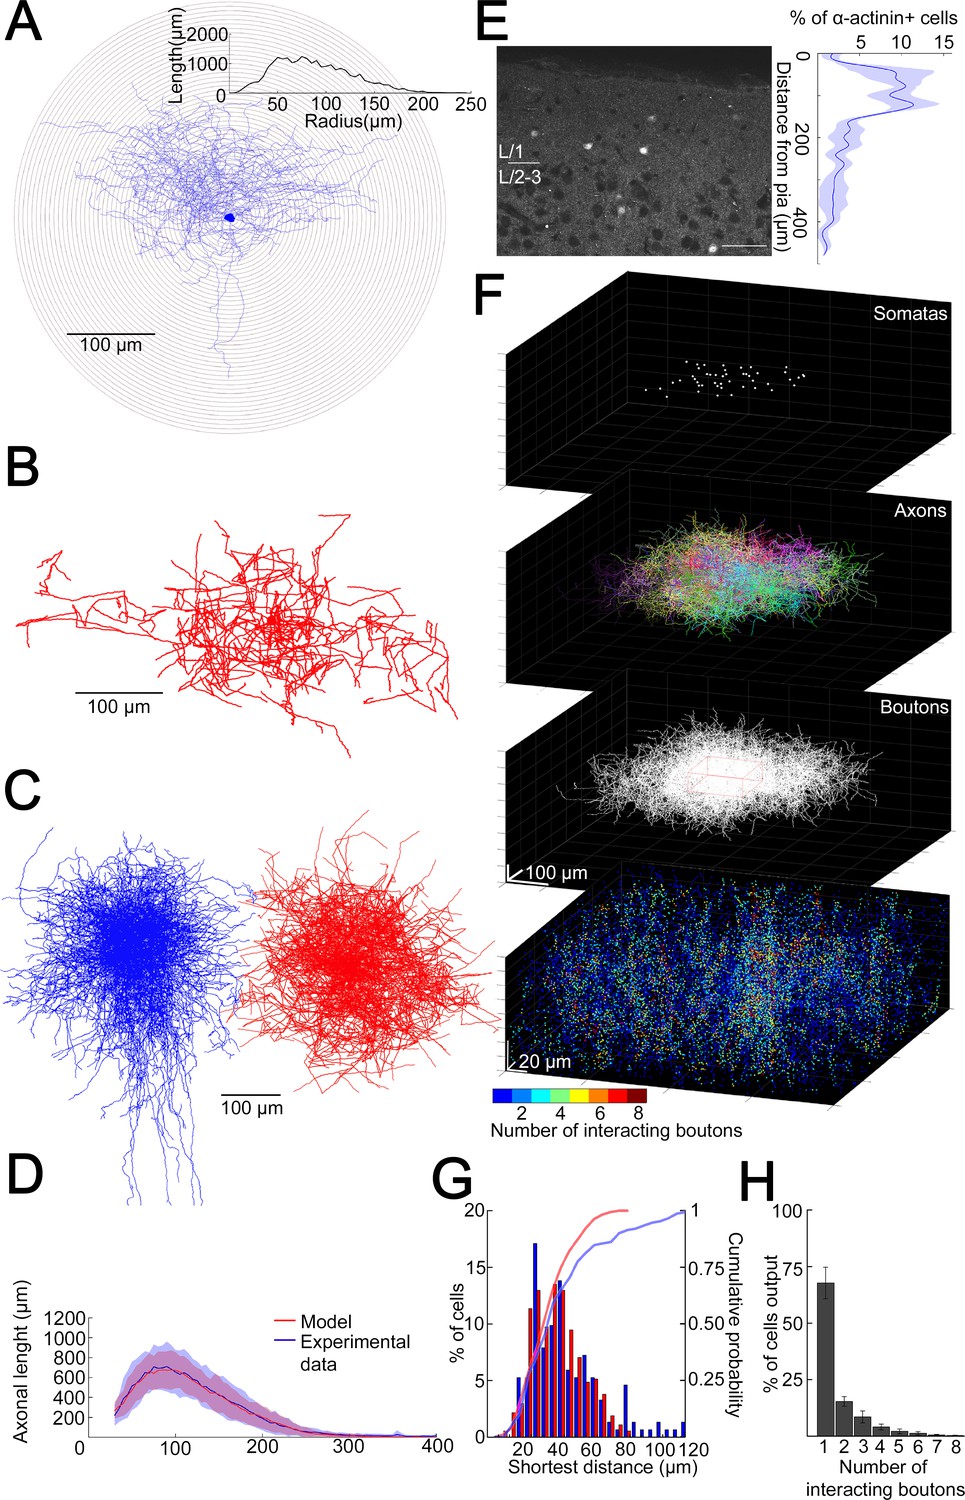
Structural characteristics of collective GABAergic output formed by the population of layer 1 neurogliaform cells (NGFCs).
(A) Sholl analysis on the axonal arborization of an individual NGFC. Inset, axonal lengths measured in concentric shells of increasing radius (step, 10 µm). (B) Three-dimensional arborization of a model generated axon. (C) Superimposition of three-dimensionally reconstructed axonal arborizations of NGFCs (n = 16, blue) and the computer generated model NGFCs (n = 16, red) aligned at the center of somata. (D) Comparison of manually reconstructed axonal arborizations of NGFCs (n = 16; blue, mean; light blue, SD) and model generated axons (n = 52; red, mean; light red, SD). (E) Left: α-Actinin2 immunohistochemistry in supragranular layers of the neocortex (scale bar, 100 µm). Right: Distribution of α-actinin2 immunopositive somata. (F) Top: Three-dimensional model of NGFCs somata, axonal arborizations, and bouton distributions in a 354 × 354 × 140 µm3 volume. Bottom: heat map showing the number of axonal boutons interacting at distances of <1.5 µm. (G) Distribution of the shortest distance between somata in the model (red) and in α-actinin2 immunohistochemistry experiments (blue). (H) Percentage distribution of the number of interacting boutons within 1.5 µm distance from each NGFC.
Figure 2—figure supplement 1
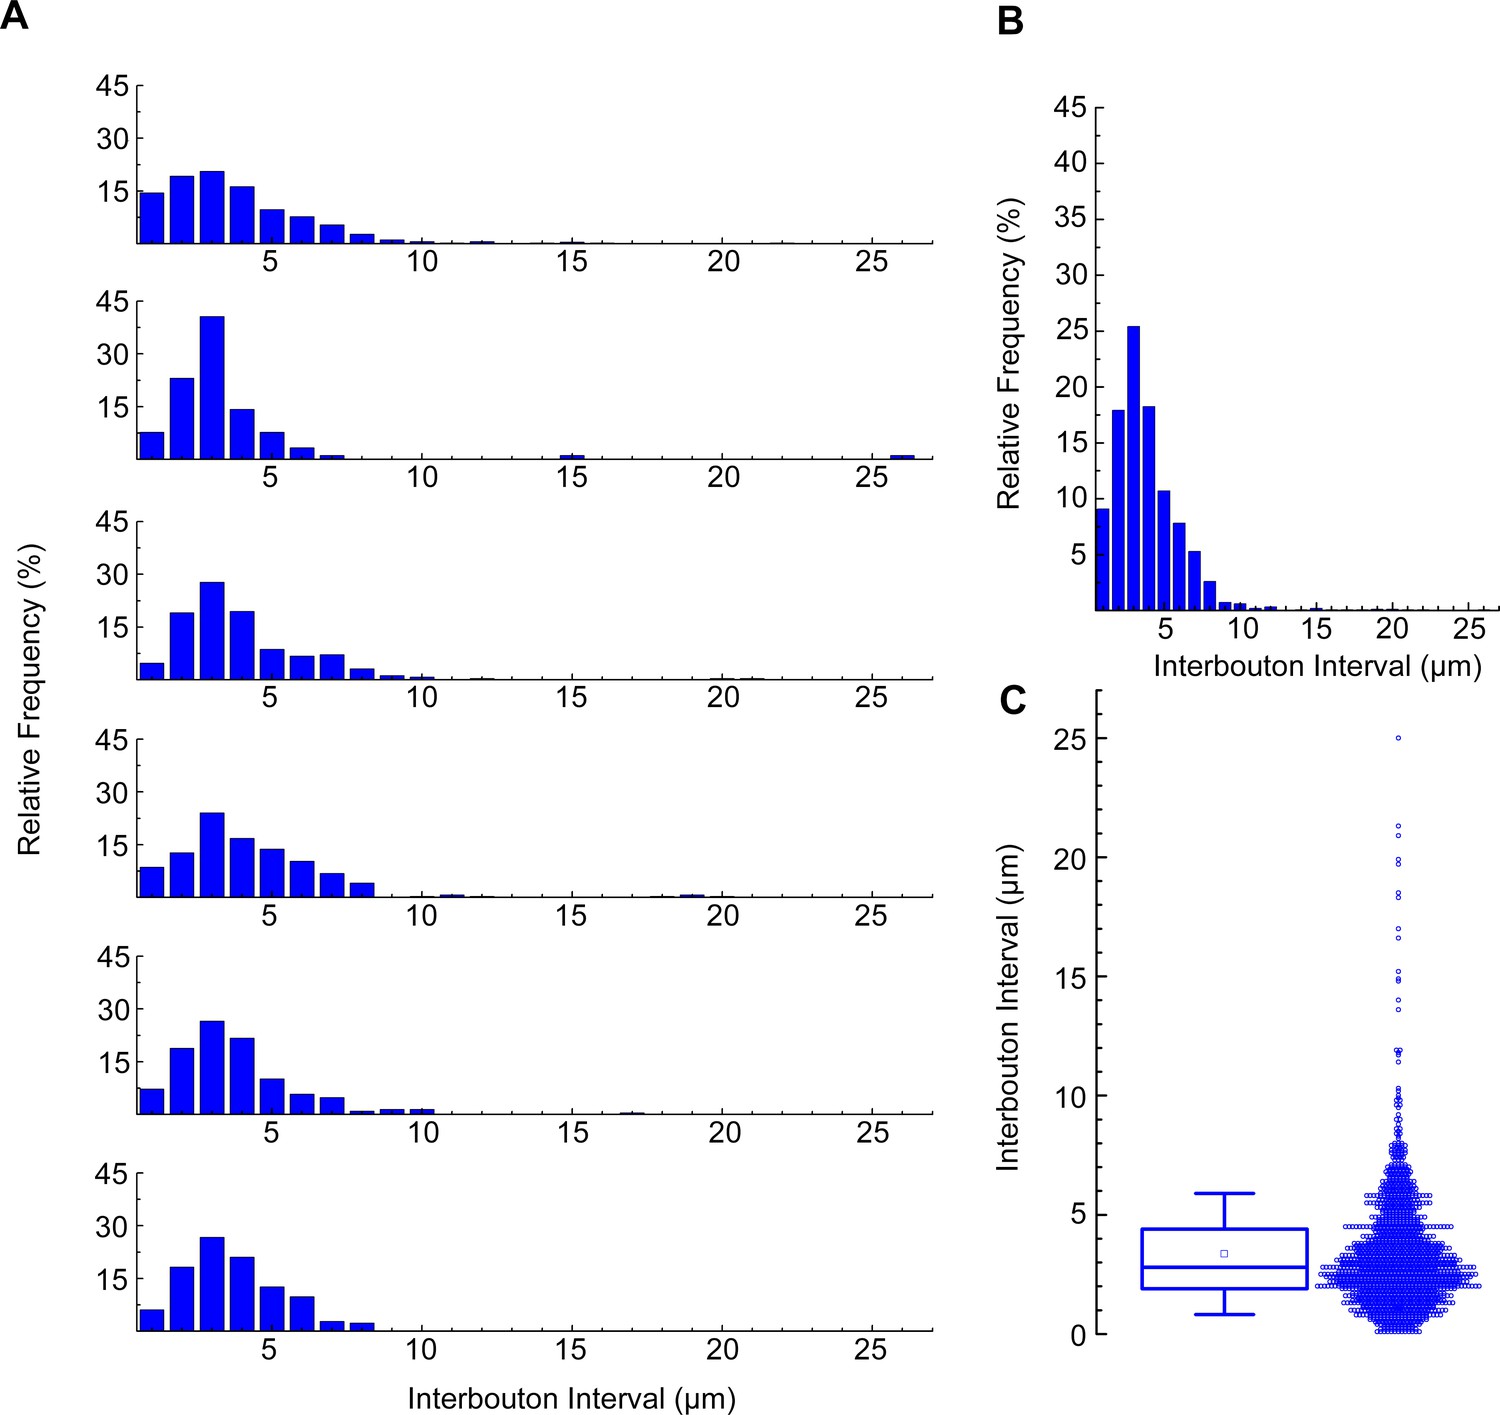
Calculation of neurogliaform cells (NGFCs) interbouton interval.
(A) Distribution of interbouton distances from six NGFCs (number of boutons from each morphological analysis were n=442,91,213,252,291,207). The axonal segments were randomly selected (bin size = 1 µm). (B) Average distribution of interbouton intervals in all NGFCs (bin size = 1 µm). (C) Boxplot shows the mean ± SD (3.357±2.535; n=1495) of all NGFCs’ interbouton interval. For interbouton distance measurement only clearly visible boutons were marked alongside the NGFC processes, the outlier values were not excluded.
Figure 3 with 1 supplement
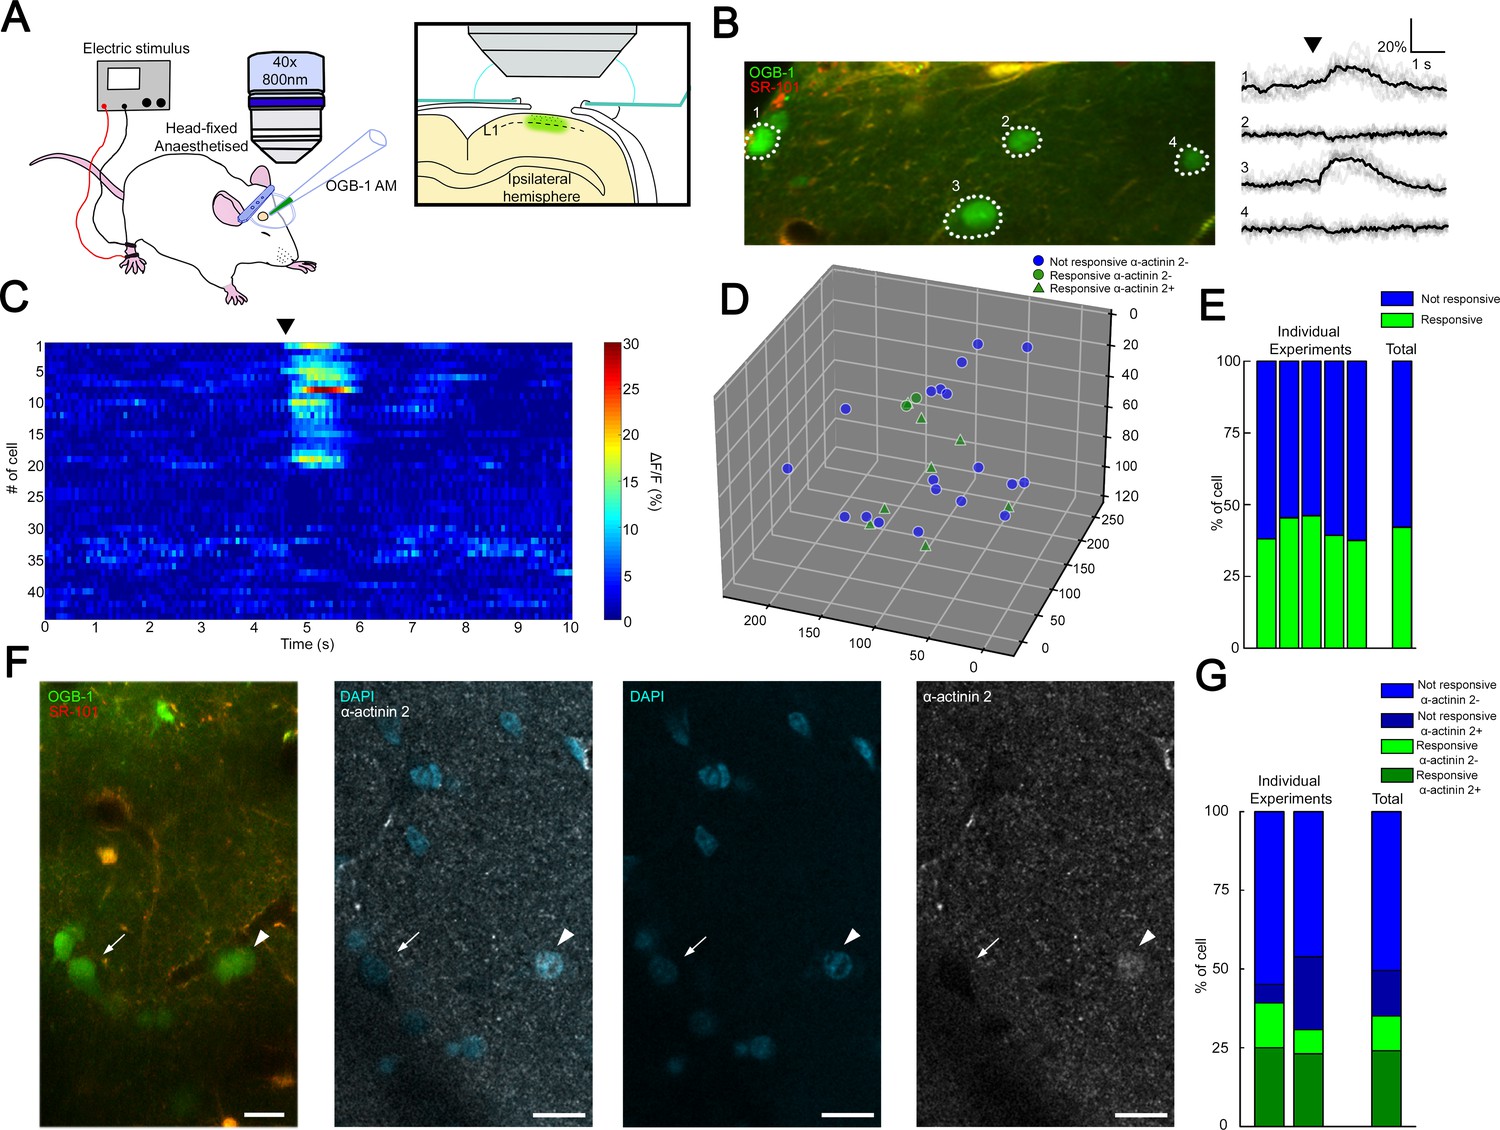
Coactivation of neurogliaform cell population in L1 somatosensory cortex in vivo.
(A) Experimental setup. Head-fixed anesthetized rats were placed under a two-photon microscope having a cranial window above the hindlimb somatosensory cortex. OGB-1 AM and SR 101 were injected into L1. Ipsilateral hindlimb stimulation was performed with an electric stimulator. (B) Two-photon image of neurons that were labeled with OGB-1 in L1. SR 101 labeled astrocytes. Right: ΔF/F changes of Ca2+ signals (gray: individual traces; black: mean of 10 consecutive traces) during series of ipsilateral stimulation (black arrowhead). Traces correspond to the marked cells. (C) Time-series heat map of 44 L1 interneurons evoked ΔF/F changes in Ca2+ signals during ipsilateral hindlimb stimulation in a single experiment (black arrowhead). (D) Scatter plot showing the spatial location of L1 interneuron somata in a single experiment. Colors are corresponding to the responsiveness shapes to the molecular identity (not responsive and α-actinin2−, blue dots; responsive and α-actinin2−, green dots; responsive and α-actinin2+, green triangles). (E) Stack columns show the fraction of responsive versus not responsive cells in different experiments (n = 5 animals). Far-right columns show the mean value. (F) In vivo two-photon image showing imaged neurons. To the right, confocal images from the same area show immunohistochemical detection of α-actinin2+ neurons (arrowhead). α-Actinin2− cells were visualized by exclusive DAPI (4′,6-diamidino-2-phenylindole) staining (arrow). Scale bar, 20 μm. (G) Stack columns show the proportion of α-actinin2 immunoreactivity among responsive versus not responsive cells (n = 2 animals). Far-right columns show the mean value.
Figure 3—figure supplement 1

Spatial relationship of responsive and not responsive L1 interneurons during ipsilateral hindlimb stimulation.
Three-dimensional (3D) scatter plots show the responsive and not responsive interneurons in different animals during the stimulation protocol. Top two experiments provide information about the molecular profile of the monitored neurons. Plots on the right side show the shortest distance between all responsive cells and the shortest distance between responsive cells that were ɑ-actinin2+. Neurons that were not identified post hoc immunohistochemically were excluded from shortest distance measurement.
Figure 4
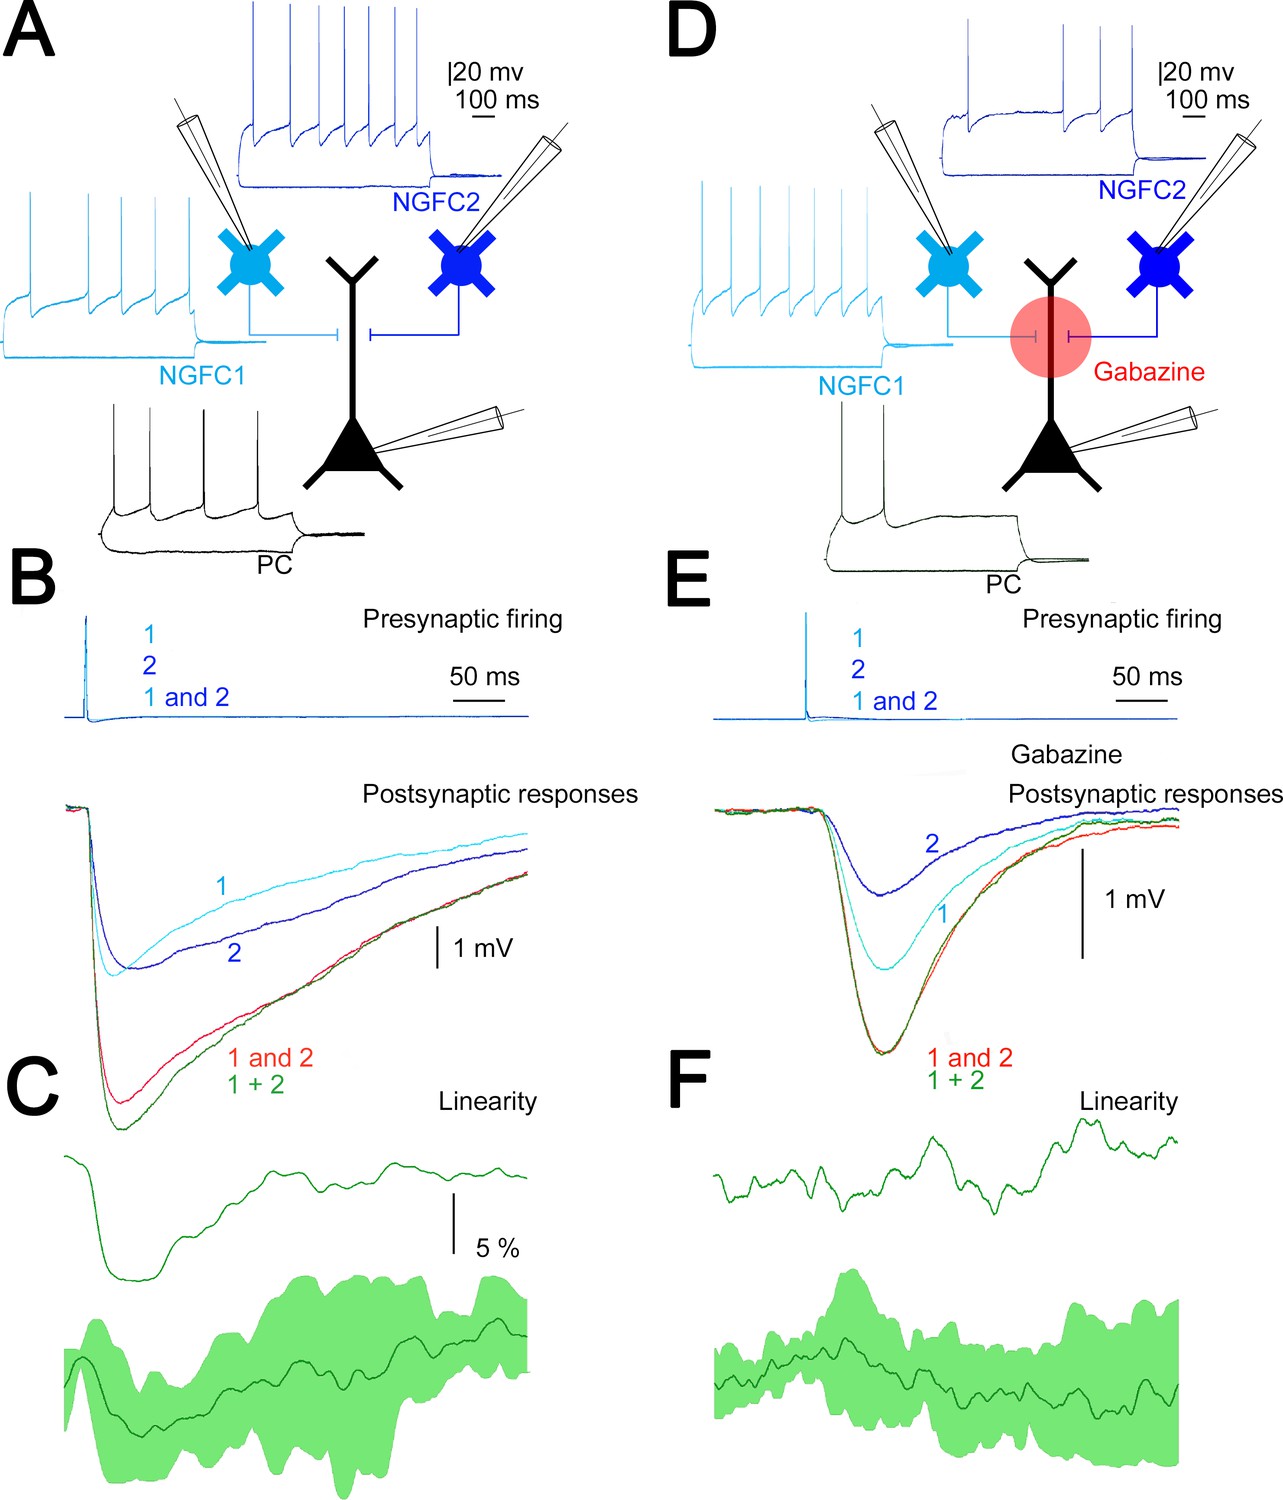
Summation of convergent, unitary inhibitory postsynaptic potentials (IPSPs) elicited by neurogliaform cells (NGFCs).
(A) Schematic experimental setup of triplet recordings. Firing pattern of two presynaptic NGFCs (light blue and blue) and a postsynaptic pyramidal cell (PC) (black). (B) Action potential triggered under control conditions in the NGFCs individually (1, 2) or synchronously (1 and 2) elicited unitary (1, 2) and convergent (1 and 2) IPSPs in the postsynaptic PC. Below, the time course of the difference between the measured (1 and 2) and calculated (1 + 2) sums of convergent IPSPs. (C) The linearity of response summation in a single experiment (top) and on populations of convergent NGFC triggered IPSPs (bottom) recorded in control conditions (n = 4) (dark green, population average; light green, SD). (D) Same as experimental setup as (A) on a different set of cells but in the presence of GABAA receptor antagonist, gabazine. (E) Identical stimulation protocol as (B), note the disappearance of the difference between the measured (1 and 2) and calculated (1 + 2) sums of convergent IPSPs. (F) Same as (C), but under blocking GABAA receptors with gabazine (n = 8) (dark green, population average; light green, SD).
Figure 5
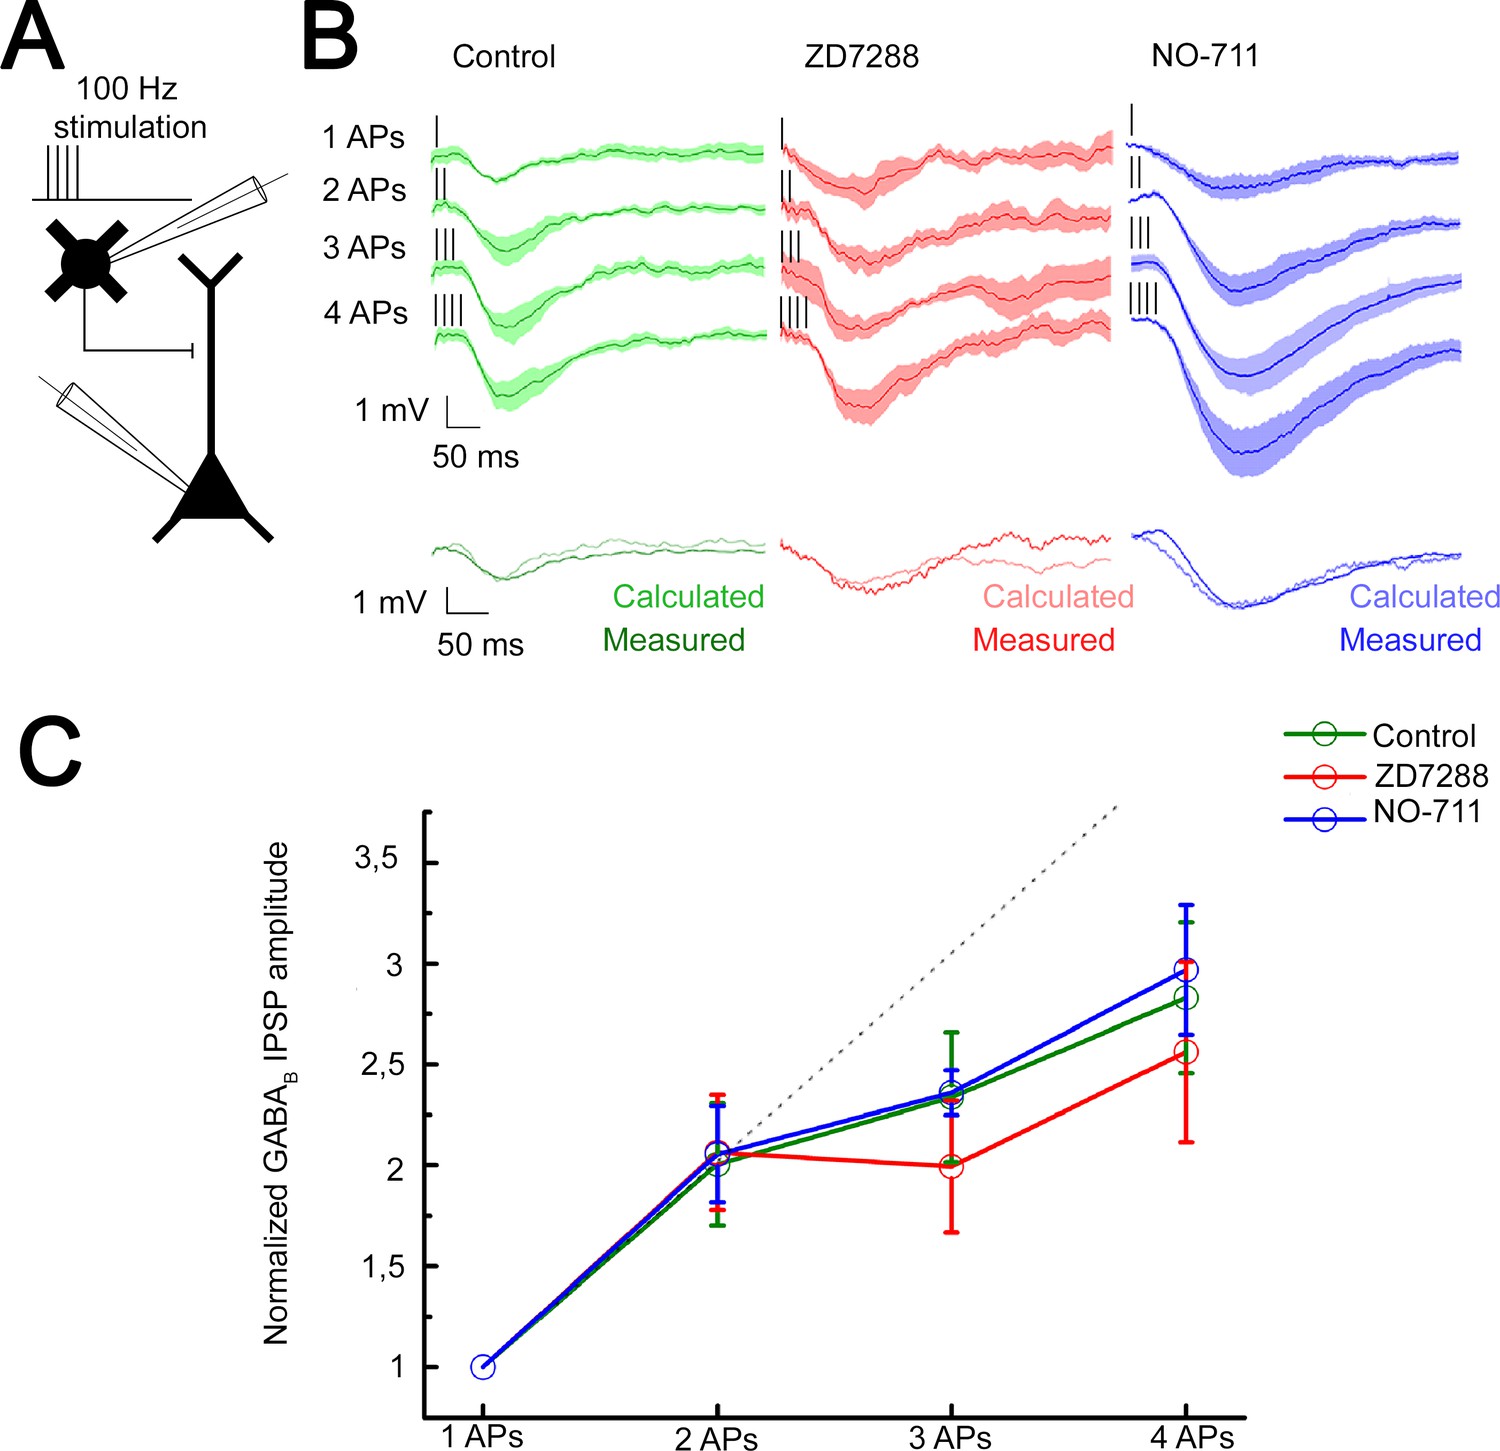
Integration of GABAB receptor-mediated responses are not affected by HCN channel and GABA reuptake.
(A) Schematic experimental setup of paired recordings. Bursts of up to four action potentials (APs) were elicited in neurogliaform cells (NGFCs) at 100 Hz in the presence of gabazine. (B) NGFC to pyramidal cell (PC) paired recordings showed similar linear GABAB receptor-mediated summation under control conditions. Top: Individual traces showing inhibitory postsynaptic potential (IPSP) kinetics upon AP burst protocol (vertical lines indicating the triggered APs) during control (green traces, n = 6), in presence of hyperpolarization-activated cation (HCN) channel blocker ZD7288 (red traces, n = 5) or GABA reuptake blocker NO-711 (blue traces, n = 6). Bottom: Traces show measured IPSP from two consecutive presynaptic stimulation (measured) and the arithmetic sum of two unitary IPSP (calculated). (C) Summary of normalized IPSP peak amplitudes. Compare to control conditions (2APs: 2.00 ± 1.08; 3APs: 2.34 ± 1.16; 4APs: 3.17 ± 1.26), summation properties of GABAB mediated unitary IPSPs are neither affected by application of ZD7288 (2APs: 2.06 ± 1.06, p = 0.983; 3APs: 1.99 ± 1.17, p = 0.362; 4APs: 2.56 ± 1.6, p = 0.336; two-sided MW U-test) nor NO-711 (2APs: 2.06 ± 1.17, p = 0.853; 3APs: 2.36 ± 0.31, p = 0.645; 4APs: 2.9 7± 1.54, p = 0.515; two-sided MW U-test). Dashed line indicates the linearity.
Figure 6 with 3 supplements

Subcellular localization of GABAB receptor-G-protein gated inward rectifier potassium (GIRK) channel complex determines summation properties.
(A) Visualization of the complete MCell-based model in the course of GABA release. (B) Magnified view of the model. (C) Distribution of GABAB receptors and GIRK channel clusters on the dendritic membrane in the model (gray bars: dendritic spine; black bars: dendritic shaft). (D) Overview of the molecular interactions during increasing GABA release. Top to bottom: NGFC output simulated by releasing GABA (red) in the extracellular space proportional to one to four action potential (AP) stimulation. Below, the total number of produced Gβγ subunits (brown) by activated GABAB receptors (green) located on the dendritic shaft and spine. After lateral diffusion in the plasma membrane, Gβγ subunits bind to GIRK channels (blue). (E) Boxplot of GABA, Gβγ subunits, GABAB receptors, and GIRK channels quantity normalized to 1AP (GABA: 2APs: 1.67 ± 0.004, 3APs: 2.12 ± 0.005, 4APs: 2.42 ± 0.006, Gβγ subunits: 2APs: 1.85 ± 0.51, 3APs: 2.53 ± 0.57, 4APs: 3.2 ± 0.68; GABAB receptor shaft: 2APs: 1.91 ± 0.84, 3APs: 2.74 ± 0.99, 4APs: 3.45 ± 1.18; GABAB receptor spine: 2APs: 1.98 ± 0.84, 3APs: 2.84 ± 0.98, 4APs: 3.78 ± 1.17; GIRK channel shaft: 2APs: 1.8 ± 1.37, 3APs: 2.84 ± 1.75, 4AP: 3.55 ± 2.09; GIRK channel spine: 2APs: 1.96±1.07, 3APs: 2.84 ± 1.26, 4APs: 3.52 ± 1.4). Square indicates the mean, line shows the median inside the boxplot. (F) Quantification of the signaling effectiveness on the shaft and spine region of the model dendrite during increasing GABA release (1AP: shaft: 0.39 ± 0.06, spine: 0.82 ± 0.21, p < 0.005, n = 1164, two-sided MW U-test; 2AP: shaft: 0.35 ± 0.086, spine: 0.84 ± 0.19, p < 0.005, n = 534, two-sided MW U-test; 3AP: shaft: ± 0.41 ± 0.036, spine: 0.85 ± 0.15, p < 0.005, n = 1871, two-sided MW U-test; 4AP: shaft: 0.39 ± 0.05, spine: 0.81 ± 0.01, p < 0.005, n = 709, two-sided MW U-test). Square indicates the mean, line shows the median inside the boxplot.
Figure 6—figure supplement 1
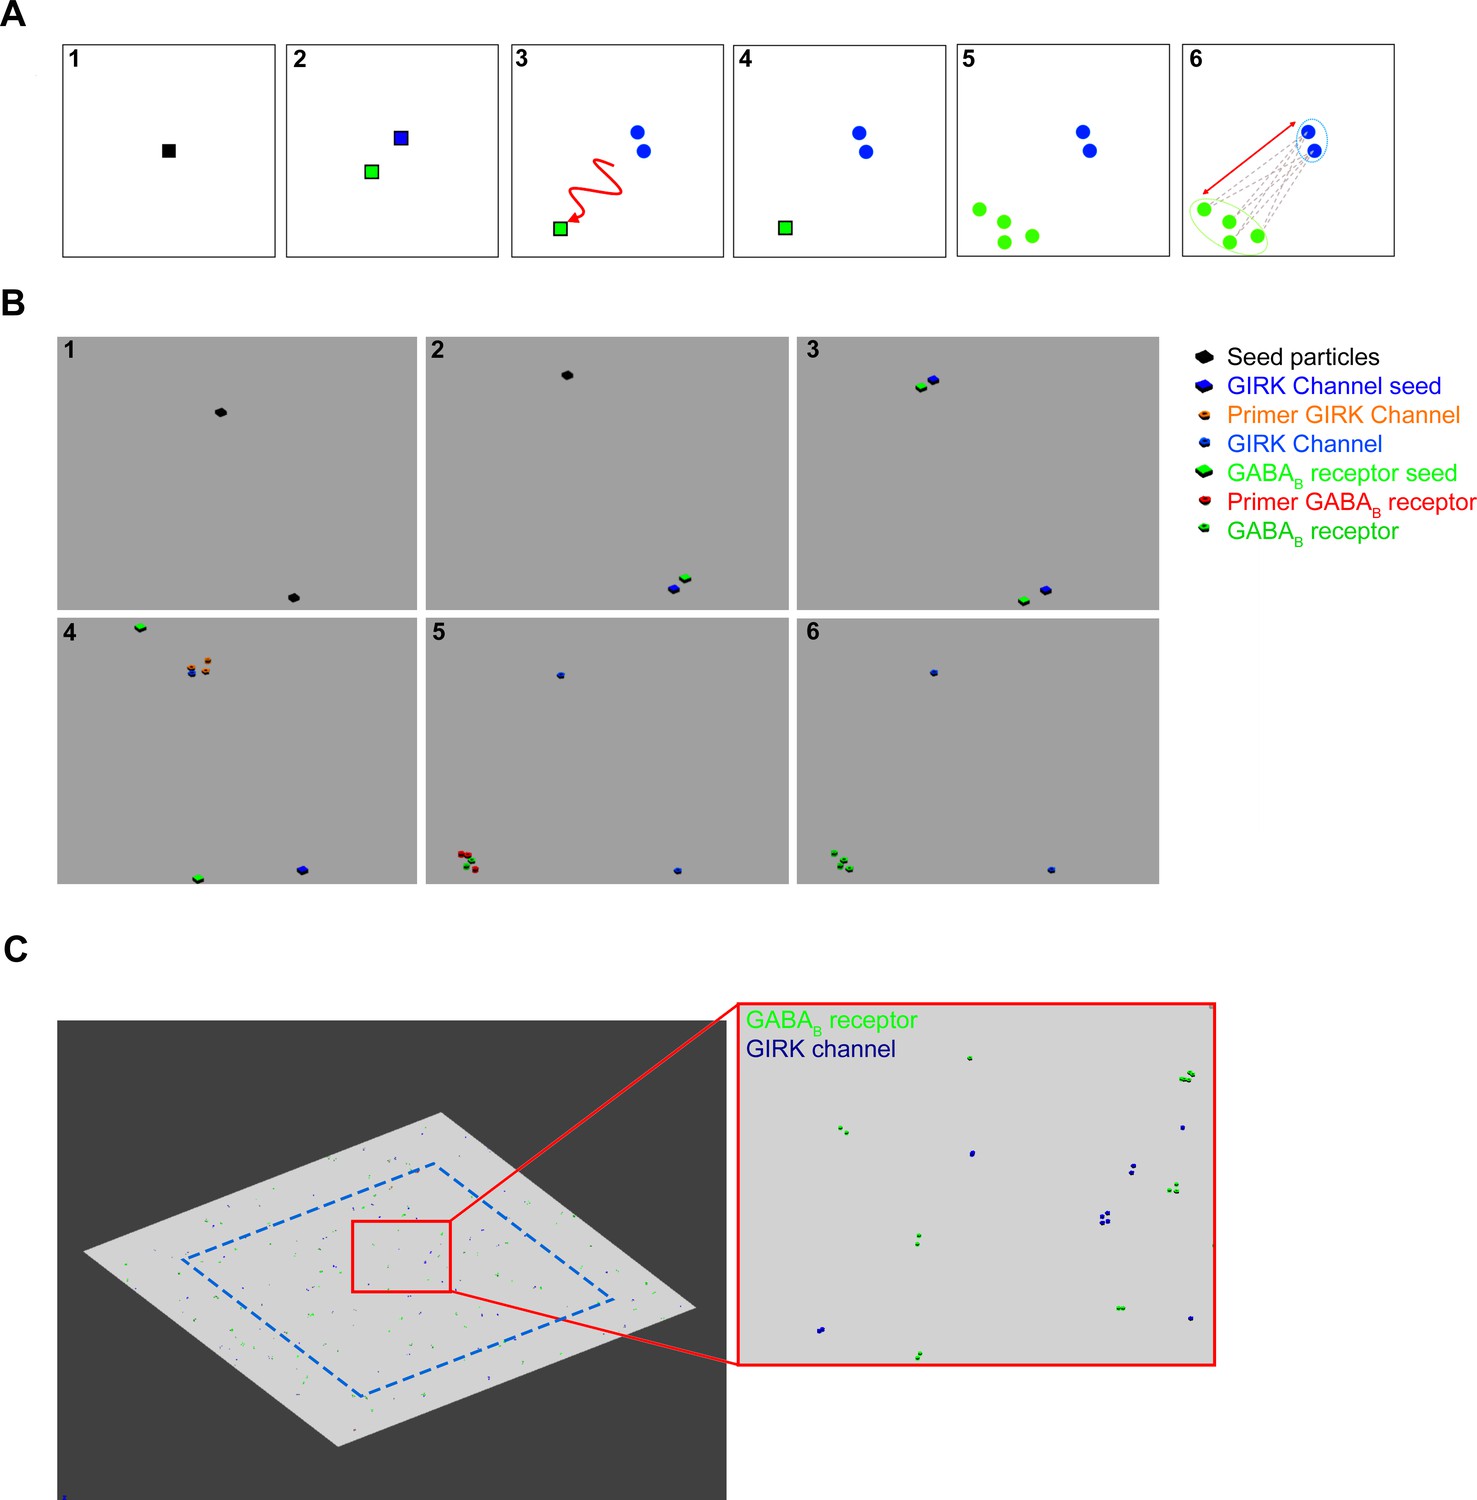
GABAB receptor and G-protein gated inward rectifier potassium (GIRK) channel distribution, created by a cascade reaction.
(A) To create a pseudorandom distribution the molecular interactions, the following steps were defined as the schematic concept: (1) Seed particles (black square) were placed randomly along the membrane surface. (2) The seed particles produce two distinctive particles: the first particle, the GIRK channel seed (blue square) that immediately creates GIRK channels (blue circles) and it remains immobile. (4) The second particle is the GABAB receptor seed (green square), which has the ability to laterally diffuse. (5) The probabilistic distance between the static GIRK channels and the GABAB receptor seed can be adjusted by limiting the time while it is mobile. After becoming immobile, the GABAB receptor seed produces GABAB receptors. (6) The distance between each GIRK channel and the nearest GABAB receptors was calculated. (B) Image sequences show the particle interactions in the MCell model: (1) Primer seed particles were placed randomly, (2) which produce GIRK channel seed and GABAB receptor seed particles. (3) GIRK channel seed particles remain in the same place, the GABAB receptor seed particles laterally diffuse away. (4) GIRK channel seed particles produce one to four GIRK channels by first creating four primer GIRK channel particles that either disappear or produce a final GIRK channel. This step was created to avoid uniform cluster generation. (5) GABAB receptor seeds lateral diffusion time was optimized to regulate the probabilistic distance between the clusters. GABAB receptor seed generated one to eight GABAB receptors, which either disappeared or produced a functional receptor. (6) Finally, distances were measured between the closest receptor and channel cluster. (C) Images show the two-dimensional plane and inset of a zoomed image of the final distribution. Distances were only measured from the GIRK channels that were inside the blue dashed line.
Figure 6—figure supplement 2
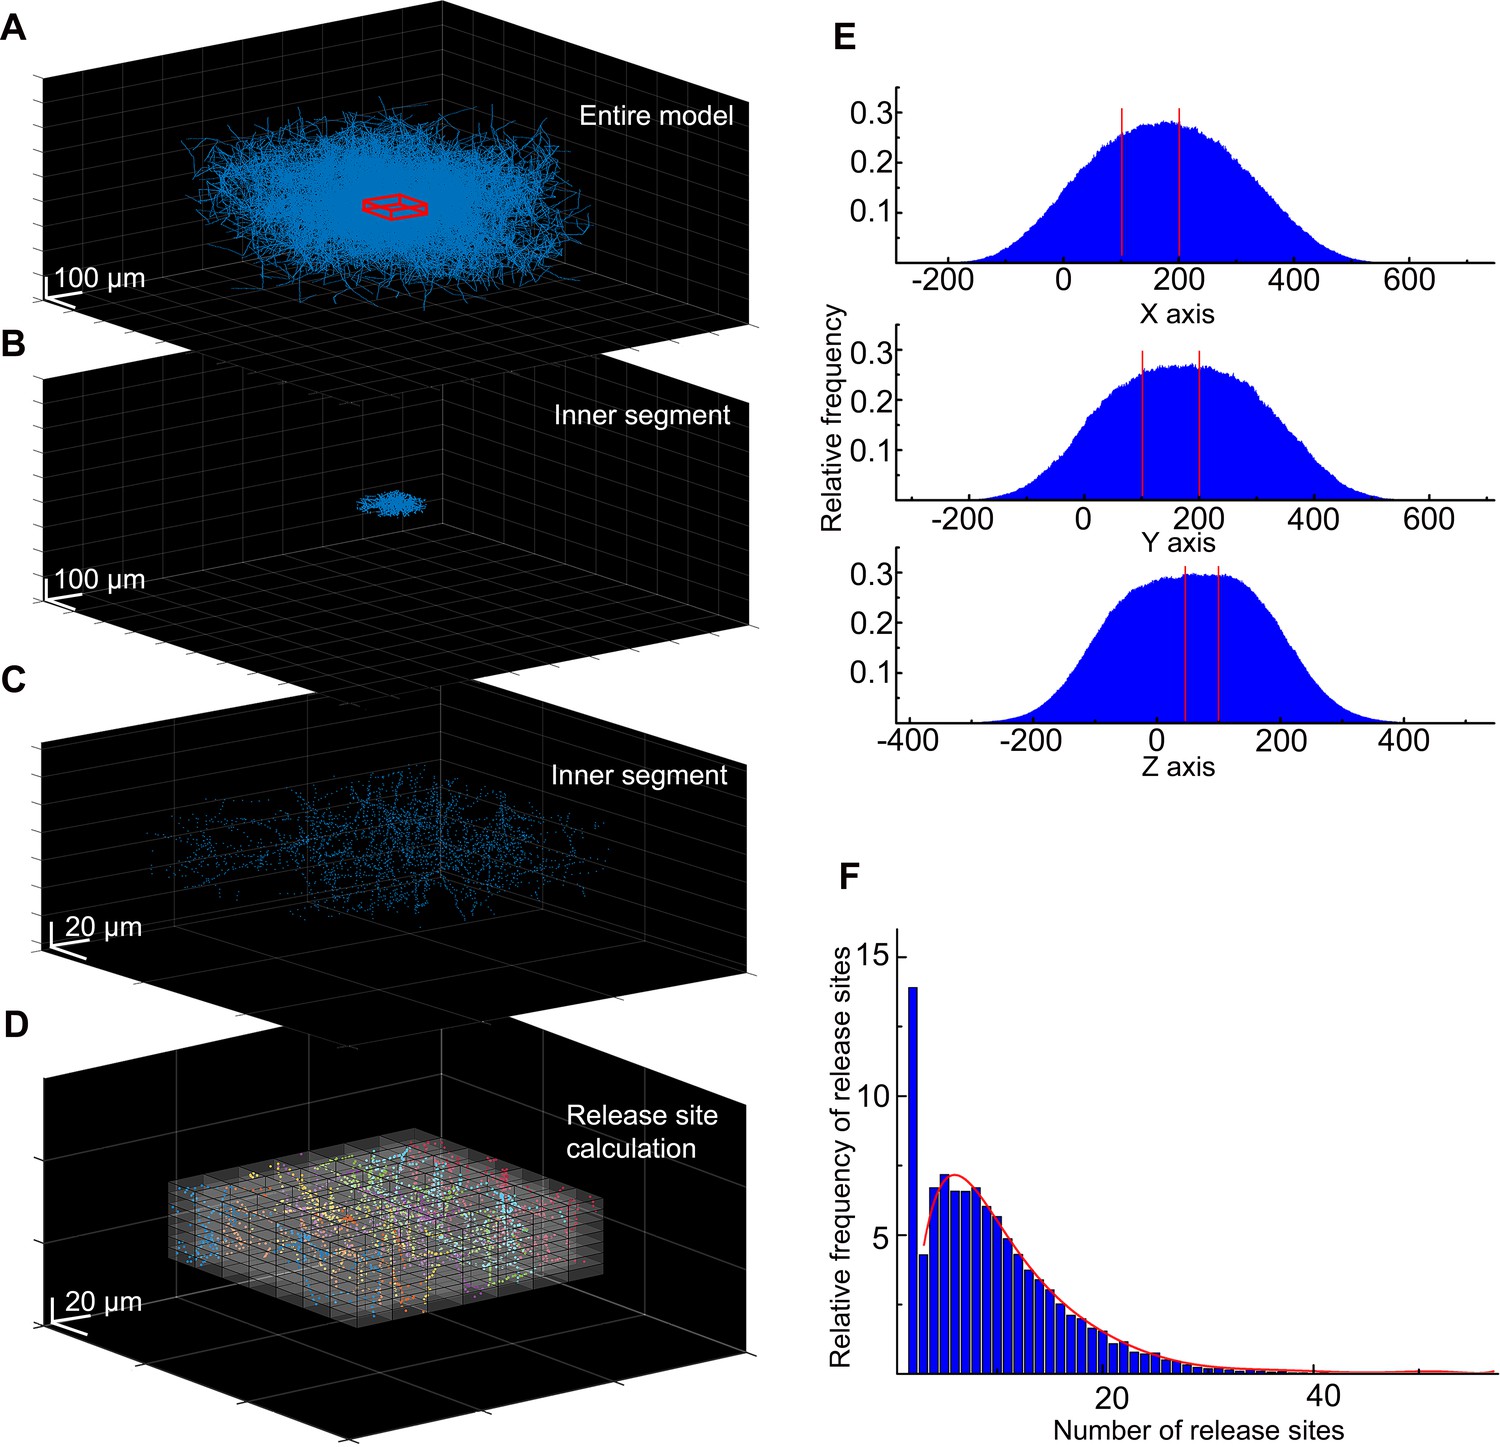
Calculation of the neurogliaform cell (NGFC) release site density for the MCell model.
(A) In the spatial model of the NGFC population, the density of axonal processes and release sites are rapidly declining around the model’s outskirts. To avoid underrepresentation of release sites, we collected data from the inner section of the model, from a 100×100×50 µm3 sized cuboid (showed in red). (B) Within these boundaries (the section between the two red lines), the high density of release sites is preserved alongside all three axes. (C) In the inner segment of the model, we calculated the frequency of release sites in smaller 13.28×13.28×3.592 µm3 sized cuboids. (D) We calculated the release site frequency within the inner segments in all (n=36) simulations in 13.28×13.28×3.592 µm3 volumes. (E) In each simulation, on average 2611.5±691.96 and a total of 94,014 release sites were calculated. (F) Data shows that 13.9% of segmented volumes do not contain release sites. In 86.1% of segmented volumes, the release site frequency shows a skewed distribution from 1 to 56 (mean: 7.61±6.71). The red line shows the fitting of this data.
Figure 6—figure supplement 3
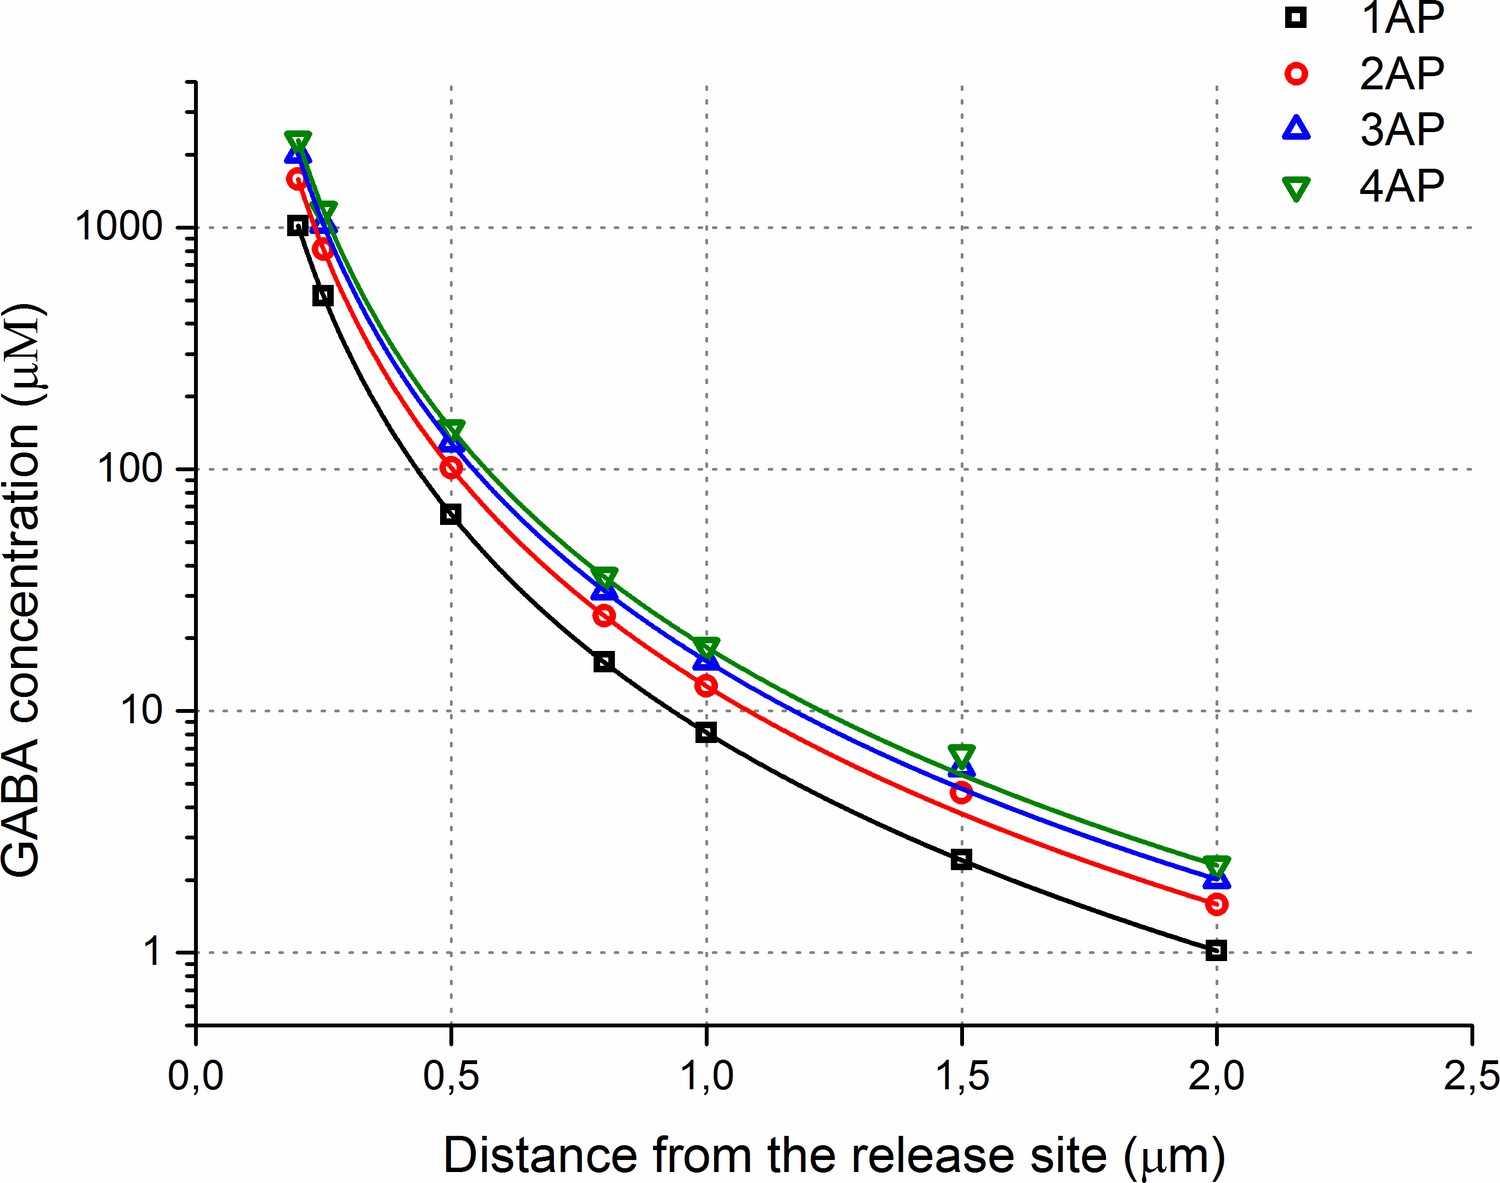
Estimated GABA spatial concentration profiles during multiple releases.
A plot of the GABA concentrations versus distance from the release site in the MCell model.
Author response image 1
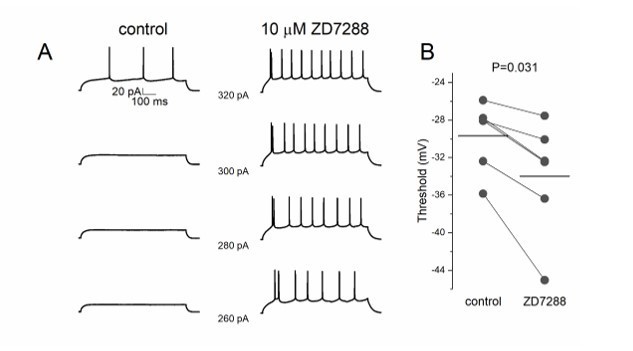
ZD7288 decreases threshold potential in pyramidal cells.
(A) Lower step current injection induce firing in pyramidal cell after application of ZD7288. (B) Threshold potential decreases significantly after ZD7288 bath application.
Author response image 2

Interbouton distances along the NGFC axons.
(A) Interbouton distances versus their distances from the soma along the axonal processes. Each plot shows data from individual NGFCs. The axonal segments were randomly chosen. Grey area shows three times of the standard deviation, black line indicates the linear fit on the data. Values exceeding three times of the standard deviation were excluded from the correlation measurement. (B) Pooled data from the six NGFCs.
Author response image 3
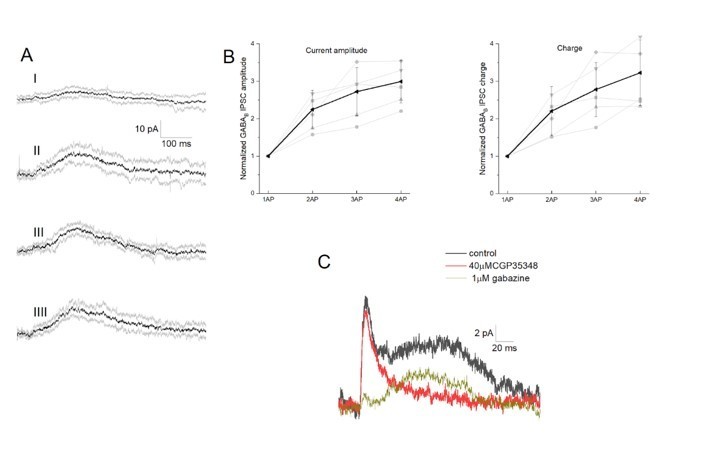
Integration of GABAB receptor-mediated synaptic currents.
(A) Representative recording of a neurogliaform synaptic inhibition on a voltage clamped pyramidal cell. Bursts of up to four action potentials were elicited in NGFCs at 100 Hz in the presence of 1 μM gabazine and 10 μM NBQX (B) Summary of normalized IPSC peak amplitudes (left) and charge (right). (C) Pharmacological separation of neurogliaform initiated inhibitory current.
Author response image 4

Summation of convergent GABAA and GABAB receptor mediated IPSPs elicited by NGFCs.
IPSPs recorded from the postsynaptic PC under control conditions from individually (light and dark blue) and synchronously (light green) activated NGFCs. Dark green line indicates the arithmetic sum of individual IPSP responses. Each figure shows the mean of IPSPs through the experiments. Black lines indicate the linearity of the summation in different experiments. Linearity was calculated as a difference between the average of the arithmetic sum and experimentally recorded converging IPSPs from individual NGFCs. Grey dashed line shows the complete linearity.
Author response image 5
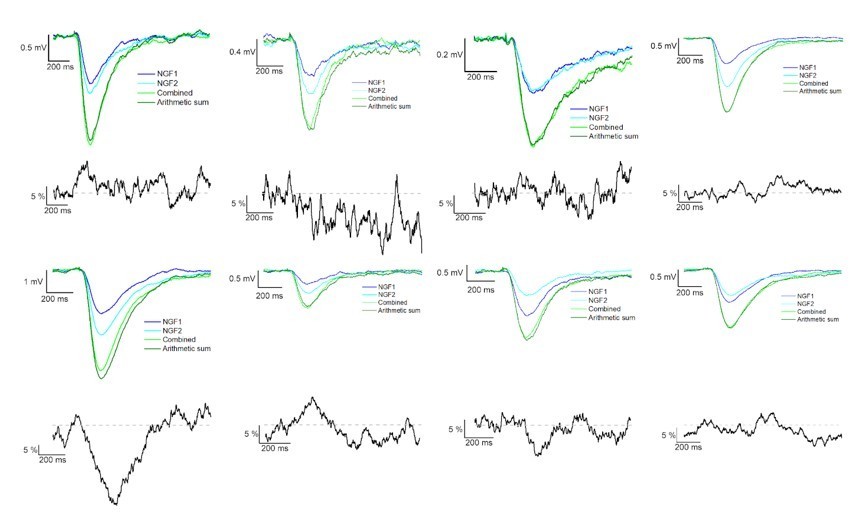
Summation of convergent GABAB receptor mediated IPSPs elicited by NGFCs.
IPSPs recorded from the postsynaptic PC under the presence of gabazine from individually (light and dark blue) and synchronously (light green) activated NGFCs. Each figure shows the mean of IPSPs through the experiments. Dark green line indicates the arithmetic sum of individual IPSP responses. Black lines indicate the linearity of the summation in different experiments. Grey dashed line shows the complete linearity. Linearity was calculated as a difference between the average of the arithmetic sum and experimentally recorded converging IPSPs from individual NGFCs.
Additional files
-
Supplementary file 1
Parameters used for simulation.
- https://cdn.elifesciences.org/articles/65634/elife-65634-supp1-v2.xlsx
-
Supplementary file 2
Different estimated GABA concentrations as a function of distance.
- https://cdn.elifesciences.org/articles/65634/elife-65634-supp2-v2.xlsx
-
Transparent reporting form
- https://cdn.elifesciences.org/articles/65634/elife-65634-transrepform-v2.docx
Download links
A two-part list of links to download the article, or parts of the article, in various formats.
Downloads (link to download the article as PDF)
Open citations (links to open the citations from this article in various online reference manager services)
Cite this article (links to download the citations from this article in formats compatible with various reference manager tools)
Predominantly linear summation of metabotropic postsynaptic potentials follows coactivation of neurogliaform interneurons
eLife 10:e65634.
https://doi.org/10.7554/eLife.65634


