Asymptomatic Bordetella pertussis infections in a longitudinal cohort of young African infants and their mothers
- Boston University School of Public Health, Department of Global Health, United States
- University of Georgia, Odum School of Ecology, Georgia
- Right to Care, Zambia
- University of Zambia, School of Health Sciences, Department of Biomedical Science, Zambia
- University of Georgia, Center for the Ecology of Infectious Diseases, Georgia
- University of Georgia, Department of Infectious Diseases, Georgia
Figures
Figure 1

Study Attendance.
(A) Percent attendance (%) of mother/infant pairs by infant age at last attendance (N = 1320, excluding pairs where subjects had <4 NP samples). Shaded regions show target age windows of DTP doses 1–3. Horizontal lines and text shows number of pairs attending up to marked ages: beginning of study enrollment, and at earliest timely administration of DTP doses 1–3. See Table 1 for study profile. Most pairs (734/1320) attended all seven scheduled visits (including enrollment). (B) NP samples per subject: number of subjects with each sample count (including enrollment and unscheduled visits). Note that, with rare exceptions, each mother has the same number of NP samples as their infant.
Figure 2

Timeline of study participation for eight noteworthy mother/infant pairs, showing rounded IS481 CT values (numbers), ptxS1 results (shape), and pertussis symptoms (color) at each clinic visit.
Selected pairs include all symptomatic infants with definitive evidence of pertussis infection (IS481 CT <35). Blank cells show NP samples with no detected IS481. Contemporaneous detection of IS481 within pairs is common, as are temporal clusters of IS481 within individuals. Pertussis symptoms are relatively uncommon in mothers: of the seven mothers shown here with detectable IS481, four lacked any observable pertussis symptoms during clinic visits.
Figure 3
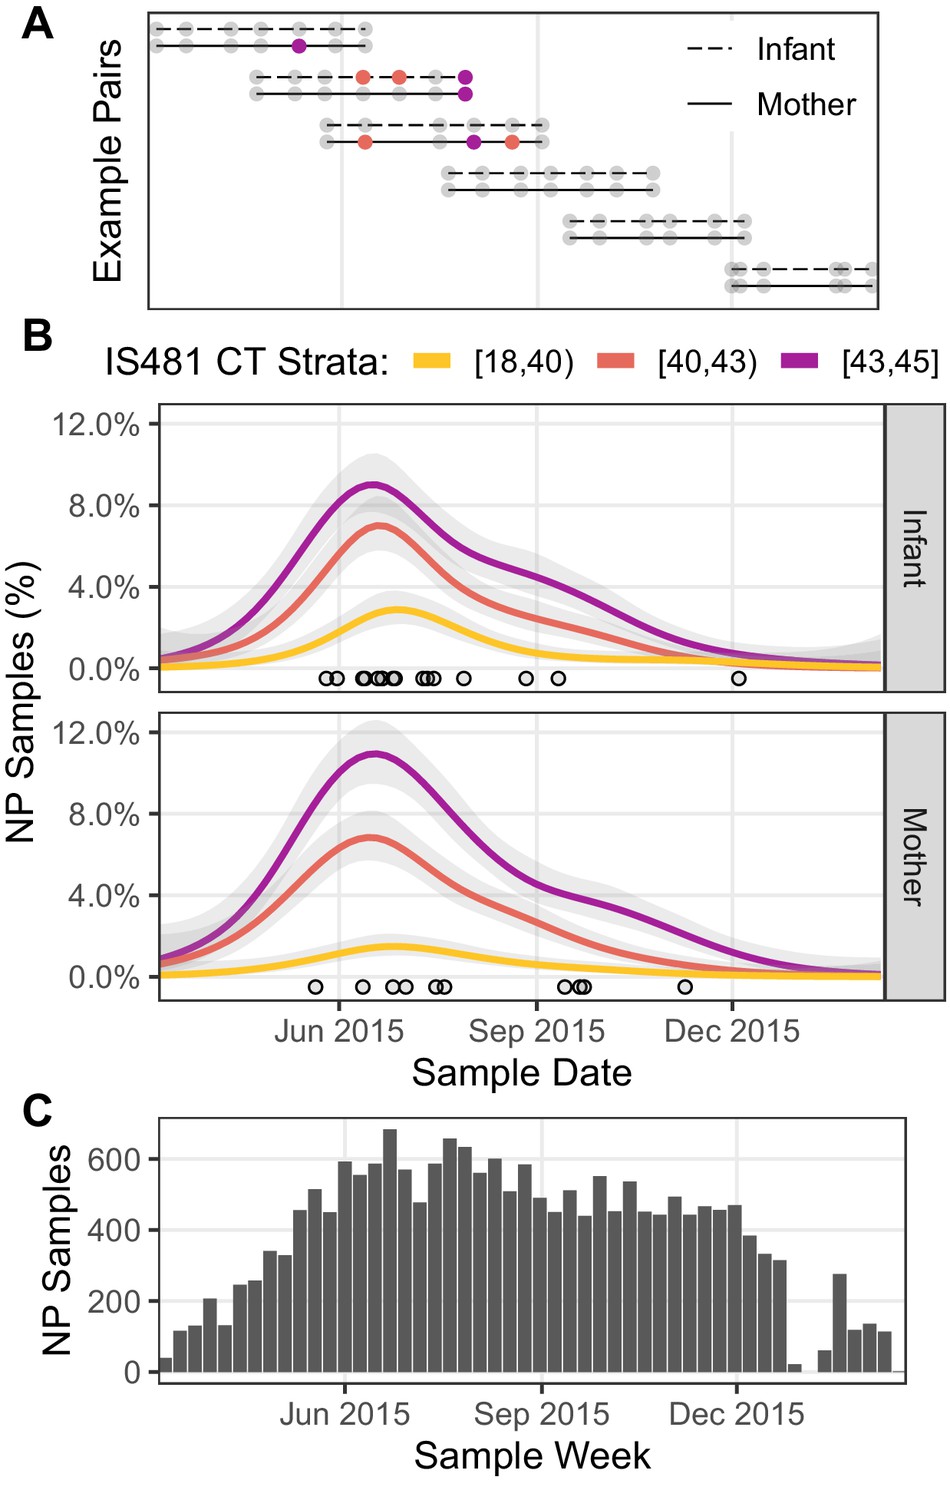
Timeline of study visits, NP samples, and IS481 assays.
(A) Timeline of study participation for six mother/infant pairs chosen to illustrate the cohort’s rolling enrollment. Dots show clinic visits; color indicates NP sample IS481 CT strata. Visits included initial enrollment (shortly after birth) followed by (up to) six scheduled visits at 2–3 week intervals, and (in some cases) additional mother-initiated visits. (B) timeline NP samples for the full cohort (N = 17,442), showing the percent of samples with detectable IS481 over time, stratified by signal intensity (lower CT values indicate more IS481, see also Table 3). For each stratum, a generalized additive model estimated the time-varying proportion of all assays contained in that stratum (shading shows 95% CI). Points highlight assays with CT <35. A cluster of detecting assays in all strata peaks in late June/early July. Strong temporal correlation was observed among strata, and is consistent with detection of a pertussis outbreak, but is not consistent with randomly distributed false positive assays. (C) Number of NP samples per week (approx. denominator of B). The dip in Jan 2016 corresponds with the Christmas holiday.
Figure 4
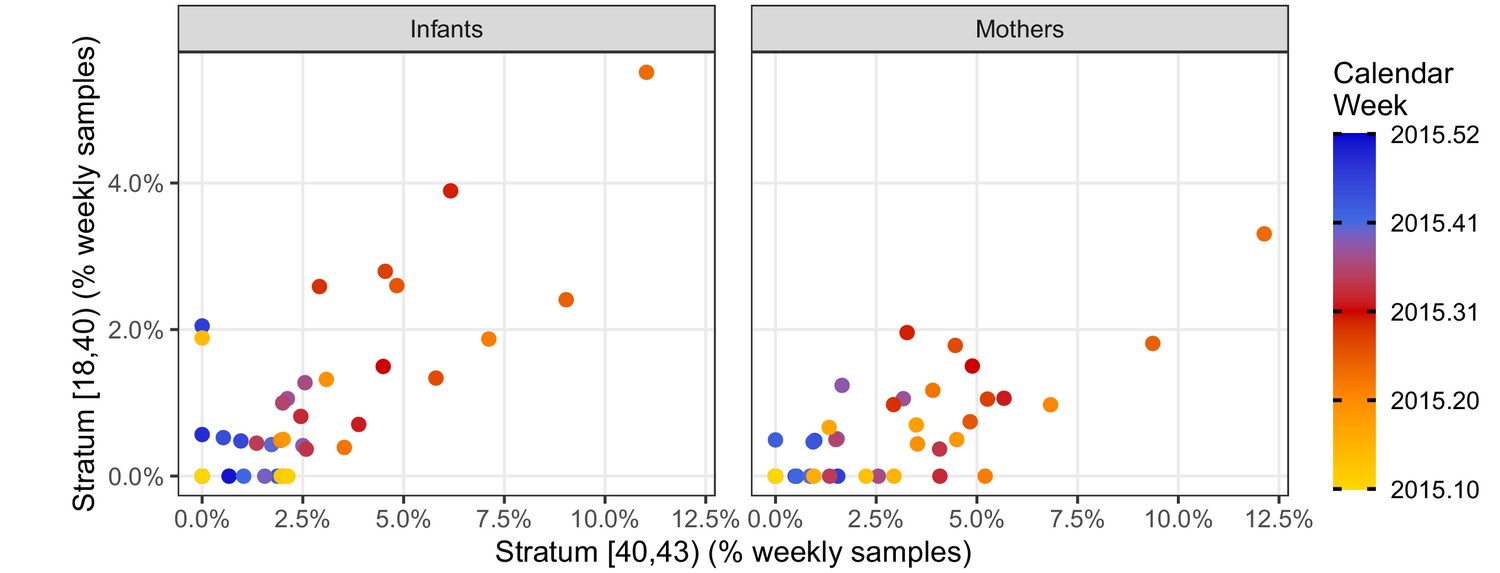
Phase portraits showing the weekly percent of NP samples in the mid-intensity stratum (X, 40 < CT ≤ 43) versus the high-intensity stratum (Y, CT <40) for infants (left) and mothers (right).
Color shows calendar week (for clarity, weeks in 2016 are not shown). These strata are highly correlated: ρ = 0.68 (infants); ρ = 0.71 (mothers). The many weeks with Y = 0 and X > 0 illustrates the relatively low sensitivity of the high-intensity stratum. Indeed, the mid-intensity stratum detects a pertussis outbreak 2–3 weeks before the high-intensity stratum in April 2015 in both infants and mothers.
Figure 5

IS481 detections by infant age, showing wP vaccination schedule.
(A) number of infant NP samples per week. Shading shows the number of wP doses received at least 14 days prior to sample collection. With rare exceptions, each infant sample is accompanied by a corresponding mother’s sample. In most cases, the third wP dose was administered on the final study visit. (B) percent of NP samples with detectable IS481 over time with 95% CI (shading), estimated from generalized additive models (one each for mothers and infants). Infant age was a significant predictor of percent detection in infants only, while prior wP dose had no observable impact on percent detection in either infants or mothers.
Figure 6
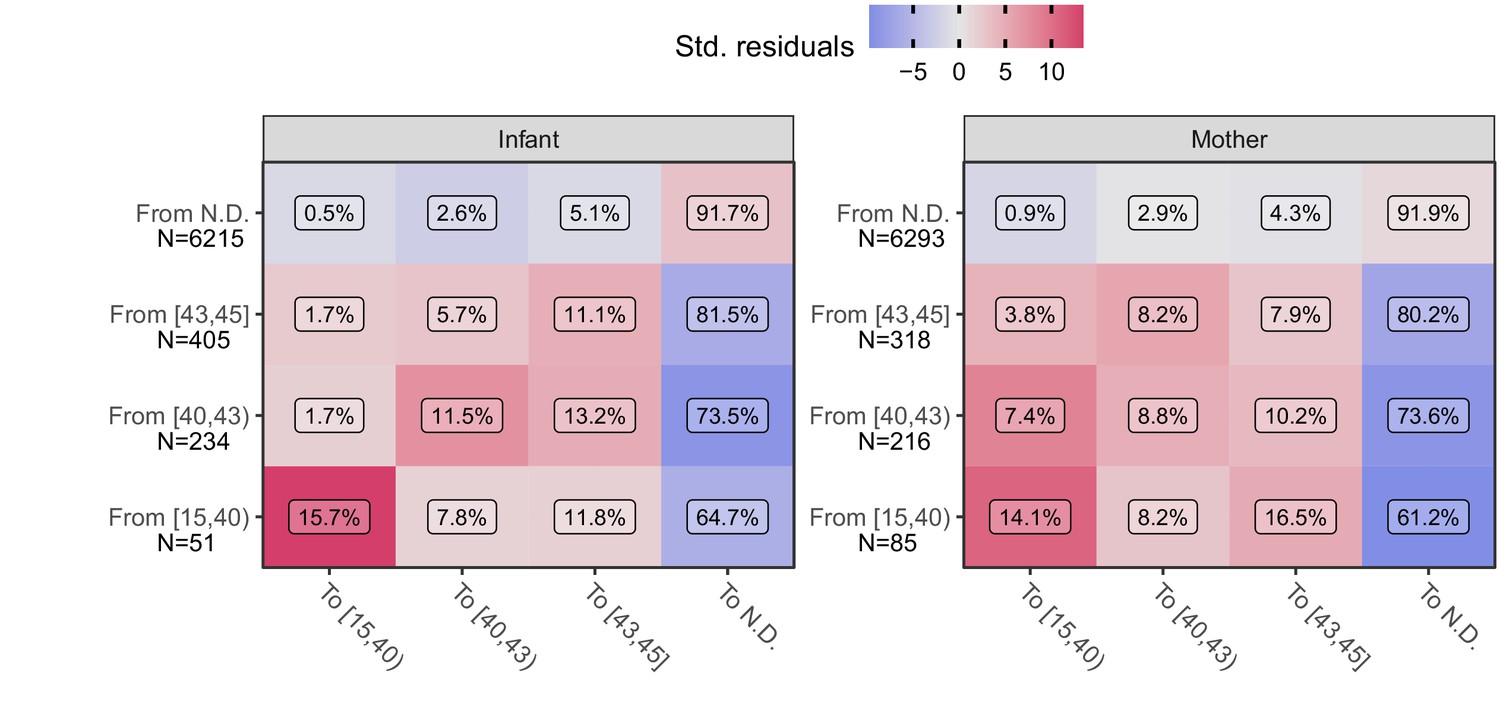
Transition frequency between IS481 CT strata over adjacent pairs of assays (within subjects) for infants (left) and mothers (right).
Assay pairs separated by more than 25 days are omitted. N shows total transitions from each CT stratum (row); text shows percent of row total (N) within each cell. Assays were bootstrap resampled to generate a null distribution (1000 draws). Color shows standardized residuals: the difference between observed and expected frequency divided by the standard error of the difference. Transitions from detecting to detecting are more common than expected by chance alone (red), while transitions from detecting to non-detecting are much less frequent than expected (blue). See Table 3 for marginal frequencies in each CT stratum.
Figure 7 with 1 supplement

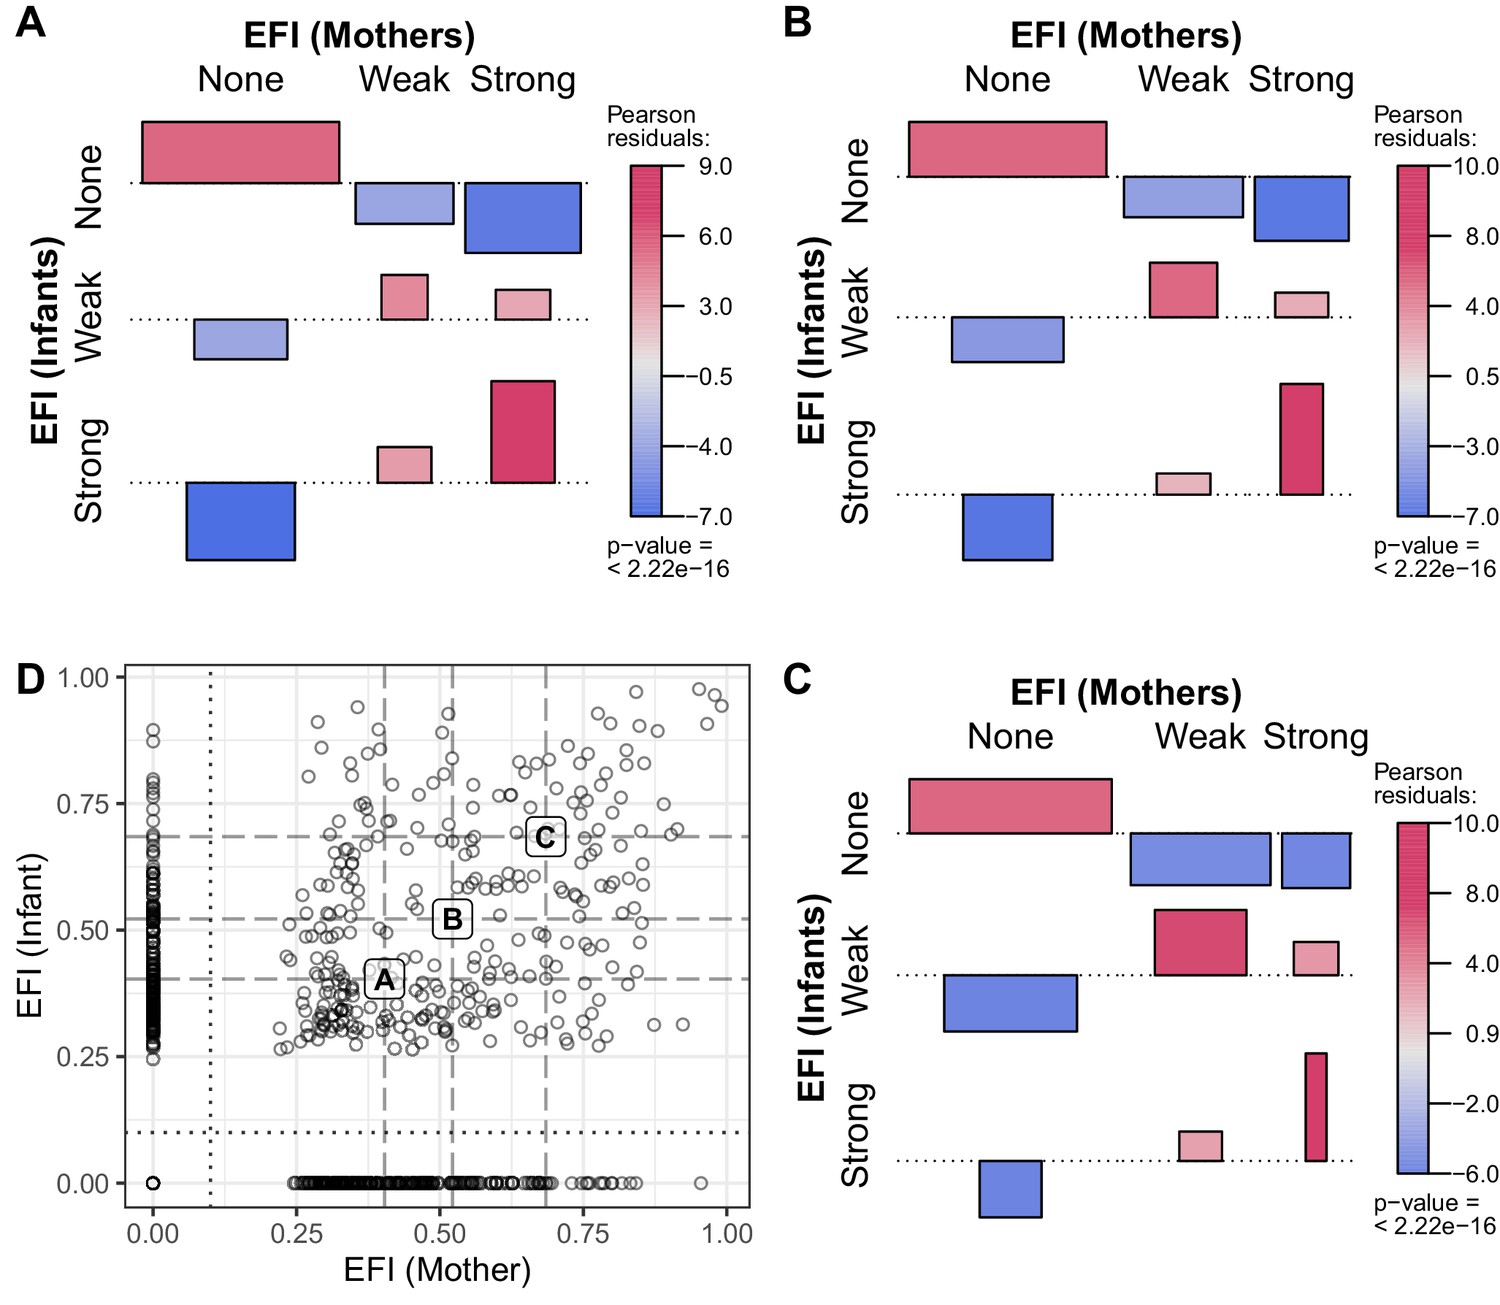
Quantifying evidence for pertussis infection, and concordance of evidence within mother/infant pairs.
(A) Reverse cumulative distribution (RCD) curves of IS481 CT values for mothers and infants. (B) Boxplot summarizing evidence for infection (EFI), stratified by number of detecting assays per subject (x-axis). For each subject, EFI equals one minus the geometric mean RCD proportions (as in A). In general, EFI increases with lower CT values (A) and more detecting assays. The dashed line delineates strong evidence (defined to include all subjects with ≥3 detecting assays, 0.52 ≤ EFI < 1) from weak evidence (0 < EFI < 0.52); dotted line delineates no evidence (EFI = 0). (C) EFI in mother/infant pairs. Dotted and dashed lines as in B for mothers (vertical) and infants (horizontal). (D) Association of EFI strength (from C) between mothers and infants, showing very strong concordance (red) and rare discordance (blue) within pairs, particularly for pairs exhibiting strong EFI. Bar widths are proportional to expected counts; bar height and color show Pearson residuals (scaled difference between observed and expected counts). p-Value and residuals are relative to independent association. See also Figure 7—figure supplement 1.
Figure 7—figure supplement 1
As in Figure 7, varying the threshold of Strong EFI (dashed line) to include all individuals with ≥2, 3, or 4 detecting assays (A-C, respectively).
As the threshold increases from A to C, strong EFI is observed in fewer individuals (and weak EFI in more), but the pattern of association between mothers and infants remains largely unchanged.
Figure 8 with 1 supplement

Association between participant EFI (as in Figure 7) and documented pertussis symptoms (A–B) or antibiotic use (C–D), separating mothers and infants (columns).
Minimal symptoms include cough and/or coryza only; bar heights and p-values as in Figure 7D. In A-B, frequent co-occurrence of strong EFI with minimal symptoms is evident in both mothers and infants, as is no symptoms with no EFI. In infants, moderate to severe symptoms commonly co-occur with strong EFI, while more severe symptoms are rare in mothers. In C-D, frequent co-occurrence of antibiotic use with strong EFI is evident in both mothers and infants. See also Table 4 and Figure 8—figure supplement 1.
Figure 8—figure supplement 1
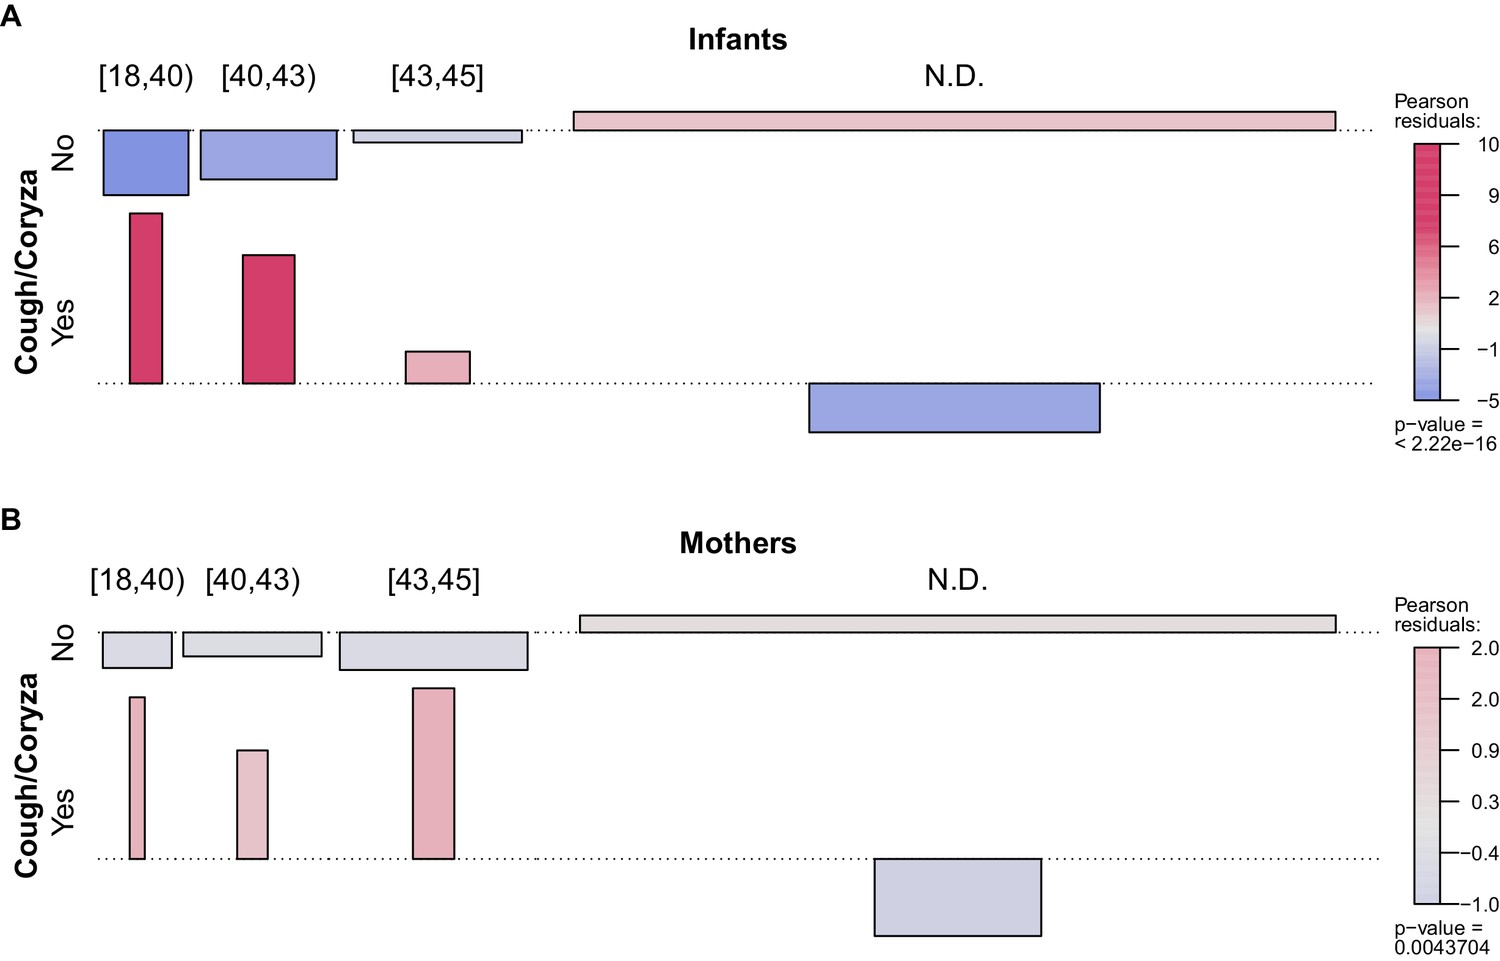
Association between NP sample IS481 CT strata (columns, as in Figure 3) and presence of cough and/or coryza for A, infants, and B, mothers.
Bar widths are proportional to expected counts; bar height and color show Pearson residuals: the scaled difference between observed and expected counts (assuming independent association). Higher CT values were more commonly observed in infants experiencing cough and/or coryza; in symptom-free infants, IS481 was less likely to be detected. A similar but much less pronounced pattern was observed in mothers.
Tables
Table 1
Study profile of cohort enrollment and attendance (bold indicates analysis set).
Beyond eligibility and initial screening, the sole cause of cohort attrition was failure to attend one or more scheduled clinic visits. For eligibility and enrollment details, please see Gill et al., 2016.
| Study Phasephase | Mother/Infant Pairs |
|---|---|
| Recruitment and screening | 3033 |
| Initial enrollment | 1981 |
| Post-enrollment attendence | 1497 |
| ≥4 NP samples per subject | 1320 |
| Attended all seven scheduled visits | 734 |
Table 2
Demographic characteristics of participants (interquartile range in parentheses).
Only subjects with at least four NP samples were included in subsequent analyses.
| Study Participation | ||
|---|---|---|
| Parameter | Enrolled | ≥4 NP Samples |
| Number Under Study | 1981 | 1320 |
| Mothers | ||
| Married | 90.2% | 89.8% |
| HIV+ | 17.5% | 19.5% |
| Median Age | 25 (21, 29) | 25 (22, 30) |
| Median Infants In House (<1 year) | 1 (1, 1) | 1 (1, 1) |
| Median Children In House (<5 years) | 2 (1, 2) | 2 (1, 2) |
| Infants | ||
| Born at Chawama PHC | 56.9% | 56.6% |
| Born at UTH | 34.8% | 35.5% |
| Female sex | 46.9% | 46.1% |
| Median birth weight (kg) | 3 (2.8, 3.3) | 3 (2.8, 3.3) |
Table 3
Frequency of NP samples in each IS481 CT intensity stratum for infants and mothers (not detected: N.D.).
IS481 was detected in 1561 (8.95%) samples (743 in infants, 818 in mothers). Very few samples had CT <35: 16 samples (infants) and 10 samples (mothers).
| CT Strata | Infant | Mother | Sum |
|---|---|---|---|
| (18,40) | 99 (1.1%) | 60 (0.69%) | 159 |
| (40,43) | 254 (2.9%) | 276 (3.2%) | 530 |
| (43,45) | 390 (4.5%) | 482 (5.5%) | 872 |
| N.D. | 7980 (91%) | 7901 (91%) | 15,881 |
| Sum | 8723 (100%) | 8719 (100%) | 17,442 |
Table 4
Frequency of EFI category in mothers and infants, stratified by occurrence of symptoms at any point during study participation.
Percentages are relative to row sums. Minimal symptoms include coryza and/or uncomplicated cough. Moderate to severe symptoms include all other pertussis symptoms in the Modified Preziosi Scale.
| EFI Category | |||||
|---|---|---|---|---|---|
| Symptoms | None | Weak | Strong | Sum | |
| Infants | None | 446 (77%) | 93 (16%) | 41 (7%) | 580 |
| Minimal | 312 (58%) | 128 (24%) | 95 (18%) | 535 | |
| Moderate/Severe | 108 (53%) | 56 (27%) | 41 (20%) | 205 | |
| Sum | 866 (66%) | 277 (21%) | 177 (13%) | 1320 | |
| Mothers | None | 669 (66%) | 209 (21%) | 130 (13%) | 1008 |
| Minimal | 145 (51%) | 84 (30%) | 55 (19%) | 284 | |
| Moderate/Severe | 16 (57%) | 9 (32%) | 3 (11%) | 28 | |
| Sum | 830 (63%) | 302 (23%) | 188 (14%) | 1320 | |
Table 5
Details for subjects shown in Figure 2, including NP sample number, percent samples with detected IS481, EFI, and summary of pertussis symptoms and antibiotics use.
| Subject | ID | Samples | Detected | EFI | Symptoms | Antibiotics |
|---|---|---|---|---|---|---|
| A Infant | 126 | 11 | 3 (27.3%) | Strong (0.68) | Mod/Sev | Yes |
| A Mother | 126 | 11 | 3 (27.3%) | Strong (0.52) | Mod/Sev | Yes |
| B Infant | 269 | 7 | 4 (57.1%) | Strong (0.89) | Minimal | Yes |
| B Mother | 269 | 8 | 1 (12.5%) | Weak (0.50) | None | No |
| C Infant | 434 | 7 | 3 (42.9%) | Strong (0.84) | Minimal | No |
| C Mother | 434 | 7 | 2 (28.6%) | Weak (0.52) | None | No |
| D Infant | 474 | 9 | 4 (44.4%) | Strong (0.94) | Mod/Sev | Yes |
| D Mother | 474 | 9 | 7 (77.8%) | Strong (0.99) | Mod/Sev | Yes |
| E Infant | 573 | 7 | 4 (57.1%) | Strong (0.87) | Minimal | Yes |
| E Mother | 573 | 7 | 0 (0.0%) | None (0.00) | Minimal | No |
| F Infant | 579 | 7 | 4 (57.1%) | Strong (0.90) | Minimal | No |
| F Mother | 579 | 7 | 3 (42.9%) | Strong (0.85) | Minimal | No |
| G Infant | 691 | 7 | 4 (57.1%) | Strong (0.96) | Mod/Sev | Yes |
| G Mother | 691 | 7 | 6 (85.7%) | Strong (0.98) | None | No |
| H Infant | 752 | 9 | 7 (77.8%) | Strong (0.98) | Mod/Sev | Yes |
| H Mother | 752 | 9 | 7 (77.8%) | Strong (0.95) | None | No |
Additional files
Download links
A two-part list of links to download the article, or parts of the article, in various formats.
Downloads (link to download the article as PDF)
Open citations (links to open the citations from this article in various online reference manager services)
Cite this article (links to download the citations from this article in formats compatible with various reference manager tools)
Asymptomatic Bordetella pertussis infections in a longitudinal cohort of young African infants and their mothers
eLife 10:e65663.
https://doi.org/10.7554/eLife.65663


