Identifying Plasmodium falciparum transmission patterns through parasite prevalence and entomological inoculation rate
- Centre for Health Informatics, Computing, and Statistics (CHICAS), Lancaster Medical School, Lancaster University, United Kingdom
- Laboratory of Entomology, Wageningen University and Research, Netherlands
- Department of Public Health, College of Medicine, University of Malawi, Malawi
- Center for Vaccine Development and Global Health, University of Maryland School of Medicine, United States
- Academic Medical Centre, University of Amsterdam, Netherlands
- Malawi-Liverpool Wellcome Trust Research Programme, Malawi
- Big Data Institute, University of Oxford, United Kingdom
- Computer, Electrical and Mathematical Sciences and Engineering Division, King Abdullah University of Science and Technology (KAUST), Saudi Arabia
- Liverpool School of Tropical Medicine, United Kingdom
Figures
Figure 1

Map of study site.
Map of Malawi (insert) highlighting the Majete Wildlife Reserve and the borders of 19 community-based organisations (CBOs) surrounding the Majete perimeter. Three focal areas (red patches), labelled as A, B, and C, show the households (black points) selected for the parasitaemia and entomological surveys by the Majete Malaria Project (MMP). The base map was obtained from Google Maps.
Figure 2
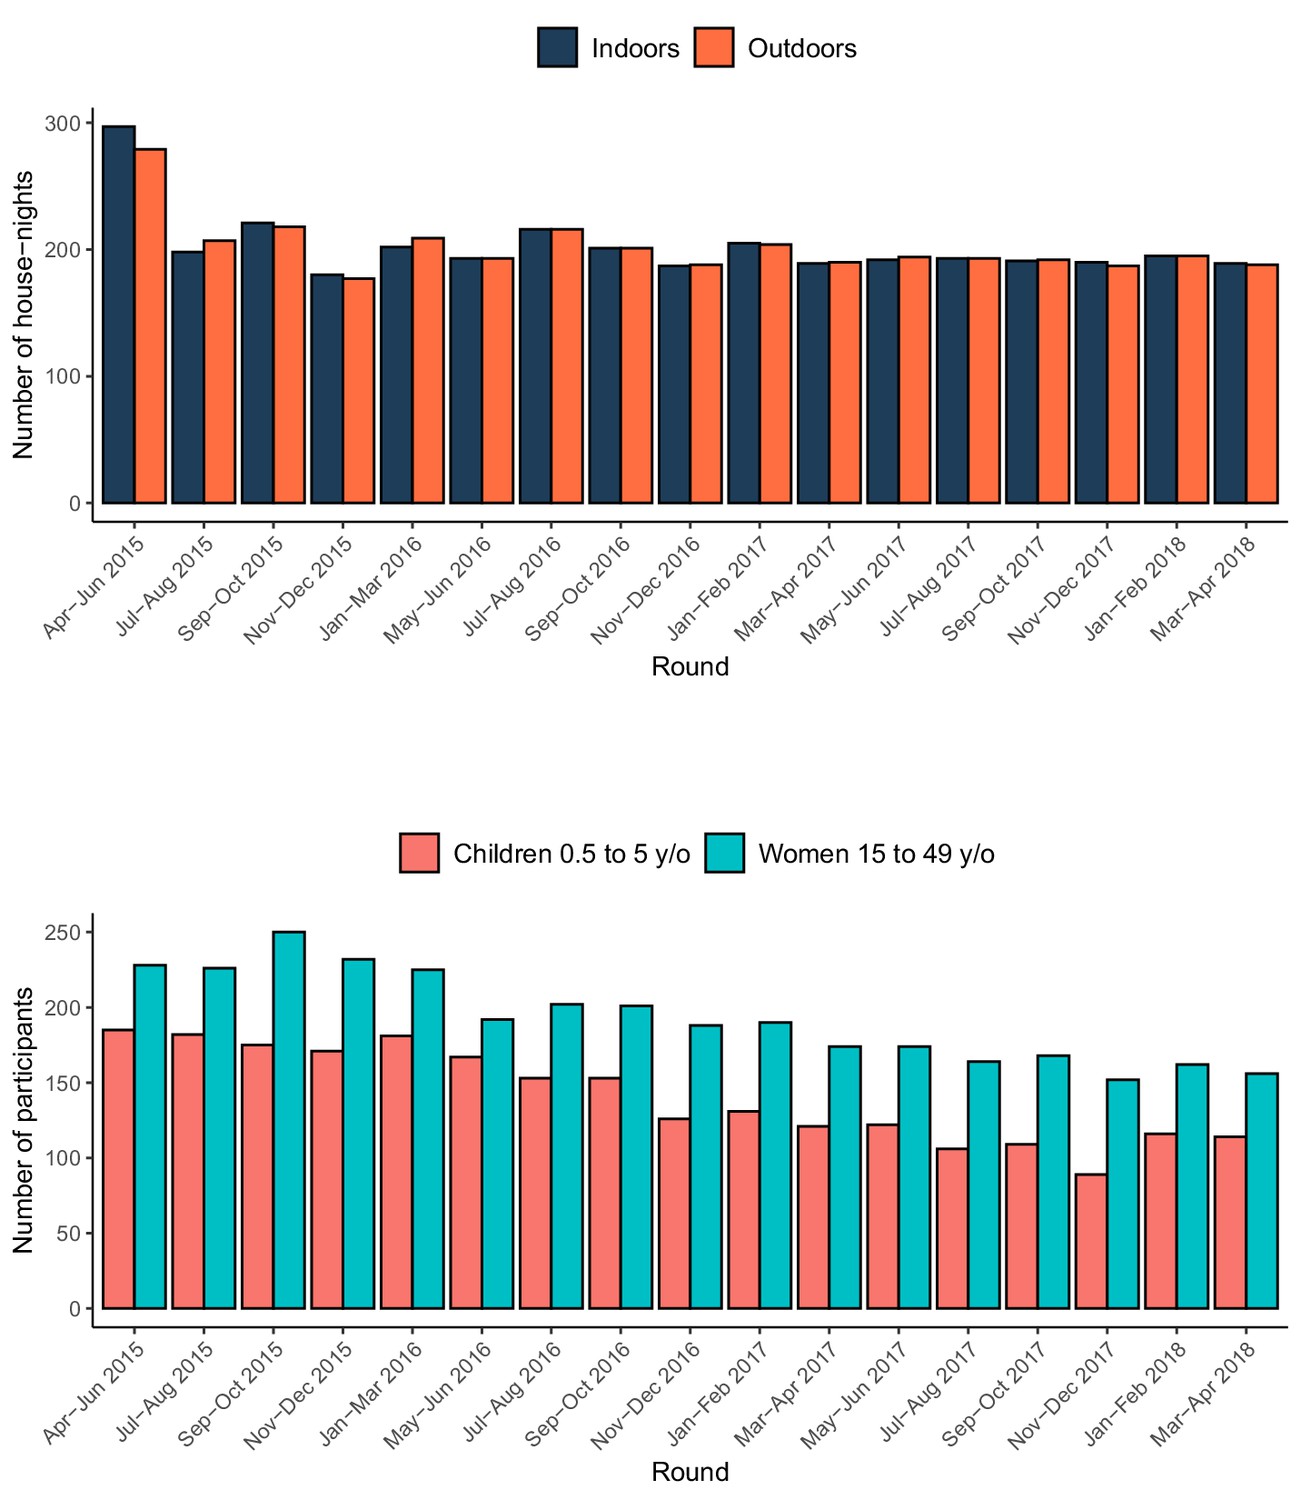
Summary of the entomological and rMIS sampling over time.
The top panel shows the number of houses where Suna traps were set, and the bottom panel shows the number of participants in the rMIS.
Figure 3
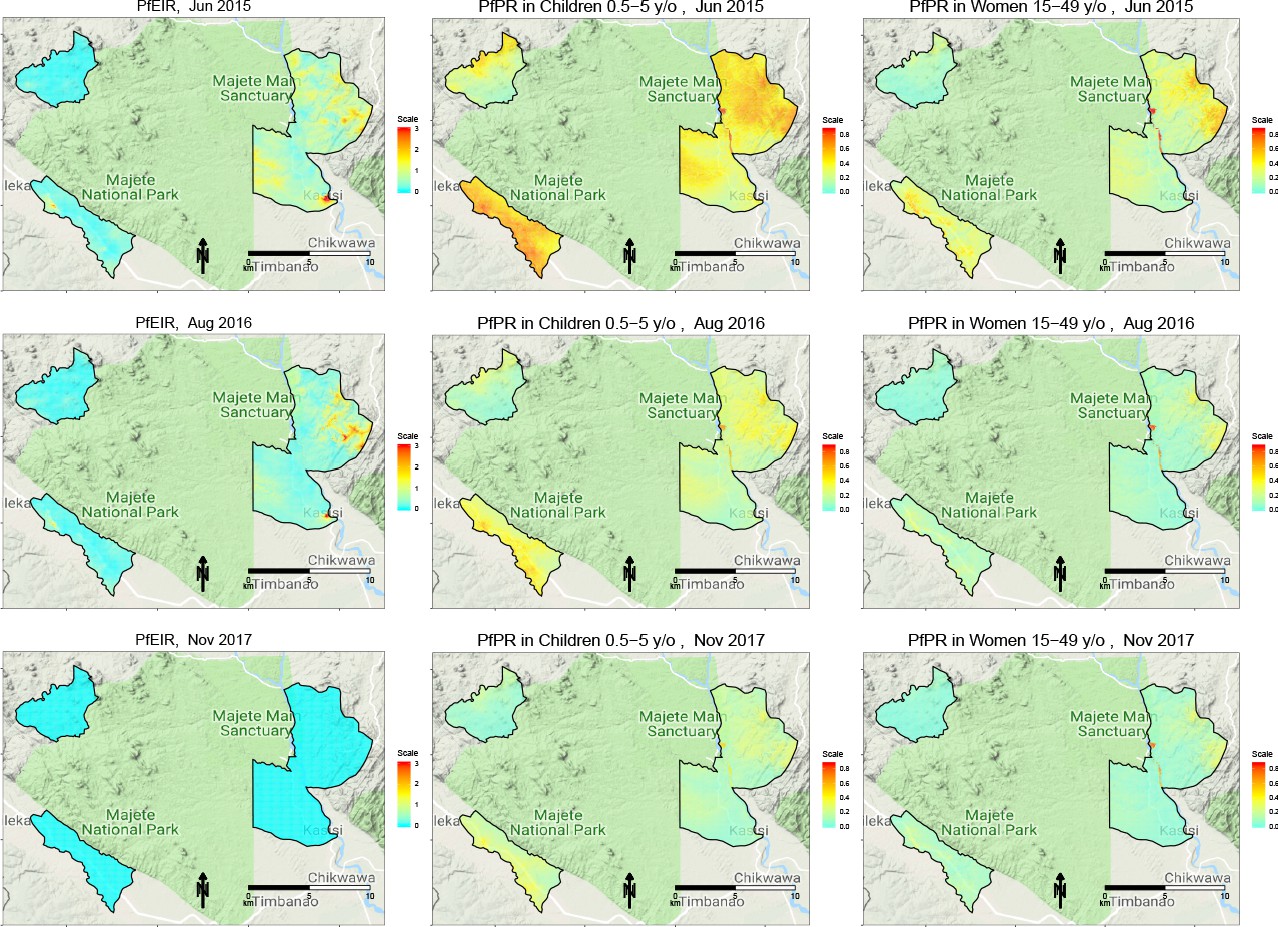
Selected predictive maps of PfEIR and PfPR for June 2015, August 2016 and November 2017, representing high, medium, and low transmission months, respectively.
Left panels: median P. falciparum entomological inoculation rate (PfEIR). Centre panel: mean P. falciparum parasite prevalence (PfPR) in children 0.5–5 y/o. Right panel: mean PfPR in women 15–49 y/o.
Figure 4
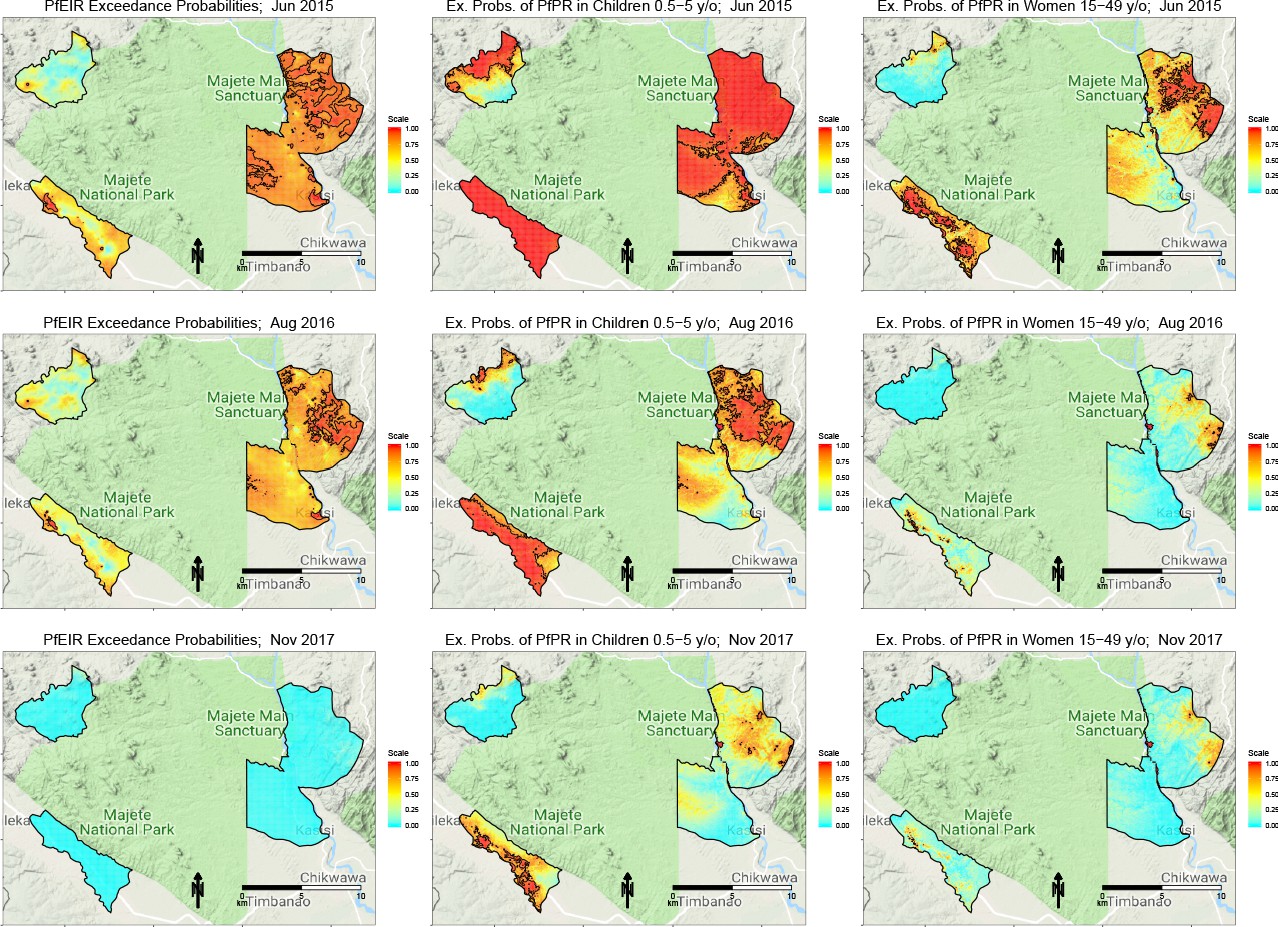
Selected maps of exceedance probability of PfEIR and PfPR for June 2015, August 2016 and November 2017, representing high, medium, and low transmission months, respectively.
Left panels: probability that PfEIR exceeds 0.1 infective bites/person/month. Centre panels: probability that PfPR in children 0.5–5 y/o exceeds 31%. Right panels: probability that PfPR in women 15–49 y/o exceeds 17%. Red areas demarcate hotspots, which we define as an exceedance probability at least 0.9.
Figure 5
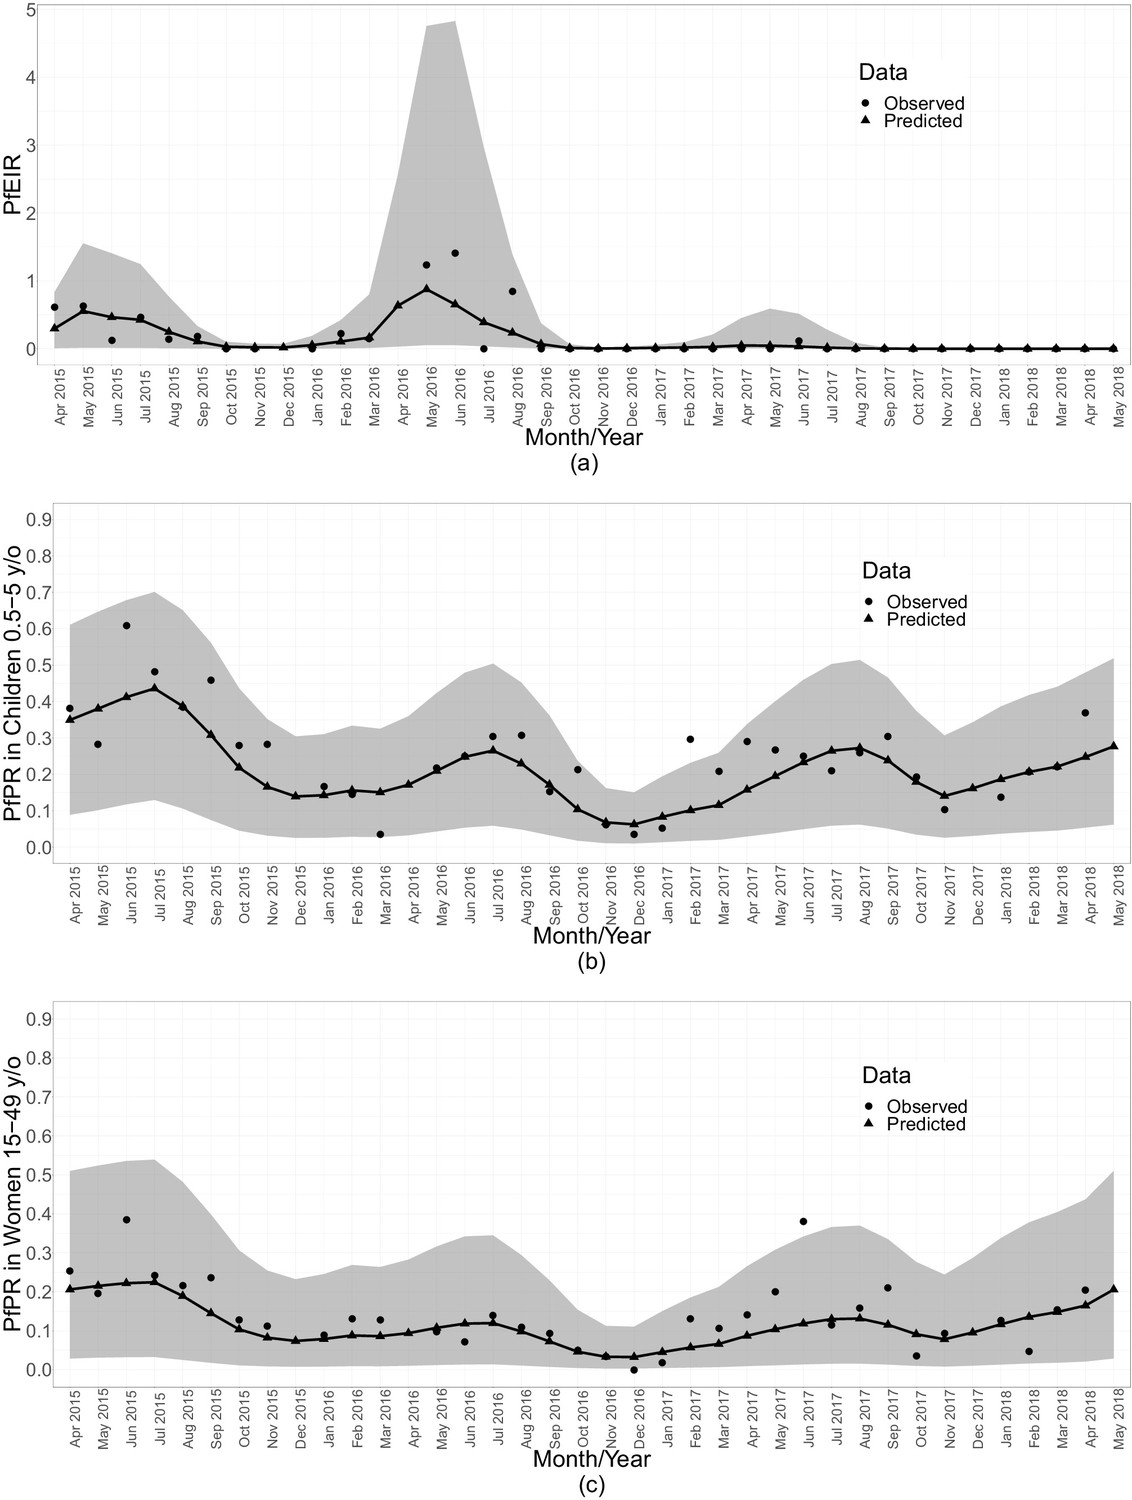
Summaries of monthly PfEIR and PfPR.
The plot shows monthly median PfEIR (a), mean PfPR in children 0.5–5 y/o (b) and mean PfPR in women 15–49 y/o (c), over the study region. The round points are the observed data and the triangular points are the predictions from our models. The shaded regions represent the corresponding 95% confidence interval of the predicted values. The confidence intervals were obtained by simulating 10,000 samples of the respective metric under the respective fitted model.
Figure 6
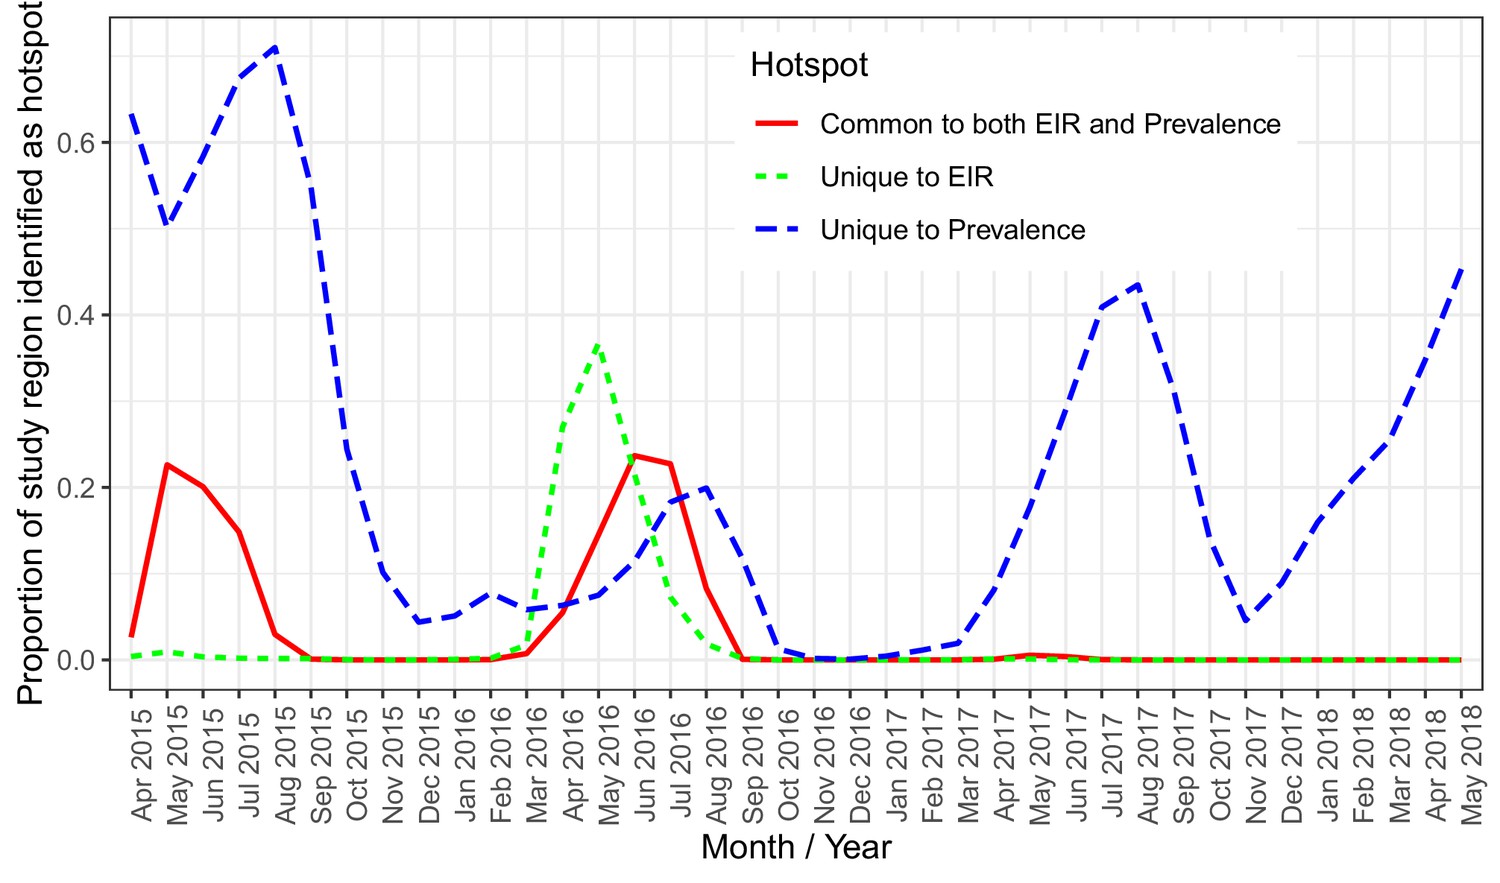
A plot of the proportion of the study region demarcated as hotspot.
The solid (red) line shows hotspots identified by both PfPR and PfEIR. The long dashed (blue) line shows hotspots identified uniquely by PfPR whilst the short dashed (green) line shows hotspot uniquely identified by PfEIR.
Figure 7
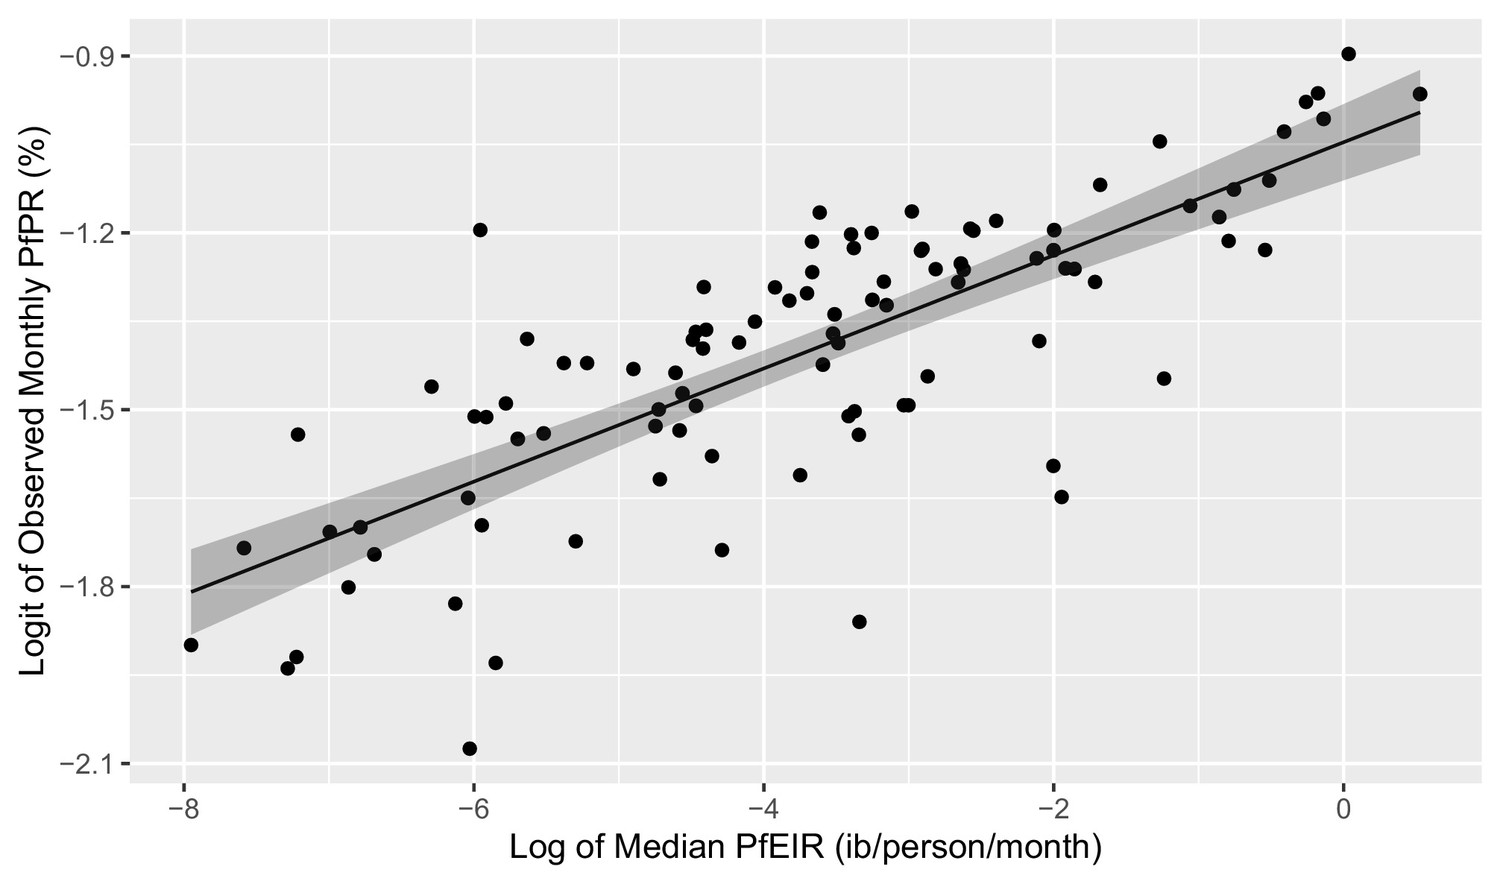
Plot of the linear relationship between the logit of PfEIR and the log of PfEIR.
Each point represents a focal area and a month where there was empirical data for PfPR (n=100). PfEIR is the median (model-based predicted) PfEIR over the focal area. Prevalence is the average empirical prevalence over the focal area, with children and women put together. The shaded regions represent the corresponding 95% confidence region. The confidence region was obtain from 10,000 predictive samples where each sample was obtained by plugging in one of the bootstrap samples parameter estimate into the logit-linear model.
Figure 8
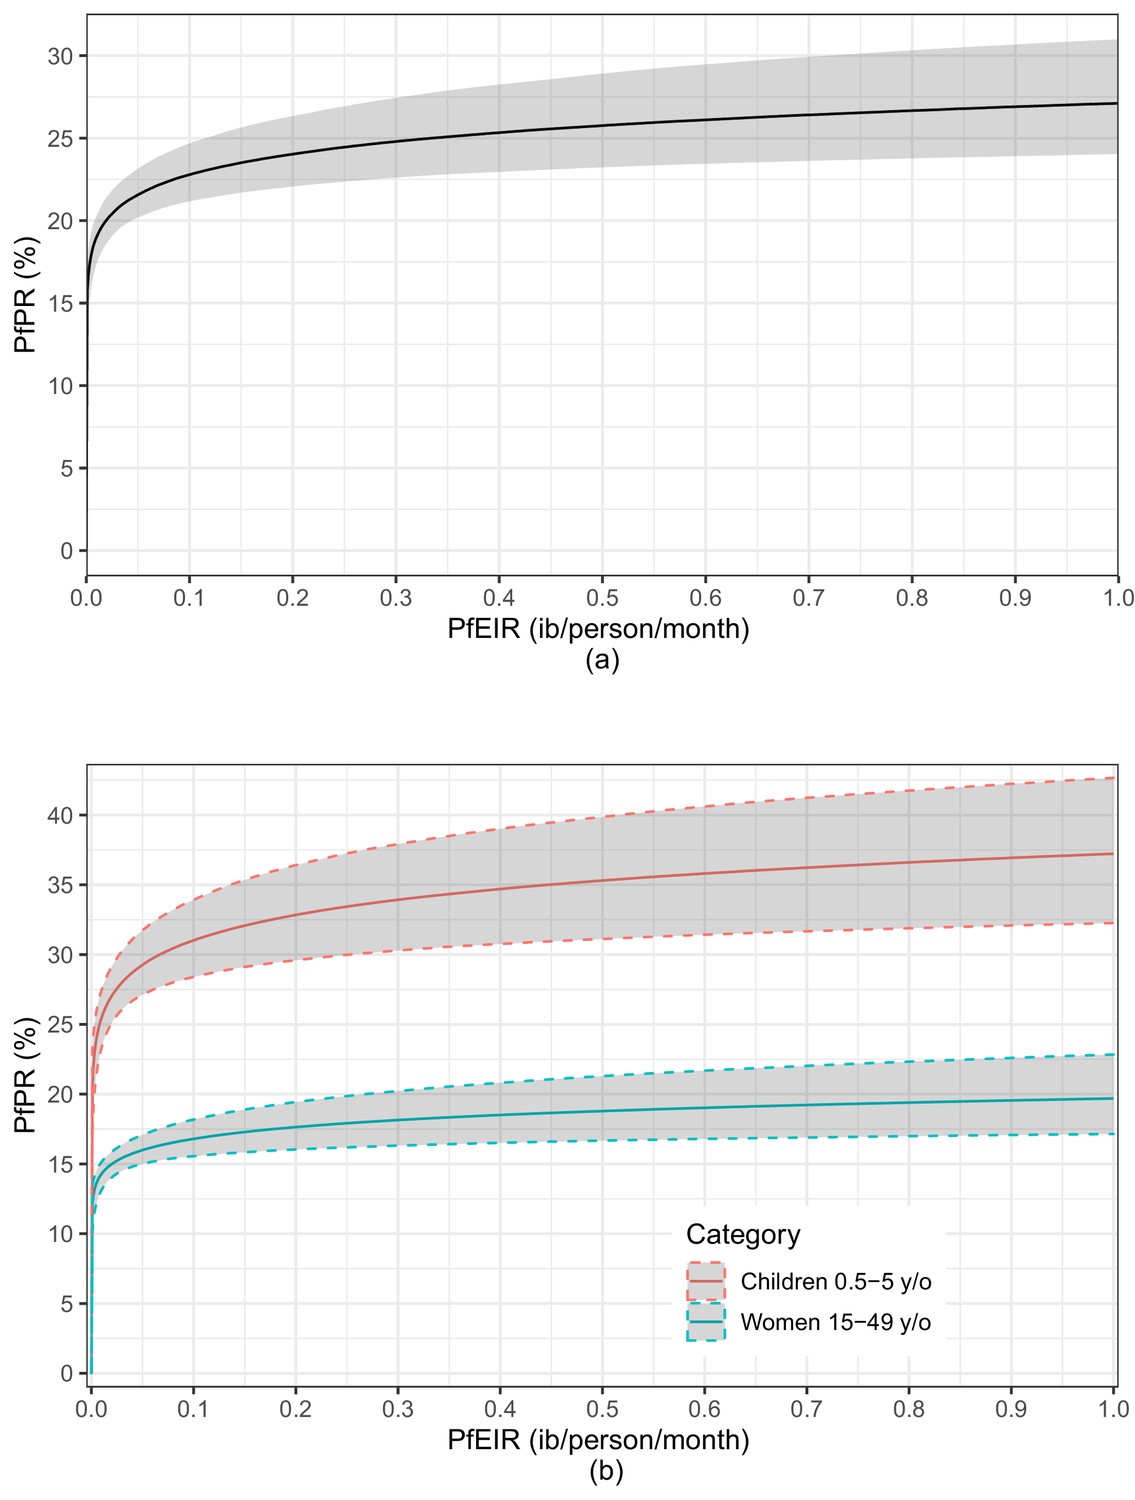
A plot of the estimated logit-linear relationship between PfPR and PfEIR.
The solid lines are the estimated relationships and the shaded areas are the associated 95% confidence region for children and women combined (a) and for children and women separately (b). The shaded regions represent the corresponding 95% confidence region. The confidence regions were obtain from 10,000 predictive samples where each sample was obtained by plugging in one of the bootstrap samples parameter estimate into the logit-linear model.
Appendix 1—figure 1
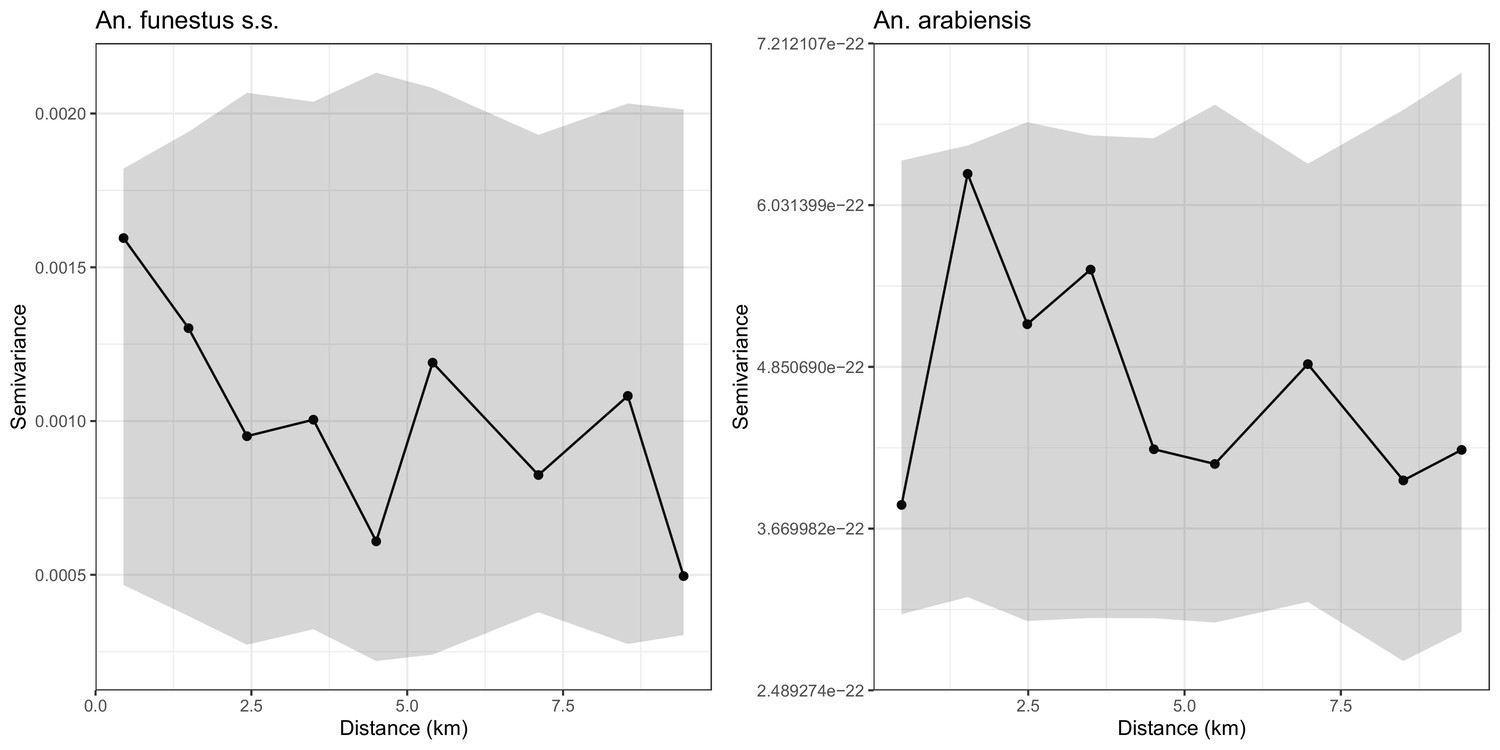
Empirical variograms (Solid lines) and 95% confidence regions (grey areas) developed by randomly pairing locations, that is, assuming that there is no residual spatial correlation in the sporoziote rate data of An funestus s.s. (left panel) and An arabiensis (right panel).
The variograms lie entirely within the respective 95% confidence regions, indicating that there is no residual spatial correlation.
Tables
Table 1
Details of Anopheles female mosquitoes collected.
The table shows the observed numbers collected indoors and outdoors, the HBR (number collected per trap multiplied by the number of days in each of the 38 months of sampling), PfSR and PfEIR for the Anopheles species sampled.
| Species | Number | Number | Empirical | Empirical | Empirical |
|---|---|---|---|---|---|
| Collected | Collected | HBR | PfSR | PfEIR | |
| Indoors | Outdoors | (bite/person) | % | (ib/person) | |
| A. arabiensis | 175 | 263 | 73.66 | 5.48% | 4.04 |
| A. funestus s.s. | 74 | 96 | 28.58 | 11.17% | 3.19 |
| A. gambiae s.s. | 5 | 6 | 1.85 | 18.18% | 0.34 |
| A. quadriannulatus | 1 | 3 | 0.67 | 0.00% | 0.00 |
| A. gambiae s.l.* | 12 | 13 | 4.20 | 12.00% | 0.50 |
| A. funestus s.l.** | 4 | 5 | 1.51 | 11.11% | 0.17 |
| TOTAL | 271 | 386 | 110.47 | 8.24 |
-
A. gambiae s.l. * and A. funestus s.l. ** are Anopheles female mosquitoes morphologically identified as belonging to the A. gambiae species complex and A. funestus species group, respectively, but which could not be further identified by PCR. The unit of EIR is infective bites per person over the course of the study (38 months).
-
Table 1—source data 1
Source data of the details of Anopheles female mosquitoes collected.
- https://cdn.elifesciences.org/articles/65682/elife-65682-table1-data1-v1.xlsx
Appendix 1—table 1
Range of days prior to data collections over which temperature and relative humidity were averaged.
| To | 0 | 3 | 5 | 7 | 14 | 21 | 28 | 35 | 42 | |
|---|---|---|---|---|---|---|---|---|---|---|
| From | ||||||||||
| 0 | ✓* | ✓ | ✓ | ✓ | ✓ | ✓ | ✓ | ✓ | ✓ | |
| 3 | ✓ | ✓ | ✓ | ✓ | ✓ | ✓ | ✓ | |||
| 5 | ✓ | ✓ | ✓ | ✓ | ✓ | ✓ | ||||
| 7 | ✓ | ✓ | ✓ | ✓ | ✓ | |||||
| 14 | ✓ | ✓ | ✓ | ✓ | ||||||
| 21 | ✓ | ✓ | ✓ | |||||||
| 28 | ✓ | ✓ | ||||||||
| 35 | ✓ |
-
*The check marks indicate the days from/to which temperature and relative humidity were averaged.
Appendix 1—table 2
Regression table for the A. arabiensis human biting rate model.
| Variable | Description | Parameter | Point estimate |
|---|---|---|---|
| Covariates | |||
| A binary indicator taking the value 1 if location | −13.525 | ||
| belongs to Focal Area A and 0 otherwise. | (−16.217,–10.833)* | ||
| A binary indicator taking the value 1 if location | −9.995 | ||
| belongs to Focal Area B and 0 otherwise. | (−12.656,–7.333) | ||
| A binary indicator taking the value 1 if location | −10.848 | ||
| belongs to Focal Area C and 0 otherwise. | (−13.514,–8.182) | ||
| A binary indicator taking the value 1 if the mosquito | 0.456 | ||
| trap was set indoors and 0 otherwise. | (0.264, 0.647) | ||
| Distance from location to the closest small river | 0.631 × 10⁻³ | ||
| ( 0.143, 1.120 ) × 10−3 | |||
| Average relative humidity 14 to 35 days prior to the | 0.056 | ||
| data collection. | (0.038, 0.073) | ||
| The effect of temperature when temperature is | 0.180 | ||
| below 22.9°C. | (0.072, 0.289) | ||
| The effect of temperature when temperature is | −0.132 | ||
| 22.9°C or higher. | (−0.22,–0.044) | ||
| Seasonality and Trends | |||
| −0.291 | |||
| (−0.907, 0.325) | |||
| 1.092 | |||
| (−0.759, 2.943) | |||
| Spatial Correlation | |||
| Signal variance | 4.114 | ||
| (3.262, 5.189) | |||
| Scale (km) | 0.649 | ||
| (0.492, 0.856) | |||
| Nugget variance | 0.162 | ||
| (0.124, 0.21) |
-
Dependent Variable: log of A. funestus mosquito density.
*95% confidence intervals are in brackets.
Appendix 1—table 3
Regression table for the A. funestus human biting rate model.
| Variable | Description | Parameter | Point estimate |
|---|---|---|---|
| Covariates | |||
| Intercept | 2.523 | ||
| (−3.209, 8.256)* | |||
| Elevation of the location . | −5.583 × 10⁻³ | ||
| (−7.896,–3.271) × 10−3 | |||
| Distance from location to the nearest small river. | 2.993 × 10⁻³ | ||
| (2.329, 3.658) × 10−3 | |||
| Normalized difference vegetation index at | 1.392 | ||
| location . | (−1.251, 4.035) | ||
| Average temperature one week prior to data | −0.154 | ||
| collection. | (−0.279,–0.028) | ||
| Average temperature 7 to 14 days prior to data | −0.116 | ||
| collection. | (−0.295, 0.064) | ||
| Average relative humidity 14 to 21 days prior to data | −0.043 | ||
| collection. | (−0.078,–0.008) | ||
| Seasonality and Trends | |||
| −0.291 | |||
| (−0.907, 0.325) | |||
| 1.092 | |||
| (−0.759, 2.943) | |||
| −0.291 | |||
| (−0.907, 0.325) | |||
| 1.092 | |||
| (−0.759, 2.943) | |||
| Spatial Correlation | |||
| Signal variance | 4.456 | ||
| (3.379, 5.876) | |||
| Scale (km) | 0.906 | ||
| (0.66, 1.245) | |||
| Nugget variance | 0.142 | ||
| (0.105, 0.191) |
-
Dependent Variable: log of A. funestus mosquito density
*95% confidence intervals are in brackets.
Appendix 1—table 4
Regression table from fitting the P. falciparum sporozoite rate models.
| Variable | Description | Parameter | A. funestus s.s. | A. arabiensis |
|---|---|---|---|---|
| Covariates | ||||
| Intercept | 0.139 | −3.392 | ||
| (−7.793, 8.071)* | (−4.772,–2.125) | |||
| Distance from location to the nearest small | −1.945 × 10⁻³ | — | ||
| river. | (−3.345,–0.545) × 10−3 | |||
| Distance from location to the nearest large | −4.309 × 10⁻³ | — | ||
| river. | (−7.499,–1.119) | |||
| Elevation of location . | 7.786 × 10⁻³ | — | ||
| (5.819, 9.752) × 10−3 | ||||
| Enhanced vegetation index of location . | −36.648 | — | ||
| (−65.090,–8.206) | ||||
| Seasonality | ||||
| and Trends | ||||
| −0.378 | −0.253 | |||
| (−0.565,–0.19) | (−0.882, 0.375) | |||
| −0.722 | −0.867 | |||
| (−0.954,–0.489) | (−1.864, 0.13) | |||
| −0.056 | 0.027 | |||
| (−0.072,–0.041) | (−0.086, 0.140) | |||
| 0.061 | −0.089 | |||
| (0.039, 0.084) | (−0.305, 0.127) |
-
Dependent Variables: logits of the probability that a mosquito tests positive for sporozoites
*95% confidence intervals are in brackets.
Appendix 1—table 5
Regression table for the P. falciparum parasite rate model.
| Variable | Description | Parameter | Children under 5 Y/o | Women 15-49 Y/o |
|---|---|---|---|---|
| Covariates | ||||
| A binary indicator taking the value 1 if | 0.685 | −0.506 | ||
| belongs to Focal Area A and 0 otherwise. | ( −1.877 , 3.247 ) | ( −3.166 , 2.155 ) | ||
| A binary indicator taking the value 1 if | 2.829 | 2.568 | ||
| belongs to Focal Area B and 0 otherwise. | ( 0.41 , 5.248 ) | ( 0.134 , 5.002 ) | ||
| A binary indicator taking the value 1 if | 3.192 | 2.641 | ||
| belongs to Focal Area C and 0 otherwise. | ( 0.806 , 5.577 ) | ( 0.224 , 5.058 ) | ||
| Elevation of the location . | 5.165 × 10⁻³ | 5.920 × 10⁻³ | ||
| ( 2.322 , 8.008 ) × 10−3 | ( 3.039 , 8.800 ) × 10−3 | |||
| Distance from location to the nearest | −0.372 × 10⁻³ | −0.181 × 10⁻³ | ||
| large river. | ( −0.522 , −0.222) × 10−3 | ( −0.353,–0.009) × 10−3 | ||
| Average temperature 14 to 42 days prior to | −0.112 | −0.096 | ||
| data collection. | ( −0.201 , −0.023 ) | ( −0.187 , −0.005 ) | ||
| Normalized difference vegetation index at | −2.424 | −5.556 | ||
| location . | ( −4.703 , −0.144 ) | ( −7.63 , −3.482 ) | ||
| Wealth index of the -th household. | −0.212 | −0.159 | ||
| ( −0.283 , −0.141 ) | ( −0.215 , −0.102 ) | |||
| Seasonality | ||||
| and Trends | ||||
| −0.079 | −0.079 | |||
| ( −0.098 , −0.06 ) | ( −0.1 , −0.059 ) | |||
| 0.072 | 0.086 | |||
| ( 0.042 , 0.102 ) | ( 0.056 , 0.117 ) | |||
| −0.045 | 0.101 | |||
| ( −0.265 , 0.175 ) | ( −0.123 , 0.324 ) | |||
| 0.209 | 0.175 | |||
| ( −0.138 , 0.556 ) | ( −0.173 , 0.523 ) | |||
| Spatial Correlation | ||||
| Signal variance | 0.347 | 0.602 | ||
| ( 0.222 , 0.542 ) | ( 0.416 , 0.872 ) | |||
| Scale (km) | 1.175 | 1.055 | ||
| ( 0.617 , 2.238 ) | ( 0.631 , 1.765 ) | |||
| Nugget variance | 1.546 | 1.368 | ||
| ( 0.956 , 2.500) | ( 0.932 , 2.007 ) |
-
S.I. denotes supper infection and D.I/R denotes different infection/recovery rates for children and women. 95% confidence intervals are in brackets. RMSE is the root-mean-square error.
Appendix 1—table 6
Parameter estimates from the models for the relationship between PfEIR and PfPR where PfEIR has a month’s lag effect on PfPR.
The models’ predictive abilities are assessed by the root-mean-square error (RMSE) and bias.
| Model | RMSE | Bias | ||||
|---|---|---|---|---|---|---|
| 1. SIS | 7.02 | 0.361 | ||||
| (3.906, 12.284) | ||||||
| 2. SIS with D.I/R | 107.208 | 0.762 | 0.353 | |||
| (0.088, 381.139) | (0.485, 24.344) | |||||
| 3. SIS with S.I. | 1.728 | 0.351 | ||||
| (0.638, 3.087) | ||||||
| 4. SIS with S.I. and D.I/R | 22.603 | 0.471 | 0.392 | |||
| (0.128, 67.048) | (0.234, 7.02) | |||||
| a | b | |||||
| 5. Beier | 0.253 | 0.013 | 0.328 | |||
| (0.232, 0.283) | (0.009, 0.021) | |||||
| 6. Logit-linear | -0.986 | 0.100 | 0.327 | |||
| (-1.160, -0.804) | (0.062, 0.147) | |||||
| Logit-linear for children only | -0.523 | 0.119 | ||||
| (-0.742, -0.296) | (0.073, 0.174) | |||||
| Logit-linear for women only | -1.427 | 0.083 | ||||
| (-1.575, -1.218) | (0.046, 0.133) |
Additional files
Download links
A two-part list of links to download the article, or parts of the article, in various formats.
Downloads (link to download the article as PDF)
Open citations (links to open the citations from this article in various online reference manager services)
Cite this article (links to download the citations from this article in formats compatible with various reference manager tools)
Identifying Plasmodium falciparum transmission patterns through parasite prevalence and entomological inoculation rate
eLife 10:e65682.
https://doi.org/10.7554/eLife.65682


