circPTPN12/miR-21–5 p/∆Np63α pathway contributes to human endometrial fibrosis
- Department of Obstetrics and Gynecology, The Affiliated Drum Tower Hospital of Nanjing University Medical School, China
- Center for Reproductive Medicine, Department of Obstetrics and Gynecology, The Affiliated Drum Tower Hospital of Nanjing University Medical School, China
- Department of Pathology, The Affiliated Drum Tower Hospital of Nanjing University Medical School, China
- Department of Laboratory Medicine, Jiangsu Key Laboratory for Molecular Medicine, Nanjing University Medical School, China
- Institute of Genetics and Developmental Biology, Chinese Academy of Sciences, China
- Department of Obstetrics, Gynecology and Reproductive Sciences, Center for Reproductive Sciences, Eli and Edythe Broad Center of Regeneration Medicine and Stem Cell Research, University of California San Francisco, United States
Figures
Figure 1 with 2 supplements

Downregulation of miR-21–5 p in endometria of IUA patients promotes EEC–EMT.
(A) Volcano plots of miRNA-sequencing of the endometria from severe IUA patients (n = 3) and controls (n = 3) based on the high-throughput RNA-sequencing analysis. The red dots represent the miRNAs upregulated, and the green ones represent the downregulated (p<0.05 and fold change > 2). (B) A heatmap showing 40 upregulated and 40 downregulated miRNAs with high abundance in endometrium samples from severe IUA patients (n = 3) and controls (n = 3). (C) miR-21–5 p mRNA levels in endometria of severe IUA patients (n = 18) and controls (n = 18) determined by qRT-PCR. (D) Representative images of RNA-scope assay using specific probes to detect miR-21–5 p in the endometria of severe IUA patients (n = 3) and controls (n = 3). Peptidylprolyl isomerase B (PPIB) serves as the positive control. Arrowhead: epithelial cells; arrow (red dots): PPIB or miR-21–5 p positive dots. Scale bars 50 μm. (E) Left: fibronectin (FN), α-smooth muscle actin (α-SMA), E-cadherin (E-cad), N-cadherin (N-cad), and GAPDH protein levels determined by western blotting in miR-21–5 p inhibitor (inh-21)- or negative control (inh-NC)-transfected (48 hr) EECs (n = 3). Right: The quantitative band intensities determined by image J software. (F) Left: FN, α-SMA, E-cad, N-cad, and GAPDH protein levels determined by immunoblotting in miR-21–5 p mimic (miR-21)- or negative control (miR-NC)-transfected (48 hr) EECs (n = 3). Right: The quantitative band intensities determined by image J software. The error bars in (C), (E), and (F) indicate mean ± SD. **p<0.01, ****p<0.0001.
-
Figure 1—source data 1
qRT-PCR data for miR-21–5 p relative expression.
- https://cdn.elifesciences.org/articles/65735/elife-65735-fig1-data1-v1.xlsx
-
Figure 1—source data 2
Uncropped western blots for Figure 1E.
- https://cdn.elifesciences.org/articles/65735/elife-65735-fig1-data2-v1.pdf
-
Figure 1—source data 3
The quantitative band intensities for Figure 1E.
- https://cdn.elifesciences.org/articles/65735/elife-65735-fig1-data3-v1.xlsx
-
Figure 1—source data 4
Uncropped western blots for Figure 1F.
- https://cdn.elifesciences.org/articles/65735/elife-65735-fig1-data4-v1.pdf
-
Figure 1—source data 5
The quantitative band intensities for Figure 1F.
- https://cdn.elifesciences.org/articles/65735/elife-65735-fig1-data5-v1.xlsx
Figure 1—figure supplement 1

miRNAs expression profile.
(A) Representative images of Masson staining in endometrium samples used for high-throughput sequencing from severe IUA patients (n = 3) and controls (n = 3). Scale bars, 50 μm. Arrow head: luminal epithelial cells; arrow: glandular epithelial cells. (B) A heatmap showing all dysregulated miRNAs (56 upregulated and 150 downregulated) in endometrium samples from severe IUA patients (n = 3) and controls (n = 3). (C) Validation of top three most upregulated and three most downregulated miRNAs in the endometria of severe IUA patients (n = 18) and controls (n = 18) by qRT-PCR. Error bars indicate mean ± SD. **p<0.01, ****p<0.0001.
Figure 1—figure supplement 2
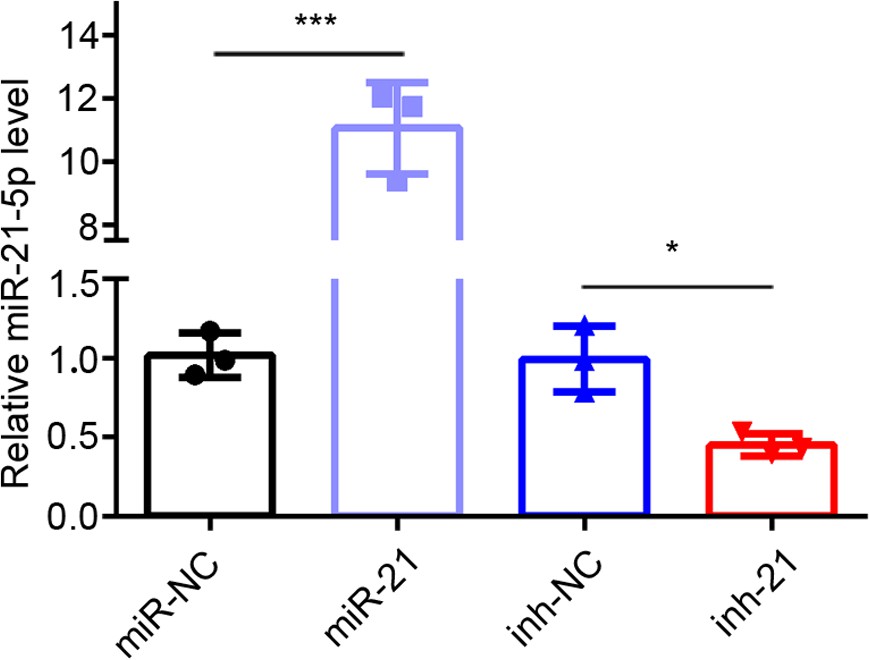
miR-21–5 p transfection efficiency.
qRT-PCR analysis of miR-21–5 p level in EECs transfected with miR-21–5 p mimic (n = 3) or inhibitor (n = 3) for 48 hr. Error bars indicate mean ± SD. **p<0.01, ****p<0.0001.
Figure 2 with 1 supplement
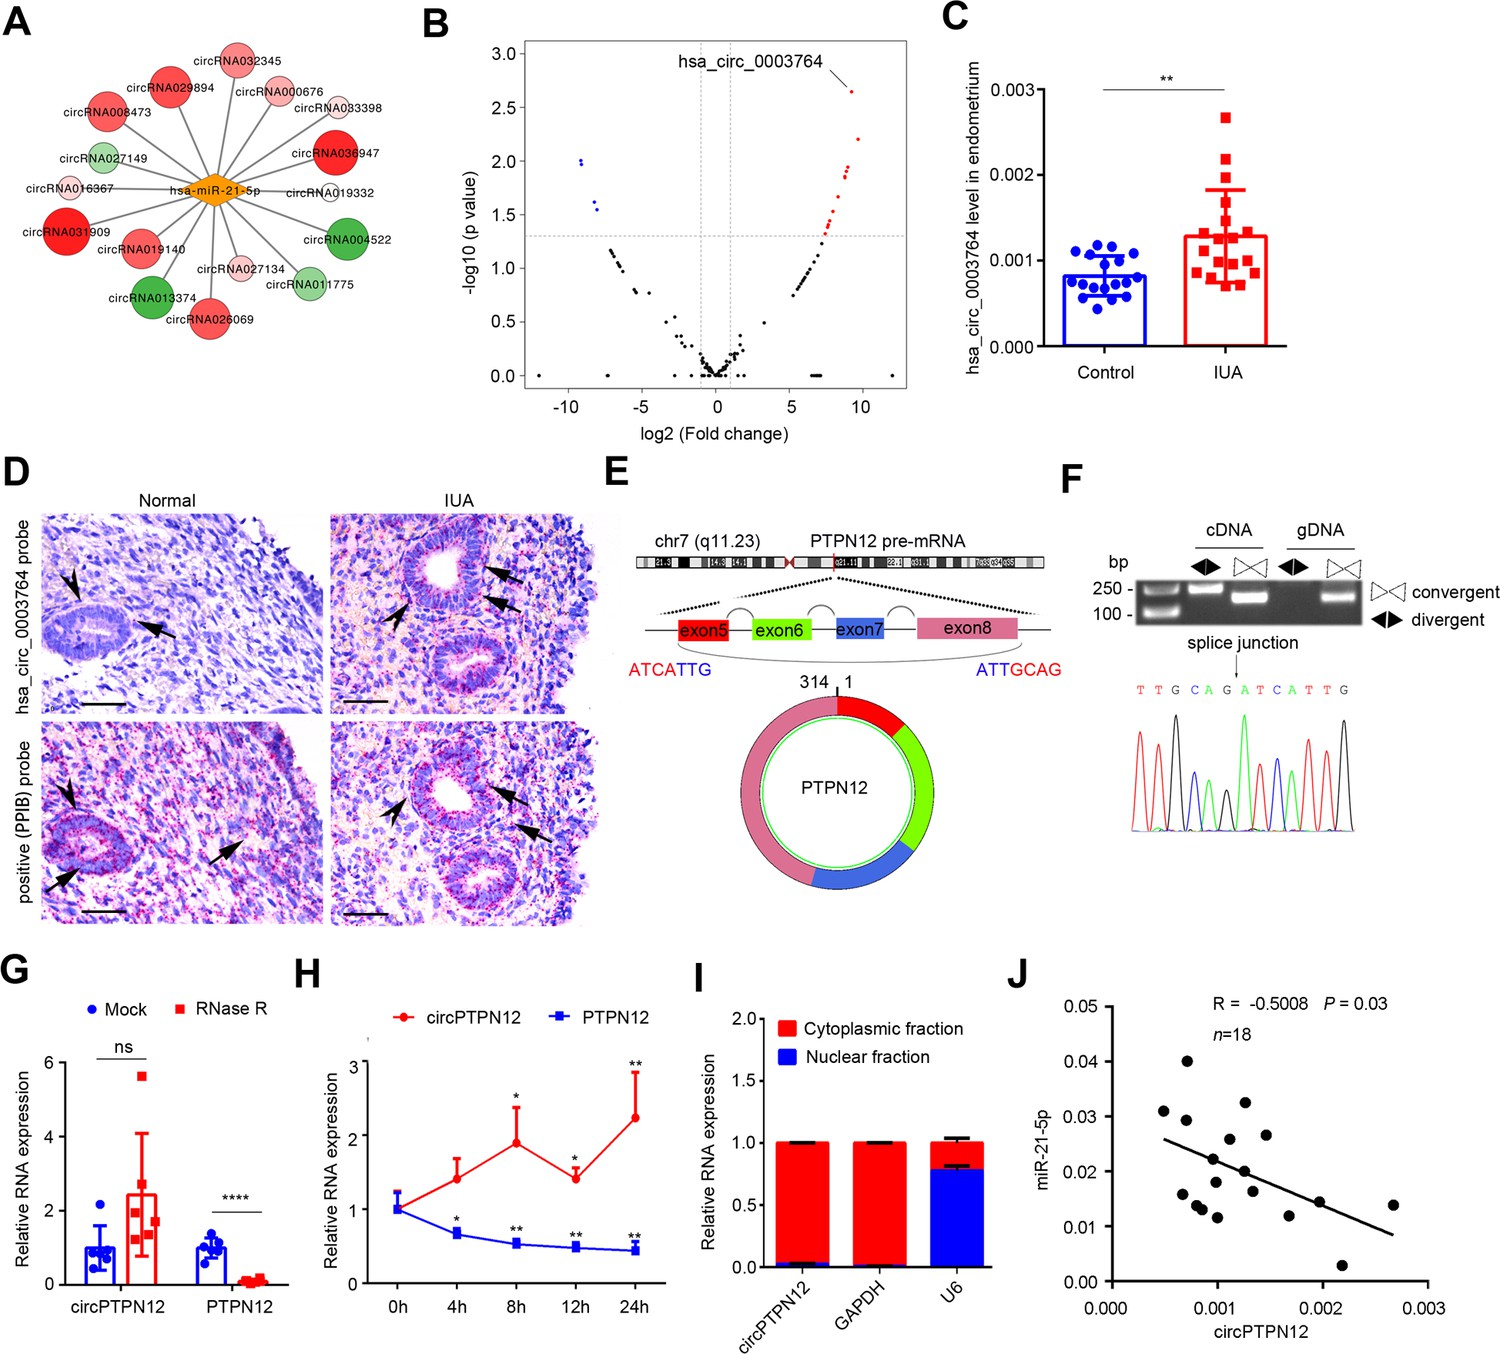
Upregulation of circPTPN12 in endometria of IUA patients is negatively correlated with miR-21–5 p.
(A) Network diagram of circRNAs that have binding sites for miR-21–5 p and that significantly express in the endometria from severe IUA patients (n = 3) and controls (n = 3) based on the high-throughput RNA-sequencing analysis. (B) Volcano plots of circRNAs possessing binding sites for miR-21–5 p in the endometria from severe IUA patients (n = 3) and controls (n = 3) based on the high-throughput RNA-sequencing analysis. The red dots represent the circRNAs upregulated, and the blue dots represent the circRNAs downregulated (p<0.05 and fold change > 2). (C) Hsa_circ_0003764 expression levels in endometria of severe IUA patients (n = 18) and controls (n = 18) determined by qRT-PCR. (D) Representative images of RNA-scope assay using specific probes to detect hsa_circ_0003764 in the endometria of severe IUA patients (n = 3) and controls (n = 3). Peptidylprolyl isomerase B (PPIB) serves as the positive control. Arrowhead: epithelial cells; arrow (red dots): PPIB or has_circ_0003764 positive dots. Scale bars 50 μm. (E) Schematic illustration of the genomic loci of tyrosine-protein phosphatase non-receptor type 12 (PTPN12) gene and the cyclization of circPTPN12. (F) Verification of circPTPN12 in endometria. Top: Agarose gel electrophoresis shows that divergent primers amplified circPTPN12 in complementary DNA (cDNA) but not in genomic DNA (gDNA). Bottom: Sanger sequencing of the amplified band with divergent primers shows the spliced junction of circPTPN12. (G) qRT-PCR analysis of circPTPN12 and PTPN12 mRNA levels in total RNA extracted from endometria of severe IUA patients (n = 6) with or without RNase R treatment. (H) qRT-PCR analysis of circPTPN12 and PTPN12 mRNA levels in EECs (n = 4) treated with actinomycin D at the indicated time points. (I) circPTPN12 expression level in the nuclear and cytoplasmic fractions of EECs (n = 4) determined by qRT-PCR. (J) The correlation of circPTPN12 and miR-21–5 p in endometria of IUA patients (n = 18). Spearman’s correlation coefficient R = –0.5008, p=0.03. (C), (G), and (H) Error bars indicate mean ± SD. No statistical difference (ns), *p<0.05, **p<0.01, ****p<0.0001.
-
Figure 2—source data 1
qRT-PCR data for hsa_circ_0003764 relative expression.
- https://cdn.elifesciences.org/articles/65735/elife-65735-fig2-data1-v1.xlsx
-
Figure 2—source data 2
Uncropped gels for Figure 2F.
- https://cdn.elifesciences.org/articles/65735/elife-65735-fig2-data2-v1.pdf
-
Figure 2—source data 3
qRT-PCR data for circPTPN12 and PTPN12 relative expression with or without RNase R treatment.
- https://cdn.elifesciences.org/articles/65735/elife-65735-fig2-data3-v1.xlsx
-
Figure 2—source data 4
qRT-PCR data for circPTPN12 and PTPN12 relative expression with actinomycin D at the indicated time points.
- https://cdn.elifesciences.org/articles/65735/elife-65735-fig2-data4-v1.xlsx
-
Figure 2—source data 5
qRT-PCR data for circPTPN12, GAPDH, and U6 relative expression in the nuclear and cytoplasmic fractions of EECs.
- https://cdn.elifesciences.org/articles/65735/elife-65735-fig2-data5-v1.xlsx
Figure 2—figure supplement 1
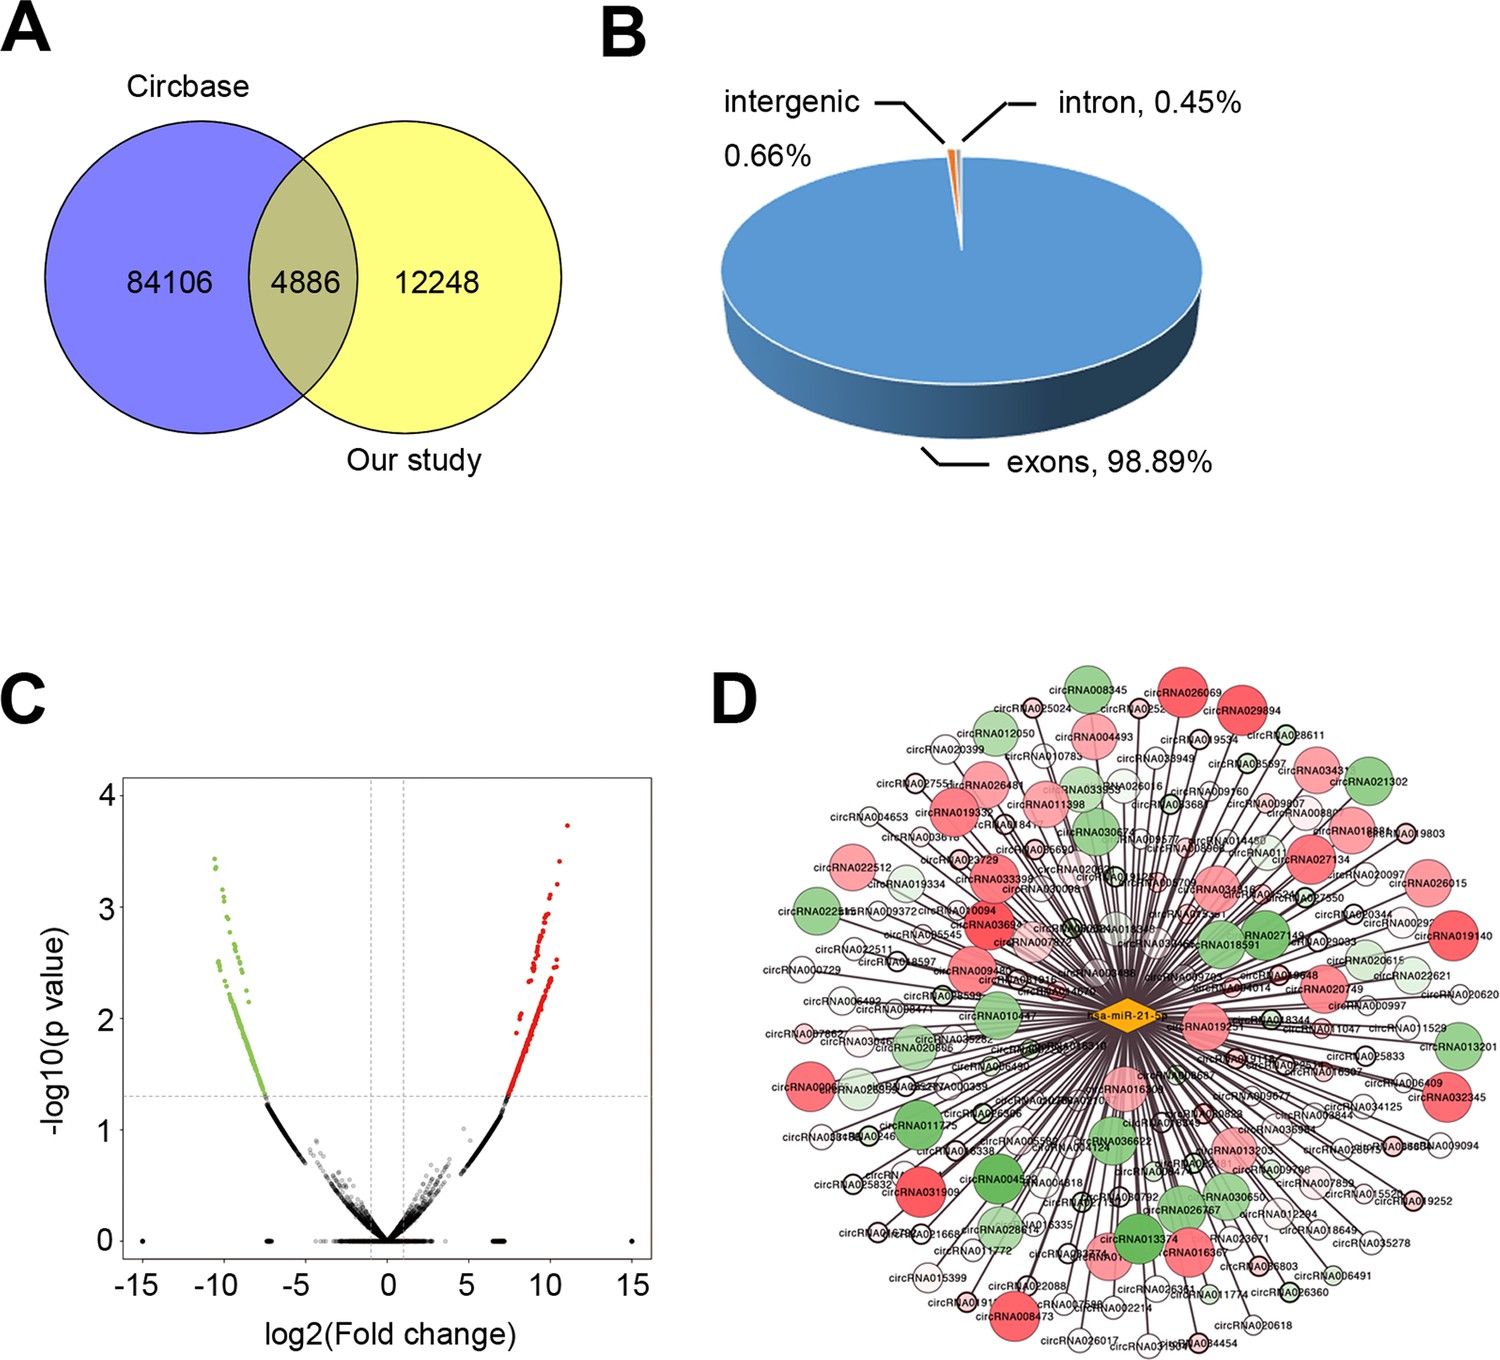
circRNAs expression profile.
(A) Venn diagram showing the intersection of the detected circRNAs in the endometria from severe IUA patients (n = 3) and controls (n = 3) based on the high-throughput RNA-seq analysis and the circRNAs already registered in the CircBase database. (B) Pie chart showing the genomic origin of the circRNAs which are detected in the endometria and have registered in the CircBase database. (C) Volcano plots of circRNA-seq of the endometria from severe IUA patients (n = 3) and controls (n = 3) based on the high-throughput RNA-sequencing analysis. The red dots represent the circRNAs upregulated, and the green ones represent the downregulated (p<0.05 and fold change > 2). (D) Network diagram of detected circRNAs possessing binding sites for miR-21–5 p.
Figure 3 with 1 supplement

circPTPN12 functions as ceRNA to sponge miR-21–5 p.
(A) qRT-PCR analysis of circPTPN12 expression level in circPTPN12 plasmid transfected (24 hr) HEK-293T cells (n = 3). (B) Capture of miR-21–5 p by circPTPN12. Top: qRT-PCR analysis of miR-21–5 p pulled down by biotin-labeled circPTPN12 (Bio-circPTPN12) or scramble (Bio-NC) probe from the HEK-293T cell lysates transfection with circPTPN12 plasmid (n = 3). Bottom: Amplified qRT-PCR products in agarose gel electrophoresis. (C) Luciferase activity of circPTPN12 in HEK-293T cells transfected with miR-21–5 p mimic (n = 6) or inhibitor (n = 6). (D) Top: Schematic diagram of three mutated sites in circPTPN12 luciferase reporter gene. Bottom: Luciferase activity of Luc-circPTPN12 containing single or all mutated sites of three putative miR-21–5 p binding sites in HEK-293T cells transfected with miR-21–5 p mimic (n = 3). (E) Simulated diagram of the exact binding sites between circPTPN12 and miR-21–5 p. (F) Enrichment of circPTPN12 and miR-21–5 p in AGO2 immunoprecipitates of HEK-293T cells transfected with circPTPN12 plasmid in agarose gel electrophoresis. (G) Colocalization between circPTPN12 and miR-21–5 p by RNA FISH in Ishikawa cells. Nuclei were stained with DAPI. Scale bar, 1 μm. (H) qRT-PCR analysis of miR-21–5 p level in adenovirus containing circPTPN12 (Ad-circPTPN12) or adenovirus containing no circPTPN12 (Ad-control) infected (48 hr) EECs (n = 5). (I) Left: FN, α-SMA, N-cad, E-cad, and GAPDH protein levels determined by western blotting in circPTPN12-infected (72 hr) EECs (n = 3). Right: The quantitative band intensities determined by image J software. (J) Left: FN, α-SMA, N-cad, E-cad, and GAPDH protein levels determined by western blotting in EECs transfected with miR-21–5 p mimic or miR-NC for 48 hr in the presence of Ad-circPTPN12 (n = 3). Right: The quantitative band intensities determined by image J software. (A) – (D) and (H) – (J) Error bars indicate mean ± SD. No statistical difference (ns), *p<0.05, **p<0.01, ***p<0.001, ****p<0.0001.
-
Figure 3—source data 1
qRT-PCR data for circPTPN12 relative expression.
- https://cdn.elifesciences.org/articles/65735/elife-65735-fig3-data1-v1.xlsx
-
Figure 3—source data 2
qRT-PCR data for miR-21–5 p relative expression.
- https://cdn.elifesciences.org/articles/65735/elife-65735-fig3-data2-v1.xlsx
-
Figure 3—source data 3
Data on luciferase activity in HEK-293T cells transfected with miR-21–5 p mimic or inhibitor.
- https://cdn.elifesciences.org/articles/65735/elife-65735-fig3-data3-v1.xlsx
-
Figure 3—source data 4
Data on luciferase activity of Luc-circPTPN12 containing single or all mutated sites of three putative miR-21–5 p binding sites in HEK-293T cells transfected with miR-21–5 p mimic.
- https://cdn.elifesciences.org/articles/65735/elife-65735-fig3-data4-v1.xlsx
-
Figure 3—source data 5
qRT-PCR data for miR-21–5 p relative expression in EECs with Ad-control or Ad-circPTPN12 treatment.
- https://cdn.elifesciences.org/articles/65735/elife-65735-fig3-data5-v1.xlsx
-
Figure 3—source data 6
Uncropped western blots for Figure 3I.
- https://cdn.elifesciences.org/articles/65735/elife-65735-fig3-data6-v1.pdf
-
Figure 3—source data 7
The quantitative band intensities for Figure 3I.
- https://cdn.elifesciences.org/articles/65735/elife-65735-fig3-data7-v1.xlsx
-
Figure 3—source data 8
Uncropped western blots for Figure 3J.
- https://cdn.elifesciences.org/articles/65735/elife-65735-fig3-data8-v1.pdf
-
Figure 3—source data 9
The quantitative band intensities for Figure 3J.
- https://cdn.elifesciences.org/articles/65735/elife-65735-fig3-data9-v1.xlsx
Figure 3—figure supplement 1
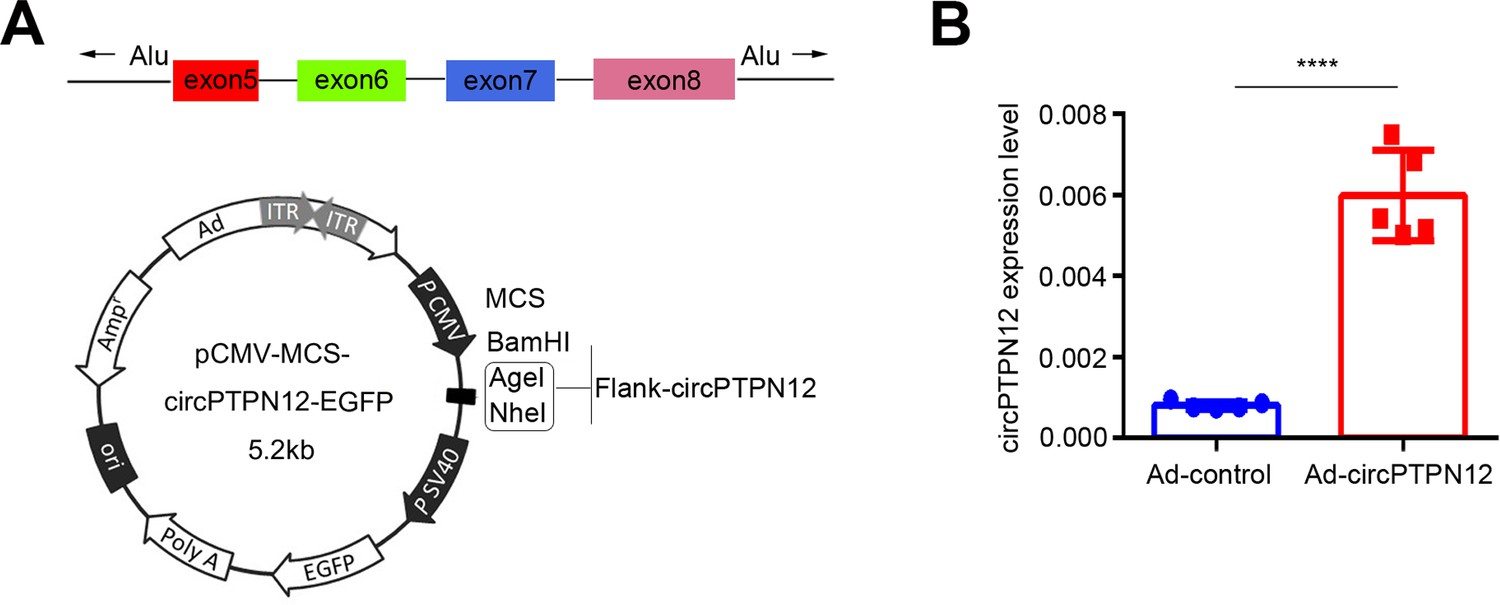
circPTPN12 adenovirus (Ad-circPTPN12) construction.
(A) Structure of Ad-circPTPN12. (B) qRT-PCR analysis of circPTPN12 level in EECs infected by Ad-circPTPN12 or Ad-control for 24 hr (n = 5). Error bars indicate mean ± SD. ****p<0.0001.
Figure 4
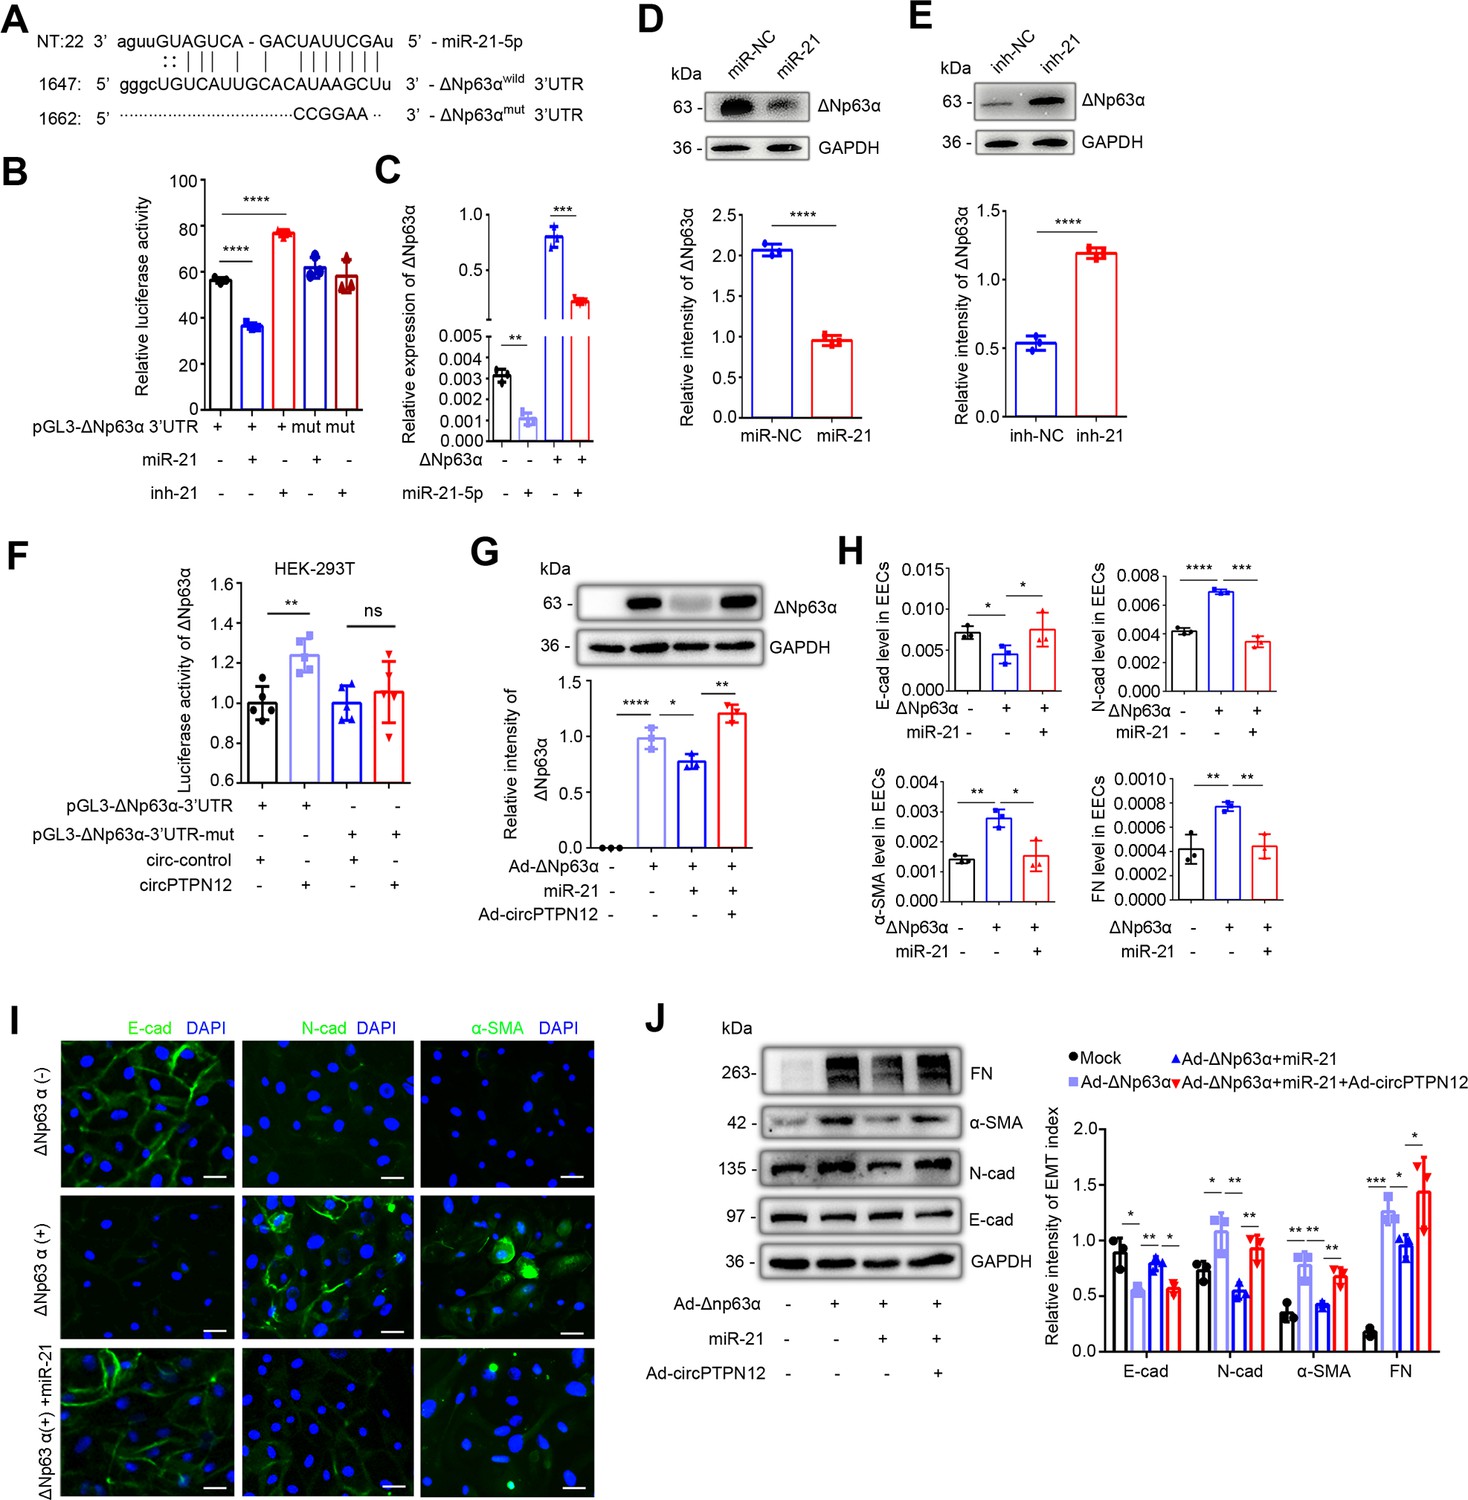
circPTPN12-downregulated miR-21–5 p promotes EEC–EMT through upregulation of ΔNp63α.
(A) The putative site for the interaction between miR-21–5 p and the 3′-UTR of ΔNp63α. The predicted miR-21–5 p binding sequence AUAAGC was replaced by CCGGAA for pGL3-ΔNp63αmut construction. (B) Luciferase activity of ΔNp63αwild and ΔNp63αmut in HEK-293T cells (n = 3) co-transfected with miR-21–5 p mimic or inhibitor for 24 hr. (C) qRT-PCR analysis of ΔNp63α levels in adenovirus containing ΔNp63α (Ad-ΔNp63α) infected EECs transfected with miR-21–5 p mimic (n = 3). (D) Top: ΔNp63α protein expression in miR-21–5 p mimic transfected-ΔNp63α + EECs (48 hr) determined by western blotting (n = 3). Bottom: The quantitative band intensities determined by image J software. (E) Top: ΔNp63α protein expression in miR-21–5 p inhibitor transfected-ΔNp63α+ EECs (48 hr) determined by western blotting (n = 3). Bottom: The quantitative band intensities determined by image J software. (F) Luciferase activity of ΔNp63αwild and ΔNp63αmut in HEK-293T cells co-transfected with circPTPN12 or circ-control plasmids (n = 5). (G) Top: ΔNp63α protein expression determined by western blotting in Ad-circPTPN12-infected ΔNp63α+ or ΔNp63α− EECs in the presence of miR-21–5 p mimic or miR-NC for 48 hr (n = 3). Bottom: The quantitative band intensities determined by image J software. (H) qRT-PCR analysis of E-cad, N-cad, α-SMA, and FN mRNA levels in miR-21–5 p mimic or miR-NC transfected ΔNp63α+ EECs (n = 3). (I) Representative images (n = 3) of E-cad, N-cad, and α-SMA immunofluorescence staining in miR-21–5 p mimic or miR-NC transfected ΔNp63α + EECs. Scale bars, 20 μm. (J) Left: FN, α-SMA, N-cad, E-cad, and GAPDH protein levels determined by western blotting in Ad-circPTPN12-infected ΔNp63α+ or ΔNp63α− EECs in the presence of miR-21–5 p mimic or miR-NC for 48 hr (n = 3). Right: The quantitative band intensities determined by image J software. (B) – (H) and (J) Error bars indicate mean ± SD. *p<0.05, **p<0.01, ***p<0.001, ****p<0.0001.
-
Figure 4—source data 1
Data on luciferase activity of Luc-ΔNp63α wild or mut in HEK-293T cells transfected with miR-21–5 p mimic or inhibitor.
- https://cdn.elifesciences.org/articles/65735/elife-65735-fig4-data1-v1.xlsx
-
Figure 4—source data 2
qRT-PCR data for ΔNp63α relative expression in EECs transfected with miR-21–5 p mimic.
- https://cdn.elifesciences.org/articles/65735/elife-65735-fig4-data2-v1.xlsx
-
Figure 4—source data 3
Uncropped western blots for Figure 4D,E.
- https://cdn.elifesciences.org/articles/65735/elife-65735-fig4-data3-v1.pdf
-
Figure 4—source data 4
The quantitative band intensities for Figure 4D.
- https://cdn.elifesciences.org/articles/65735/elife-65735-fig4-data4-v1.xlsx
-
Figure 4—source data 5
The quantitative band intensities for Figure 4E.
- https://cdn.elifesciences.org/articles/65735/elife-65735-fig4-data5-v1.xlsx
-
Figure 4—source data 6
Data on luciferase activity of Luc-ΔNp63α wild or mut in HEK-293T cells transfected with circ-control or circPTPN12.
- https://cdn.elifesciences.org/articles/65735/elife-65735-fig4-data6-v1.xlsx
-
Figure 4—source data 7
Uncropped western blots for Figure 4G.
- https://cdn.elifesciences.org/articles/65735/elife-65735-fig4-data7-v1.pdf
-
Figure 4—source data 8
The quantitative band intensities for Figure 4G.
- https://cdn.elifesciences.org/articles/65735/elife-65735-fig4-data8-v1.xlsx
-
Figure 4—source data 9
qRT-PCR data for E-cad, N-cad, α-SMA, and FN relative expression.
- https://cdn.elifesciences.org/articles/65735/elife-65735-fig4-data9-v1.xlsx
-
Figure 4—source data 10
Uncropped western blots for Figure 4J.
- https://cdn.elifesciences.org/articles/65735/elife-65735-fig4-data10-v1.pdf
-
Figure 4—source data 11
The quantitative band intensities for Figure 4J.
- https://cdn.elifesciences.org/articles/65735/elife-65735-fig4-data11-v1.xlsx
Figure 5 with 1 supplement
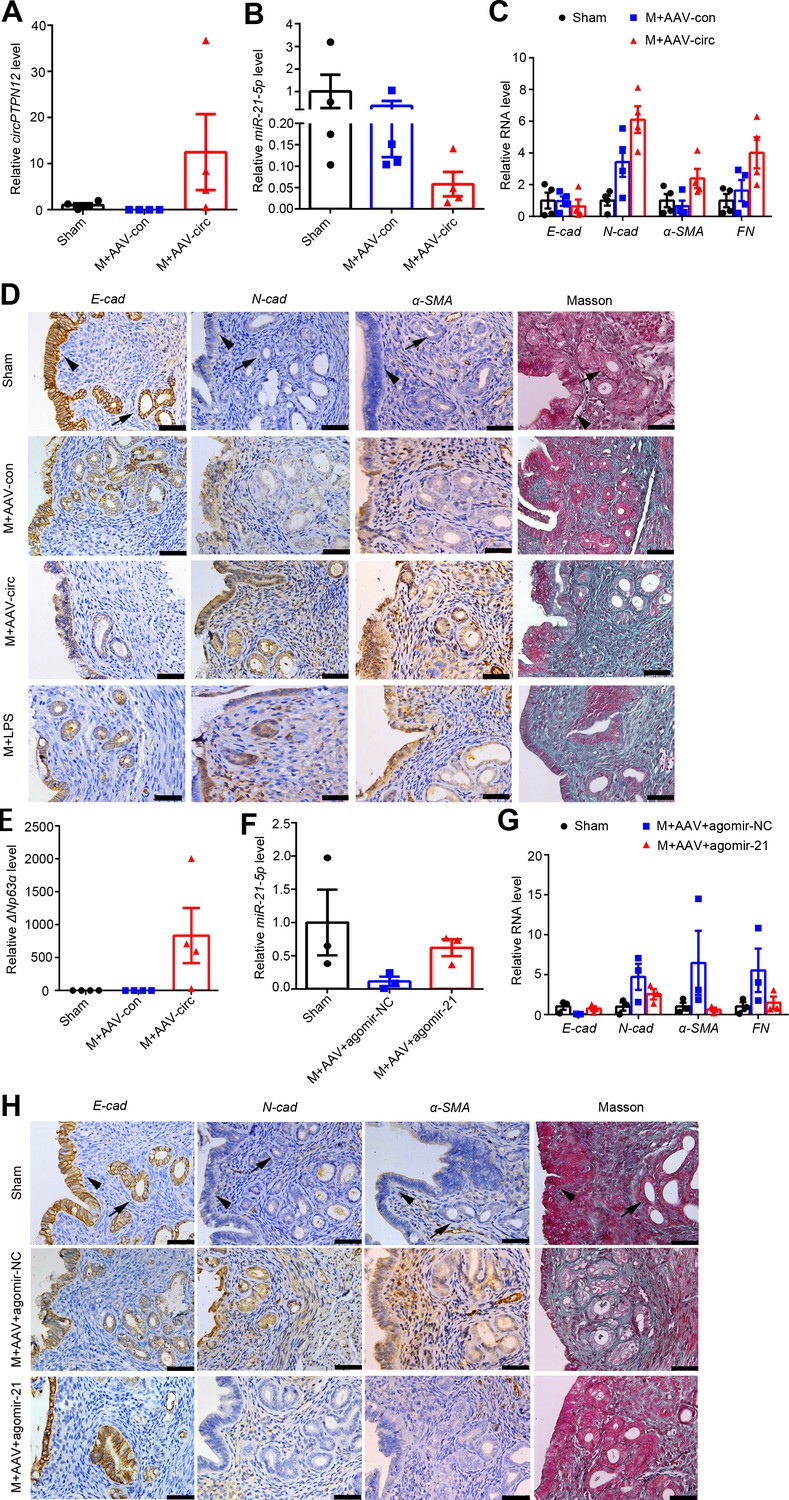
Intrauterine injection of miR-21–5 p alleviates circPTPN12-induced EEC–EMT in vivo.
(A) – (E) qRT-PCR analysis of circPTPN12 levels (A), miR-21–5 p levels (B), E-cad, N-cad, α-SMA, and FN mRNA levels (C), representative immunohistochemistry images of E-cad, N-cad, α-SMA, and Masson staining (D, the first three rows), ΔNp63α levels (E) in endometria of mice with sham-operation (Sham, n = 4), mechanical injury and adeno-associated virus (AAV)-control injection (M + AAV con, n = 4), mechanical injury and AAV-circPTPN12 injection (M + AAV circ, n = 4). (D, the fourth row) Representative immunohistochemistry images of E-cad, N-cad, α-SMA, and Masson staining in endometria of mice with mechanical injury and lipopolysaccharide injection (M + LPS, n = 4). (F) – (H) qRT-PCR analysis of miR-21–5 p levels (F), E-cad, N-cad, α-SMA, and FN mRNA levels (G), representative immunohistochemistry images of E-cad, N-cad, α-SMA, and Masson staining (H) in endometria of mice with sham-operation (n = 3), mechanical injury with AAV-circPTPN12 and agomir-NC injection (M + AAV + agomiR-NC, n = 3), mechanical injury with AAV-circPTPN12 and agomir-21–5 p injection (M + AAV + agomiR-21, n = 3). Scale bars, 50 μm. Arrow head: luminal epithelial cells; arrow: glandular epithelial cells. (A) – (C), (E) – (F), and (G) Error bars indicate mean ± SEM.
-
Figure 5—source data 1
qRT-PCR data of circPTPN12 relative expression for Figure 5A.
- https://cdn.elifesciences.org/articles/65735/elife-65735-fig5-data1-v1.xlsx
-
Figure 5—source data 2
qRT-PCR data of miR-21–5 p relative expression for Figure 5B.
- https://cdn.elifesciences.org/articles/65735/elife-65735-fig5-data2-v1.xlsx
-
Figure 5—source data 3
qRT-PCR data of E-cad, N-cad, α-SMA, and FN relative expression for Figure 5C.
- https://cdn.elifesciences.org/articles/65735/elife-65735-fig5-data3-v1.xlsx
-
Figure 5—source data 4
qRT-PCR data of ΔNp63α relative expression for Figure 5E.
- https://cdn.elifesciences.org/articles/65735/elife-65735-fig5-data4-v1.xlsx
-
Figure 5—source data 5
qRT-PCR data of miR-21–5 p relative expression for Figure 5F.
- https://cdn.elifesciences.org/articles/65735/elife-65735-fig5-data5-v1.xlsx
-
Figure 5—source data 6
qRT-PCR data of E-cad, N-cad, α-SMA, and FN relative expression for Figure 5G.
- https://cdn.elifesciences.org/articles/65735/elife-65735-fig5-data6-v1.xlsx
Figure 5—figure supplement 1
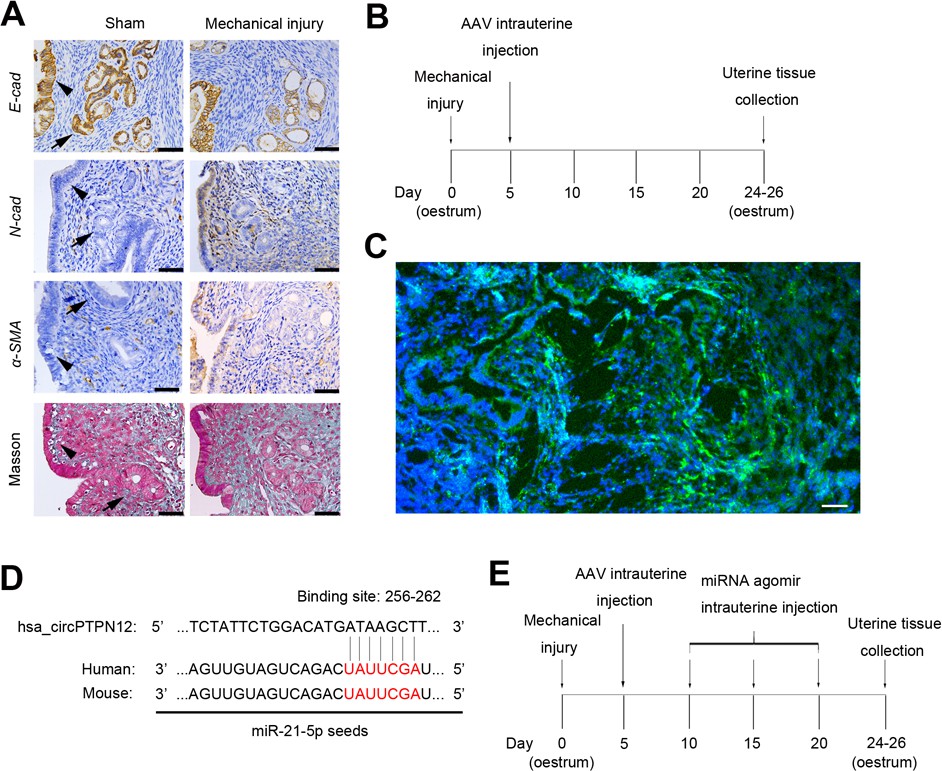
IUA-like mouse model construction.
(A) Representative images of E-cad, N-cad, α-SMA, and Masson staining in endometrial biopsies of sham-operation (n = 3) and mechanical injury model mice (n = 3). Scale bars, 50 μm. Arrow head: luminal epithelial cells; arrow: glandular epithelial cells. (B) A flow diagram of experimental procedure with sham-operation, mechanical injury, and AAV-control or AAV-circPTPN12 uterine injection. (C) zsGREEN Fluorescence in endometrial biopsies of mice 21 days after AAV-circPTPN12 injection. Scale bars, 20 μm. (D) Conserved miR-21–5 p sequence in human and mouse. (E) A flow diagram of experimental procedure with sham-operation, mechanical injury with AAV-circPTPN12, and agomir-21–5 p or agomir-NC uterine injection.
Figure 6
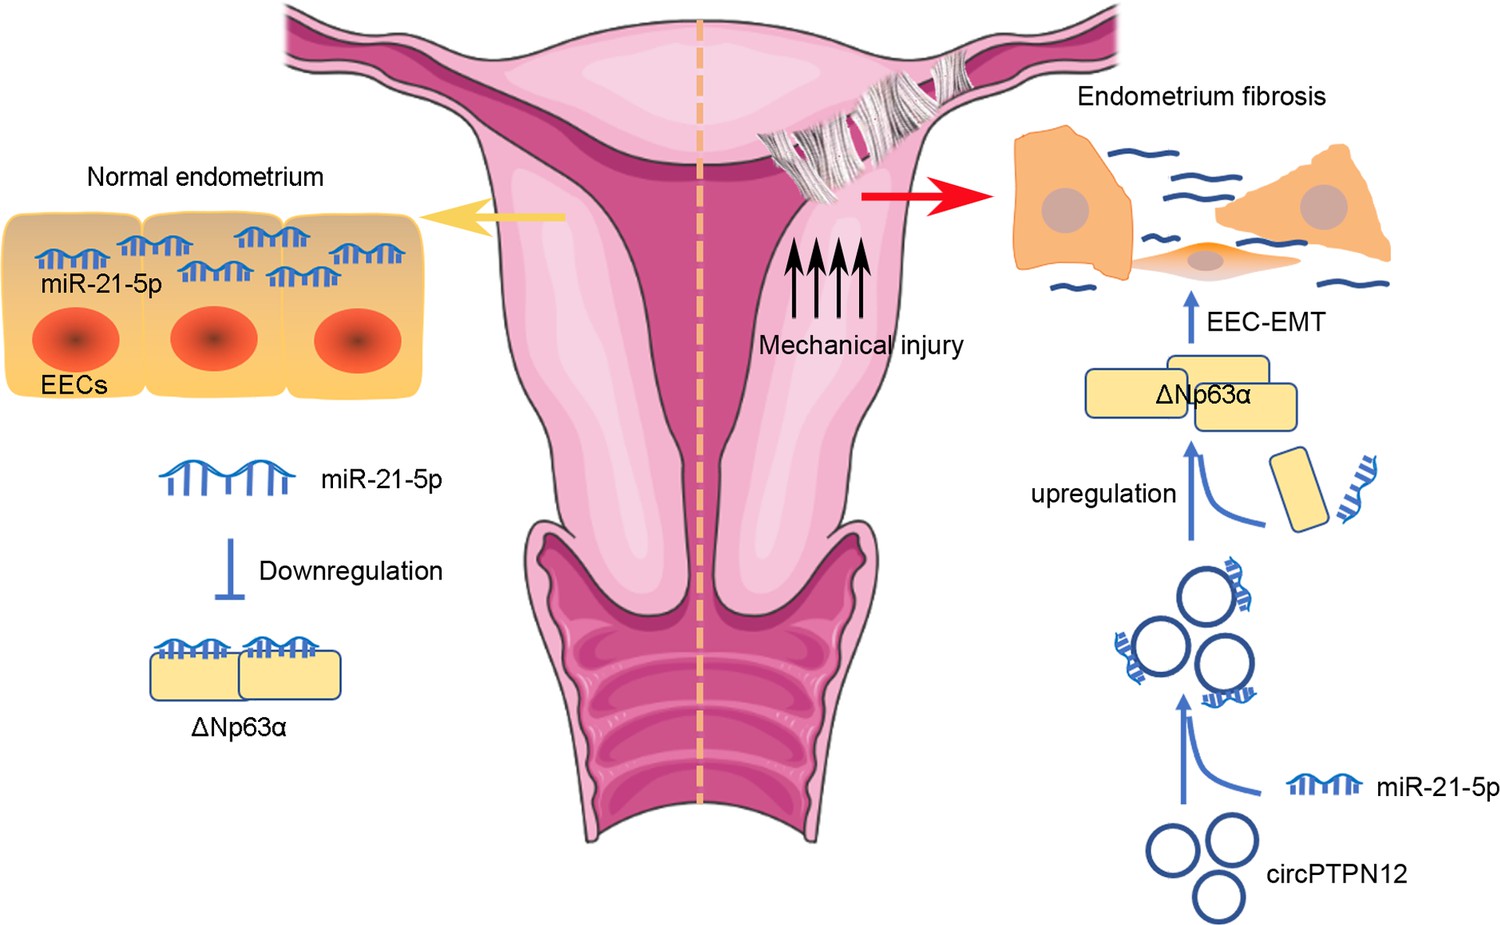
Proposed pathogenesis of endometrium fibrosis.
Tables
Key resources table
| Reagent type (species) or resource | Designation | Source or reference | Identifiers | Additional information |
|---|---|---|---|---|
| Cell line (H. sapiens) | HEK-293T | ATCC | RRID:CVCL_0063 | |
| Cell line (H. sapiens) | Ishikawa | ATCC | RRID:CVCL_2529 | |
| Antibody | Anti-E-cadherin (mouse monoclonal) | Abcam | Cat# ab76055 | WB (1:1000) IHC (1:400) |
| Antibody | Anti-N-cadherin (rabbit monoclonal) | Abcam | Cat# ab18203 | WB (1:500) IHC (1:400) |
| Antibody | Anti-α-SMA (rabbit monoclonal) | Abcam | Cat# ab5694 | WB (1:500) IHC (1:100) |
| Antibody | Anti-FN (rabbit monoclonal) | Abcam | Cat# ab2413 | WB (1:500) |
| Antibody | Anti-ΔNp63α (rabbit monoclonal) | Millipore | Cat# ABS552 | WB (1:500) |
| Antibody | Anti-AGO2 (rabbit monoclonal) | Abcam | Cat# ab186733 | RIP (1:1000) |
| Antibody | Anti-GAPDH (HRP-conjugated GAPDH mouse mAb) | ABclonal | Cat# AC035 | WB (1:10,000) |
| Antibody | Anti-rabbit IgG | Cell Signaling Technology | Cat# 7074S | WB (1:2000) |
| Antibody | Anti-mouse IgG | Cell Signaling Technology | Cat# 7076S | WB (1:2000) |
| Sequenced based reagent | RT-qPCR primers | This paper | see Supplementary file 5 | |
| Commercial assay or kit | NE-PER Nuclear and Cytoplasmic Extraction Reagents | Thermo Scientific | Cat# 78835 | |
| Commercial assay or kit | PrimeScript reagent Kit with DNA Eraser | TaKaRa BIO | Cat# RR047B | |
| Commercial assay or kit | RNA-scope assay | Advanced Cell Diagnostics | Cat# 710171 Cat# 713661 Cat# 854881 | |
| Chemical compound, drug | Actinomycin D | MedChem Express | Cat# HY-17559 | |
| Software, algorithm | Prism version 6.0 | GraphPad Software Inc | RRID:SCR_002798 | |
| Software, algorithm | Image J | NIH | RRID:SCR_003070 | |
| Software, algorithm | edgeR | Bioconductor | RRID:SCR_012802 |
Additional files
-
Supplementary file 1
Dysregulated miRNAs in IUA patients.
- https://cdn.elifesciences.org/articles/65735/elife-65735-supp1-v1.docx
-
Supplementary file 2
Forty upregulated and 40 downregulated miRNAs with higher expression abundance.
- https://cdn.elifesciences.org/articles/65735/elife-65735-supp2-v1.docx
-
Supplementary file 3
circRNAs with binding sites for miR-21–5 p.
- https://cdn.elifesciences.org/articles/65735/elife-65735-supp3-v1.docx
-
Supplementary file 4
Clinical information of all patients and controls.
- https://cdn.elifesciences.org/articles/65735/elife-65735-supp4-v1.docx
-
Supplementary file 5
All primers used in this study.
- https://cdn.elifesciences.org/articles/65735/elife-65735-supp5-v1.docx
-
Supplementary file 6
Mouse model grouping.
- https://cdn.elifesciences.org/articles/65735/elife-65735-supp6-v1.docx
-
Transparent reporting form
- https://cdn.elifesciences.org/articles/65735/elife-65735-transrepform-v1.docx
Download links
A two-part list of links to download the article, or parts of the article, in various formats.
Downloads (link to download the article as PDF)
Open citations (links to open the citations from this article in various online reference manager services)
Cite this article (links to download the citations from this article in formats compatible with various reference manager tools)
circPTPN12/miR-21–5 p/∆Np63α pathway contributes to human endometrial fibrosis
eLife 10:e65735.
https://doi.org/10.7554/eLife.65735


