Competitive coordination of the dual roles of the Hedgehog co-receptor in homophilic adhesion and signal reception
- Department of Anatomy and Cell Biology, George Washington University School of Medicine and Health Sciences, United States
- GW Cancer Center, George Washington University School of Medicine and Health Sciences, United States
- Department of Physics, George Washington University, United States
- Laboratory of Cell Biology, National Heart, Lung, and Blood Institute, National Institutes of Health, United States
Figures
Figure 1 with 1 supplement
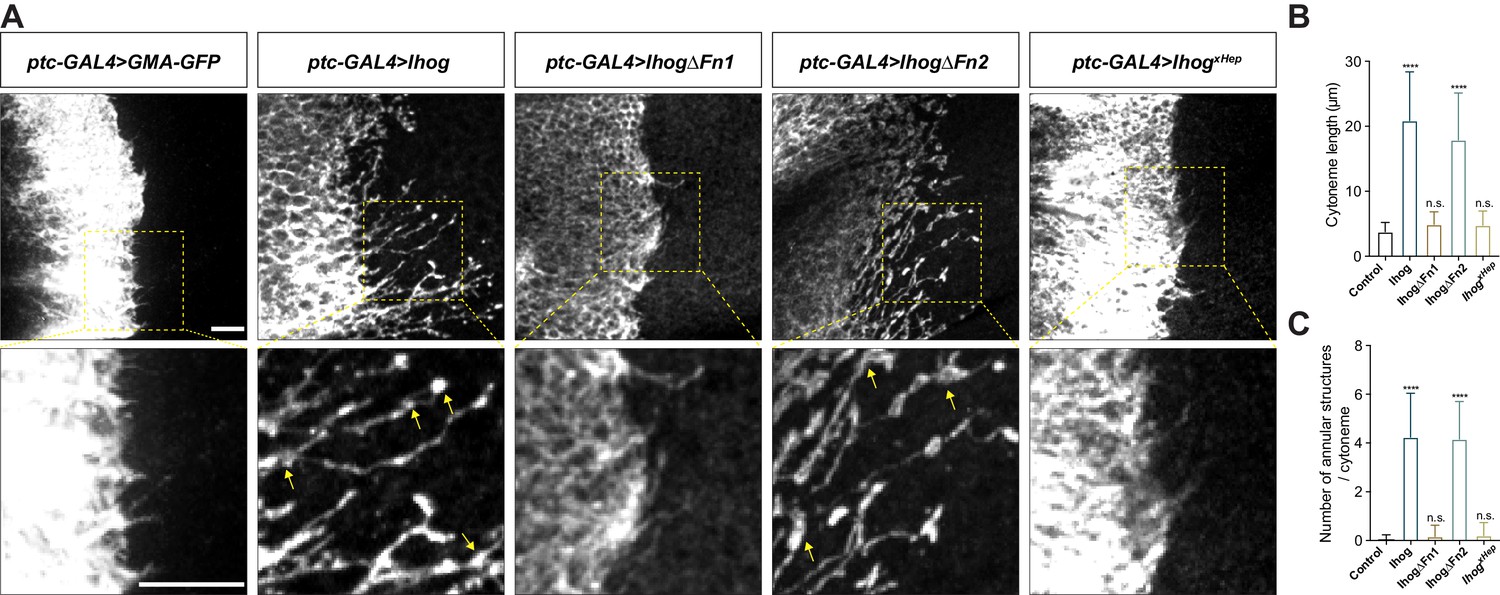
Ihog mediates cytoneme stabilization via the Fn1 domain.
(A) Wing discs from 3rd instar larvae carrying ptc-GAL4, tub-GAL80ts and the indicated UAS-transgenes were immunostained for GFP or Ihog to visualize cytonemes projecting from Hh-receiving cells. Yellow arrows indicate the annular structures along the cytonemes. Scale bar, 10 µm. (B, C) Quantification of the average cytoneme length (B) and the average annular structures number per cytoneme (C) in the wing disc. Each bar shows the mean ± SD (n > 30). One-way ANOVA followed by Dunnett’s multiple comparison test was used for statistical analysis. ns, not significant. ****p<0.0001.
-
Figure 1—source data 1
Contains numerical data plotted in Figure 1B and C.
- https://cdn.elifesciences.org/articles/65770/elife-65770-fig1-data1-v1.xlsx
Figure 1—figure supplement 1
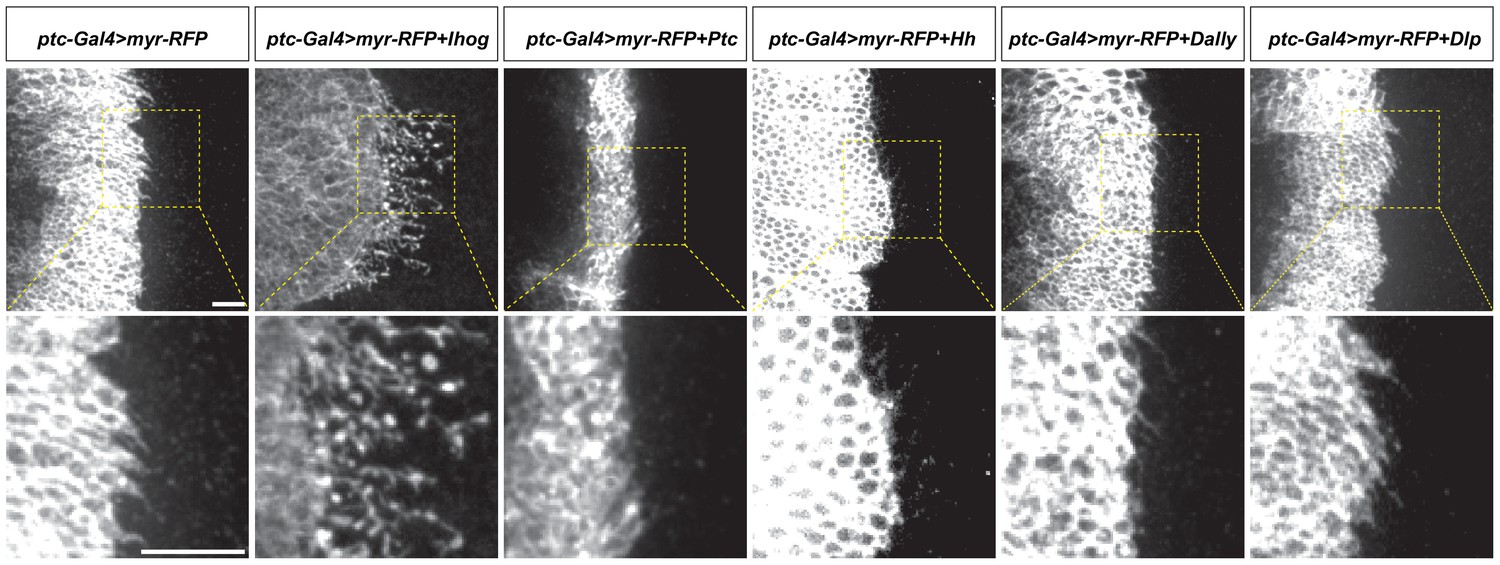
Ectopic expression of Ihog, but not other Hh pathway components, stabilizes cytonemes.
Wing discs from 3rd instar larvae carrying ptc-GAL4, tub-GAL80ts and the indicated UAS-transgenes were immunostained for RFP to visualize cytonemes projecting from Hh-receiving cells. UAS-Myr-RFP: myristoylated form of red fluorescent protein that marks the cell membrane and enables visualization of the cytonemes. Scale bar, 10 µm.
Figure 2
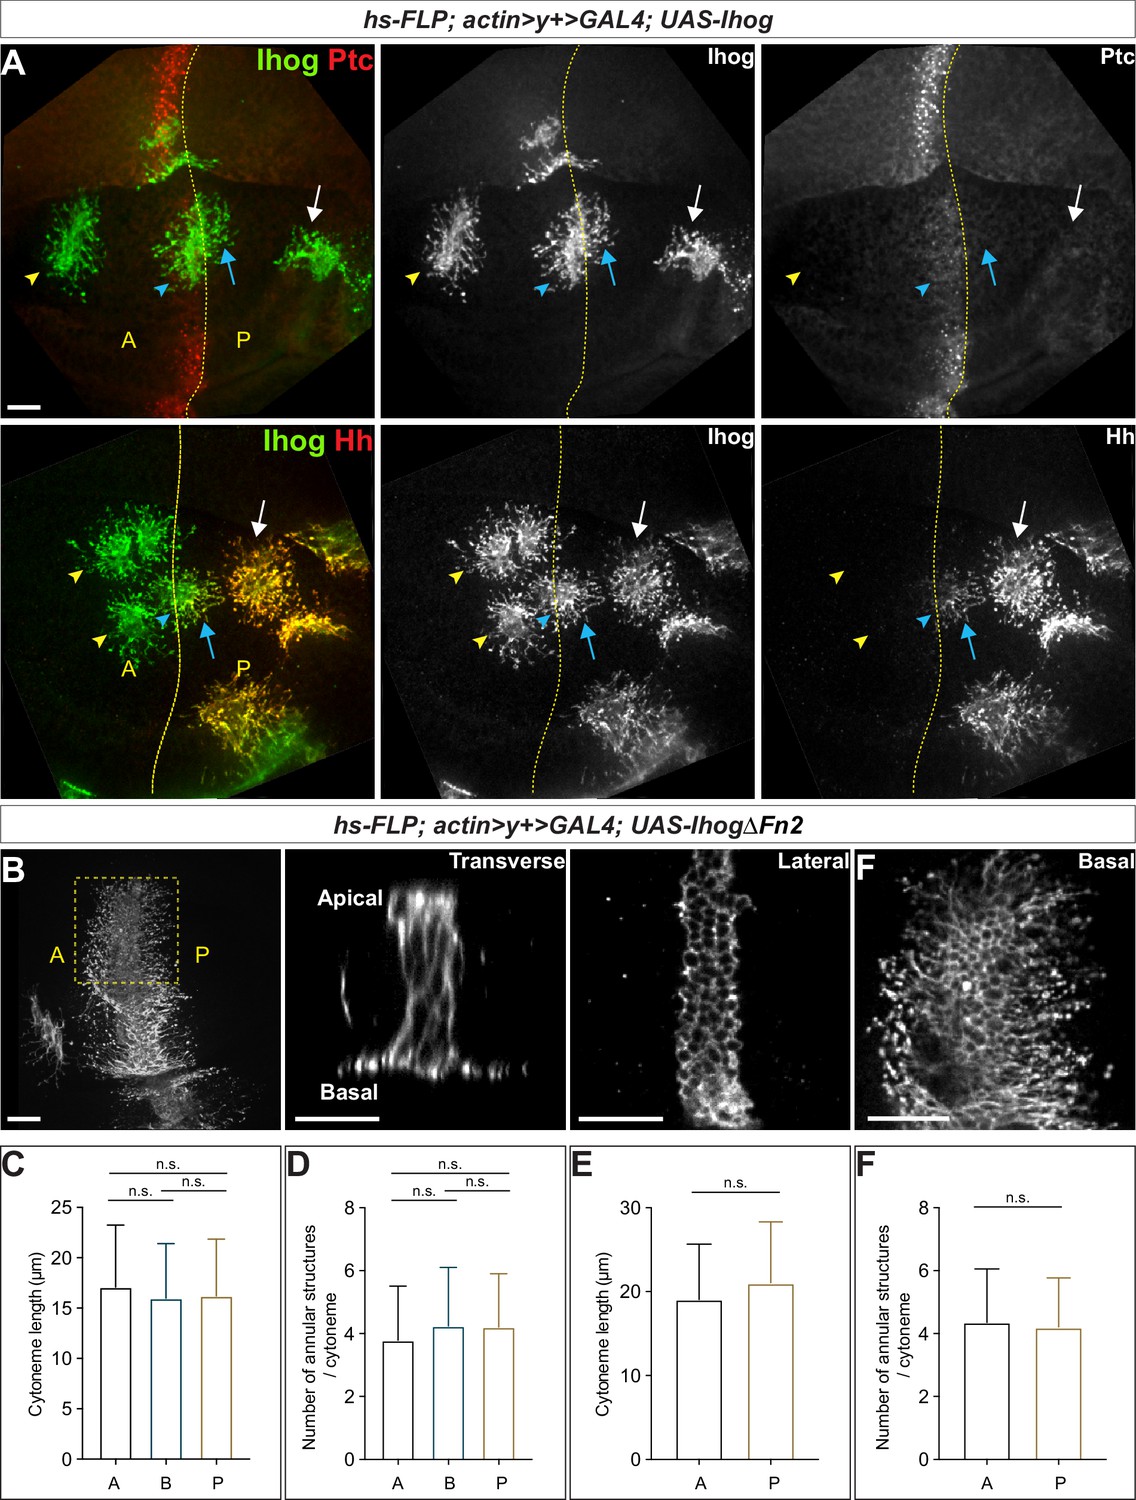
Ihog mediates cytoneme stabilization in a manner independent of the Hh receptor function.
(A) Wing discs from 3rd instar larvae carrying flip-out clones expressing UAS-Ihog were immunostained for Ihog (green) and Ptc or Hh (red) as indicated. Dashed yellow line indicate the A/P compartment boundary; white arrows indicate clones located within the P compartment; blue arrows indicate cytonemes of clones located next to the A/P boundary that project toward the Hh producing cells; blue arrowheads indicate cytonemes of clones located next to the A/P boundary that project away from the Hh producing cells; yellow arrowheads indicate cytonemes from clones located within the A compartment. Scale bar, 20 µm. (B) Flip-out clones expressing UAS-IhogΔFn2 viewed from the basal side at low magnification and in transverse, lateral, and basal sections of the same clone, showing localization of IhogΔFn2 proteins (immunostained for Ihog) at the lateral cell-cell contacts and basal cytonemes. Scale bar, 20 µm. (C, D) Quantification of the average cytoneme length and the average annular structure number per cytoneme for A (clones located in the Ptclow A compartment), B (Ptchigh A/P compartment boundary), and P (Ptcneg P compartment). (E, F) Quantification of the average cytoneme length and the average annular structure number per cytoneme for A (cytonemes projecting anteriorly away from the Hh source) and P (cytonemes projecting posteriorly toward the source of Hh). Each bar shows the mean ± SD (n > 30 clones). One-way ANOVA followed by Tukey’s multiple comparison test (C, D) or the two-tailed unpaired t-test (E, F) was used for statistical analysis. ns, not significant.
-
Figure 2—source data 1
Contains numerical data plotted in Figure 2C,D,E and F.
- https://cdn.elifesciences.org/articles/65770/elife-65770-fig2-data1-v1.xlsx
Figure 3 with 1 supplement
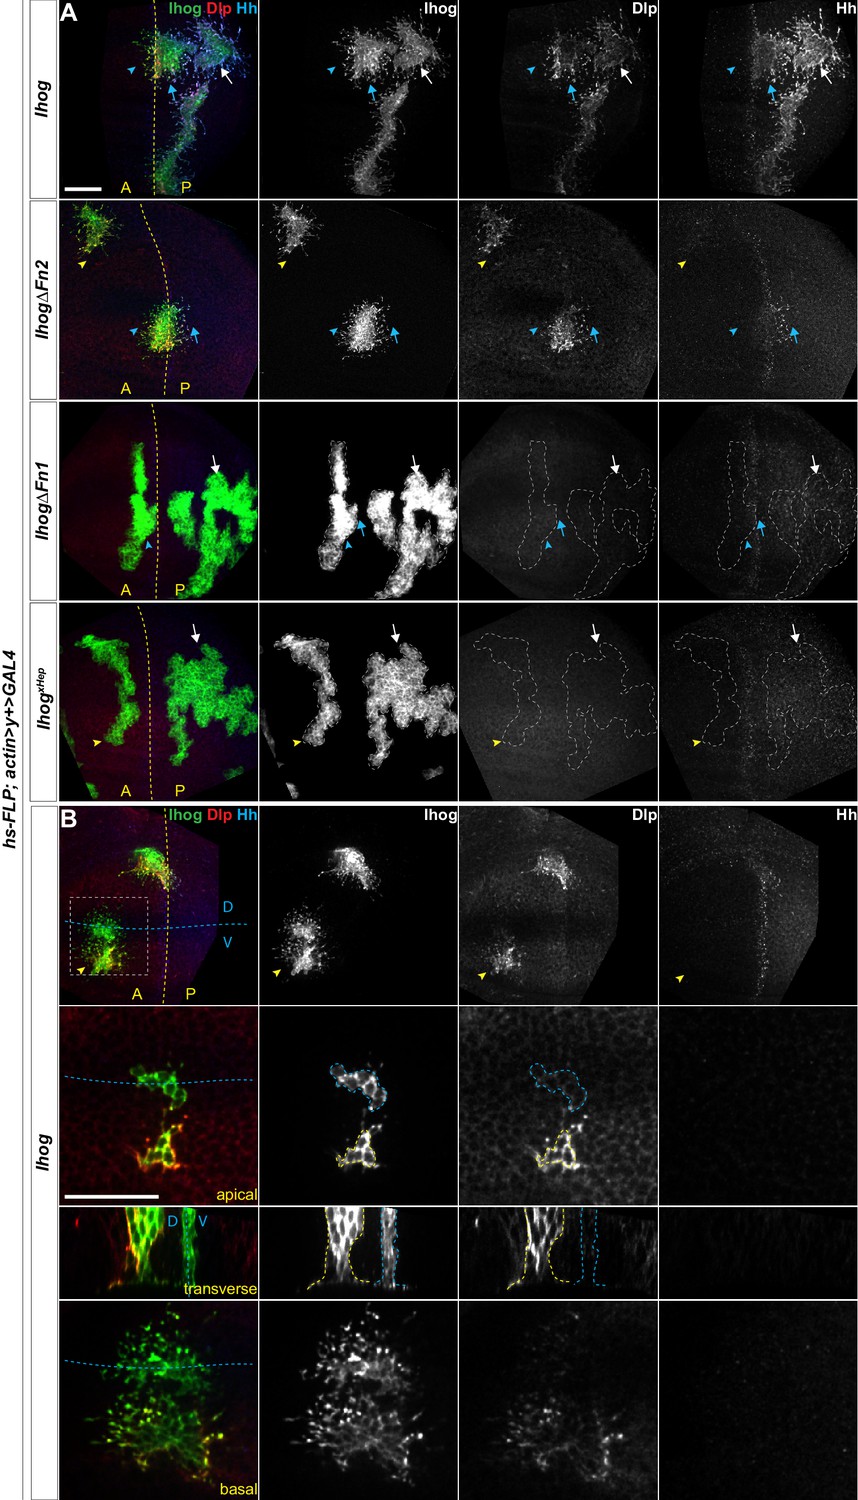
Ectopic Ihog induces accumulation of glypicans at lateral cell-cell contacts and along basal cytonemes.
Wing discs from 3rd instar larvae carrying flip-out clones expressing the indicated UAS-transgene were immunostained for Ihog (green), Dlp (red), and Hh (blue). Dashed yellow lines indicate the A/P compartment boundary, which is determined by the expression of endogenous Hh; dashed blue lines indicates the dorsal/ventral (D/V) compartment boundary. (A) Ihog or Ihog mutants were expressed in wing discs. White arrows indicate clones located within the P compartment; blue arrows indicate cytonemes of clones located next to the A/P boundary that project toward the Hh producing cells; blue arrowheads indicate cytonemes of clones located next to the A/P boundary that project away from the Hh producing cells; yellow arrowheads indicate cytonemes from clones located within the A compartment. (B) Flip-out clones expressing UAS-Ihog viewed from the basal side at low magnification, showing their position relative to the A/P and D/V boundaries, and in lateral, transverse, and basal sections of the zoomed area. Blue outline indicates the flip-out clone flanking the D/V boundary; the yellow outline indicates the clone several cell diameters away from the D/V boundary. Scale bar, 20 µm.
Figure 3—figure supplement 1
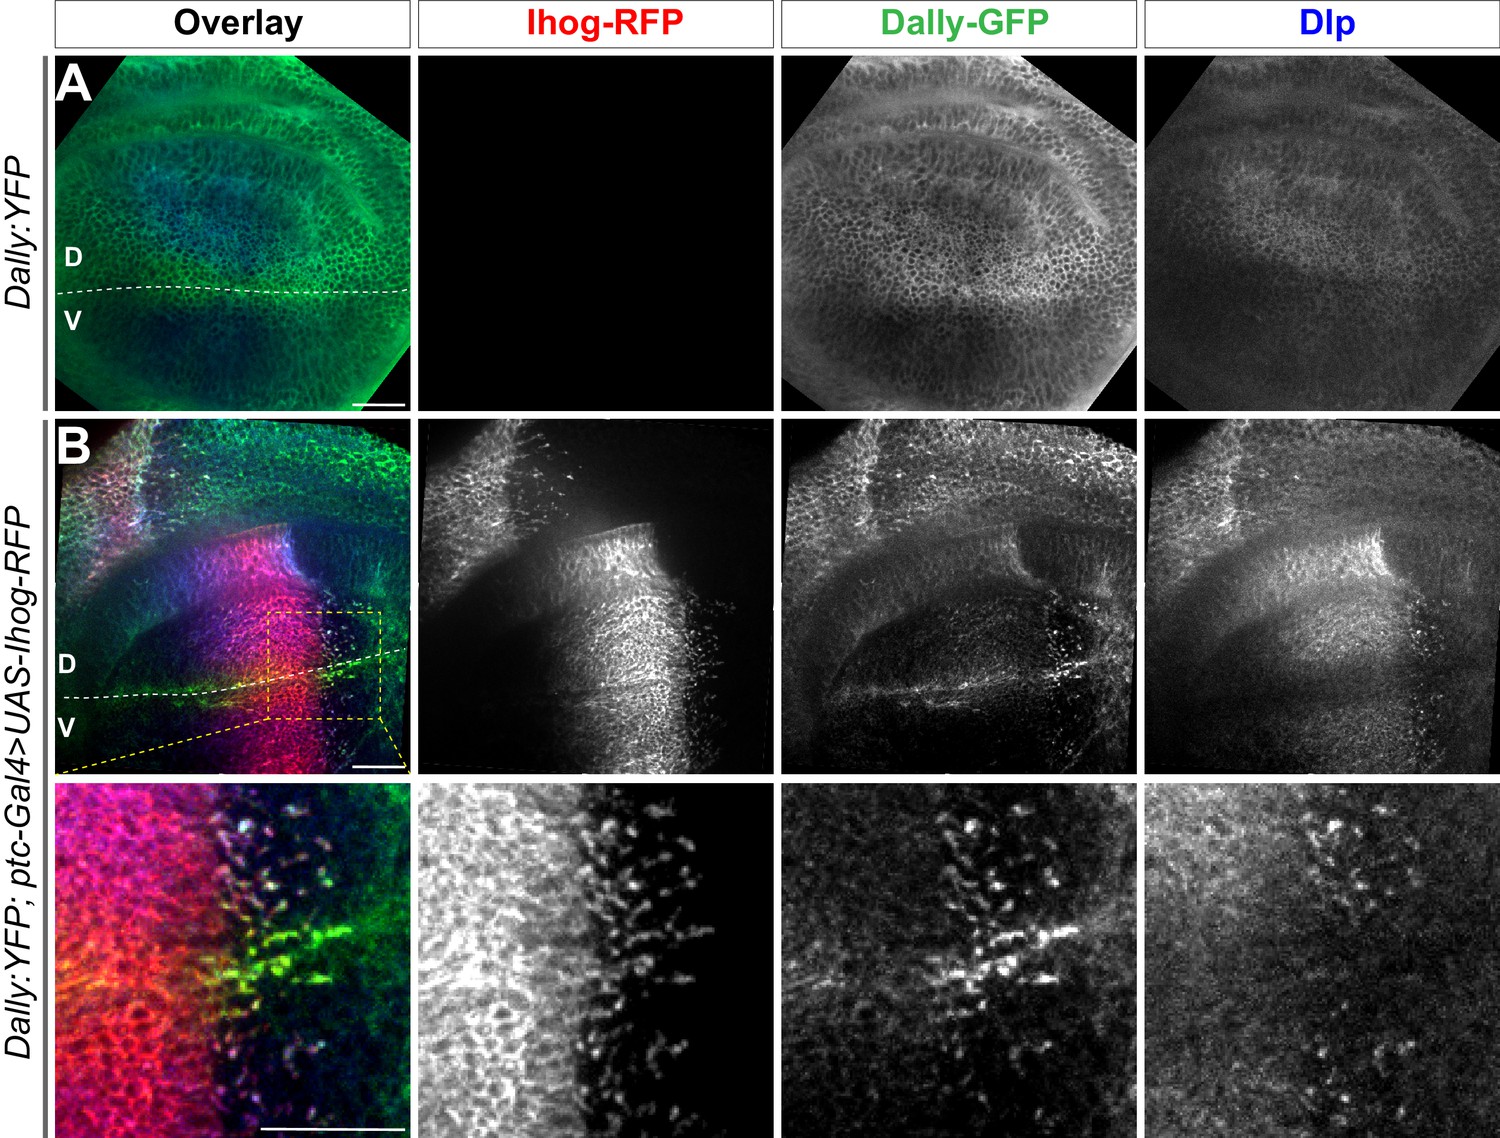
Ectopic Ihog induces accumulation of Dally and Dlp that is associated with the different distributions of the two glypicans.
(A) Distribution of Dally:YFP and Dlp in a wing discs from a 3rd instar larvae carrying a Dally:YFP protein trap allele. (B) Distribution of Dally:YFP, Dlp, and Ihog in a wing disc from larvae expressing the a Dally:YFP protein trap allele and the ptc-GAL4, tub-GAL80ts and UAS-Ihog-RFP transgenes. The lower row shows an enlarged area (outlined in upper left panel) around the D/V boundary. The discs were immunostained to visualize Dlp (blue) and with antibody against YFP to visualize Dally (green). Ihog-RFP was visualized with the RFP fluorescence (red). The dorsal/ventral (D/V) boundary is indicated by a dashed white line. Scale bar, 20 µm.
Figure 4 with 8 supplements
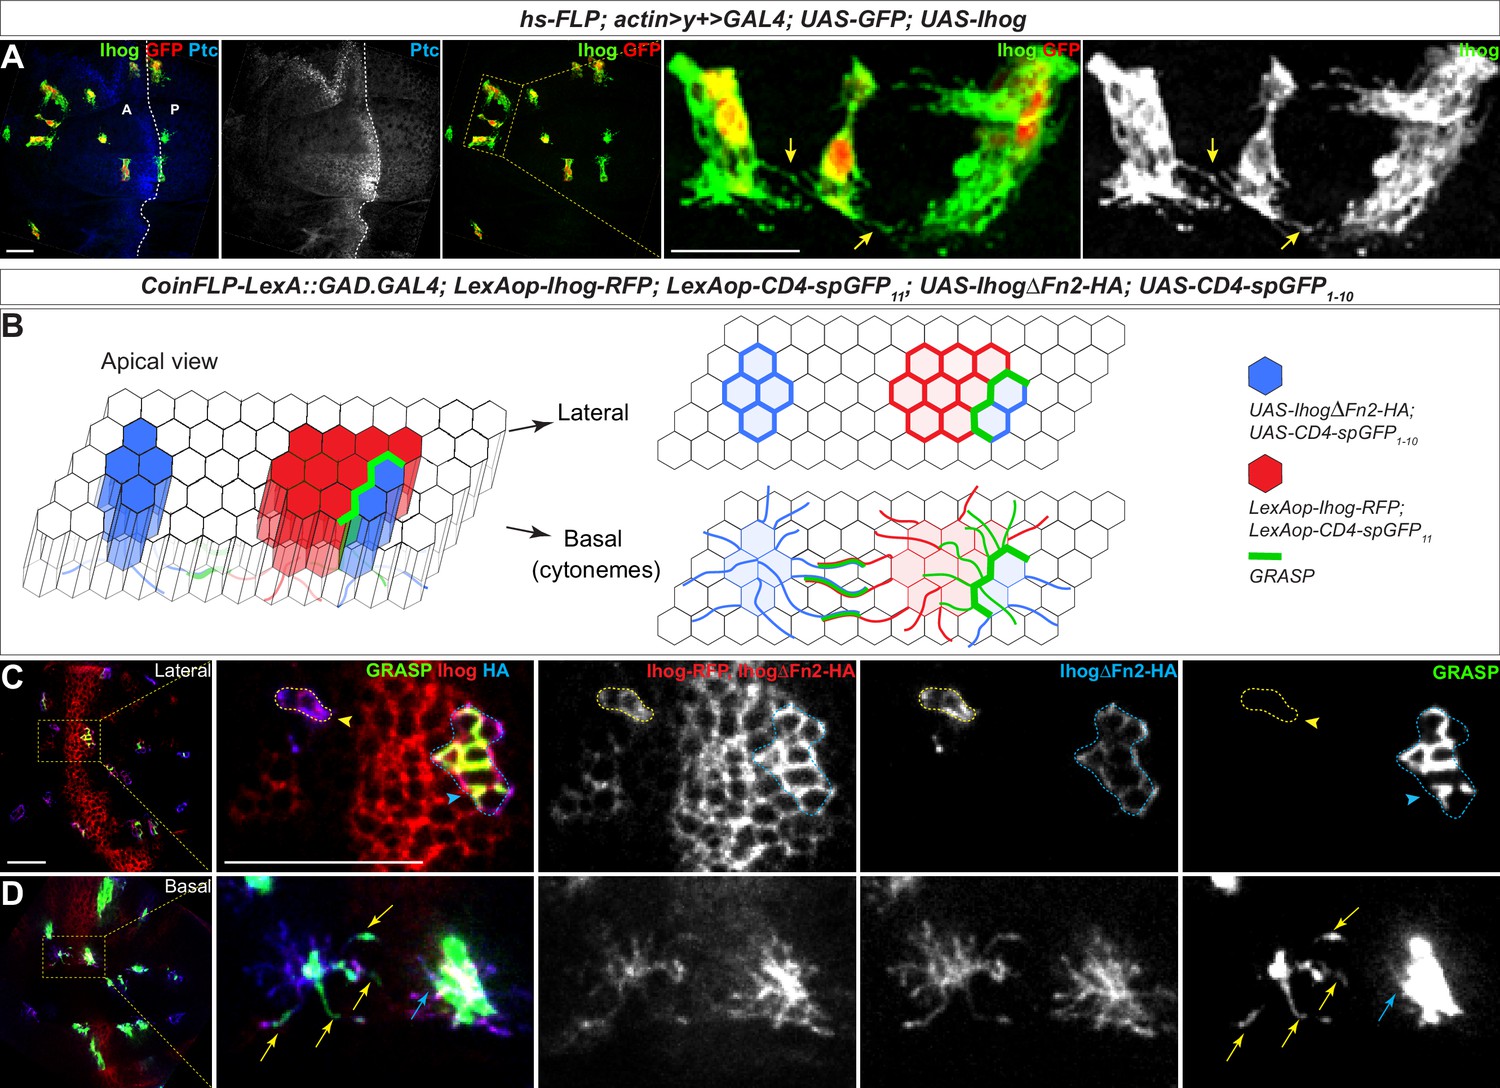
Homophilic Ihog-Ihog trans binding enables direct cytoneme-cytoneme contact formation.
(A) Wing imaginal discs from 3rd instar larvae carrying flip-out clones expressing UAS-Ihog were immunostained with antibodies against Ihog (green), Ptc (blue), and GFP (red) as indicated. Yellow arrows indicate Ihog-enriched cytonemes projecting from closely positioned clones. Scale bar, 20 µm. (B) Diagram illustrating cytoneme-cytoneme contact between non-adjacent clones expressing ectopic Ihog or IhogΔFn2 that are capable of homophilic trans binding. The green color corresponds to the GRASP signal, which is not only detected at the lateral contacts and along the basal cytonemes of the adjacent clones, but also along cytonemes projecting from non-adjacent clones that express CD4-spGFP1-10/IhogΔFn2 and CD4-spGFP11/Ihog. (C, D) Lateral and basal sections of a wing imaginal disc from 3rd instar larvae carrying clones marked by the CoinFLP-LexGAD/GAL4 system and the GRASP system as indicated. The wing discs were immunostained with antibodies against Ihog (red, both Ihog-RFP and IhogΔFn2-HA expressing cells) and HA (blue, IhogΔFn2-HA expressing cells) as indicated. GRASP signal is green. Blue outlines indicate clones expressing CD4-spGFP1-10 and IhogΔFn2-HA that are immediately adjacent to clones expressing CD4-spGFP11 and Ihog-RFP; yellow outlines indicate CD4-spGFP1-10 and UAS- IhogΔFn2-HA clones that are distant from those expressing CD4-spGFP11 and Ihog-RFP. Blue arrowheads indicate GFP fluorescence along the lateral side of the outlined clones. Yellow arrowheads indicate absence of GFP fluorescence along the lateral sides of the outlined clones. (D) Blue and yellow arrows indicate GFP fluorescence along the length of the cytonemes projecting from the clones indicated by blue and yellow outlines (C), respectively. Scale bar, 20 µm.
Figure 4—figure supplement 1
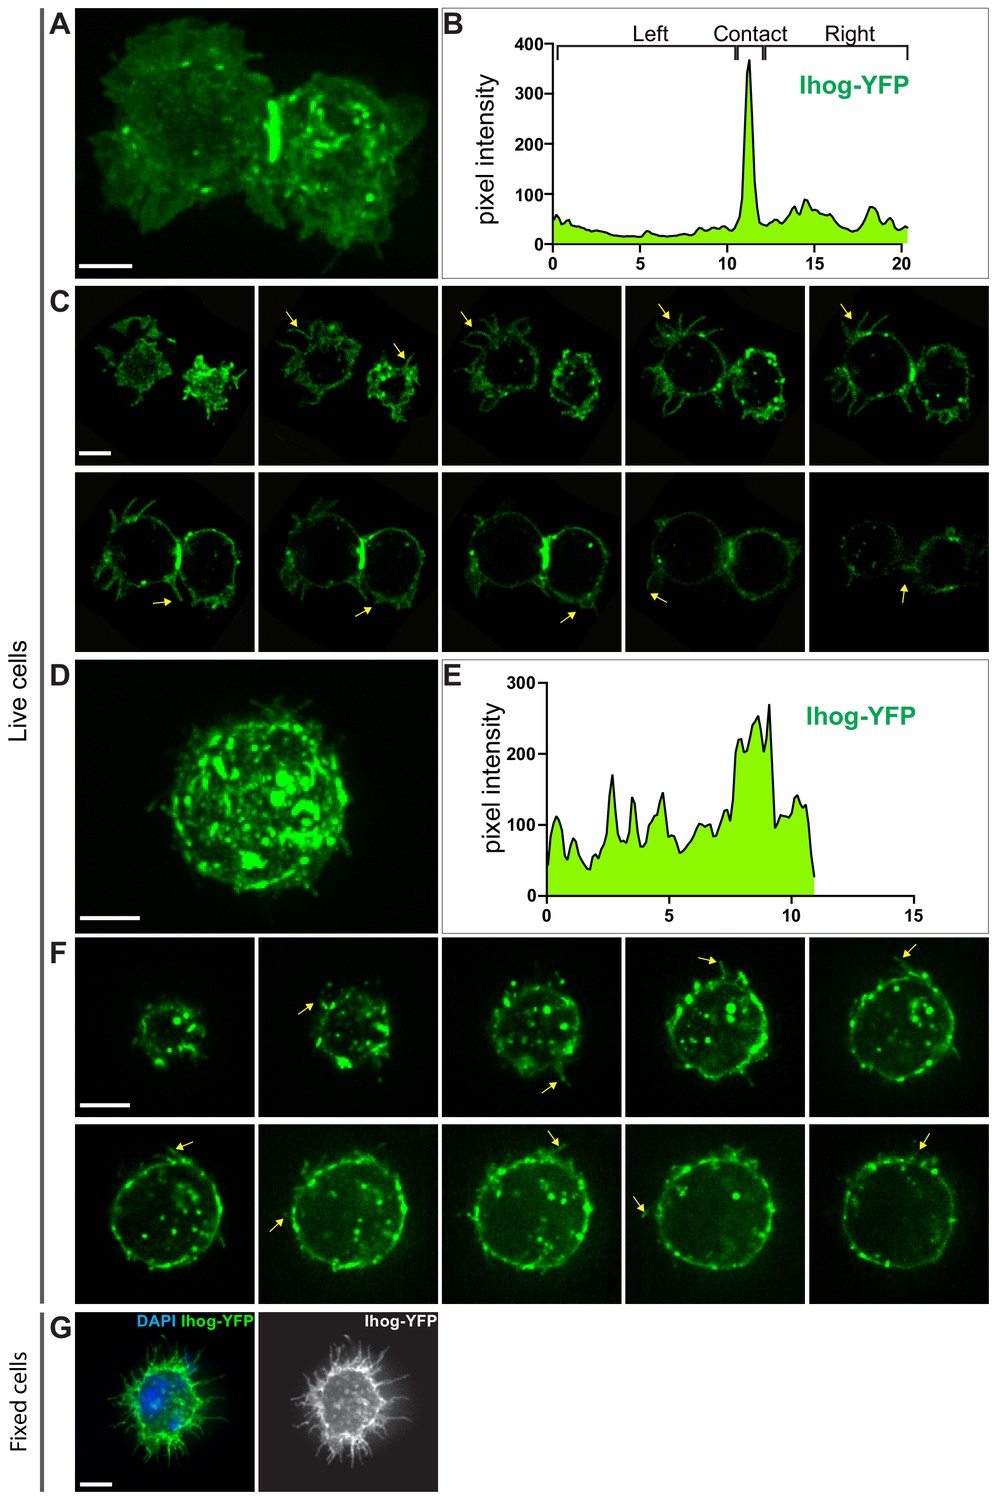
Subcellular localization of Ihog proteins in live S2 cells.
(A–F) Live imaging of S2 cells transfected with plasmids expressing YFP-tagged Ihog was performed and pixel intensity plotted. Images of xy focal planes were collected along the z-axis through the S2 cells with each image consisting of a maximum projection of three-dimensional volume encompassing the entire cell(s). (A, B) Representative maximum intensity projections of z-stack sections of S2 cells in contact and pixel intensity of Ihog-YFP across the image. Data are representative of n > 3 experiments. (C) Images from 10 different xy focal planes with identical z-axis distance for the cells shown in C. Arrows indicate filopodia. See Figure 4—videos 1 and 2. (D, E) Representative maximum intensity projections of z-stack sections of single S2 cells and pixel intensity of Ihog-YFP across the image. Data are representative of n > 3 experiments. (F) Images from 10 different xy focal planes with identical z-axis distance for the cell shown in D. See Figure 4—videos 3 and 4. (G) S2 cells transfected with plasmids expressing Ihog-YFP were plated on the glass surface, and stained for YFP following MEM-fix as previously described (Bodeen et al., 2017). Scale bar, 5 µm.
Figure 4—figure supplement 2
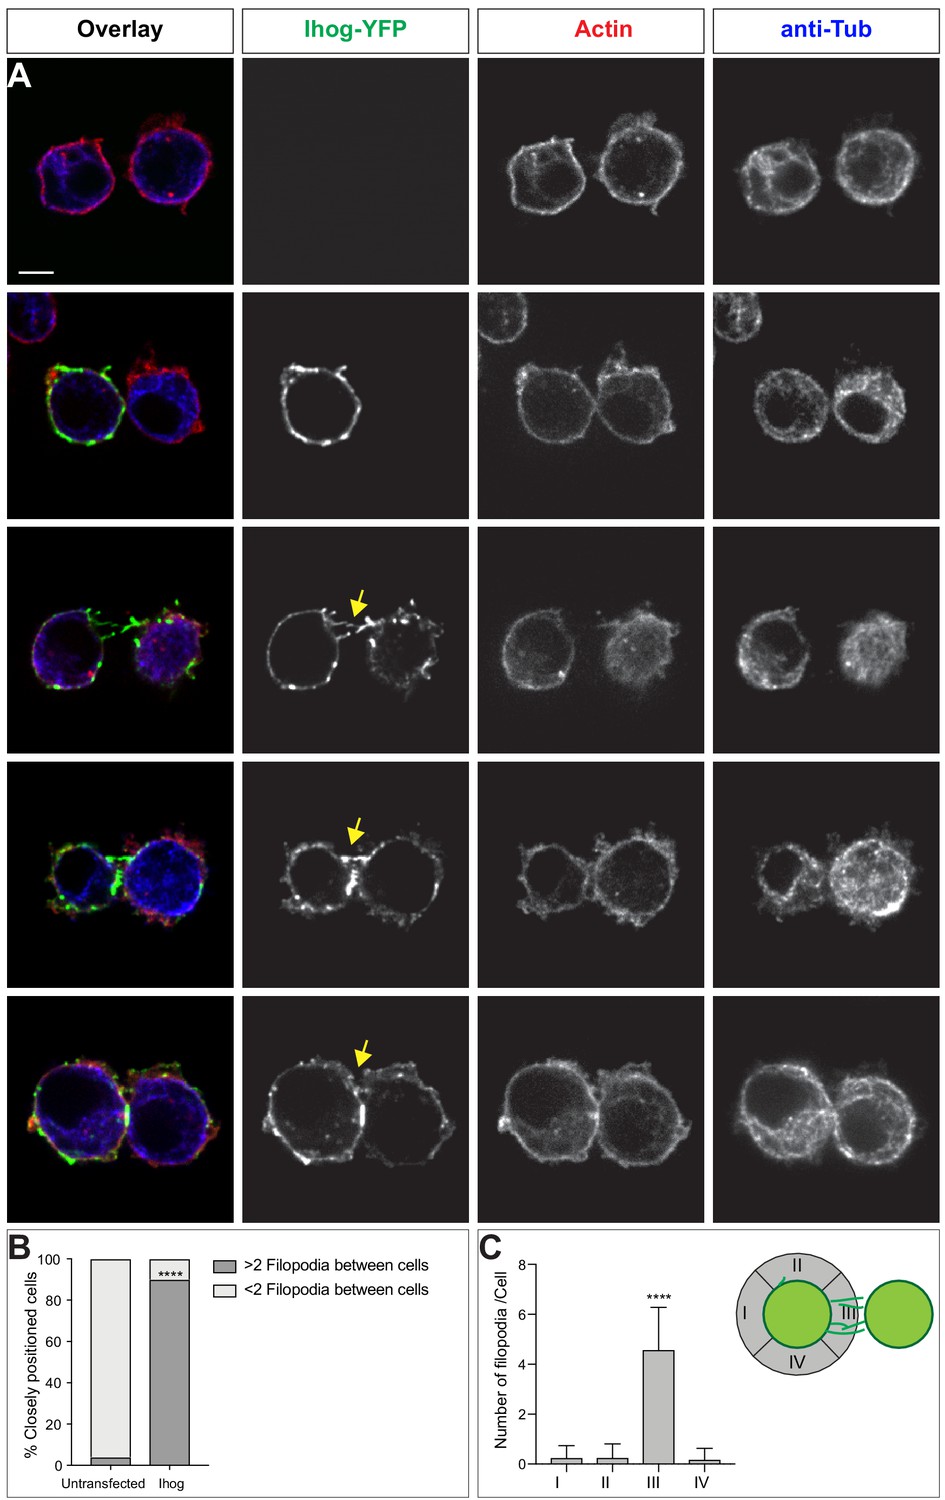
Ihog is enriched in filopodia-like structures of closely positioned Ihog-expressing cells.
S2 cells transfected with plasmids expressing Ihog-YFP were plated on the glass surface, fixed, and stained for actin (Phalloidin, red) and alpha-tubulin (blue). Representative images of two closely positioned untransfected cells (A), singular Ihog-expressing cell located next to an untransfected cell, two closely positioned Ihog-expressing cells (C–D), and Ihog-expressing cells that appear to start forming a stable contact (E). Scale bar, 5 µm. (F) Quantification of the presence and absence of filopodia between closely located S2 cells with or without Ihog expression. Two-sided Fisher's exact test was used for statistical analysis. ****p<0.0001. (G) Quantification of filopodia spatial distribution of Ihog-expressing cells closely located to another Ihog-expressing cell. One-way ANOVA followed by Tukey’s multiple comparison test was used for statistical analysis. ****p<0.0001.
Figure 4—figure supplement 3
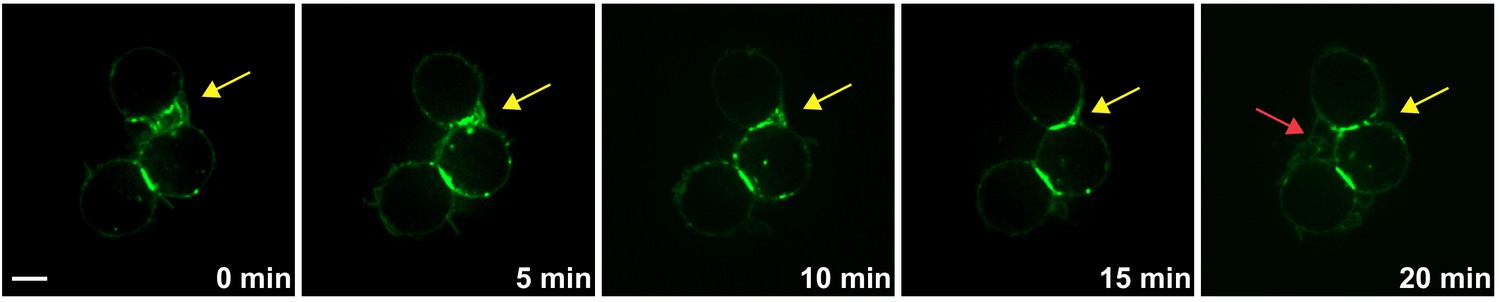
Cell-cell contact initiation along the filopodia of non-adjacent Ihog-expressing S2 cells.
Time-lapse imaging of live S2 cells expressing Ihog-YFP. Filopodia (yellow arrows) extending from non-adjacent Ihog-YFP-expressing cells interdigitated, then shortened to bring the two cells closer, and finally established a stable cell-cell contact (yellow arrows). Red arrow indicates new filopodia-filopodia contacts initiated between two Ihog-YFP expressing cells. Scale bar, 5 µm.
Figure 4—video 1
Subcellular localization of Ihog proteins in aggregated live S2 cells.
Confocal microscope Z-stack images of a pair of live S2 cells transfected with plasmids expressing YFP-tagged Ihog. Images from the same cells. Note that representative focal planes from this video were also shown in Figure 4—figure supplement 1C.
Figure 4—video 2
Subcellular localization of Ihog proteins in aggregated live S2 cells.
Maximum projection of the Confocal microscope Z-stack images (Figure 4—video 1) of a pair of live S2 cells transfected with plasmids expressing YFP-tagged Ihog. Note that a representative snapshot of the maximum projection was also shown in Figure 4—figure supplement 1A.
Figure 4—video 3
Subcellular localization of Ihog proteins in singular live S2 cells.
Confocal microscope Z-stack images of a single live S2 cell transfected with plasmids expressing YFP-tagged Ihog. Images from the same cells. Note that representative focal planes from this video were also shown in Figure 4—figure supplement 1F.
Figure 4—video 4
Subcellular localization of Ihog proteins in singular live S2 cells.
Maximum projection of the Confocal microscope Z-stack images (Figure 4—video 3) of a single live S2 cell transfected with plasmids expressing YFP-tagged Ihog. Note that a representative snapshot of the maximum projection was also shown in Figure 4—figure supplement 1D.
Figure 4—video 5
Homophilic Ihog-Ihog trans binding enables direct cytoneme-cytoneme contact formation.
Confocal microscope Z-stack images from the apical to the basal surface of the columnar epithelium of a wing imaginal disc from 3rd instar larvae carrying clones marked by the CoinFLP-LexGAD/GAL4 system and the GRASP system. The wing disc was immunostained with antibodies against Ihog (red, both Ihog-RFP and IhogΔFn2-HA expressing cells) and HA (blue, IhogΔFn2-HA expressing cells) as indicated. GRASP signal is green. Note that representative focal planes from this video were also shown in Figure 4C,D.
Figure 5 with 3 supplements
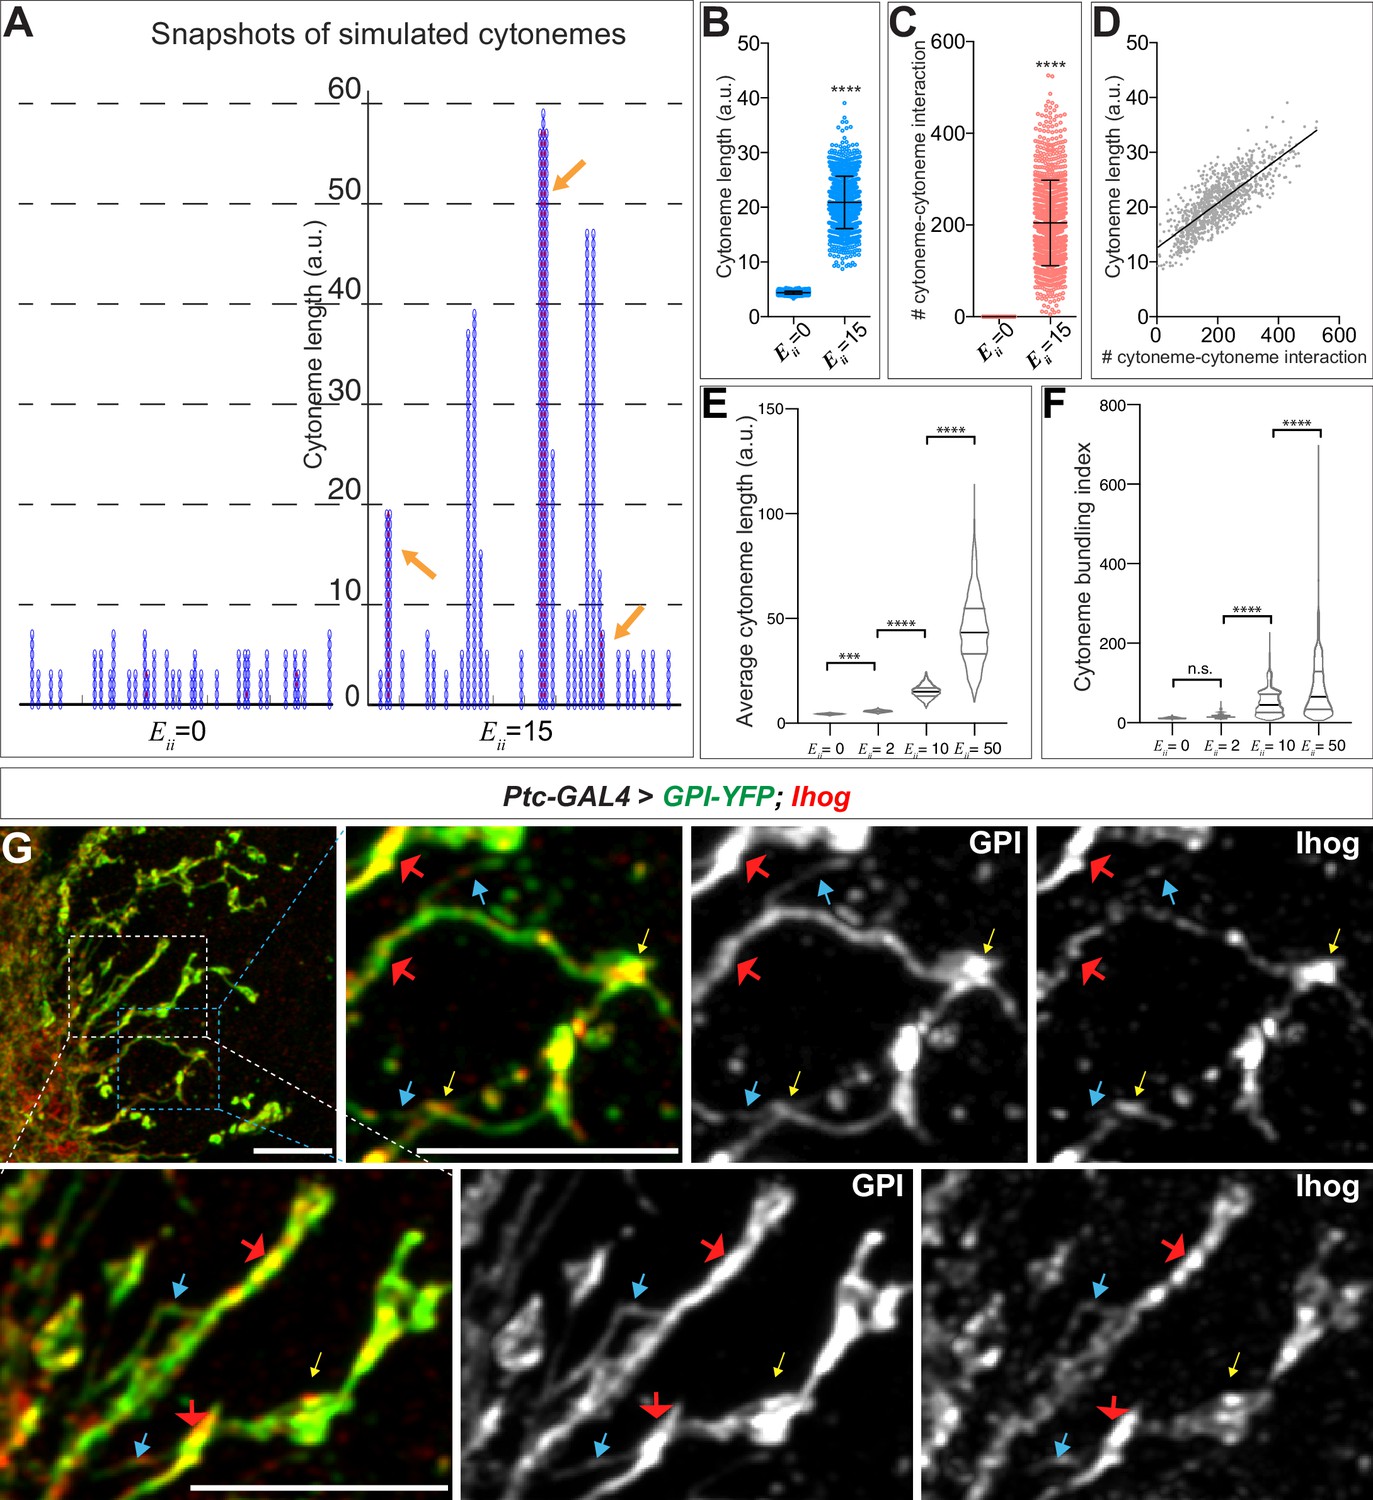
Computational modeling predicts that trans homophilic Ihog interactions stabilize cytonemes.
(A) Snapshots of simulated cytoneme configurations with no (left, ) homophilic trans interactions and with moderately strong (right, ) homophilic trans interactions. The solid black horizontal lines at the bottom represent the cell surface. The blue vertical filaments are cytonemes, within which the elliptical elements are the individual segments. The red dots are the established pairwise interactions between neighboring segments. The orange arrows indicate the bundled neighboring cytonemes with extensive pairwise contacts. (B, C) The average cytoneme length and the number of cytoneme-cytoneme interactions at and 15. Each dot is obtained from 1 randomly picked snapshot from the simulation. Each bar shows the mean ± SD, n = 1001. (D) Correlation between the cytoneme length and the number of pairwise interactions at . Each dot represents the length and the number of interactions for individual cytonemes. The line shows the best fit linear regression (Pearson r = 0.7939). (E) Effect of homophilic trans interaction strength on the average cytoneme length. The average length of the simulated cytonemes is plotted against ranging from 0 to 50. Each bar shows the mean ± SD, n = 1001. (F) Effect of homophilic trans interaction strength on the formation of cytoneme bundles. The cytoneme bundling index for all cytoneme bundles identified from n=1001 random snapshots, each containing 30 cytonemes, were plotted against ranging from 0 to 50. Each bar shows the mean ± SD, n = 1001. The two-tailed unpaired t-test (B, C) or one-way ANOVA followed by Sidak’s multiple comparison test (E, F) was used for statistical analysis. ***p < 0.001, ****p < 0.0001. (G) Wing discs from 3rd instar larvae carrying ptc-GAL4, tub-GAL80ts, and UAS-GPI-YFP; UAS-Ihog were immunostained for YFP (GPI, green) and Ihog (Ihog, red), followed by imaging with Airyscan. Yellow arrows indicate the annular structures observed by regular confocal microscopy; blue arrows indicate likely single cytonemes; red arrows indicate bundles containing multiple cytonemes. Scale bar, 5 µm.
-
Figure 5—source data 1
Contains numerical data plotted in Figure 5B,C,D,E and F.
- https://cdn.elifesciences.org/articles/65770/elife-65770-fig5-data1-v1.xlsx
Figure 5—figure supplement 1
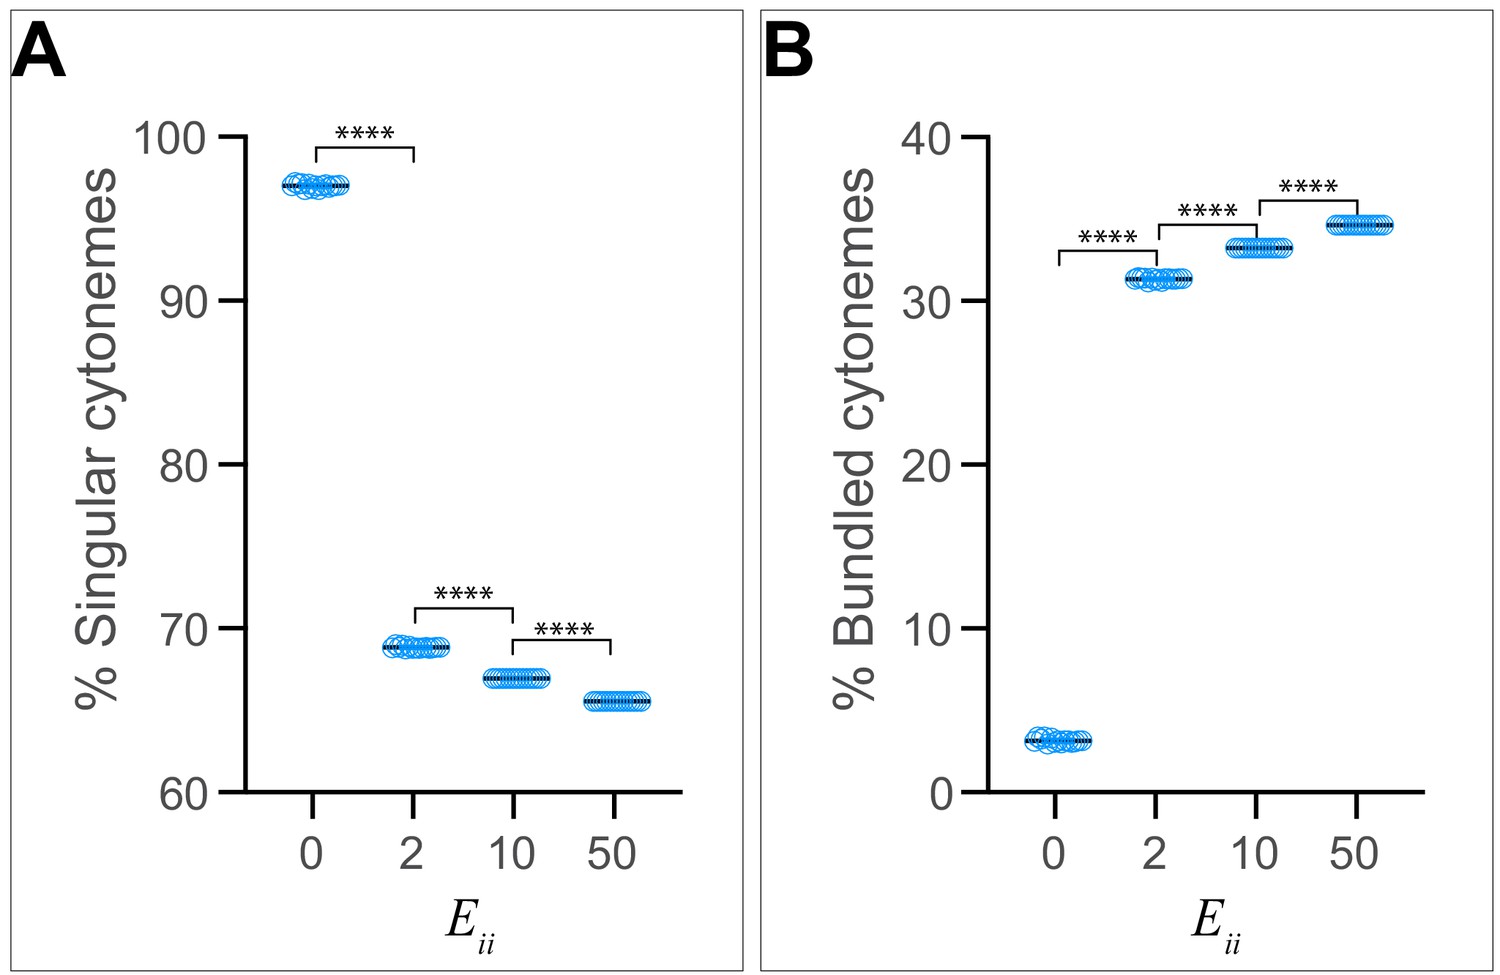
Effect of homophilic trans interaction strength on the frequency of cytoneme bundle formation.
The ratio of singular cytonemes (A) and the ratio of cytonemes present in bundles (B) from n=1001 random snapshots, each containing 30 cytonemes, are plotted against ranging from 0 to 50. Each bar shows the mean ± SD, one-way ANOVA followed by Sidak’s multiple comparison test was used for statistical analysis. ****p < 0.0001.
Figure 5—figure supplement 2
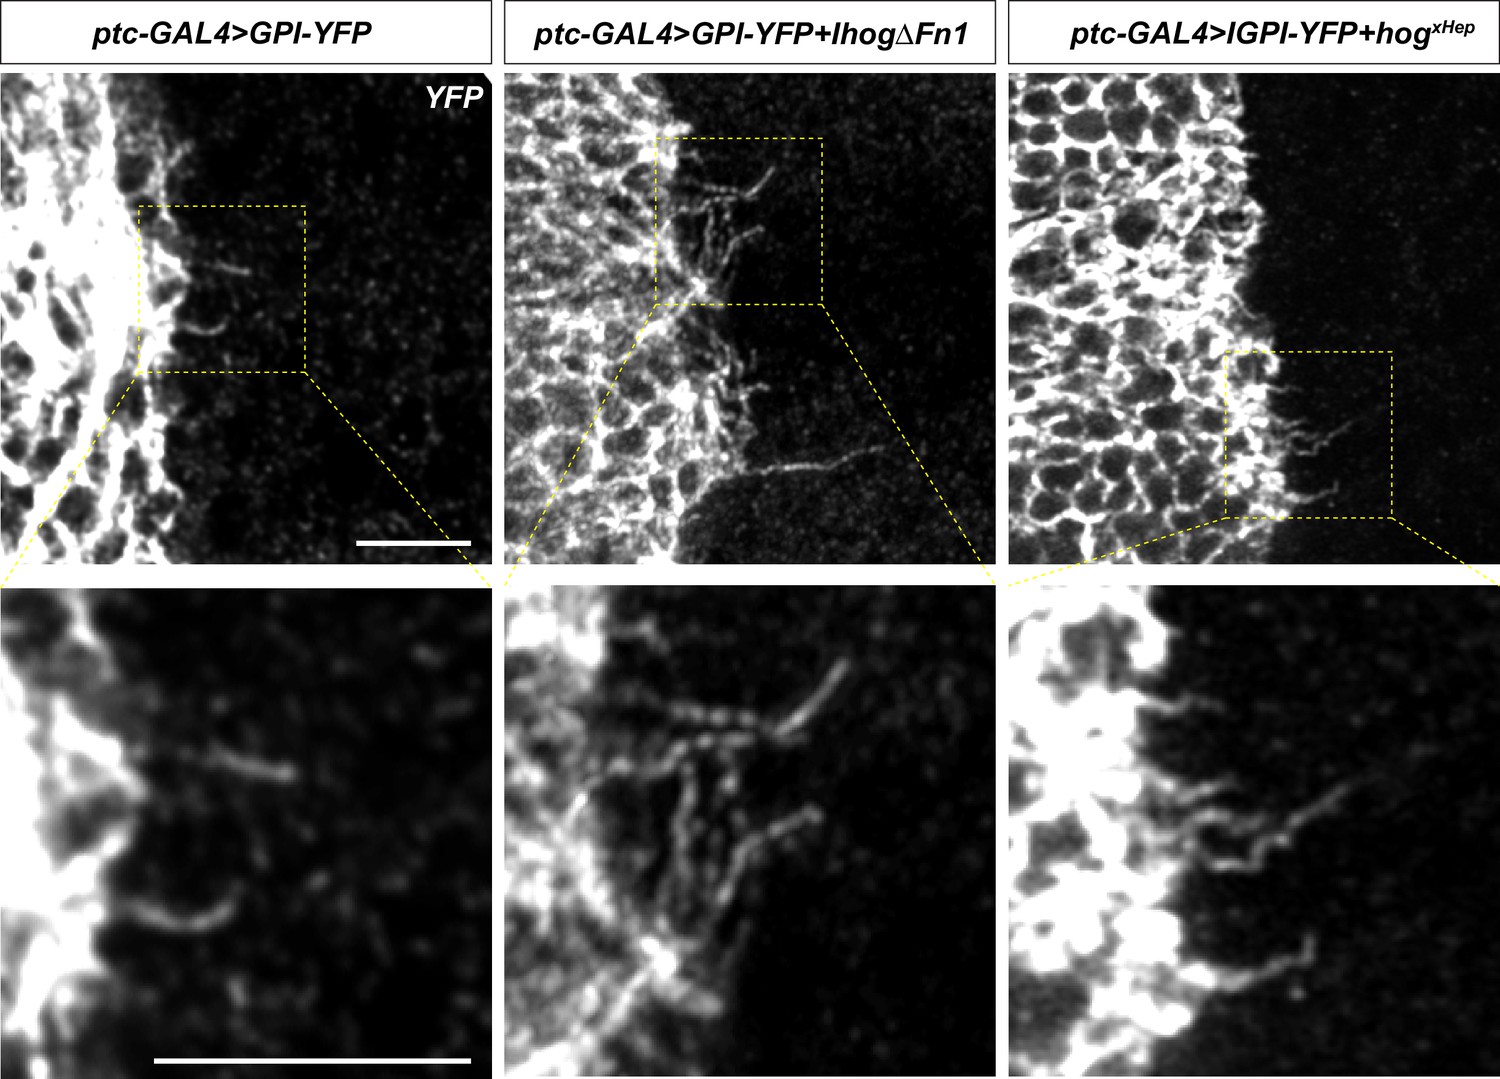
The Ihog Fn1 domain is essential for cytoneme bundling.
Wing discs from 3rd instar larvae carrying ptc-GAL4, tub-GAL80ts and the indicated UAS-transgene were immunostained for YFP and imaged with Airyscan. Scale bar, 5 µm.
Figure 5—figure supplement 3
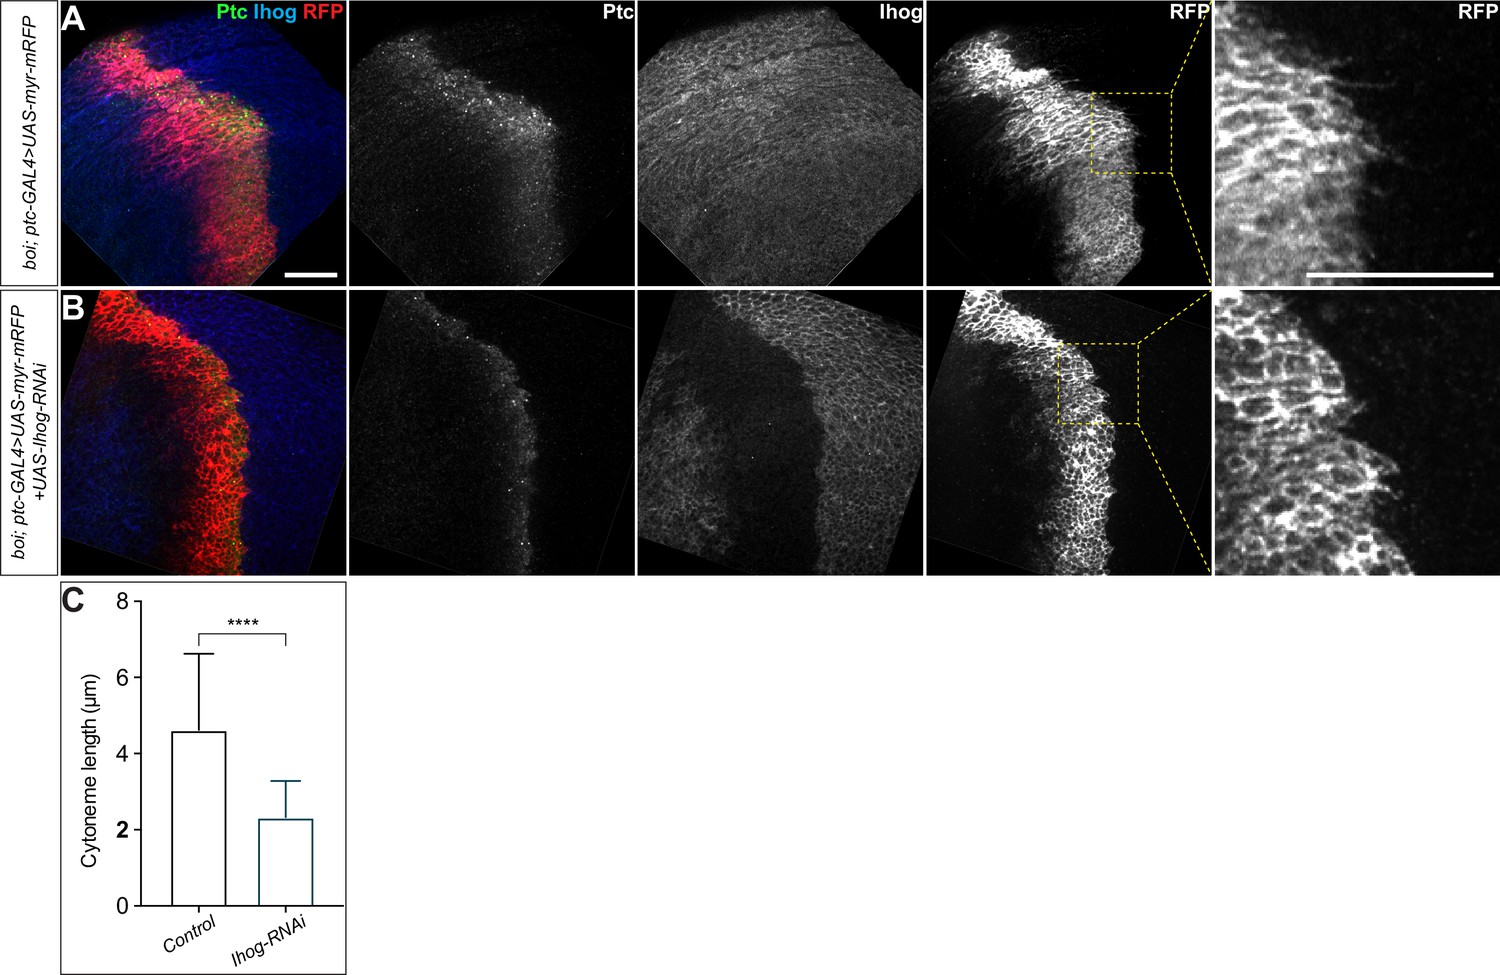
Loss of Ihog and its close paralogue boi from the wing imaginal discs cells resulted in cytonemes with reduced length.
(A, B) Wing discs from 3rd instar boi mutant larvae carrying the ptc-GAL4, tub-GAL80ts and the indicated UAS transgenes were immunostained to visualize Ptc (anti-Ptc, green), Ihog (anti-Ihog, blue), and the cytonemes (anti-RFP, red). Note that expression of UAS-Ihog-RNAi lead to loss of Ihog expression in the Ptc expressing domain (B) and resulted in cytonemes with reduced length. Scale bar, 20 µm. (C) Quantification of the average cytoneme length. Each bar shows the mean ± SD, n = 30 discs, and representative images are shown in (A, B). Two-tailed unpaired t-test was used for statistical analysis. ****p<0.0001.
Figure 6 with 3 supplements
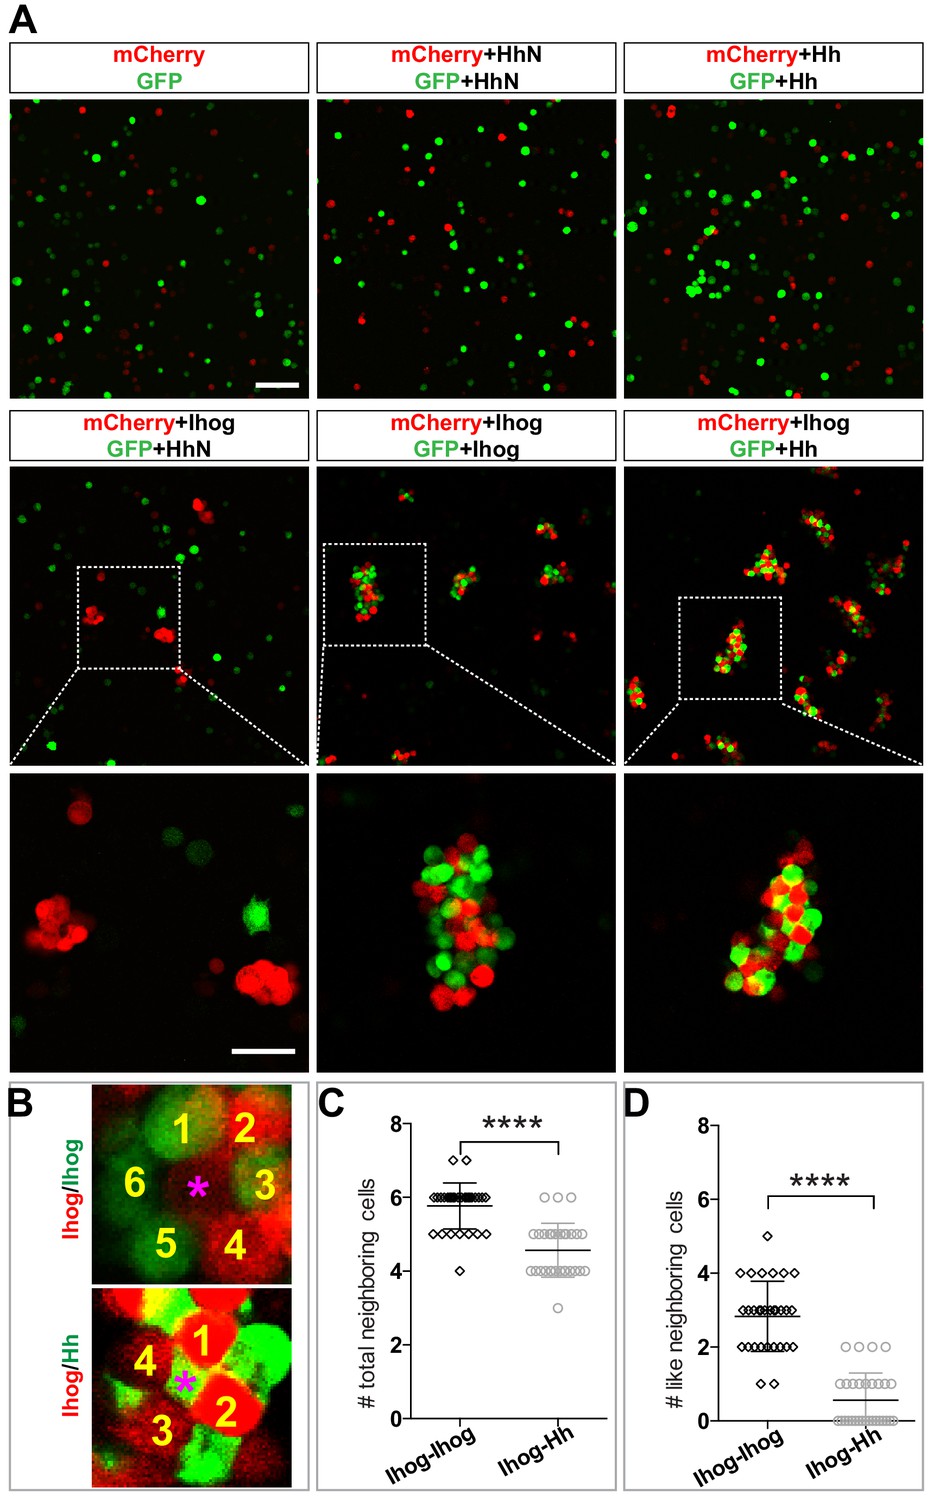
Heterophilic binding of Ihog to Hh dominates over Ihog-mediated homophilic trans interactions.
(A) S2 cells were transfected with plasmids expressing Ihog, Hh, or HhN along with expression plasmids for either GFP or mCherry as indicated. Cells were dissociated by trypsin treatment and then mixed for 12 hr to allow aggregation to occur. The top and middle rows show the mixing of cells expressing only the fluorescent proteins or together with Hh, HhN, or Ihog. Scale bar, 100 µm. The bottom row shows the indicated zoomed area from the middle row images. Scale bar, 50 µm. (B) Representative examples used for quantification of cell patterns in aggregates. The center cells in cell aggregates are indicated by purple asterisks. The neighboring cells are counted and labeled with yellow numbers. (C, D) The average numbers of total neighbor cells and ‘like’ (expressing the same proteins and thus the same color as the center cell) neighbor cells were quantified. Each bar shows the mean ± SD, n = 30 center cells (from n > 3 experiments). The unpaired two-tailed t-test was used for statistical analysis. ****p<0.0001.
-
Figure 6—source data 1
Contains numerical data plotted in Figure 6C and D.
- https://cdn.elifesciences.org/articles/65770/elife-65770-fig6-data1-v1.xlsx
Figure 6—figure supplement 1
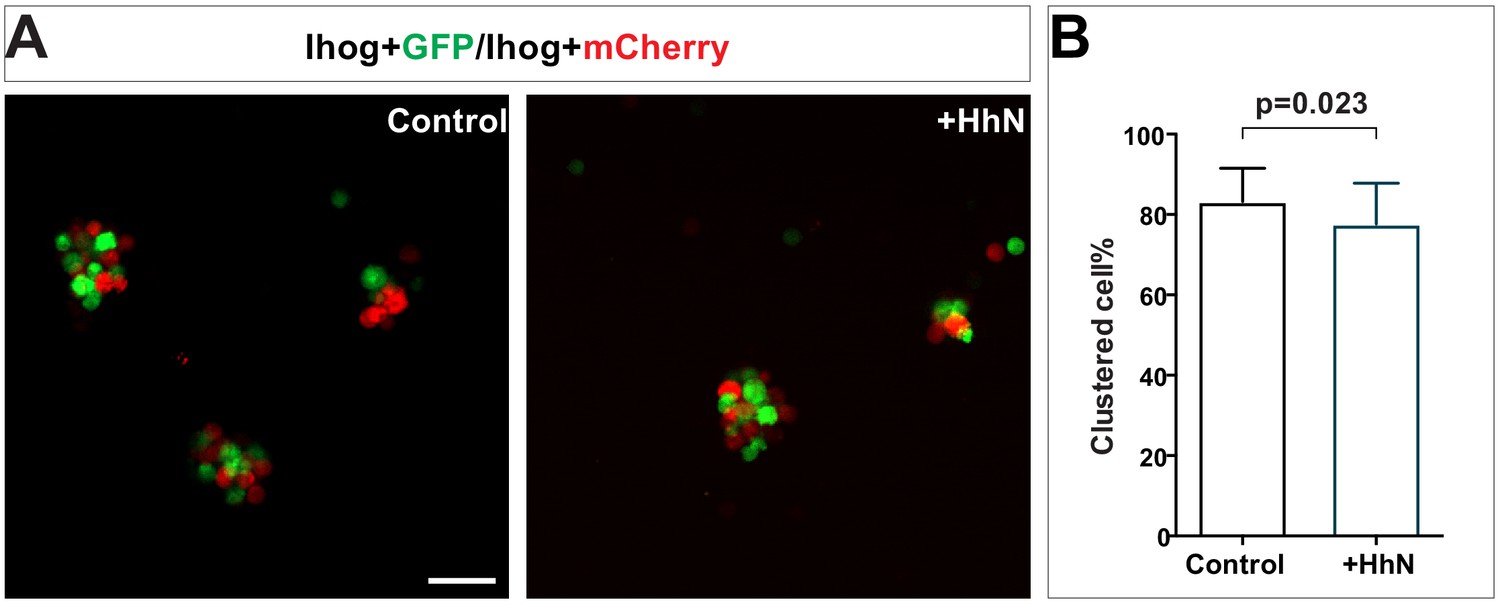
Ihog-mediated homophilic trans interaction in S2 cells occurs in the presence of recombinant HhN.
(A) S2 cells were transfected with plasmids expressing wild-type Ihog along with GFP or mCherry. Cells were dissociated by trypsin treatment and then mixed in the absence or presence of HhN (30 μM) for 4 hr. Scale bar, 50 µm. (B) The aggregation effect from experiments like those shown in (A) was quantified as the ratio of transfected cells within a cluster to total transfected cells. Each bar shows the mean ± SD from n = 30 different images. The unpaired two-tailed t-test was used for statistical analysis.
Figure 6—figure supplement 2
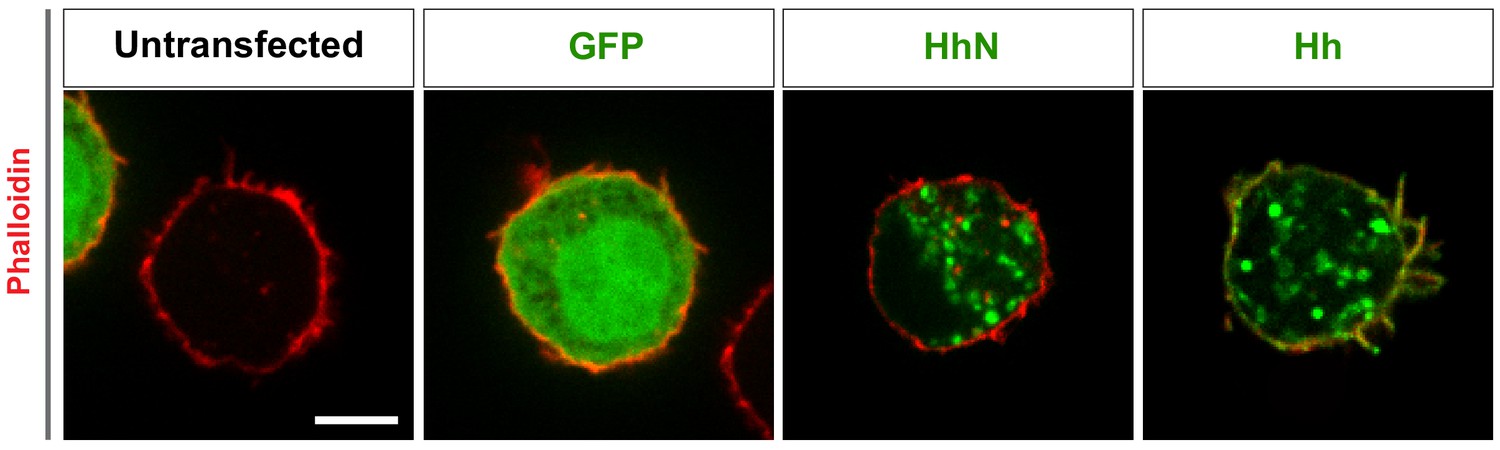
Subcellular localization of Hh and HhN in S2 cells.
Untransfected S2 cell or S2 cells were transfected with constructs expressing GFP, cDNA encoding full-length Hh to generate Hh proteins that are fully processed and dual lipid modified, or cDNA encoding the amino-terminal signaling fragment HhN to generate cholesterol-free HhN. 48 hr after transfection, the S2 cells were fixed and stained with Phalloidin to detect actin (red) and the antibodies against the indicated proteins (green). Phalloidin stains filopodia-like structures and the submembrane actin network. Note that the untransfected cell is from the control cells transfected with only GFP and is from the same experiment and image. The GFP cell is partially visible in the untransfected cell image (left corner) and the nontransfected cell is partially visible in the lower right of the GFP cell image. Scale bar, 5 µm.
Figure 6—figure supplement 3
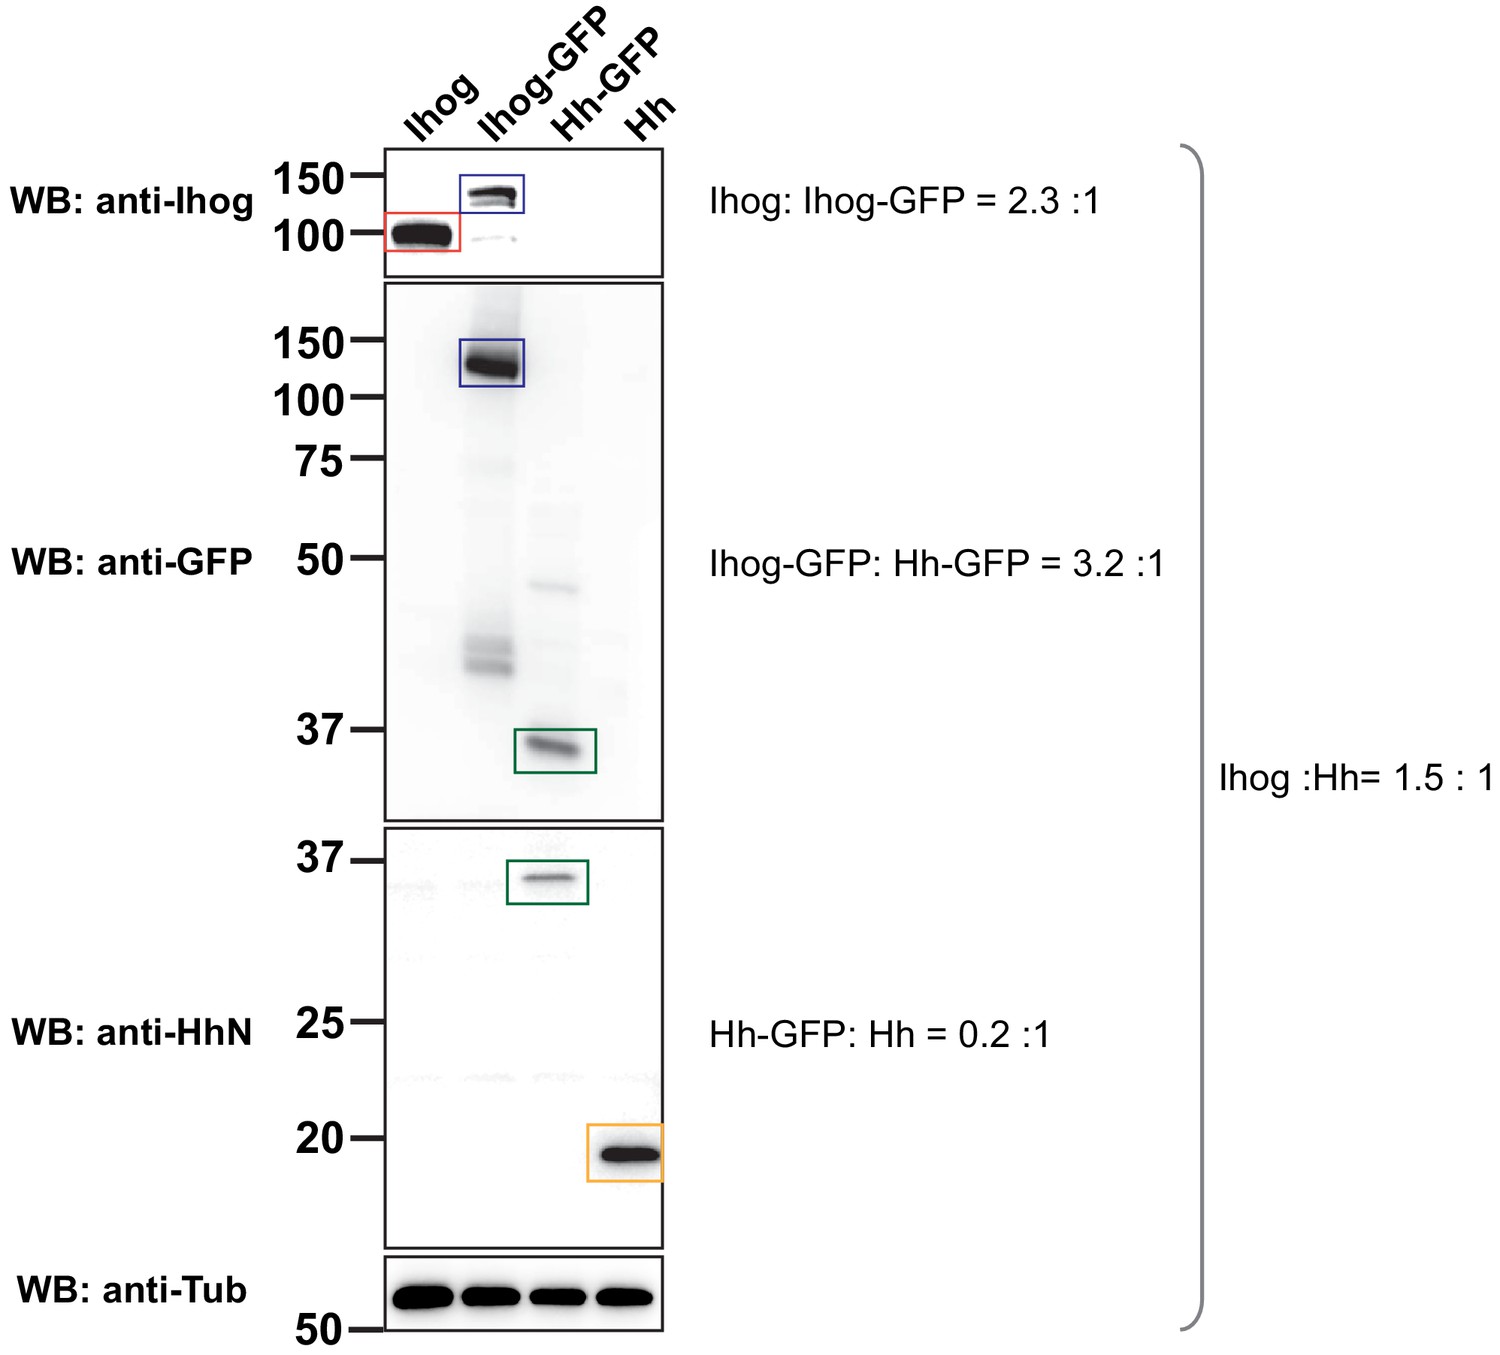
Comparison of the amount of Ihog and Hh in S2 cells analyzed in the cell-mixing assay.
Aliquots of the same S2 cells analyzed in the cell mixing assay in Figure 6 were lysed before cell mixing (Lane one and Lane 4). To indirectly compare the relative amounts of Ihog and Hh, lysates were collected from S2 cells that were transfected in parallel with plasmids expressing Ihog-GFP or Hh-GFP (Lane 2 and Lane 3). The amount of Ihog (red rectangle) or Hh (orange rectangle) was detected by immunoblotting with anti-Ihog or anti-Hh, respectively. The amount of GFP-tagged Ihog (blue rectangles) or GFP-tagged Hh (green rectangles) was also detected by anti-GFP. The intensity of the indicated bands was measured by ImageJ. Comparison of the intensity shows that S2 transfected cells from the same experiment used for the aggregation assays express comparable amounts (~1.5:1) of Ihog and Hh proteins.
Figure 7
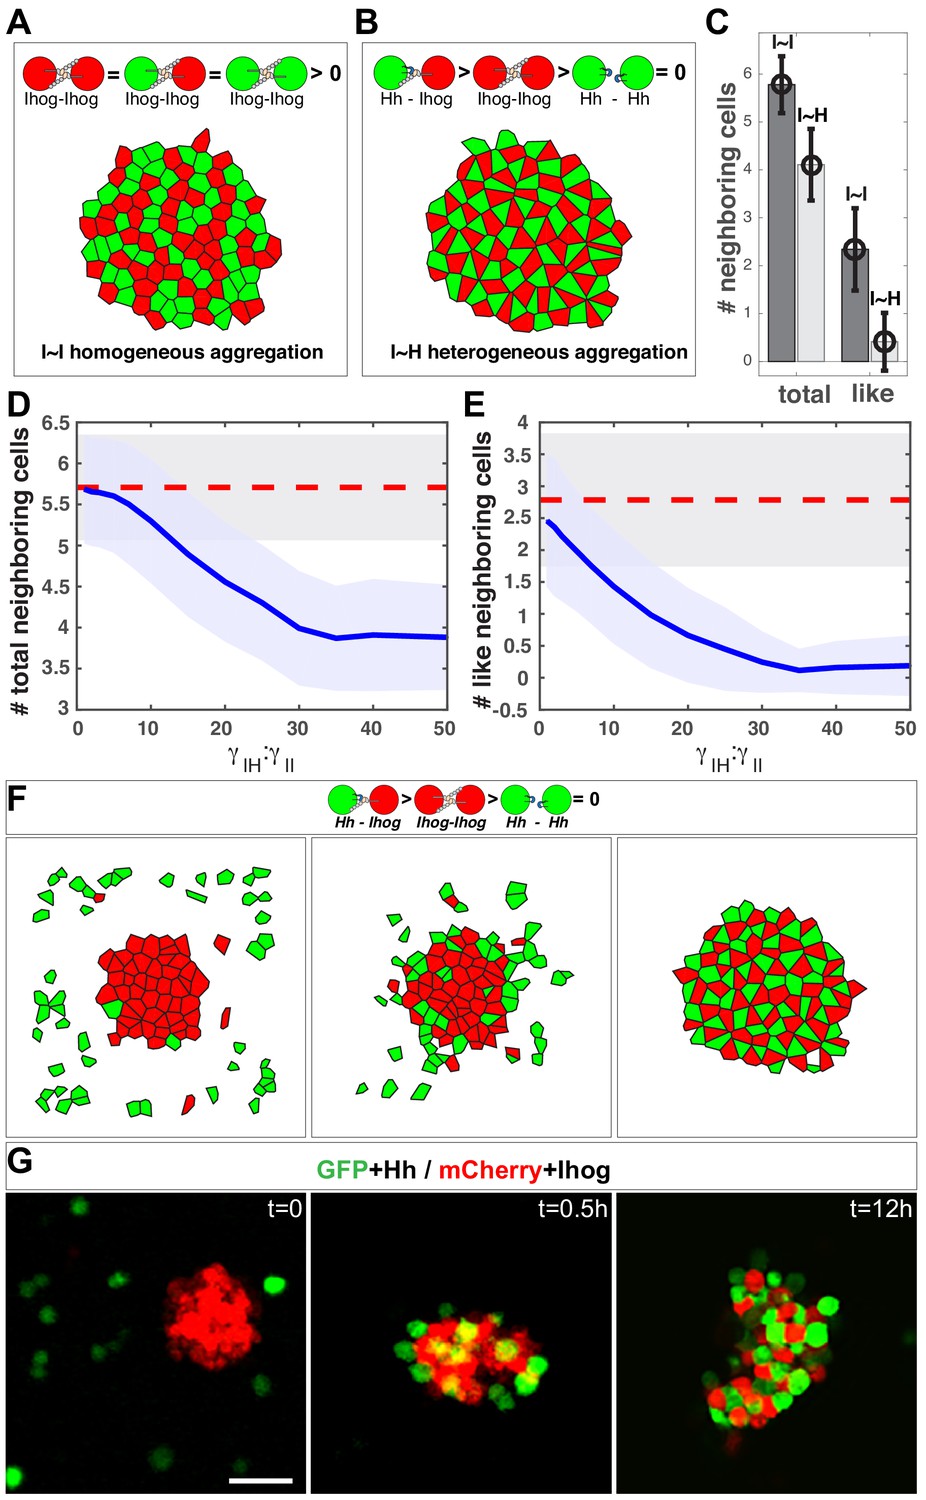
In silico simulation estimates the difference in strength between the heterophilic Ihog-Hh and homophilic Ihog-Ihog trans interactions.
(A, B) Representative steady-state patterns of the multicellular system from simulations with differentially labeled Ihog-expressing cells (A) and mixed Ihog- and Hh-expressing cells (B). (C) The average numbers of total neighbor cells and 'like' neighbor cells were quantified for scenarios (A, I~I bars) and (B, I~H bars). Data were obtained from 300 random snapshots. Each error bar shows the mean ± SD. (D, E) Blue lines are the quantified relationships between the average numbers of total neighbor cells (D) and 'like' neighbor cells (E) in a mixed system as a function of the difference in strength between the heterophilic Ihog-Hh () and homophilic Ihog-Ihog () trans interactions. For comparison, the red dashed lines mark the values obtained from homogeneous system with differentially labeled Ihog-expressing cells. The shaded areas outline the standard deviations around the corresponding central average values. Each data point was calculated using 300 random snapshots from the simulation. (F) Simulation with , starting with an aggregate formed from 50 Ihog-expressing cells, then 50 Hh-expressing cells were added into the simulation space (left). The energy-based evolution leads to the surface engagement of Hh-expressing cells onto the Ihog-expressing cell aggregate (middle) and eventually a checkerboard-like morphological pattern (right) appears as the simulation reaches steady state. (G) S2 cells were transfected with plasmids expressing Hh and GFP or Ihog and mCherry as indicated. Forty-eight hr after transfection, cells were resuspended by pipetting and then mixed as indicated. Cell mixture was incubated with gentle rotating for 12 hr. At the indicated time points, an aliquot of cells was removed and imaged with a confocal microscope. Representative images from three experiments are shown. Scale bar, 50 µm.
-
Figure 7—source data 1
Contains numerical data plotted in Figure 7C.
- https://cdn.elifesciences.org/articles/65770/elife-65770-fig7-data1-v1.xlsx
Figure 8
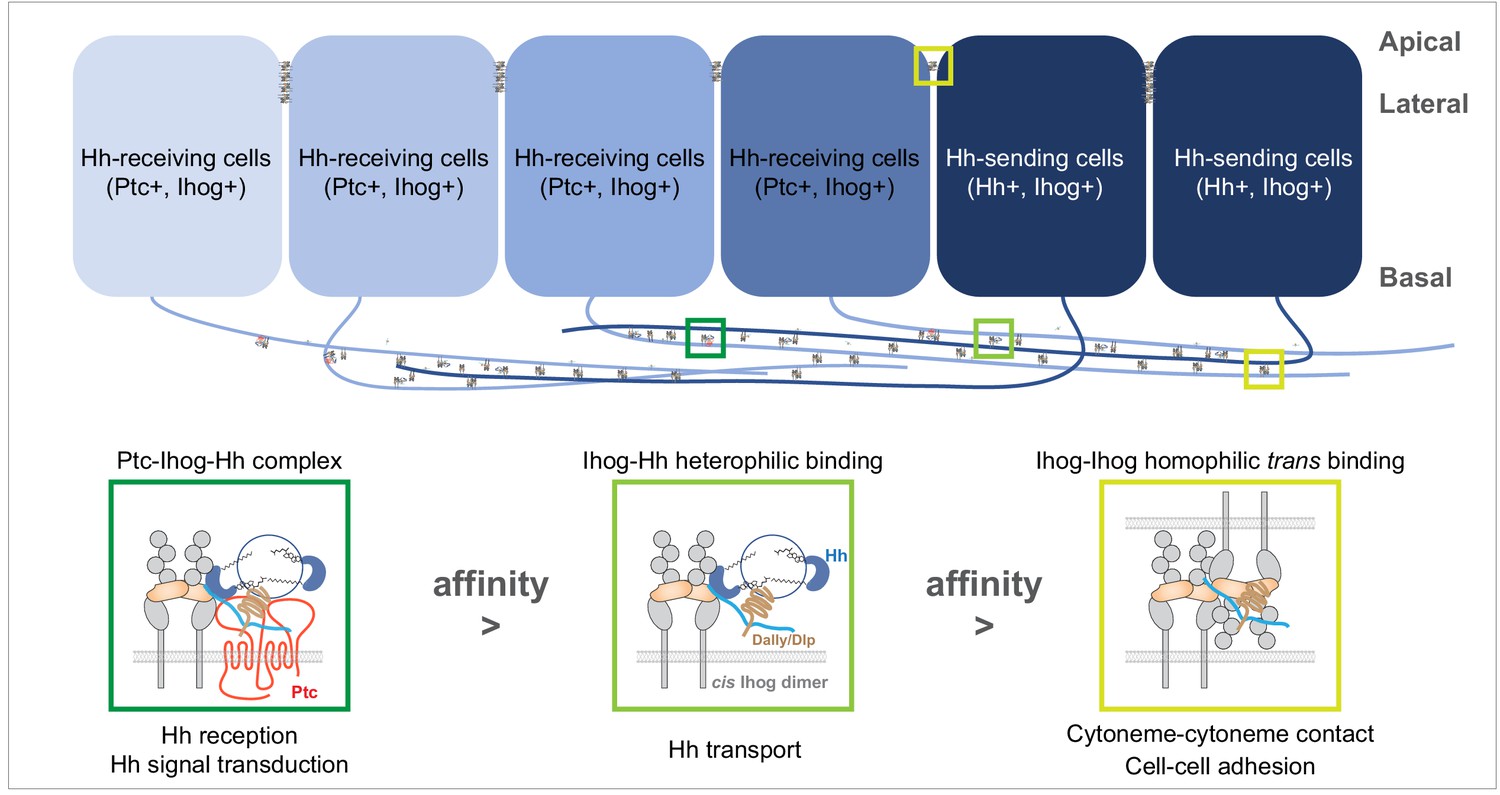
A model of the competitive coordination of the dual roles of Ihog in homophilic adhesion and signal reception.
Diagram illustrating Ihog-Ihog homophilic trans interaction and Ihog-Hh heterophilic interaction in the wing imaginal disc epithelium. For simplicity, only a small number of the apical and lateral interactions are shown. Based on the differential affinity (Ptc-Ihog-Hh > Ihog-Hh > Ihog-Ihog) and the competitive binding between Ihog for itself (in trans) and for Hh, we propose a model in which Ihog-Ihog trans interactions promote and stabilize cytoneme-cytoneme contacts, thereby facilitating the ‘capture’ of Hh ligands, released from cytonemes of Hh-expressing cells, by Ihog on cytonemes of adjacent cells, ultimately reaching Ihog on cytonemes of Hh-receiving cells. The stronger Hh-Ihog interaction triggers release of Ihog from the weaker trans-homophilic interaction, enabling the receptor-ligand complex to transport along the cytoneme. Ultimately, the strongest interaction of Hh with the Ptc and Ihog complex results in Hh signal transduction. Both Hh release and cytoneme formation occur at the basal side of the wing disc epithelium, making weaker Ihog-Ihog trans interactions accessible for the replacement by stronger Ihog-Hh interactions along the cytonemes, where Ihog also functions as the receptor for Hh transport and reception. In contrast, farther from the source of secreted Hh, heterophilic Ihog-Hh interactions would be infrequent along the lateral side of epithelia, where the trans Ihog-Ihog interaction plays an essential role in maintaining A/P cell segregation and lineage restriction. The heparan sulfate necessary for the Ihog-Hh or trans Ihog-Ihog interactions may be supplied by Dally or Dlp, either as the membrane-associated forms of these glypicans or as the form released upon shedding.
Tables
Key resources table
| Reagent type (species) or resource | Designation | Source or reference | Identifiers | Additional information |
|---|---|---|---|---|
| Genetic reagent (D. melanogaster) | hs-FLP | Golic and Lindquist, 1989 | FBti0000785 | Chr 1. |
| Genetic reagent (D. melanogaster) | Actin> y+> GAL4 | Ito et al., 1997 | FBti0009983 | Chr 2. |
| Genetic reagent (D. melanogaster) | ptc-GAL4 | Hinz et al., 1994 | FBal0287777 | Chr 2. |
| Genetic reagent (D. melanogaster) | CoinFLP-LexA::GAD.GAL4 | BDSC | RRID:BDSC_58753 | Chr 2. |
| Genetic reagent (D. melanogaster) | tub-GAL80ts | BDSC | RRID:BDSC_7019 | Chr 2. |
| Genetic reagent (D. melanogaster) | UAS-GMA-GFP | BDSC | RRID:BDSC_31775 | Chr 2. |
| Genetic reagent (D. melanogaster) | UAS-mCD8-GFP | BDSC | RRID:BDSC_5137 | Chr 2. |
| Genetic reagent (D. melanogaster) | UAS-myr-mRFP | BDSC | RRID:BDSC_7119 | Chr 3. |
| Genetic reagent (D. melanogaster) | UAS-GPI-YFP | Greco et al., 2001 | a gift from I. Guerrero | Chr 3. |
| Genetic reagent (D. melanogaster) | UAS-CD4-spGFP1-10 | BDSC | RRID:BDSC_58755 | Chr 3. |
| Genetic reagent (D. melanogaster) | UAS-Ihog WT | Zheng et al., 2010 | Chr 3. | |
| Genetic reagent (D. melanogaster) | UAS-IhogΔFn1 | Zheng et al., 2010 | Chr 3. | |
| Genetic reagent (D. melanogaster) | UAS-IhogΔFn2-HA | This paper | ORF encoding IhogΔFn2 (delete aa 573–685) was cloned into pUAST to generate UAS-IhogΔFn2. | |
| Genetic reagent (D. melanogaster) | UAS-Ihog-RFP | Callejo et al., 2011 | a gift from I. Guerrero | Chr 3. |
| Genetic reagent (D. melanogaster) | UAS-IhogxHep | This paper | ORF encoding IhogXhep(R503E, K507E, K509E, and R547E) was cloned into pUAST to generateUAS- IhogXhep. | |
| Genetic reagent (D. melanogaster) | UAS-Dally WT | BDSC | RRID:BDSC_5379 | Chr 1. |
| Genetic reagent (D. melanogaster) | UAS-Dlp WT | BDSC | RRID:BDSC_9160 | Chr 3. |
| Genetic reagent (D. melanogaster) | UAS-Ptc | Johnson et al., 1995 | Chr 3. | |
| Genetic reagent (D. melanogaster) | UAS-Hh | Lee et al., 1992 | Chr 3. | |
| Genetic reagent (D. melanogaster) | UAS-Ihog-RNAi | VDRC | RRID:BDSC_29897 | Chr 3. |
| Genetic reagent (D. melanogaster) | LexAop-CD4-spGFP11 | BDSC | RRID:BDSC_58755 | Chr 3. |
| Genetic reagent (D. melanogaster) | LexAop. Ihog-RFP | González-Méndez et al., 2017 | a gift from I. Guerrero | Chr 3. |
| Genetic reagent (D. melanogaster) | boi | Zheng et al., 2010 | Chr 1. | |
| Genetic reagent (D. melanogaster) | dallyCPTI001039 | Kyoto Stock Center (DGRC) | RRID:BDSC_115064 | Chr 3. |
| Antibody | Mouse monoclonal anti-Dally-like (Dlp) | DSHB | Cat# 13G8; RRID:AB_528191 | IF: 1: 50 |
| Antibody | Mouse monoclonal anti-Ptc | DSHB | Cat# Apa 1; RRID:AB_528441 | IF: 1: 50 |
| Antibody | Rabbit polyclonal Anti-Hh | Tabata and Kornberg, 1994 | a gift from T. Tabata | IF: 1: 500 |
| Antibody | Rabbit polyclonal anti-GFP | Molecular Probes | Cat# A-11122, RRID:AB_221569 | IF: 1: 2000 |
| Antibody | Rat polyclonal anti-Ihog | Yao et al., 2006 | NA | IF: 1: 500 |
| Antibody | Mouse monoclonal anti-alpha Tubulin (DM1A) | Millipore | Cat# CP06, RRID:AB_2617116 | IF: 1:5000 |
| Antibody | Rabbit polyclonal anti-Hh | Lee et al., 1992 | NA | WB: 1:1000 |
| Antibody | Mouse monoclonal anti-beta Tubulin | DSHB | Cat#E7; RRID:AB_2315513 | WB: 1:5000 |
| Antibody | Mouse monoclonal anti-HA.11 (16B12) | Covance | Cat# MMS-101P-1000, RRID:AB_291259 | IF: 1:1000 |
| Antibody | Fluorophore-conjugated secondary antibodies | Jackson Immuno-Research Lab | NA | IF:1: 500 |
| Antibody | HRP-conjugated secondary antibodies | Jackson Immuno-Research Lab | NA | WB: 1:10,000 |
| Antibody | Alexa Fluor 594 Phalloidin | Thermo Fisher Scientific | Cat# A12381, RRID:AB_2315633 | IF:1: 100 |
| Others | DAPI | Millipore Sigma | Cat# D9542 | |
| Other | Fetal Bovine Serum | Omega Scientific | Cat# FB-02 | |
| Other | Penicillin-Streptomycin-Glutamine (100X) | Thermo Fisher Scientific | Cat# 10378016 | |
| Other | Antifade mounting media | VECTASHIELD | Cat# H-1000 | |
| Other | FuGENE HD transfection reagent | Promega | Cat# E2311 | |
| Other | 16% Paraformaldehyde aqueous solution | Electron Microscopy Sciences | Cat# 15710 | |
| Recombinant DNA reagent | MBP-HhN expression plasmid | McLellan et al., 2006 | a gift from D. Leahy | |
| Cell line (D. melanogaster) | S2 | DGRC | Cat# S2-DGRC | |
| Software, algorithm | Fiji | NIH | RRID:SCR_002285 | |
| Software, algorithm | GraphPad Prism | GraphPad Software | RRID:SCR_002798 | |
| Software, algorithm | MATLAB | MATLAB Software | RRID:SCR_001622 |
Additional files
-
Supplementary file 1
Complete list of Drosophila melanogaster genotypes used in this study.
The genotype of larvae from where wing discs were collected and imaged in each figure.
- https://cdn.elifesciences.org/articles/65770/elife-65770-supp1-v1.docx
-
Transparent reporting form
- https://cdn.elifesciences.org/articles/65770/elife-65770-transrepform-v1.pdf
Download links
A two-part list of links to download the article, or parts of the article, in various formats.
Downloads (link to download the article as PDF)
Open citations (links to open the citations from this article in various online reference manager services)
Cite this article (links to download the citations from this article in formats compatible with various reference manager tools)
Competitive coordination of the dual roles of the Hedgehog co-receptor in homophilic adhesion and signal reception
eLife 10:e65770.
https://doi.org/10.7554/eLife.65770


