The crystal structure of bromide-bound GtACR1 reveals a pre-activated state in the transmembrane anion tunnel
- Department of Biochemistry and Molecular Biology, Center for Membrane Biology, University of Texas Health Science Center – McGovern Medical School, United States
- Swiss Light Source, Paul Scherrer Institute, Switzerland
- Molecular Biophysics Laboratory, Photonics Center and Department of Physics, Boston University, United States
Figures
Figure 1 with 1 supplement
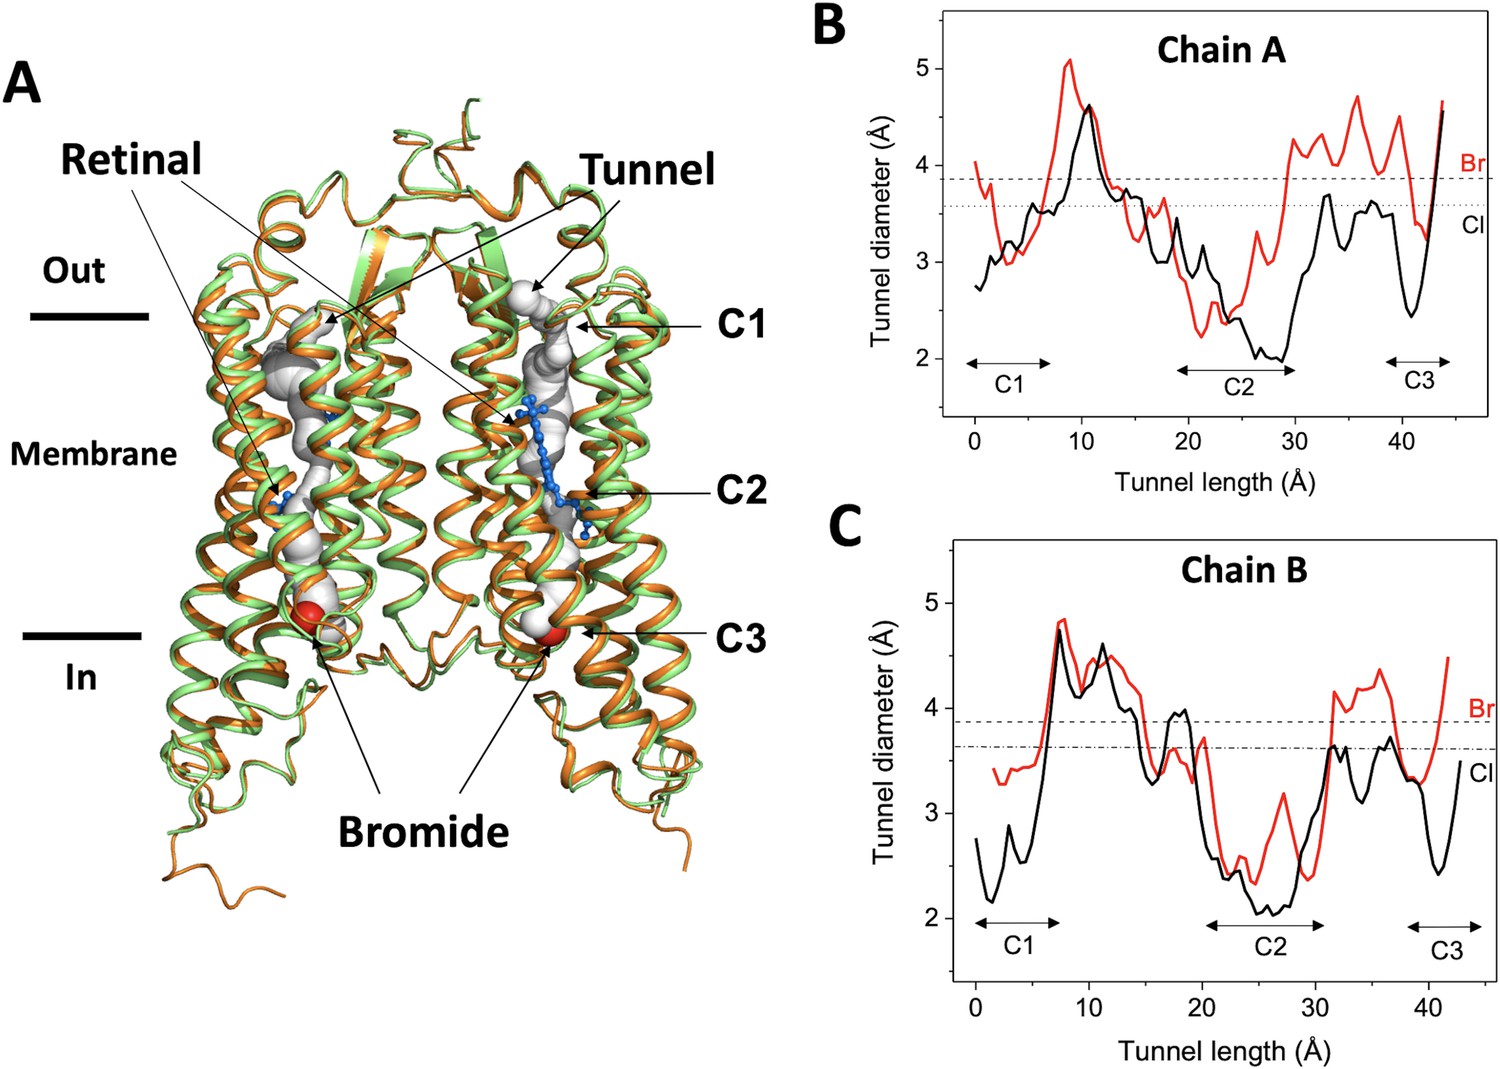
Overall conformation of the bromide-bound GtACR1 structure.
(A) Superimposition of GtACR1 apo (orange, PDB 6EDQ) and bromide-bound (green) structures; one bromide ion (red sphere) is located at the cytoplasmic entry of the intramembrane tunnel (grey tube, predicted using the program CAVER [Chovancova et al., 2012] of each promoter). All-trans-retinal moieties are depicted as blue sticks. (B–C) Tunnel profiles of GtACR1 chain A (B) and chain B (C) predicted by CAVER: GtACR1 apo form (black line); bromide-bound form (red line). The sizes of chloride and bromide ions are indicated as dashed lines.
Figure 1—figure supplement 1
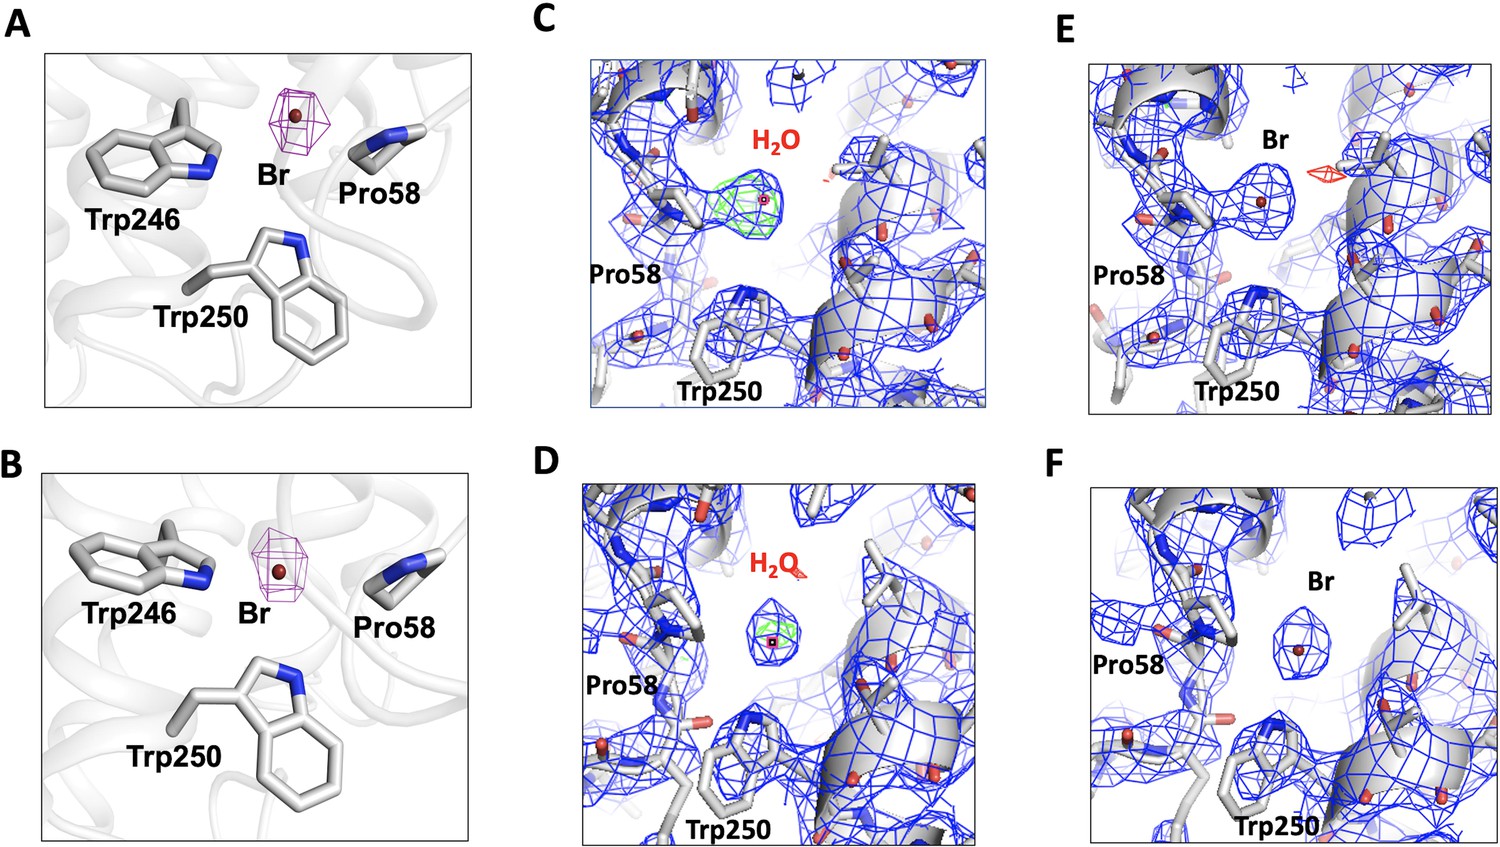
Confirmation of a bromide ion at the cytoplasmic port of GtACR1.
(A–B) Bromide ion (dark red sphere) in the binding site (grey sticks) overlayed with the composite omit map depicted as magenta mesh in chain A (A) contoured at +2σ and chain B (B) contoured at +1.5σ. The composite omit map was calculated using PHENIX (Adams et al., 2010). (C–D) Fo-Fc difference map generated by the refinement of a water molecule at the bromide position showing positive electron density depicted as green mesh (contoured at +3σ) at the water position; (E–F) Fo-Fc difference map generated by the refinement of a bromide ion showing no positive (contoured at +3σ) and negative (contoured at −3σ, red mesh) electron density at the bromide position. 2Fo-Fc maps (contoured at +1σ) were depicted as blue mesh in (C–F).
Figure 2
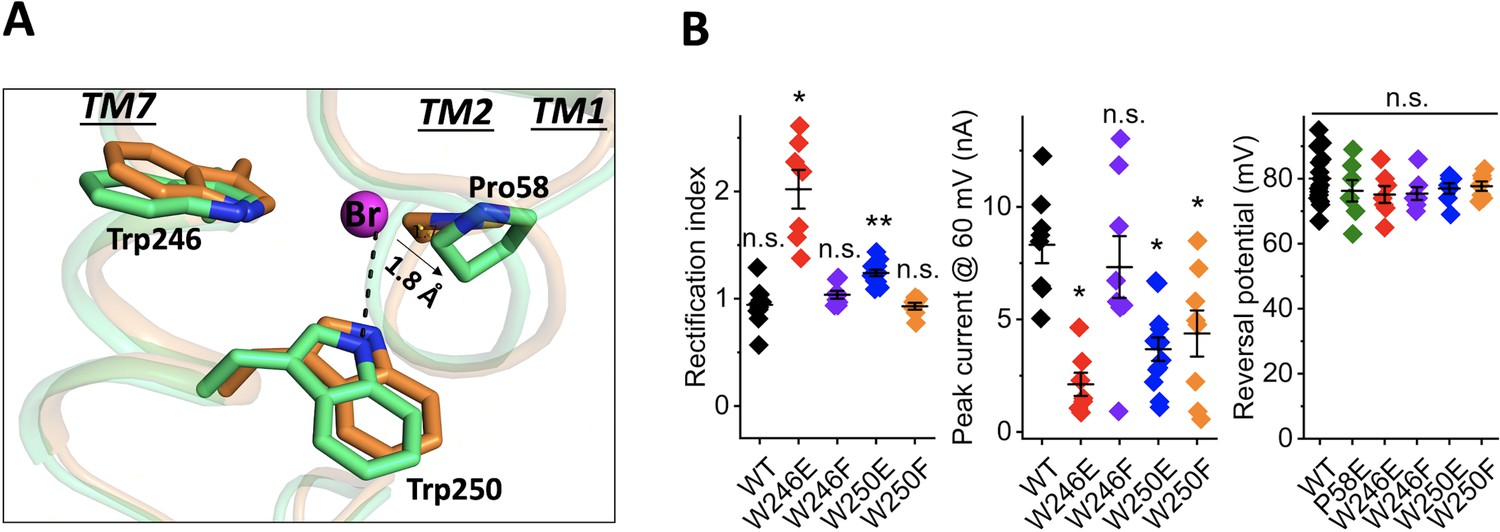
Structure of the bromide-binding site in the apo and bromide-bound GtACR1 and electrophysiological properties of site mutants.
(A) A bromide ion (magenta sphere) stabilized by three cyclic residues (green sticks) via H-bond interaction (black dashed line) with superimposition of the apo form structure (orange). (B) Functional probing of the bromide-binding site residues by patch clamp analysis of their mutants: Left: Rectification index (RI), defined as the ratio of peak photocurrent amplitudes recorded at +60 and −60 mV at the amplifier output. RI > 1 by one-sample Wilcoxon signed-rank test: *p<0.05, **p<0.01, n.s. not significant (p>0.05). Middle: Peak current at 60 mV. Comparison with the wild-type by Mann-Whitney test: *p<0.005. Right: Reversal potential at the reduced Cl- concentration in the bath. Comparison with the wild-type by Mann-Whitney test: n.s., not significant (p>0.05).
-
Figure 2—source data 1
Electrophysiological data for binding site mutants.
- https://cdn.elifesciences.org/articles/65903/elife-65903-fig2-data1-v2.xlsx
Figure 3
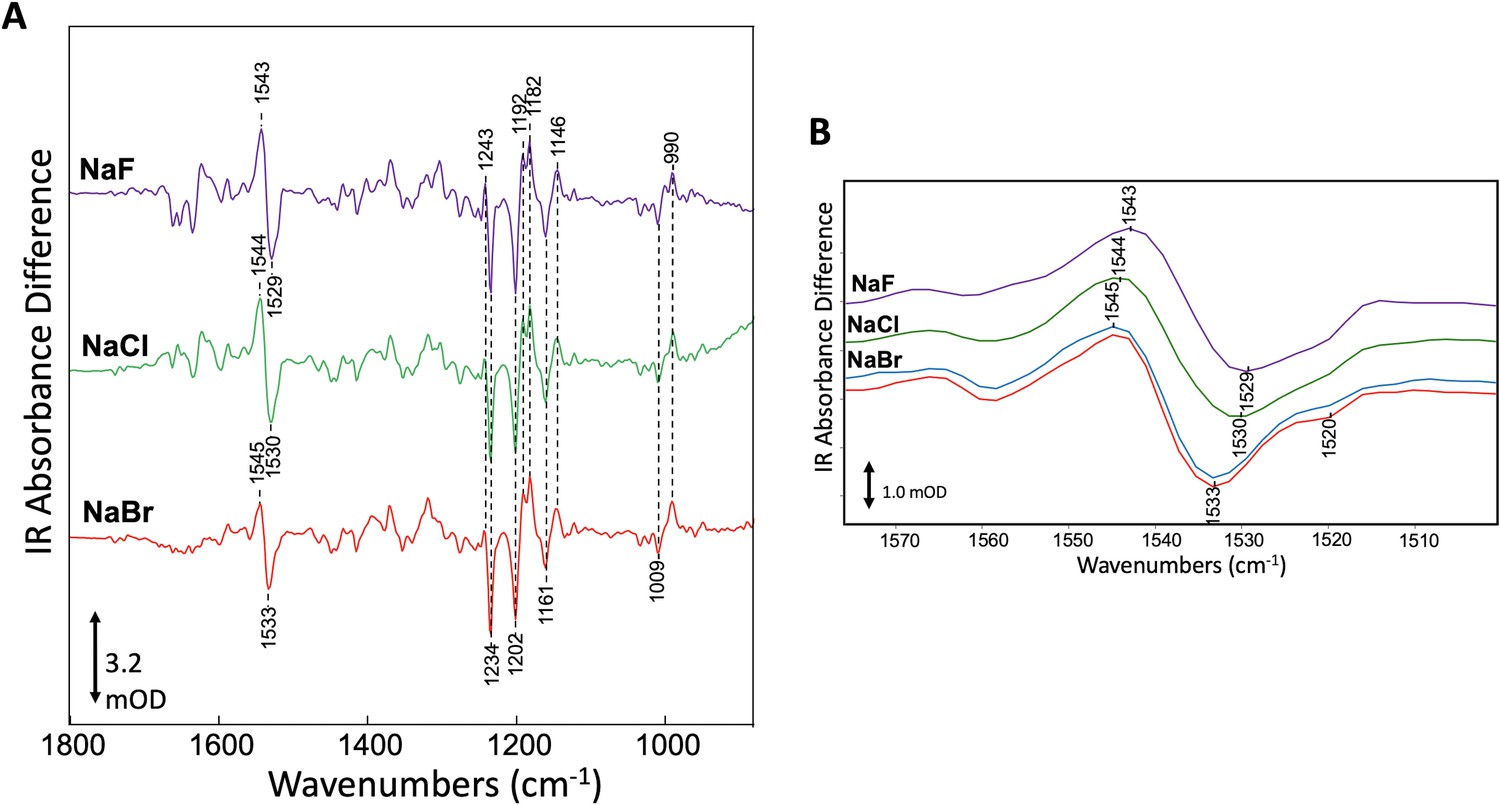
Specific interaction of bromide with GtACR1 detected by FTIR.
(A) Comparison of FTIR difference spectra recorded at 80 K of GtACR1 hydrated multilamellar films formed using different halides. Spectra shown are the average of >5 individual difference spectra (see 'Materials and methods'). The scale bar shown is for the NaBr difference spectrum. (B) Comparison of FTIR difference spectra of GtACR1 in the ethylenic C=C stretch region. All spectra shown are from (A) (purple, green, and red plots) except the NaBr difference spectrum (blue plot) which was recorded on the same film after 3 days to evaluate the reproducibility of the FTIR measurement. The scale bar shown is for the NaBr difference spectrum (red plot).
Figure 4 with 1 supplement
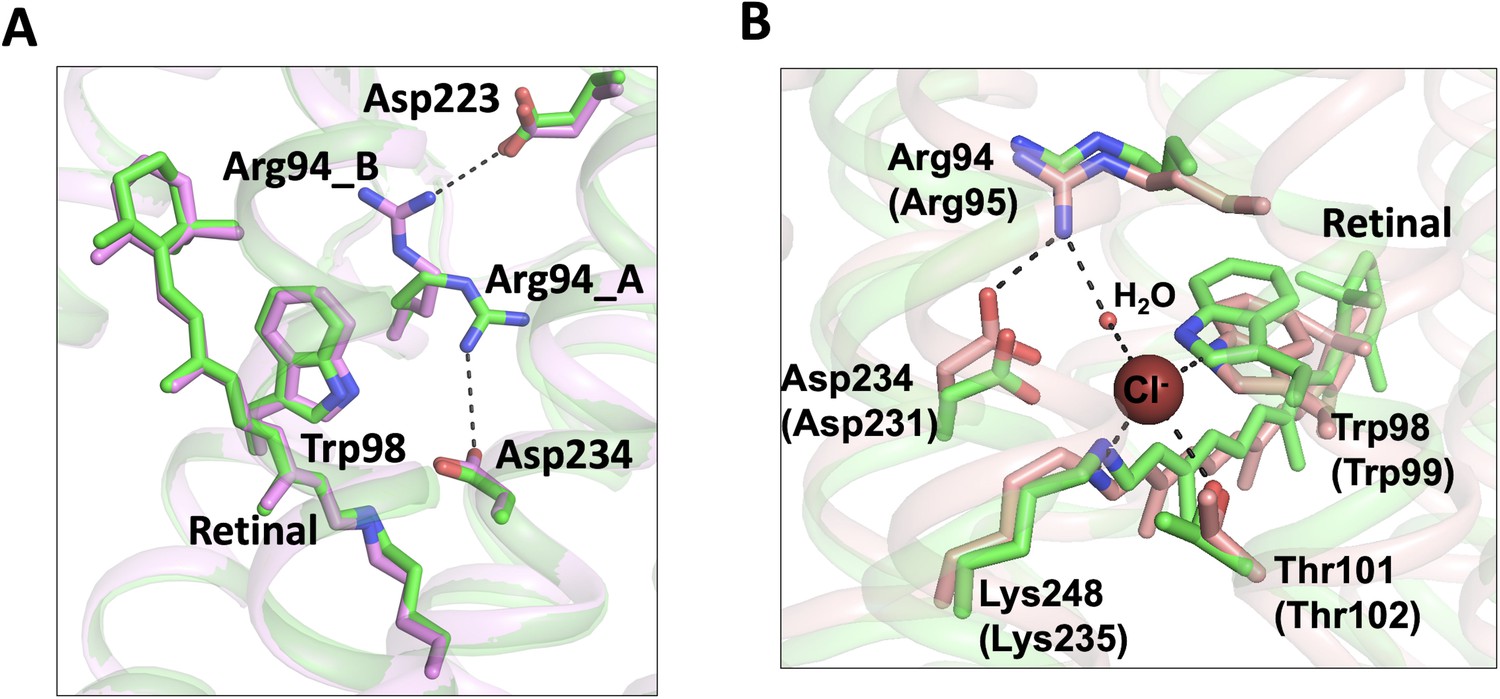
Conformational changes of the C1 constriction.
(A) Superimposition of chain A (green) and chain B (pink) of the bromide-bound GtACR1 structure showing salt-bridge switching (black dashed lines) of Arg94 from the extracellular Asp223 to Asp234 near the mid-membrane retinal (blue sticks). Arg94_A and Arg94_B designate Arg94 in chains A and B, respectively. (B) Superimposition of chain A of the bromide-bound GtACR1 (green) and Cl-pump ClR (red, PDB: 5G2A) structures showing a putative halide-binding site in the extracellular half of the tunnel of GtACR1. In the ClR structure, a chloride ion (maroon sphere) is stabilized via H-bond interactions (black dashed lines). The residues are labelled as in GtACR1 and analogous residues for ClR are indicated in parentheses.
Figure 4—figure supplement 1
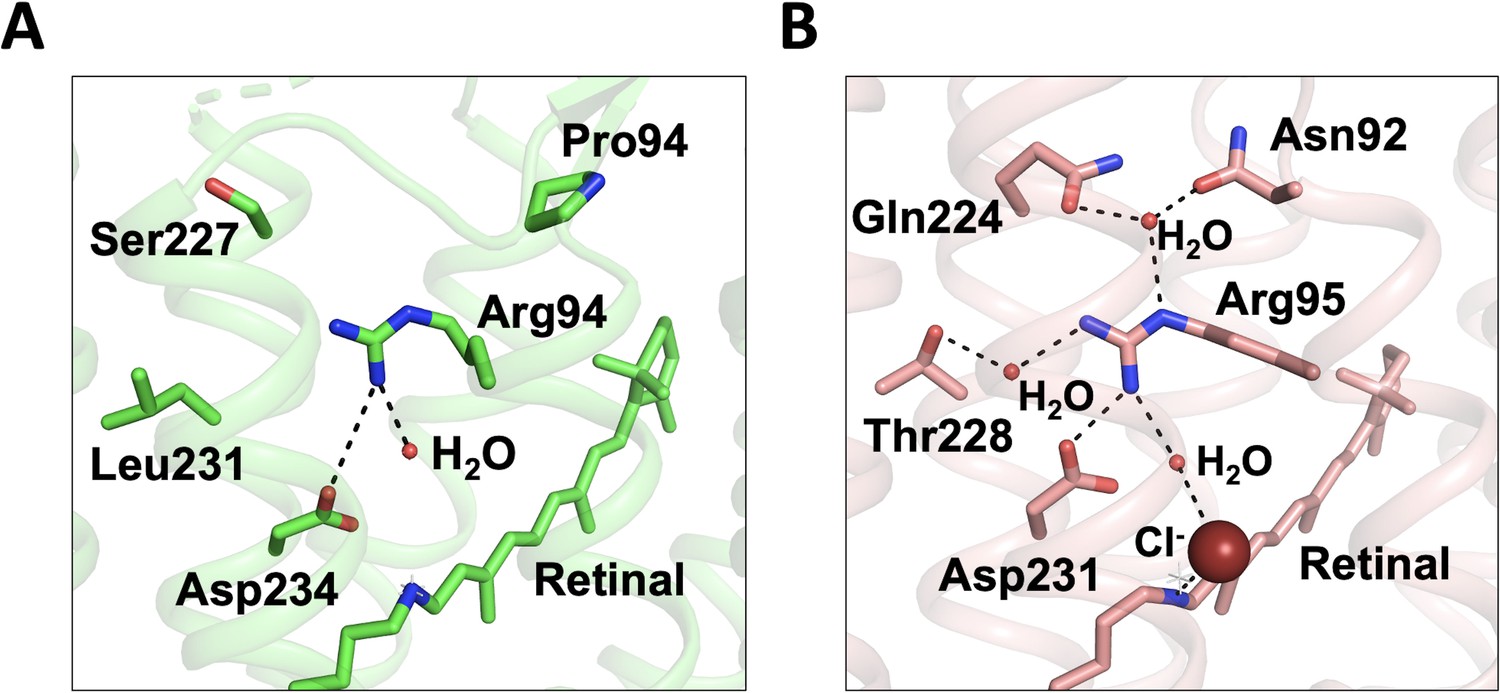
Comparison of Arg94 in GtACR1 and Arg95 in ClR.
(A) Arg94 in chain A of GtACR1 forms a salt-bridge with Asp234 and a H-bond with a water molecule. (B) Arg95 is stabilized by a H-bond network with four polar residues and three water molecules. Salt-bridge and H-bonds are depicted as dashed lines.
Tables
Table 1
Crystallographic data and refinement of the bromide-bound GtACR1 structure*.
| PDB ID | 7L1E |
|---|---|
| Space group | P 21 |
| a, b, c (Å) | 61.66, 77.64, 73.63 |
| α, β. γ (°) | 90, 95.59, 90 |
| Beamline | SLS-X06SA |
| Wavelength (Å) | 0.91882 |
| Resolution (Å) | 48.15–3.20 (3.28–3.20)† |
| Rmeas | 0.56 (2.81) |
| I /σ (I) | 2.84 (0.54) |
| Completeness (%) | 95.6 (96.0) |
| Multiplicity | 4.84 (3.31) |
| CC1/2 (%) | 97.5 (13.4) |
| Refinement | |
| Resolution (Å) | 41.73–3.2 (3.28–3.20) |
| No. of unique reflections | 11,054 (800) |
| Rwork/Rfree | 0.24/0.29 |
| R.m.s. deviations | |
| Bond lengths (Å) | 0.003 |
| Bond angles (°) | 0.730 |
| B-factor | |
| Proteins | 52.45 |
| Ligands | 51.31 |
| H2O | 33.96 |
| Ramachandran Plot | |
| Favored (%) | 96.18 |
| Allowed (%) | 3.82 |
| MolProbity Clash score | 12.22 |
-
*Data processing and refinement statistics are reported with Friedel pairs merged.
†Values in parentheses are for the highest resolution shell.
Key resources table
| Reagent type (species) or resource | Designation | Source or reference | Identifiers | Additional information |
|---|---|---|---|---|
| Gene (Guillardia theta) | GtACR1 | Synthetic | GenBank: KP171708 | Humanized gene |
| Cell line (Pichia pastoris) | Pichia pastoris | Sigma Aldrich | Sigma Aldrich: 89070101, RRID:CVCL_0549 | Methylotrophic yeast |
| Cell line (Homo sapiens) | HEK293 | ATCC | ATCC: CRL- 1573, RRID:CVCL_0045 | |
| Recombinant DNA reagent | Cellfectin II Reagent | Thermo Fisher | Cat. No.: 10362100 | https://www.thermofisher.com/order/catalog/product/10362100 |
| Recombinant DNA reagent | ScreenFectA transfection reagent | Waco Chemicals USA | Cat. No.: 29973203 | http://www.ereagent.com/uh/Shs.do?now=1544459665328 |
| Recombinant DNA reagent | pPIC9K | Thermo Fisher | Cat. No.: V175–20 | https://www.thermofisher.com/order/catalog/product/V17520#/V17520 |
| Recombinant DNA reagent | pcDNA3.1 | Thermo Fisher | Cat. No.: V79020 | https://www.thermofisher.com/order/catalog/product/V79020 |
| Software, algorithm | PyMol | PyMOL Molecular Graphics System, Schrödinger, LLC | RRID:SCR_000305 | http://www.pymol.org |
| Software, algorithm | UCSF Chimera | UCSF Resource for Biocomputing, Visualization, and Bioinformatics | RRID:SCR_004097 | http://plato.cgl.ucsf.edu/chimera |
| Software, algorithm | PHENIX | PMID:20124702 | RRID:SCR_014224 | http://www.phenixonline.org/ |
| Software, algorithm | Coot | PMID:15572765 | RRID:SCR_014222 | http://www.biop.ox.ac.uk/coot |
| Software, algorithm | OriginPro 2016 | OriginLab | https://originlab.com | |
| Software, algorithm | pClamp 10 | Molecular Devices | RRID:SCR_01123 | http://www.moleculardevices.com/products/software/pclamp.html |
Additional files
Download links
A two-part list of links to download the article, or parts of the article, in various formats.
Downloads (link to download the article as PDF)
Open citations (links to open the citations from this article in various online reference manager services)
Cite this article (links to download the citations from this article in formats compatible with various reference manager tools)
The crystal structure of bromide-bound GtACR1 reveals a pre-activated state in the transmembrane anion tunnel
eLife 10:e65903.
https://doi.org/10.7554/eLife.65903


