Convergent organization of aberrant MYB complex controls oncogenic gene expression in acute myeloid leukemia
- Molecular Pharmacology Program, Sloan Kettering Institute, United States
- Tow Center for Developmental Oncology, Department of Pediatrics, Memorial Sloan Kettering Cancer Center, United States
- Departments of Pharmacology and Physiology & Biophysics, Weill Cornell Graduate School of Medical Sciences, Cornell University, United States
- Computational Biology Program, Public Health Sciences Division, Fred Hutchinson Cancer Research Center, United States
- Medical Scientist Training Program, University of Washington, United States
- Basic Sciences Division, Fred Hutchinson Cancer Research Center, United States
- Department of Genome Sciences, University of Washington, United States
- Cold Spring Harbor Laboratory, United States
- Institute for Frontier Life and Medical Sciences, Kyoto University, Japan
- Center for Epigenetics Research, Sloan Kettering Institute, United States
Figures
Figure 1 with 1 supplement

CBP depletion is required to confer resistance to MYBMIM in AML cells.
(A) Schematic of the genome-wide CRISPR screen to identify genes whose loss modifies MYBMIM effects in MOLM13 cells expressing Cas9. Cells were transduced with the GeCKOv2 library expressing single sgRNAs at low multiplicity of infection, followed by 3-day treatment with 10 μM MYBMIM versus PBS control, with the sgRNA representation assessed by DNA sequencing. (B) Volcano plot showing the relative abundance of cell clones expressing sgRNAs targeting specific genes (fold change of MYBMIM-treated cells at T1 versus T0) and their statistical significance from biological replicates. Dashed line represents no enrichment, with positive values representing genes whose depletion confers relative resistance to MYBMIM. CBP is marked in red.
-
Figure 1—source data 1
Genome-wide CRISPR knockout screen (GeCKO) gene summary.
- https://cdn.elifesciences.org/articles/65905/elife-65905-fig1-data1-v4.xlsx
Figure 1—figure supplement 1
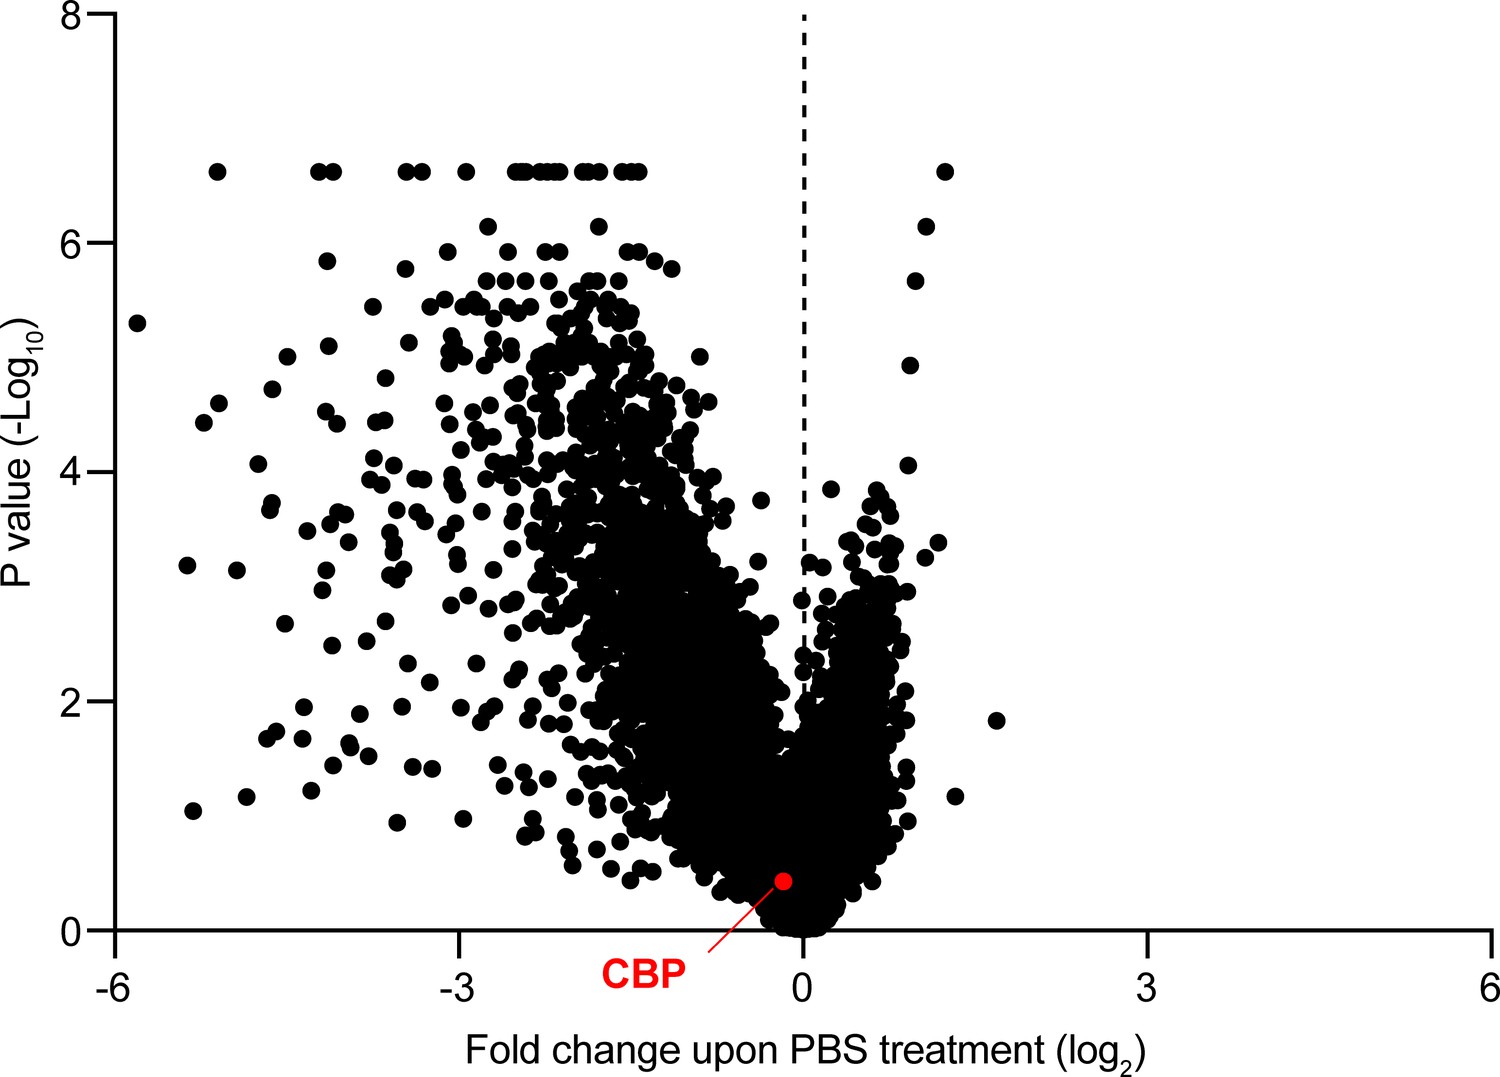
CBP depletion is dispensable in AML cells.
Volcano plot showing the relative abundance of MOLM13-Cas9 cell clones expressing sgRNAs targeting specific genes (fold change of PBS-treated cells at T1 versus T0) and their statistical significance from biological replicates. Dashed line represents no enrichment, with positive values representing genes whose depletion confers relative resistance to MYBMIM. CBP is marked in red.
Figure 2 with 1 supplement

CRYBMIM is an improved peptidomimetic chimera that specifically binds the KIX domain of CBP/P300 in vitro and in cells.
(A) Heatmap of the top 10 and bottom 10 gene dependencies for survival and proliferation of 652 cancer cell lines in the DepMap Cancer Dependency Map Project, ranked by the greatest dependency for 37 leukemia lines, 20 of which are AML cell lines, as indicated by the red color gradient; *p=1.1e-15, t-test of leukemia versus other tumor types. (B) Retro-inverso amino acid sequences of MYBMIM, CREBMIM and CRYBMIM, with amino acids derived from MYB, CREB, and TAT marked in blue, green, and black, respectively. (C) Molecular model of the CRYBMIM:KIX complex. Residues making contact with KIX are labeled, with portions derived from MYB and CREB marked in blue and green, respectively. (D) Binding of FITC-conjugated CREBMIM (blue), CRYBMIM (red), and MYBMIM (black), as measured using microscale thermophoresis; Kd = 2.9 ± 0.7, 5.7 ± 0.2, and 17.3 ± 1.6, respectively. Error bars represent standard deviations of three biological replicates; p<1e-15, ANOVA, for CRYBMIM versus MYBMIM. (E) Western blot showing binding of nuclear CBP/P300 isolated from AML cells to biotinylated CRYBMIM or CREBMIM, specifically competed by the excess free peptides as indicated. (F) Quantification of CBP/P300 binding to CRYBMIM and CREBMIM by fluorescence densitometry, with black, gray, and red denoting PBS control, TAT control, and peptide competition, respectively.
Figure 2—figure supplement 1
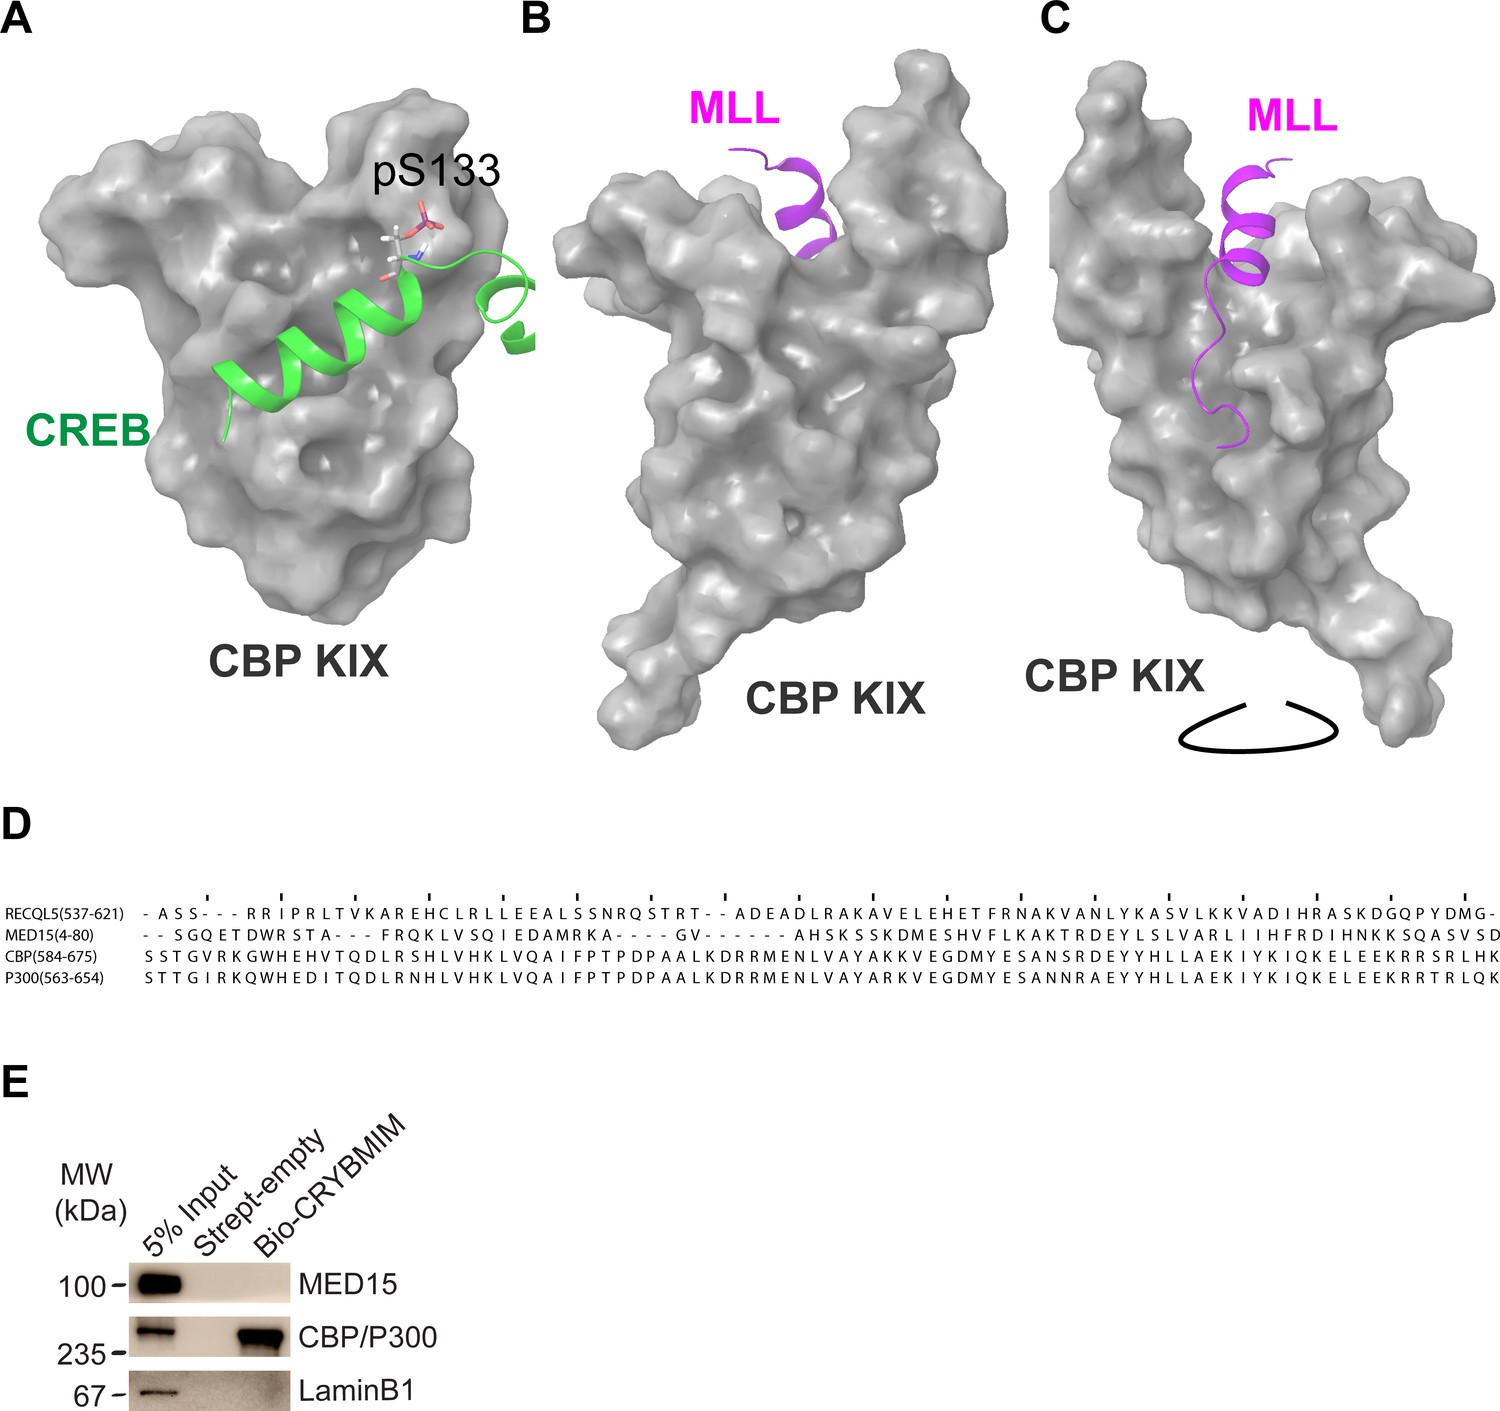
Molecular models of CREB and MLL structures in complex with CBP KIX, and CRYBMIM selectively binds to KIX domain in CBP/P300.
(A) Molecular model of the CREB:KIX complex assembled in Maestro (Schrödinger) using PDB 1KDX showing phosphor-Serine 133. (B) Molecular model of the MLL:KIX complex assembled in Maestro (Schrödinger) using PDB 2LXS shown from the MYB/CREB binding site on KIX. (C) Molecular model of the MLL:KIX complex assembled in Maestro (Schrödinger) using PDB 2LXS rotated to show the full MLL peptide. (D) Sequence alignment of KIX domains in different human proteins. Identity/similarity of each set of sequences were 88%/96% (CBP vs P300), 21%/38% (CBP vs MED15), and 17%/34% (CBP vs RECQL5). (E) Western blots following affinity purification of MV411 nuclear extracts, showing specific binding of CBP/P300 but not MED15 to biotinylated CRYBMIM (Bio-CRYBMIM), immobilized on streptavidin beads. Purification with beads alone (Strept-empty) and LaminB1 serve as specificity controls.
Figure 3 with 2 supplements
Potent and broad-spectrum activity of CRYBMIM against diverse AML cell lines but relatively sparing of normal hematopoietic progenitor cells.
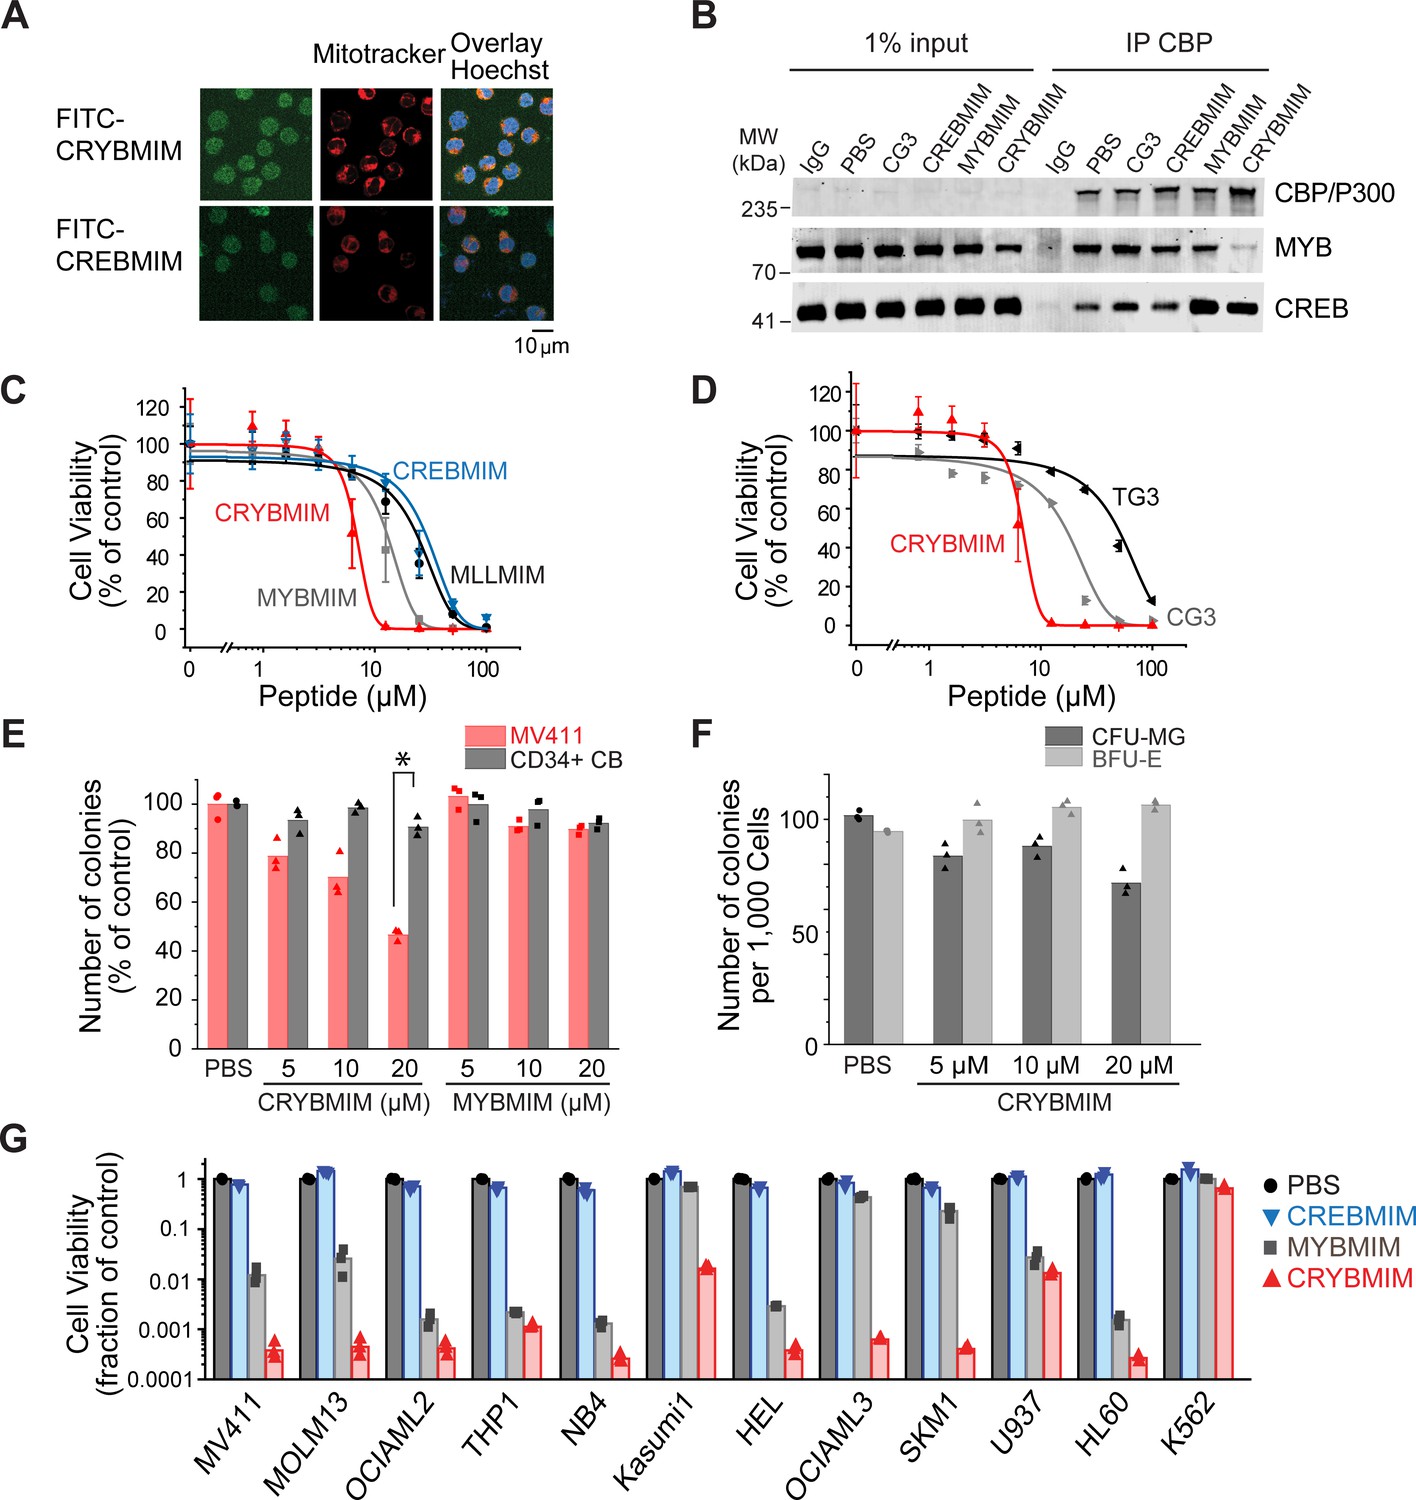
(A) Representative live cell confocal microscopy images of MV411 cells treated with 100 nM FITC-conjugated peptides as indicated for 1 hr, counterstained with Mitotracker (red) and Hoechst 33342 (blue). Scale bar indicates 20 µm, with z-stack of 1.5 µm. (B) Western blots showing immunoprecipitated nuclear CBP/P300 co-purified with MYB and CREB from MV411 cells treated with 10 µM peptides as indicated for 1 hr. (C–D) Cell viability of MV411 cells as a function of increasing concentrations of 48 hr peptide treatment, comparing (C) CRYBMIM to MYBMIM, CREBMIM and MLLMIM (IC50 = 6.88 ± 3.39, 13.1 ± 3.3 29.15 ± 3.79, and 24.22 ± 2.00, p<1e-15, ANOVA); (D) TG3 and CG3 (IC50 = 16.65 ± 1.00 and 48.91 ± 2.55, p<1e-15, ANOVA). Error bars represent standard deviation of three biological replicates. (E) Colony forming ability of CD34+ cells isolated from human umbilical cord blood (CD34+ CB, gray) and MV411 AML (red) cells following CRYBMIM or MYBMIM treatment. Data represent three biological replicates; *p=7.4e-5, t-test of normal CD34+ CB versus MV411 AML cells. (F) Preservation of clonogenic capacity of CD34+ CB cells in differentiating into erythroid blast forming units (BFU-E, light gray) and granulocyte macrophage colony forming units (CFU-GM, gray) as a function of CRYBMIM treatment. (G) Cell viability of AML cell lines treated with control PBS (black), 20 µM CREBMIM (blue), MYBMIM (gray), or CRYBMIM (red) as indicated for 6 days with media replacement every 48 hr in three biological replicates (p=8.6e-3, t-test for CRYBMIM versus control).
Figure 3—figure supplement 1
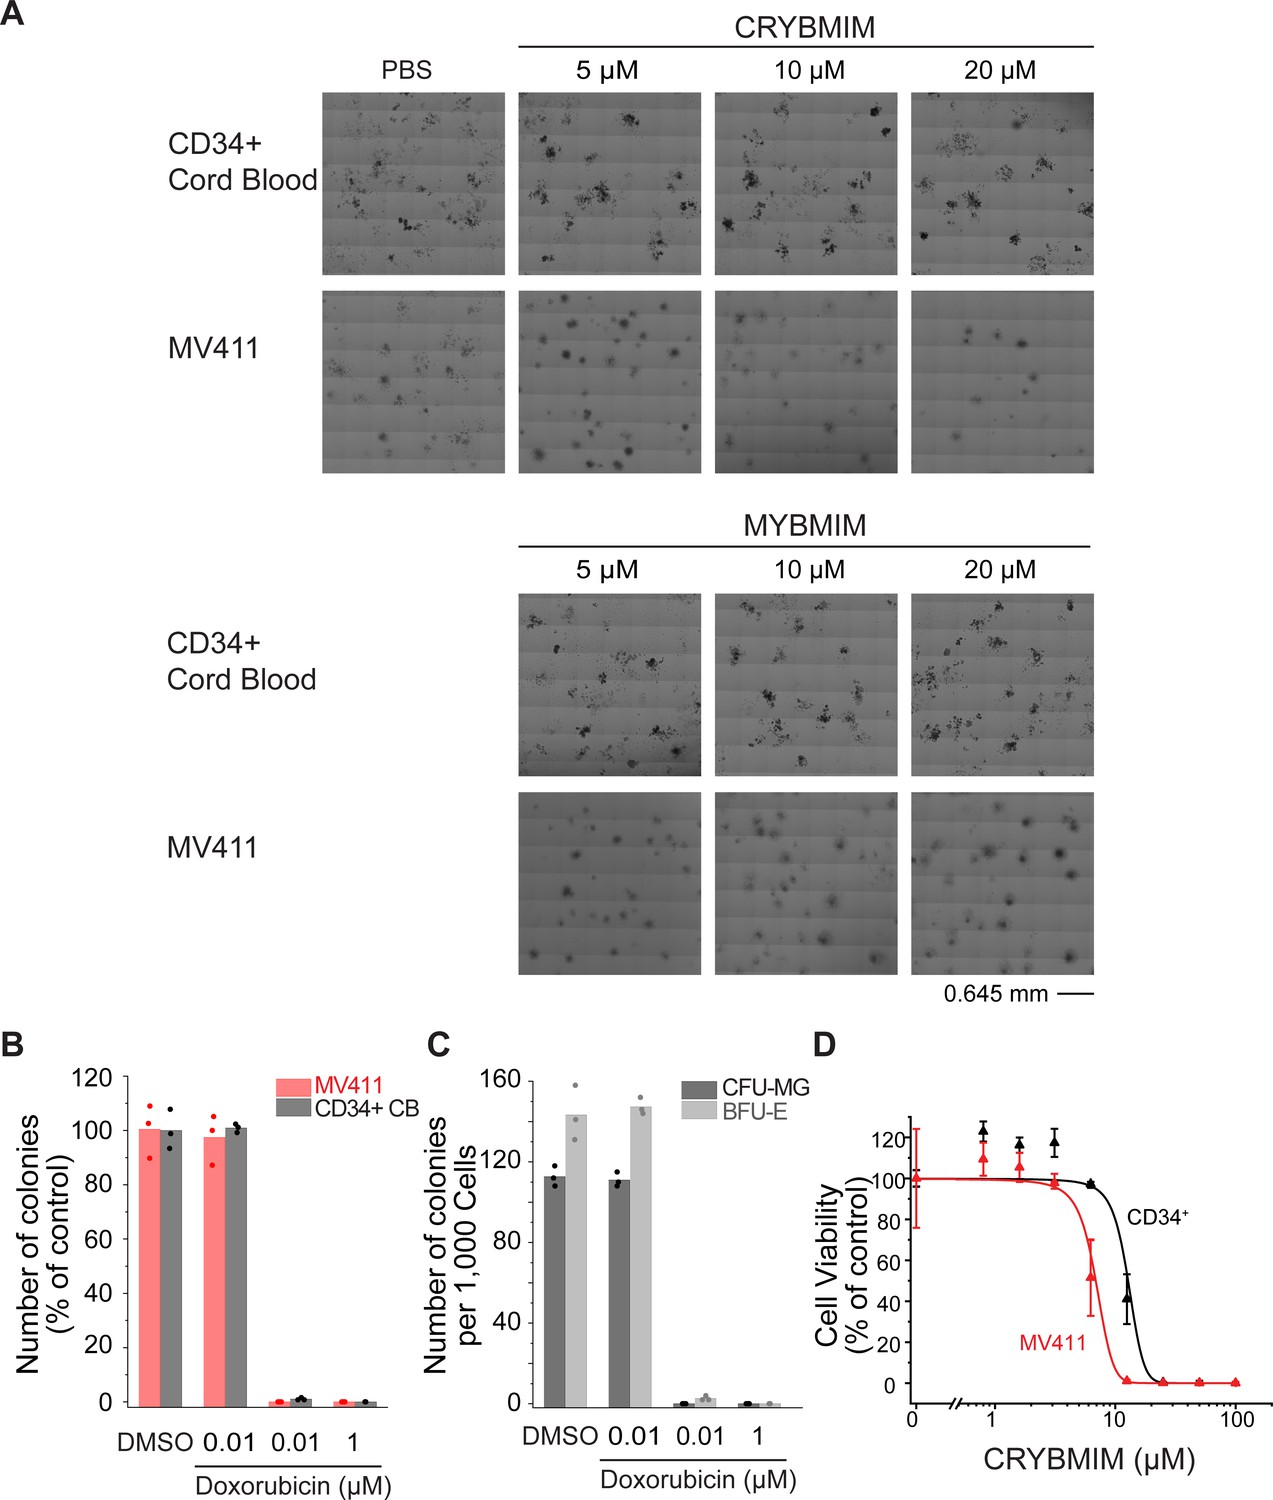
CRYBMIM relatively spares normal hematopoietic progenitor cells in vitro.
(A) Phase contrast photographs of MV411 and CD34+ cells isolated from human umbilical cord blood (CD34+ CB) and cultured in MethoCult H3040 with drug treatment, as indicated. (B) Colony forming ability of MV411 and CD34+ CB cells cultured in MethoCult H3040 following doxorubicin treatment. (C) Formation of BFU-E (light gray) and CFU-GM (gray) colonies of CD34+ CB cells cultured in MethoCult H3040 upon doxorubicin treatment. (D) Growth of MV411 and CD34+ CB cells upon CRYBMIM treatment in serum-containing suspension culture (IC50 = 6.9 ± 3.4 vs 13 ± 3.6 μM, p=1.1e-15, ANOVA). Symbols represent biological triplicates.
Figure 3—figure supplement 2
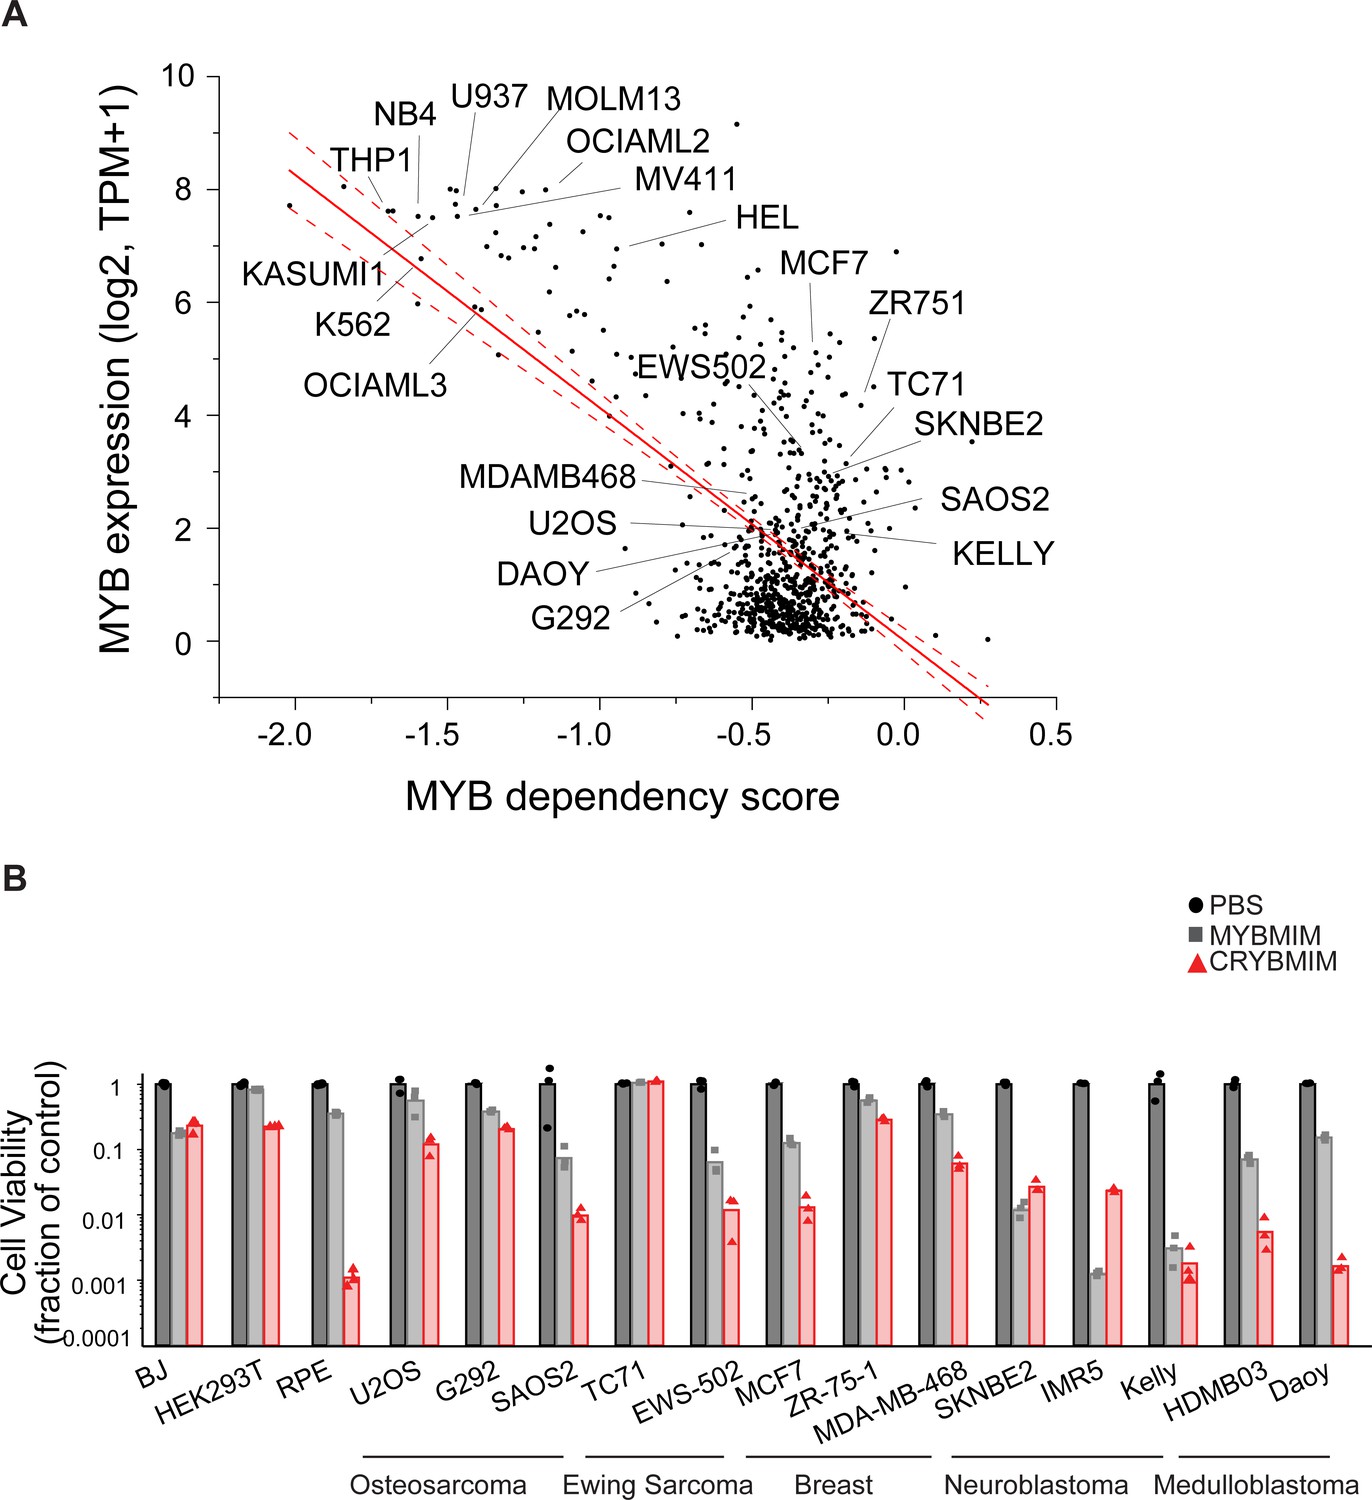
Activity of CRYBMIM on non-hematopoietic cells.
(A) Expression of MYB as a function of its genetic dependency in tumor cell lines, as assessed by DepMap. Red line represents linear correlation, with dashed lines showing 95% confidence intervals. (B) Cell viability assays of non-leukemia tumor and non-tumor cell lines treated with control PBS (black), 20 µM MYBMIM (gray), or 20 µM CRYBMIM (red) as indicated for 6 days with media replacement every 48 hr in three biological replicates.
Figure 4 with 1 supplement
CBP but not P300 is dispensable for the growth and survival of AML cells, and is required for the susceptibility to peptidomimetic MYB blockade by CRYBMIM.
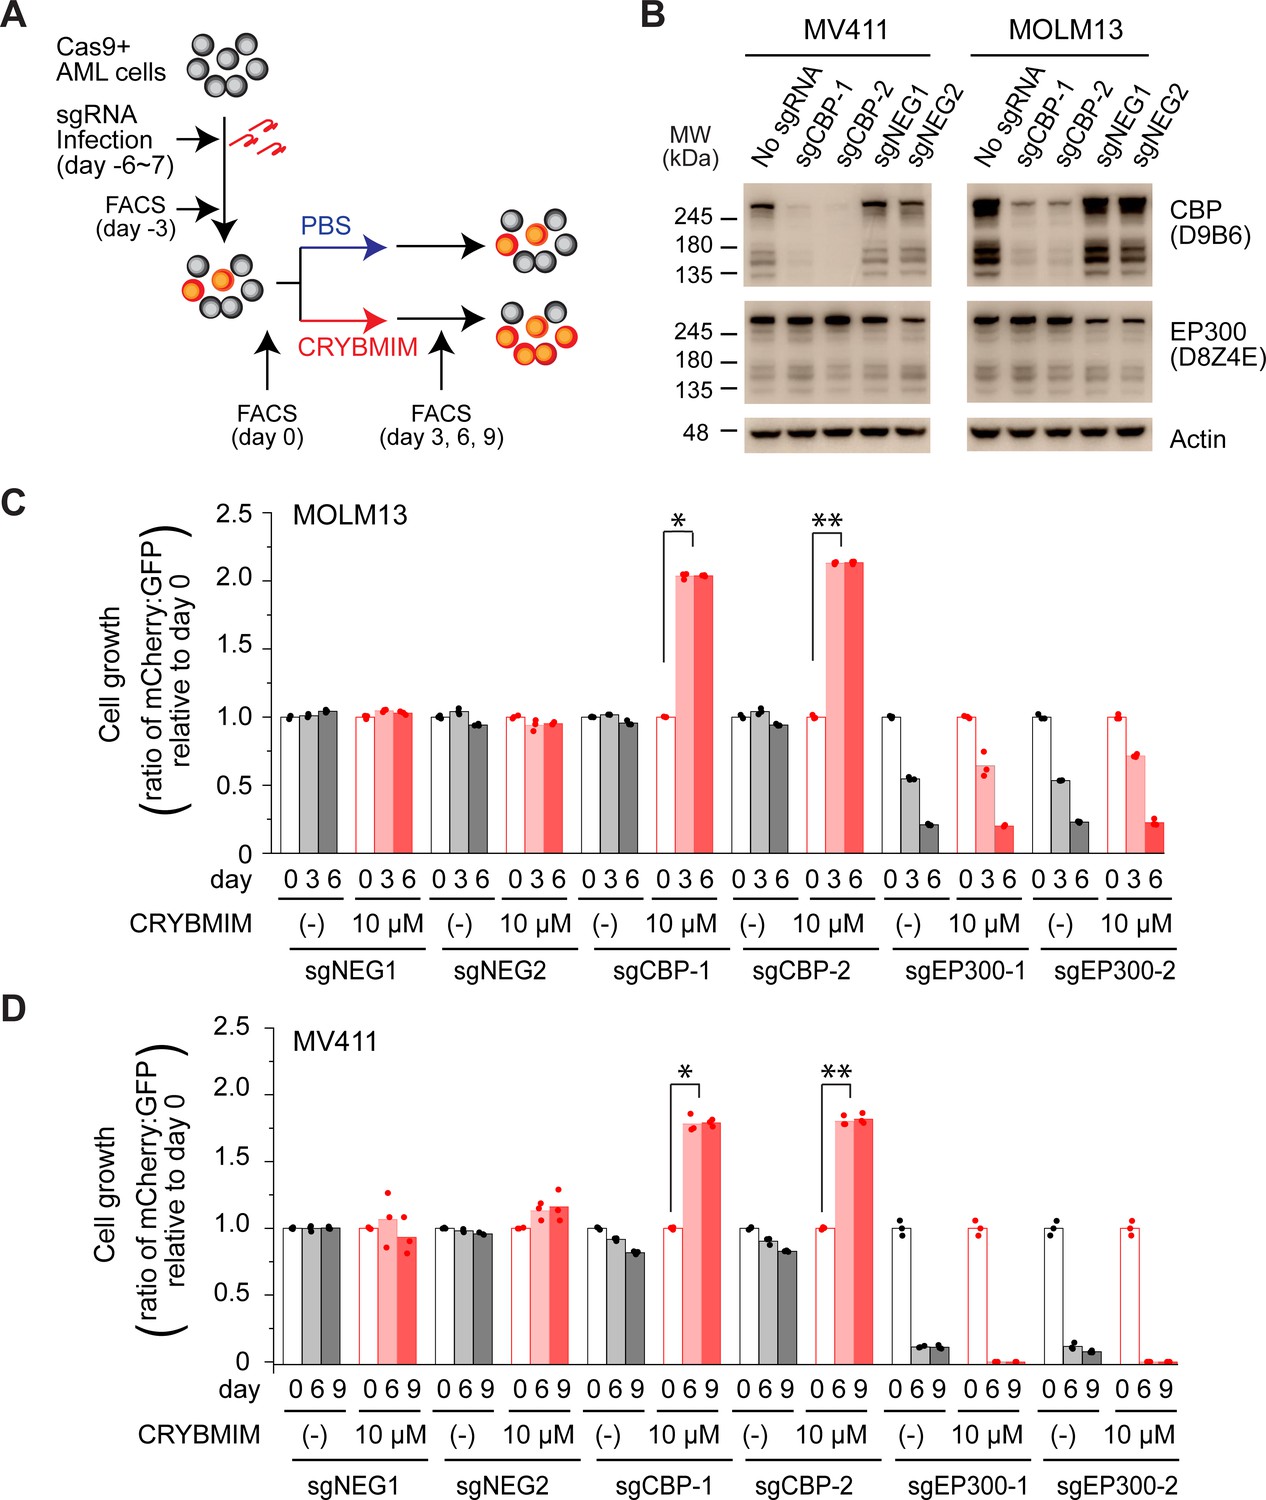
(A) Schematic of the competitive assays to define specific genetic dependencies. AML cells expressing Cas9 and GFP are transduced with sgRNAs targeting specific genes and expressing mCherry, followed by quantitation of cell abundance by fluorescence activated cell scanning (FACS) of GFP and mCherry-expressing cells. (B) Western blots demonstrating specific depletion of CBP in MV411 (left) and MOLM13 (right) cells expressing sgCBP-1 and sgCBP-2, as compared to control sgNEG1 and sgNEG2 targeting the AAVS1 safe harbor locus. EP300 is shown for specificity, and Actin serves as the loading control. (C) Relative growth of GFP-expressing MOLM13 cells expressing mCherry and unique sgRNAs targeting AAVS1 control (sgNEG1 and sgNEG2), CBP (sgCBP-1 and sgCBP-2), and P300 (sgEP300-1 and sgEP300-2) and quantified by FACS on day 0, 3, and 6 after 2-day treatment with 10 µM CRYBMIM or PBS. Data represent biological triplicates of at least 10,000 cells per condition; *p=6.0e-10, **p=4.1e-8, t-test for day 6 versus day 0 of CRYBMIM treatment of CBP-depleted cells. (D) Analogous experiment as (C) using MV411 cells; *p=1.1e-6, **p=3.7e-6, t-test for day 6 versus day 0 of CRYBMIM treatment of CBP-depleted cells.
Figure 4—figure supplement 1
Genetic dependencies of CRYBMIM susceptibility in AML cells.
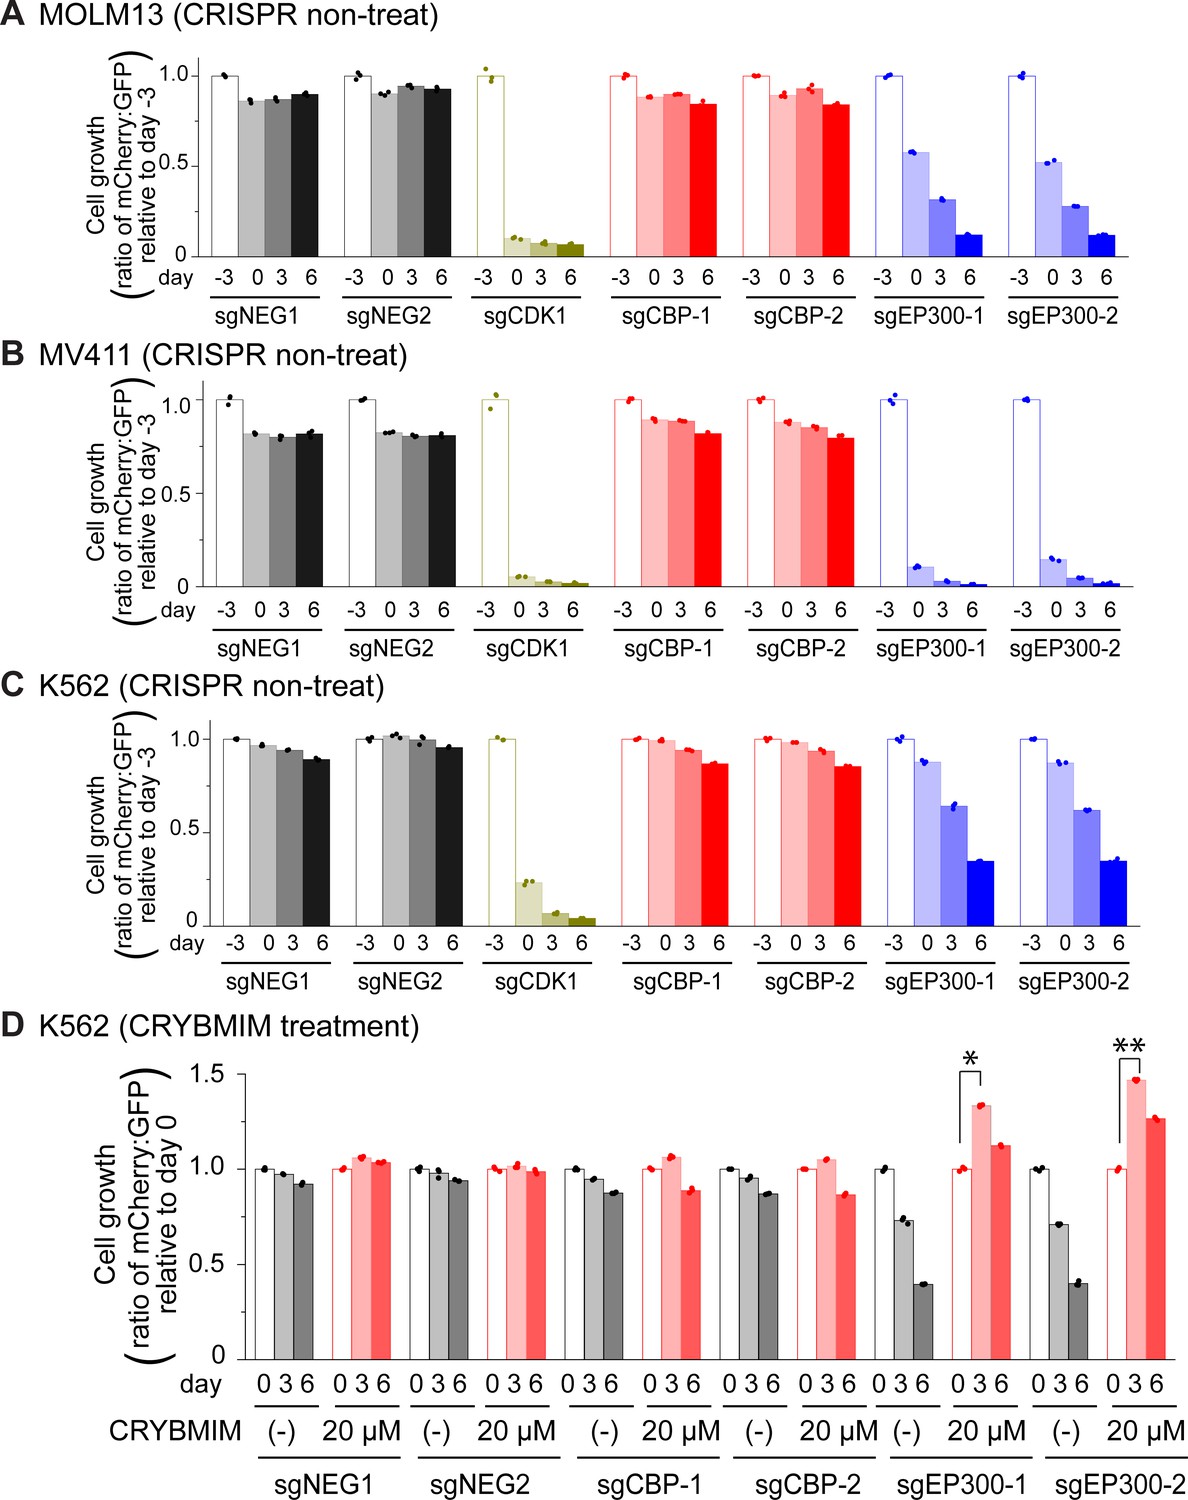
(A–C) Relative growth of GFP-expressing MOLM13 (A), MV411 (B), and K562 (C) cells expressing mCherry and unique sgRNAs targeting negative control AAVS1 (sgNEG1 and sgNEG2), positive control CDK1 (sgCDK1), CBP (sgCBP-1 and sgCBP-2), and P300 (sgEP300-1 and sgEP300-2) and quantified by FACS on days –3, 0, 3, and 6 upon sgRNA transduction. (D) Relative growth of K562-Cas9 cells expressing specific sgRNAs upon treatment with 20 µM CRYBMIM for 2 days (*p=1.0e-6, **p=1.3e-7; t-test for day 3 versus day 0).
Figure 5 with 1 supplement
CRYBMIM blocks oncogenic MYB gene expression and restores normal myeloid cell differentiation.
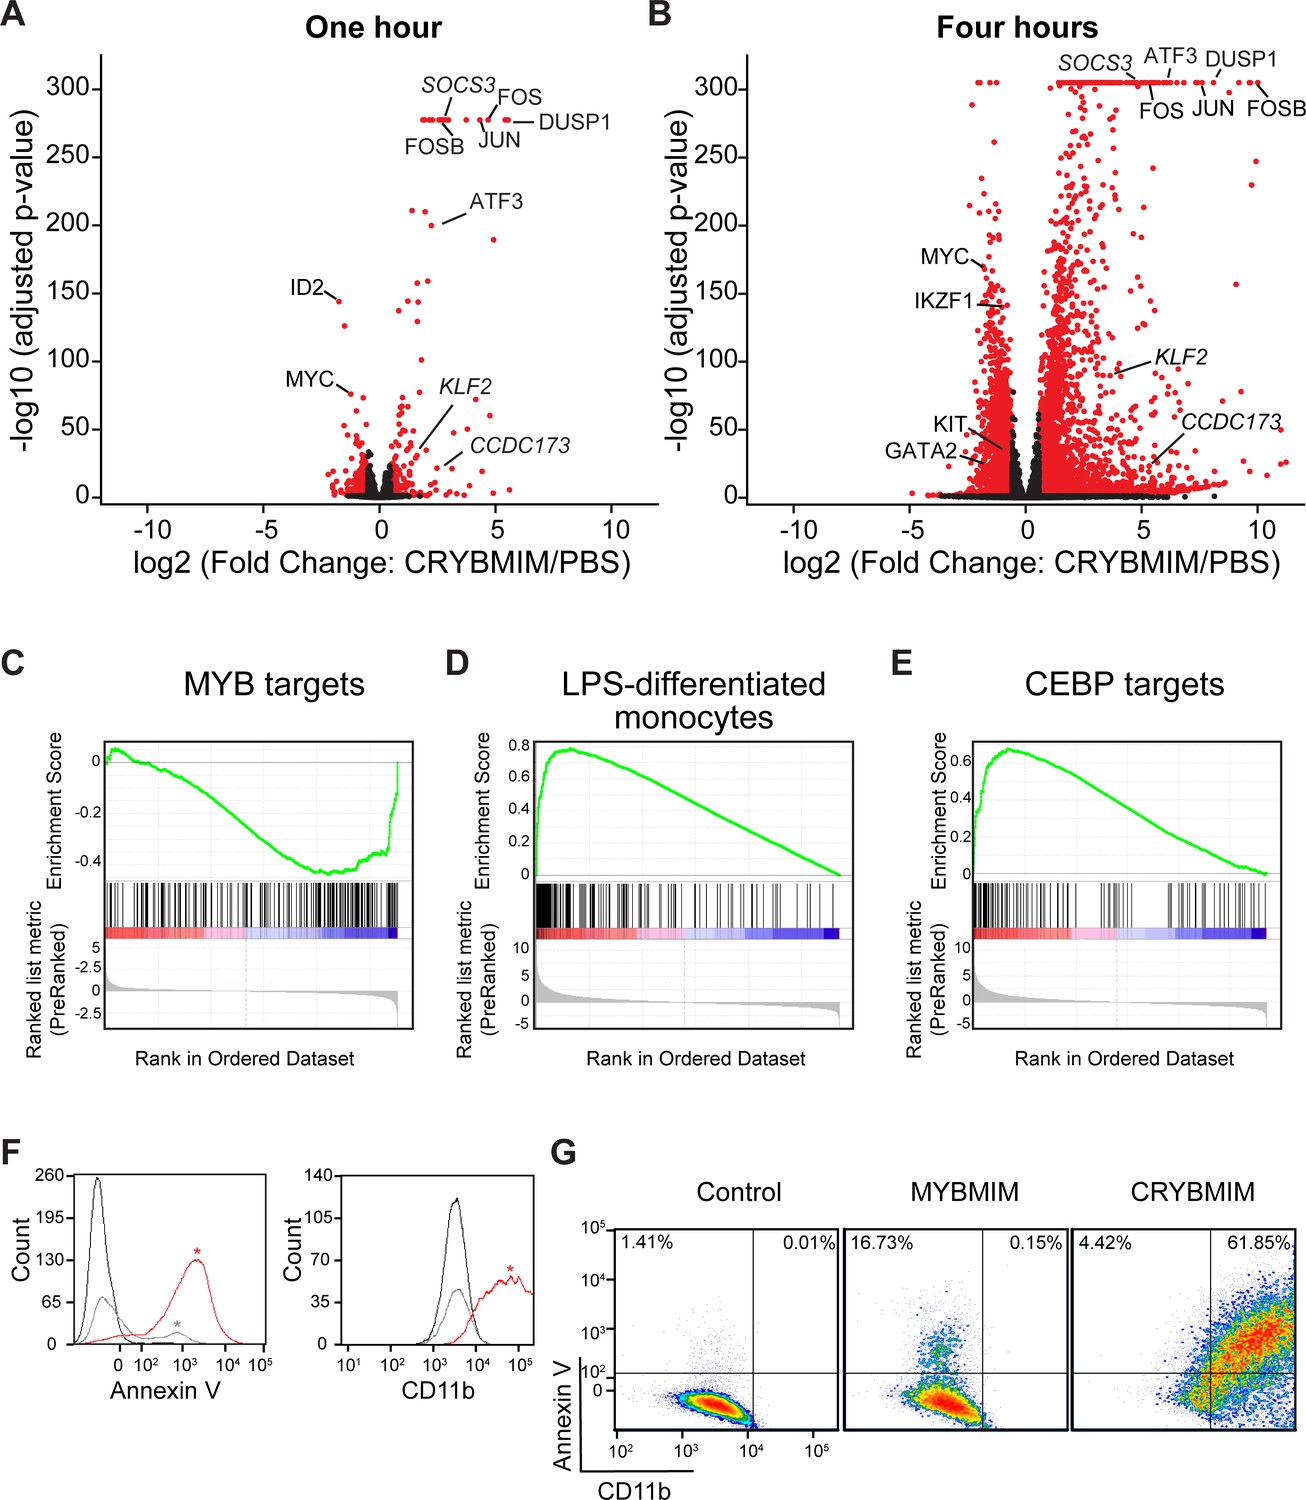
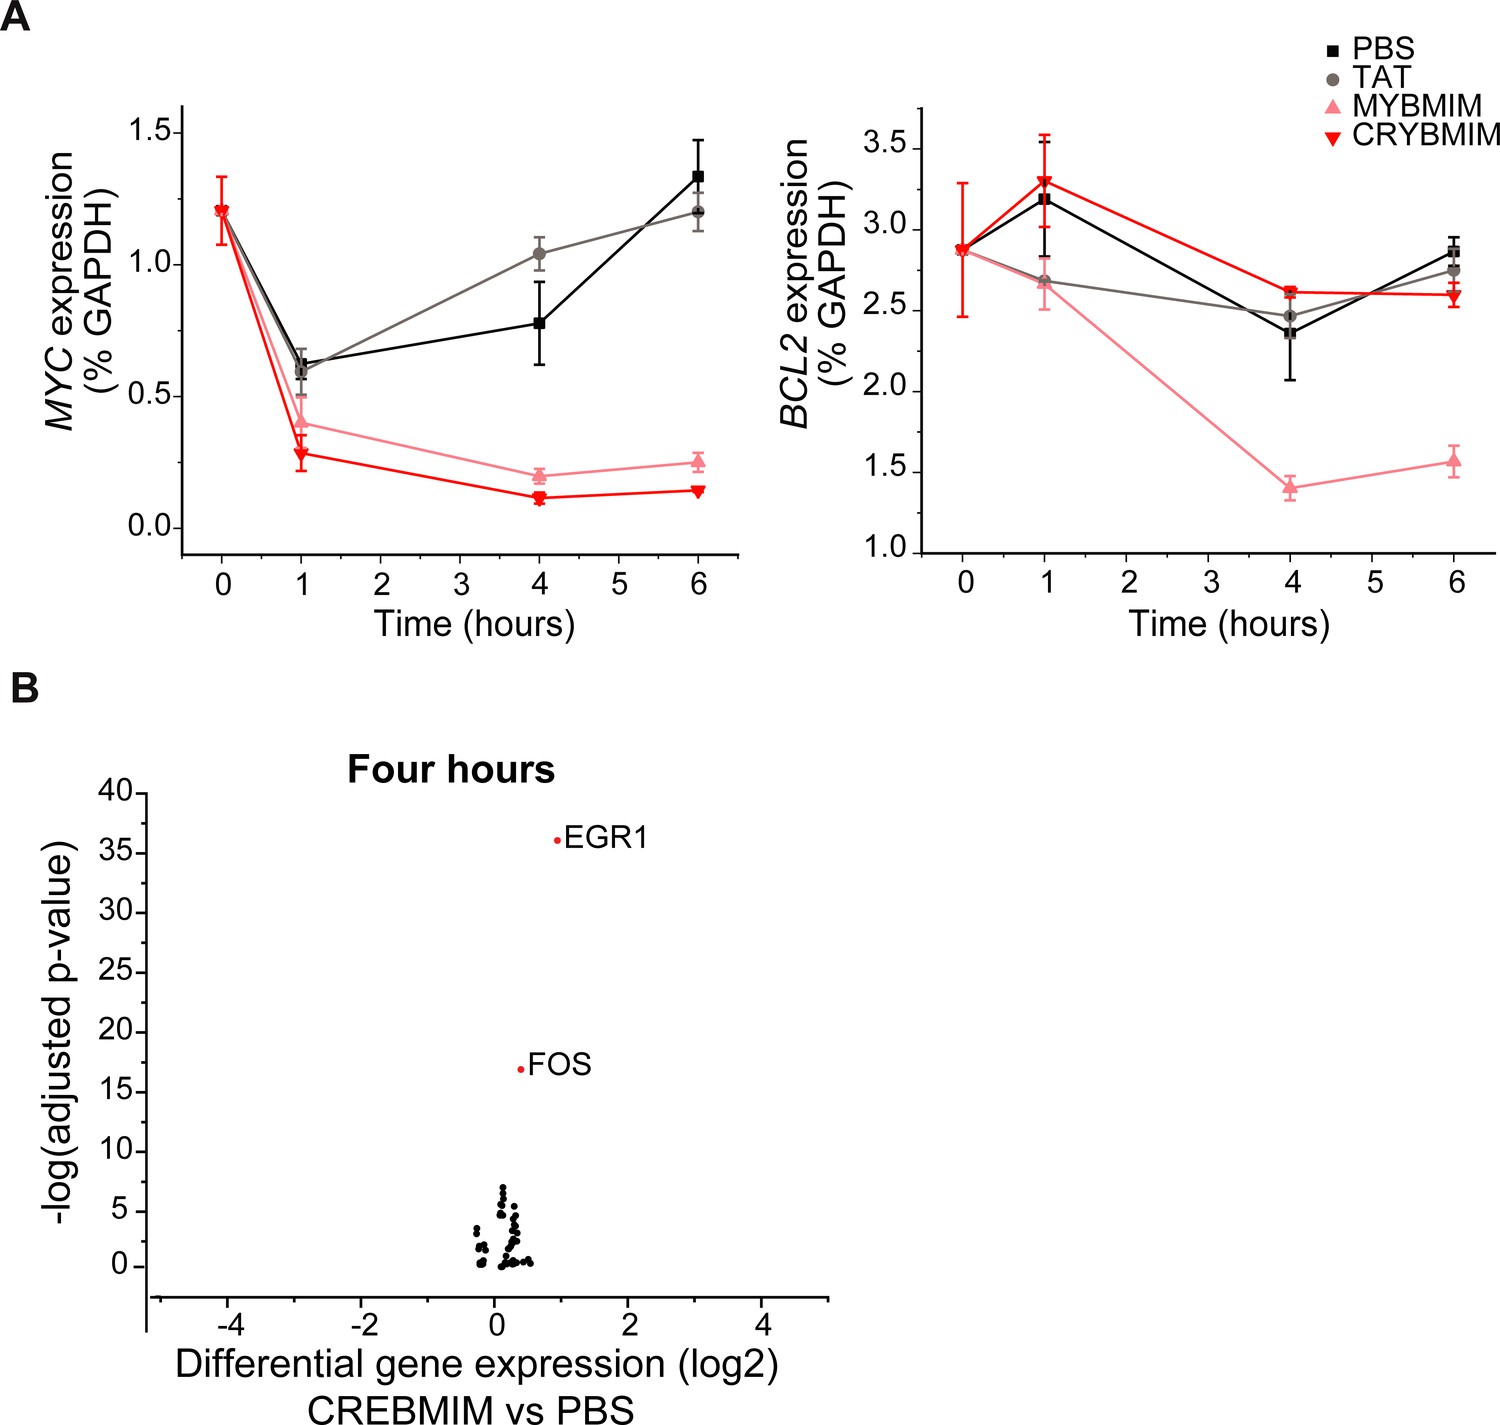
(A–B) Volcano plots of normalized gene expression of MV411 cells upon one (A) and four hour (B) treatment with CRYBMIM, as compared to PBS control, with select genes labeled; p-values denote statistical significance of three biological replicates. (C–E) Gene set enrichment analysis of up- and downregulated gene sets: (C) MYB_Q6, (D) GSE9988_LPS_VS_VEHICLE_TREATED_MONOCYTES_UP, and (E) GERY_CEBP_TARGETS_377. (F) Histogram of Annexin V- or CD11b-stained MV411 cell fluorescence, treated with CRYBMIM (red), MYBMIM (gray), or control PBS (black); *p<1e-15, Kruskal-Wallis test. (G) Scatter plots comparing Annexin V- versus CD11b-stained MV411 cell fluorescence, treated with control PBS, MYBMIM or CRYBMIM; blue to red color indicates increasing cell density.
-
Figure 5—source data 1
Differential gene expression analysis by RNA-seq in CRYBMIM, CREBMIM vs PBS treated MV411 cells (1 hr and 4 hr).
- https://cdn.elifesciences.org/articles/65905/elife-65905-fig5-data1-v4.xlsx
Figure 5—figure supplement 1
CRYBMIM but not CREBMIM causes significant changes in gene expression in AML cells upon short duration exposure.
(A–B) Gene expression of MYB target genes MYC (A) and BCL2 (B) in AML after 20 µM peptide treatment as measured by qPCR. (C) Gene expression changes in MV411 cells treated with 20 µM CREBMIM for 4 hr as measured by RNA-seq.
Figure 6 with 1 supplement
CRYBMIM remodels MYB and CBP/P300 chromatin complexes in AML cells.
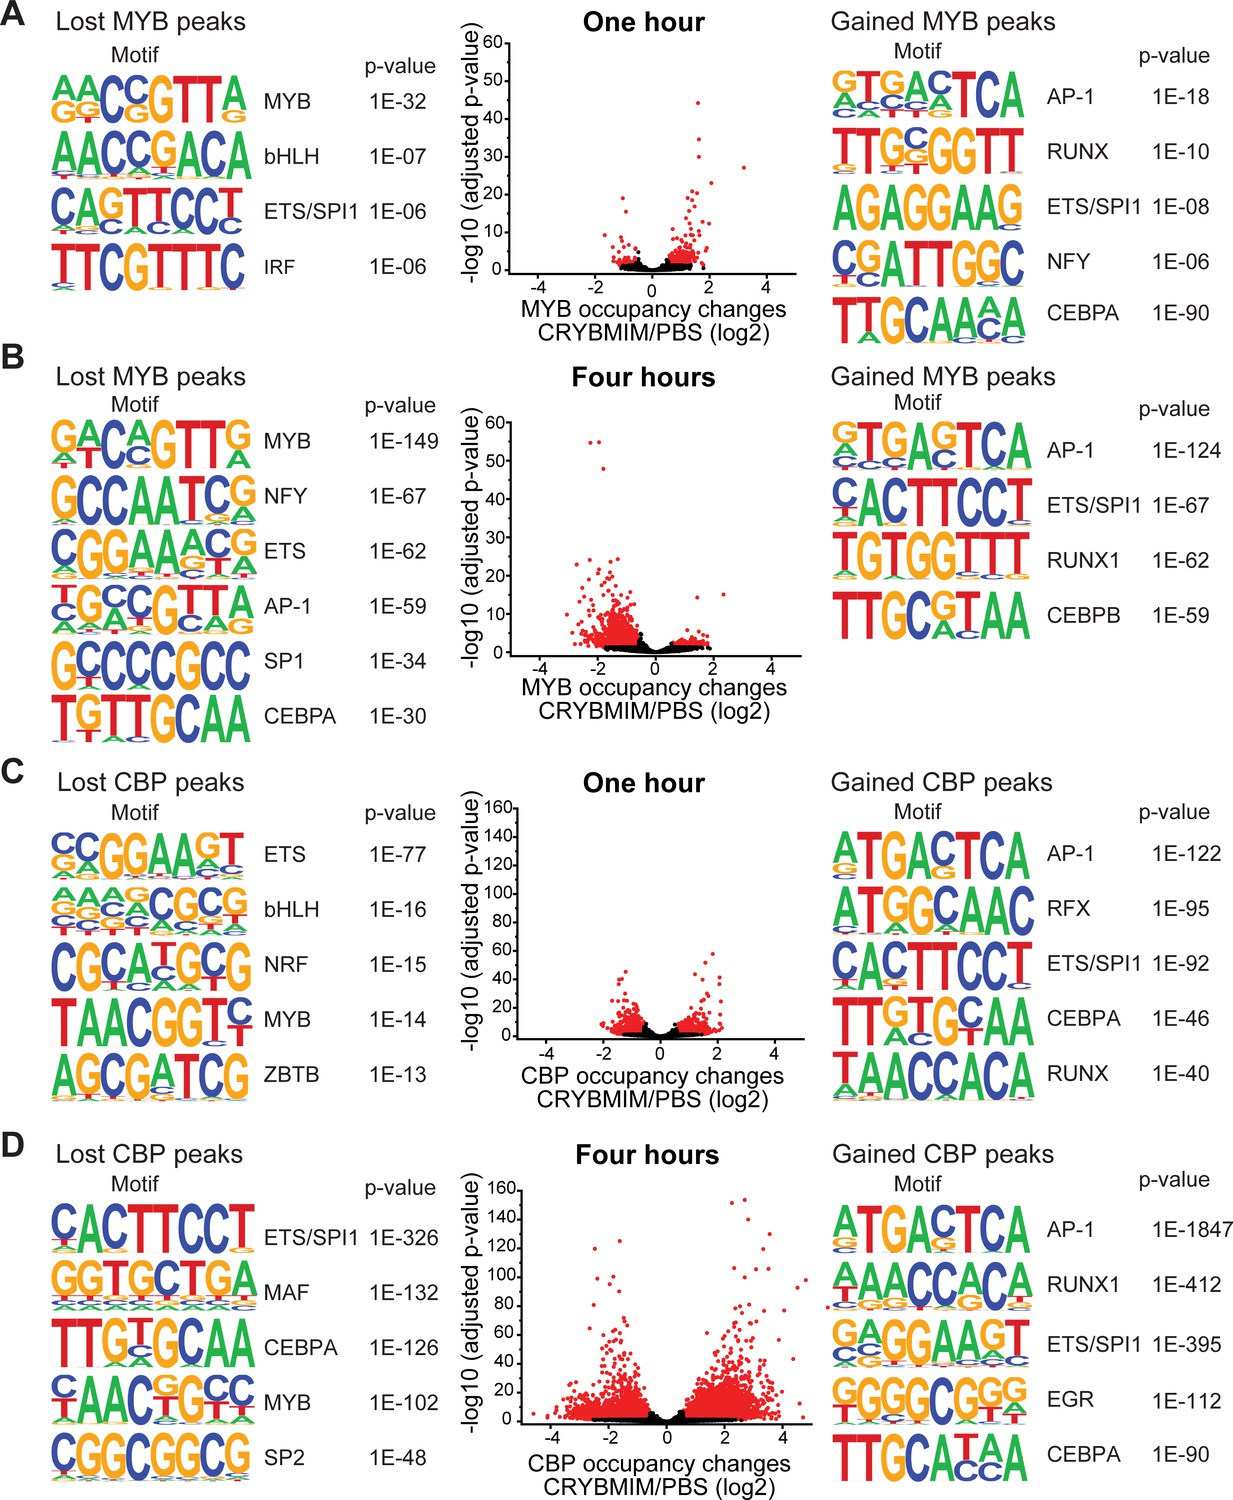
(A–B) Volcano plots of relative MYB chromatin occupancy in MV411 cells changes after 1 hr (A) and 4 hr (B) of 20 µM CRYBMIM treatment compared to PBS control, as analyzed by ChIP-seq. Sequence motifs found in CRYBMIM-induced MYB-depleted (left) and MYB-enriched loci (right) are shown. p-Values denote statistical significance of three technical replicates. (C–D) Volcano plots of CBP/P300 chromatin occupancy changes after 1 hr (C) and 4 hr (D) of 20 µM CRYBMIM treatment as compared to control, as analyzed by ChIP-seq. Sequence motifs found in CRYBMIM-induced CBP/P300-depleted (left) and CBP/P300-enriched loci (right) are shown. p-Values denote statistical significance of three technical replicates.
-
Figure 6—source data 1
Differentially occupied chromatin loci measured by MYB and CBP/P300 ChIP-seq in CRYBMIM vs PBS treated MV411 cells (1 hr and 4 hr).
- https://cdn.elifesciences.org/articles/65905/elife-65905-fig6-data1-v4.xlsx
Figure 6—figure supplement 1
CRYBMIM remodels MYB chromatin occupancies in AML cells.
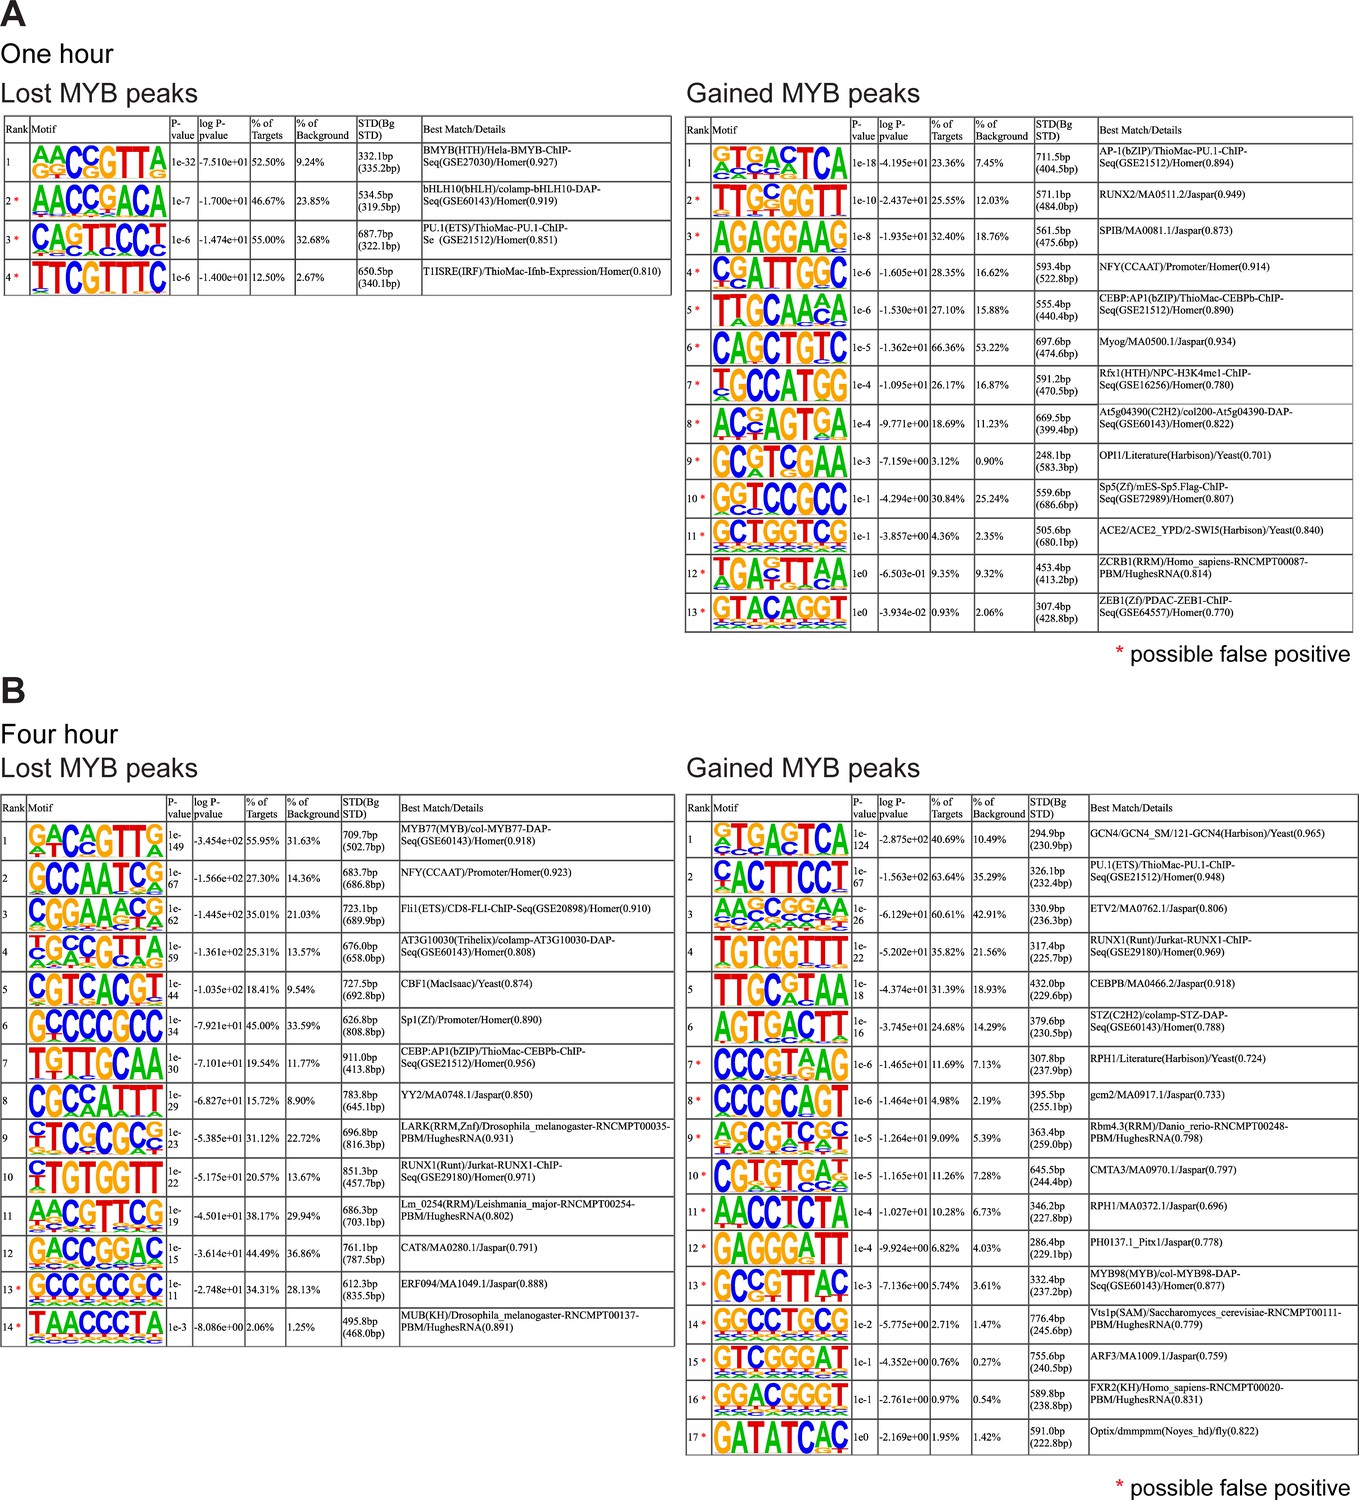
(A–B) Full lists of sequence motifs found in CRYBMIM-induced MYB-depleted (left) and MYB-enriched loci (right) after 1-hr treatment (A) and 4-hr treatment (B) of 20 μM CRYBMIM are shown.
Figure 7 with 1 supplement
MYB assembles aberrant nuclear transcription factor complexes in AML cells.
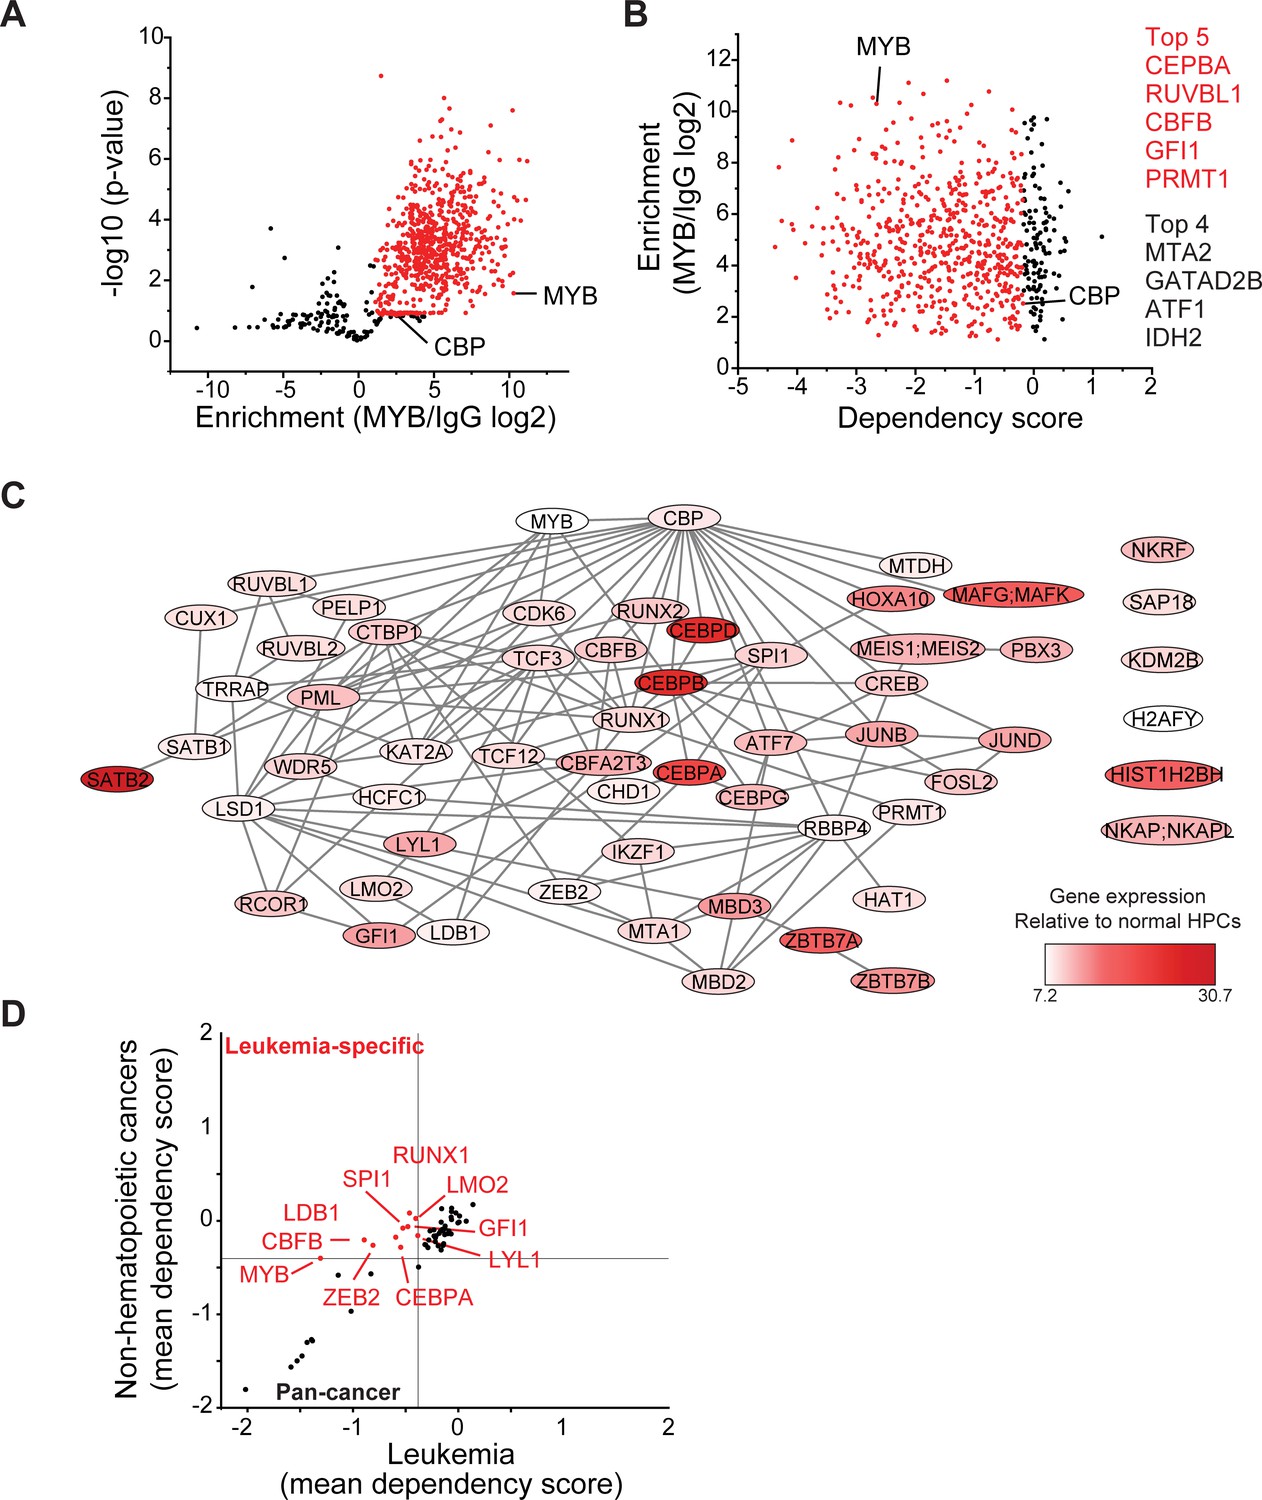
(A) Volcano plot of nuclear MYB-associated proteins compared to IgG control, as analyzed by affinity purification-mass spectrometry of MV411 cells. Red symbols denote specifically MYB-associated proteins, as defined by association with CBP (MYB/IgG log2 >1). p-Values denote statistical significance of three biological replicates. (B) Enrichment of MYB-associated proteins (red) as a function of their corresponding CRISPR DepMap dependency scores in MV411 cells. Red symbols denote functionally required proteins, as defined by the genetic dependency of CBP (score <−0.18). (C) Network of BioGRID protein interactions for MYB-associated nuclear AML proteins as a function of their respective hematopoietic expression aberrancy scores, based on their relative gene expression in AML cells as compared to normal bone human bone marrow progenitor cells (white to red color gradient indicates increasingly aberrant gene expression). (D) Comparison of the genetic dependency scores in leukemia cell lines as compared to all other non-hematopoietic cancer cell lines for MYB-associated nuclear AML proteins, with red symbols denoting proteins that are required in leukemia as compared to non-hematopoietic cancers.
-
Figure 7—source data 1
Lists of proteins identified by IP-MS of IgG control and MYB or CBP/P300 complex purifications from MV411 cell nuclei.
- https://cdn.elifesciences.org/articles/65905/elife-65905-fig7-data1-v4.xlsx
Figure 7—figure supplement 1
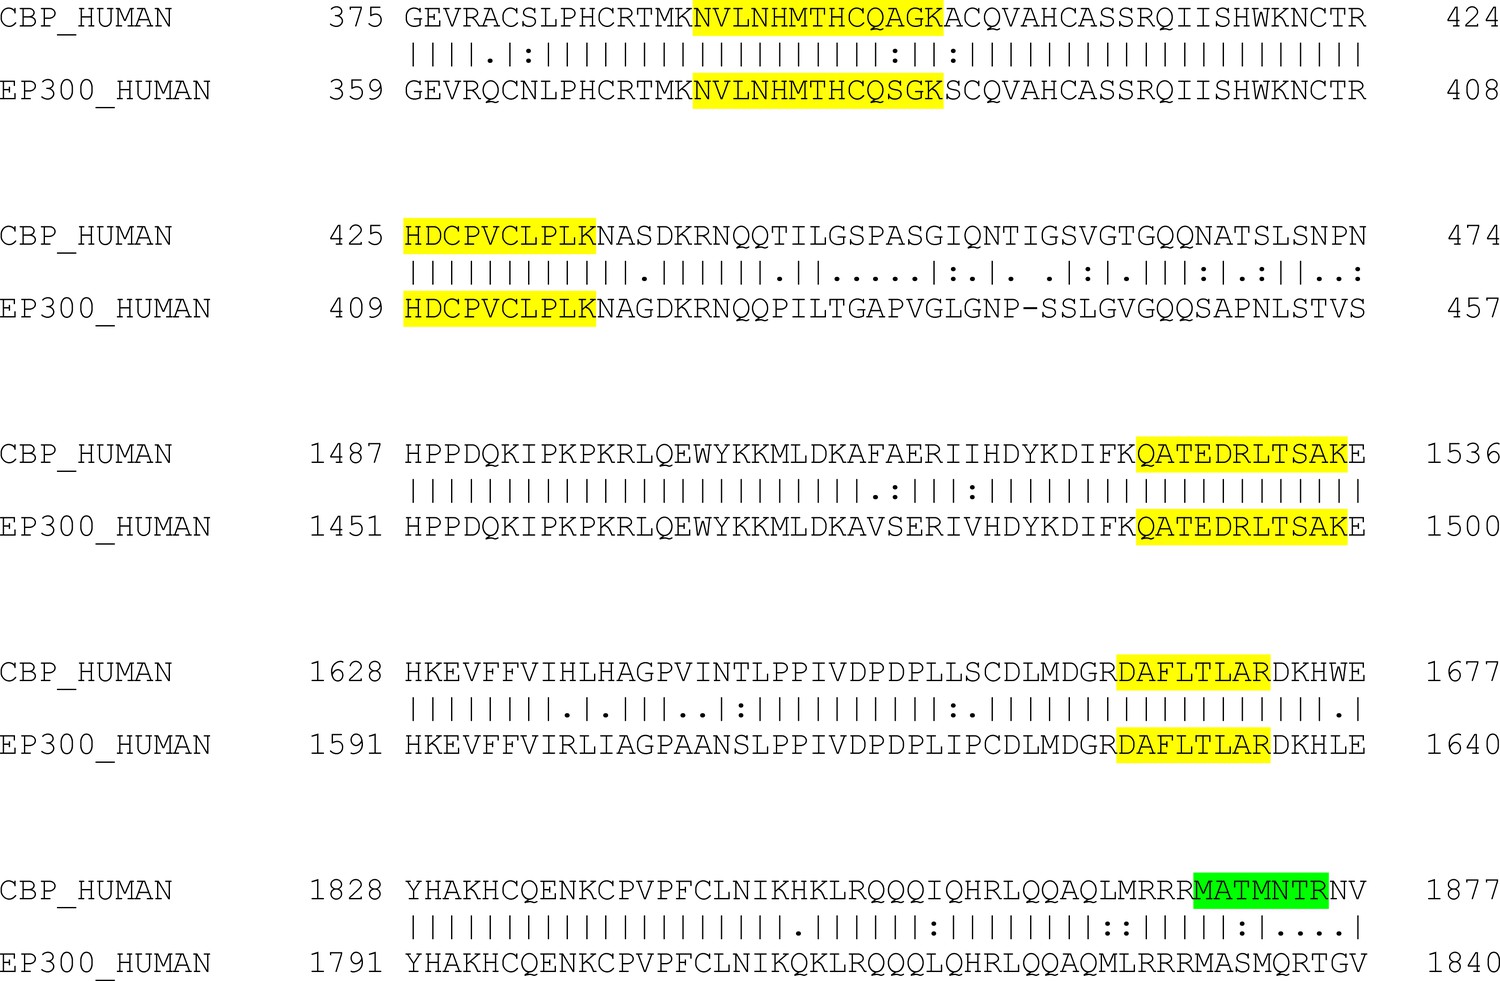
CBP is the primary binding partner of MYB in AML cells.
Sequence alignment of relevant CBP (top row) and P300 (bottom row) amino acids. Highlighted peptides identified in mass spectrometry analysis aligned to either CBP only (green) or both CBP and P300 (yellow).
Figure 8
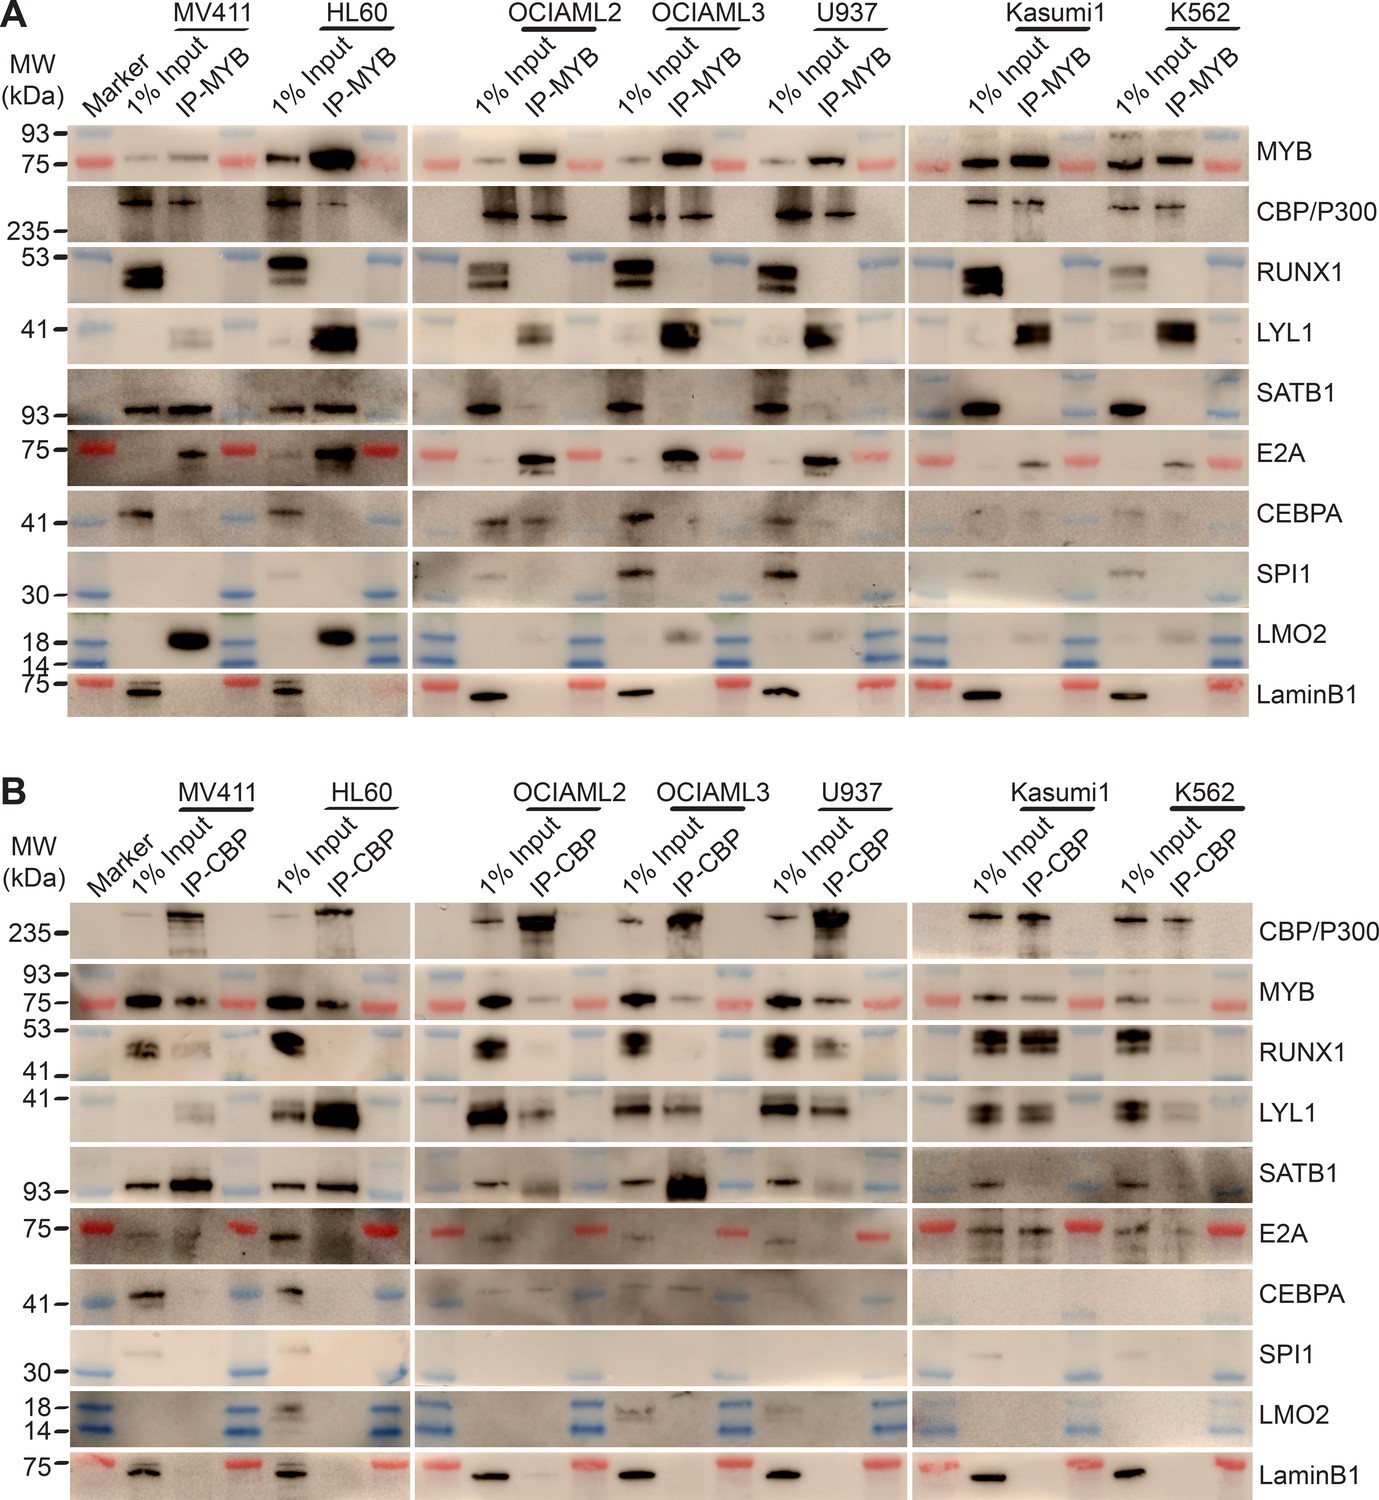
MYB and CBP/P300 assemble convergently organized nuclear transcription factor complexes in genetically diverse AML cells.
(A–B) Western blots of specific transcription factors in immunoprecipitated MYB (A) and CBP/P300 (B) nuclear complexes in seven genetically diverse AML cell lines, as indicated. Blue and red bands indicate molecular weight markers. LaminB1 serves as the loading control.
Figure 9 with 1 supplement
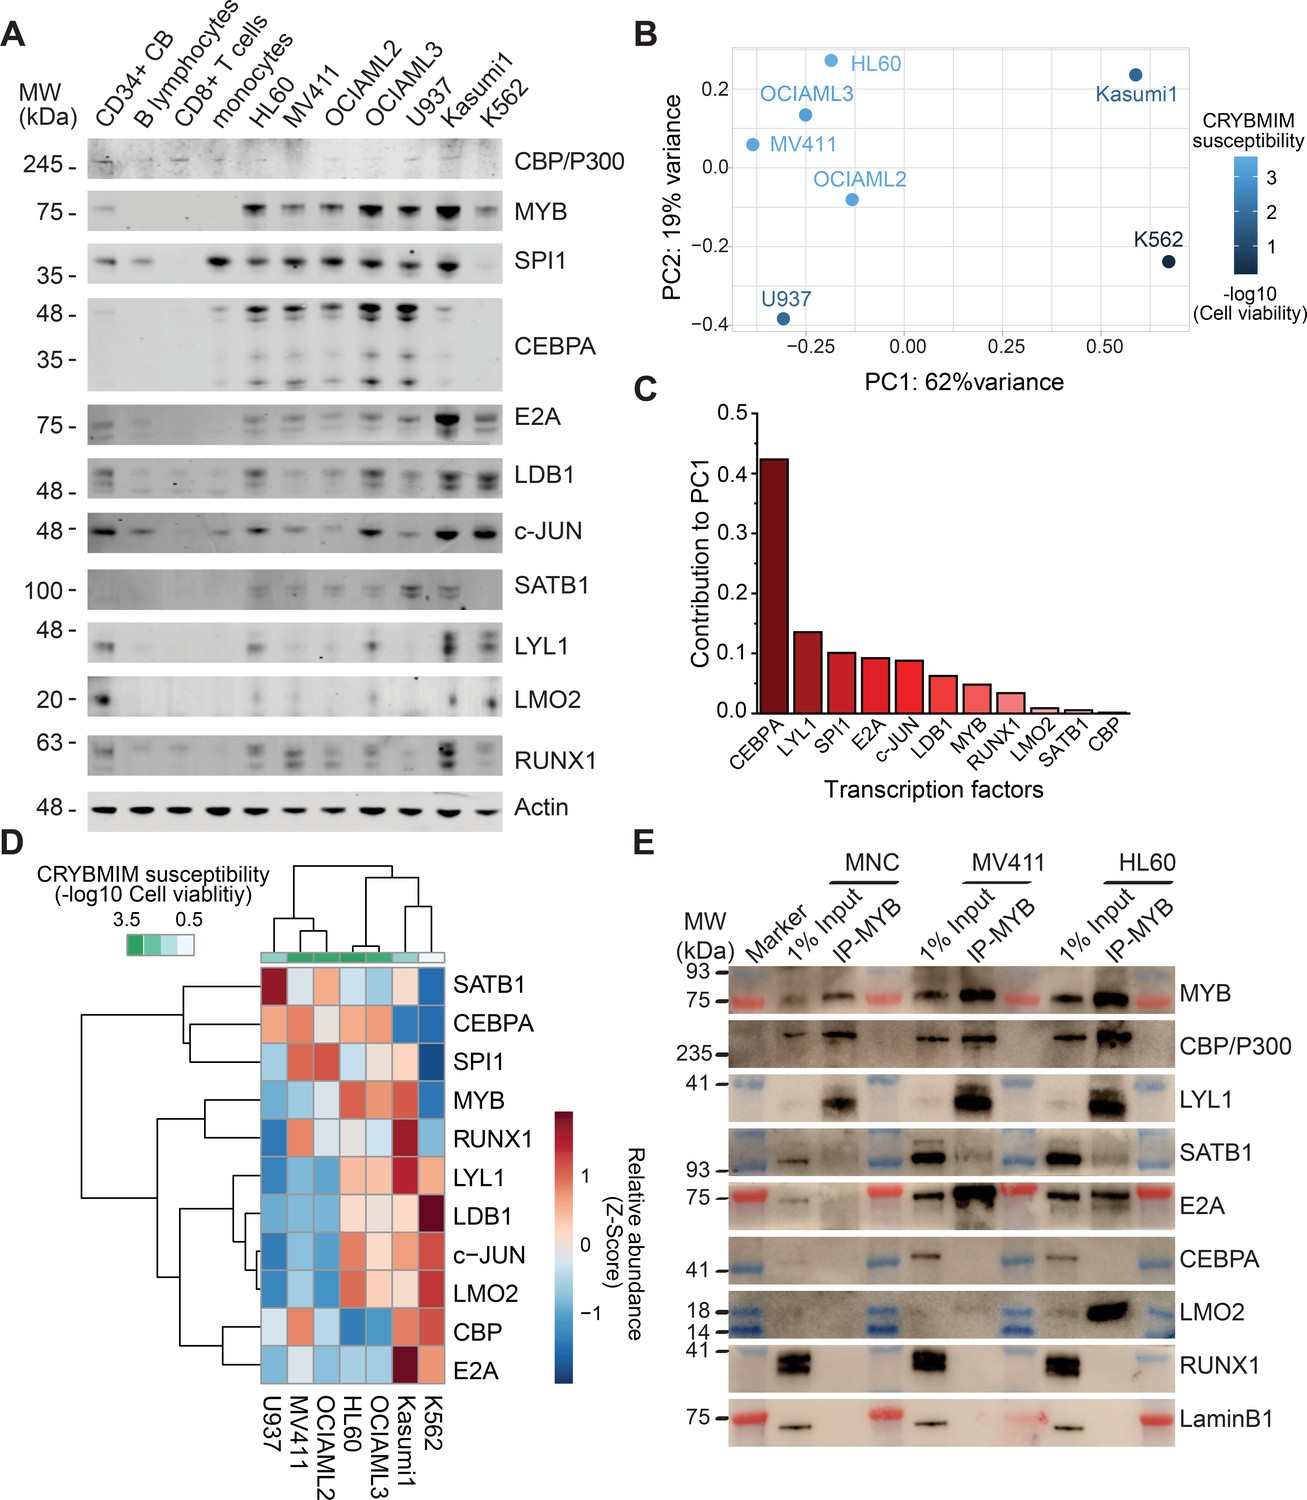
Specific MYB complex factors are aberrantly expressed and assembled in AML as compared to normal human blood cells.
(A) Western blots of specific MYB complex transcription factors in normal human blood cells and genetically diverse leukemia cells, as indicated. Actin serves as the loading control. (B) Principal component analysis of MYB complex transcription factor abundance, as quantified by image densitometry, as a function of susceptibility of various AML cell lines to CRYBMIM (blue color index). (C) Contribution of individual MYB complex transcription factor abundance to the top PCA eigenvector. (D) Heatmap of hierarchical clustering of MYB complex individual transcription factor abundance and CRYBMIM susceptibility. (E) Western blots of specific transcription factors in specific MYB nuclear complexes immunoprecipitated from normal human umbilical cord mononuclear cells (MNC), as compared to MV411 and HL60 AML cells. Blue and red bands indicate molecular weight markers. LaminB1 serves as loading control.
-
Figure 9—source data 1
All coding gene expression changes measured by RNA-seq in 1 hr CRYBMIM vs PBS treated 5 AML cell lines.
- https://cdn.elifesciences.org/articles/65905/elife-65905-fig9-data1-v4.xlsx
Figure 9—figure supplement 1
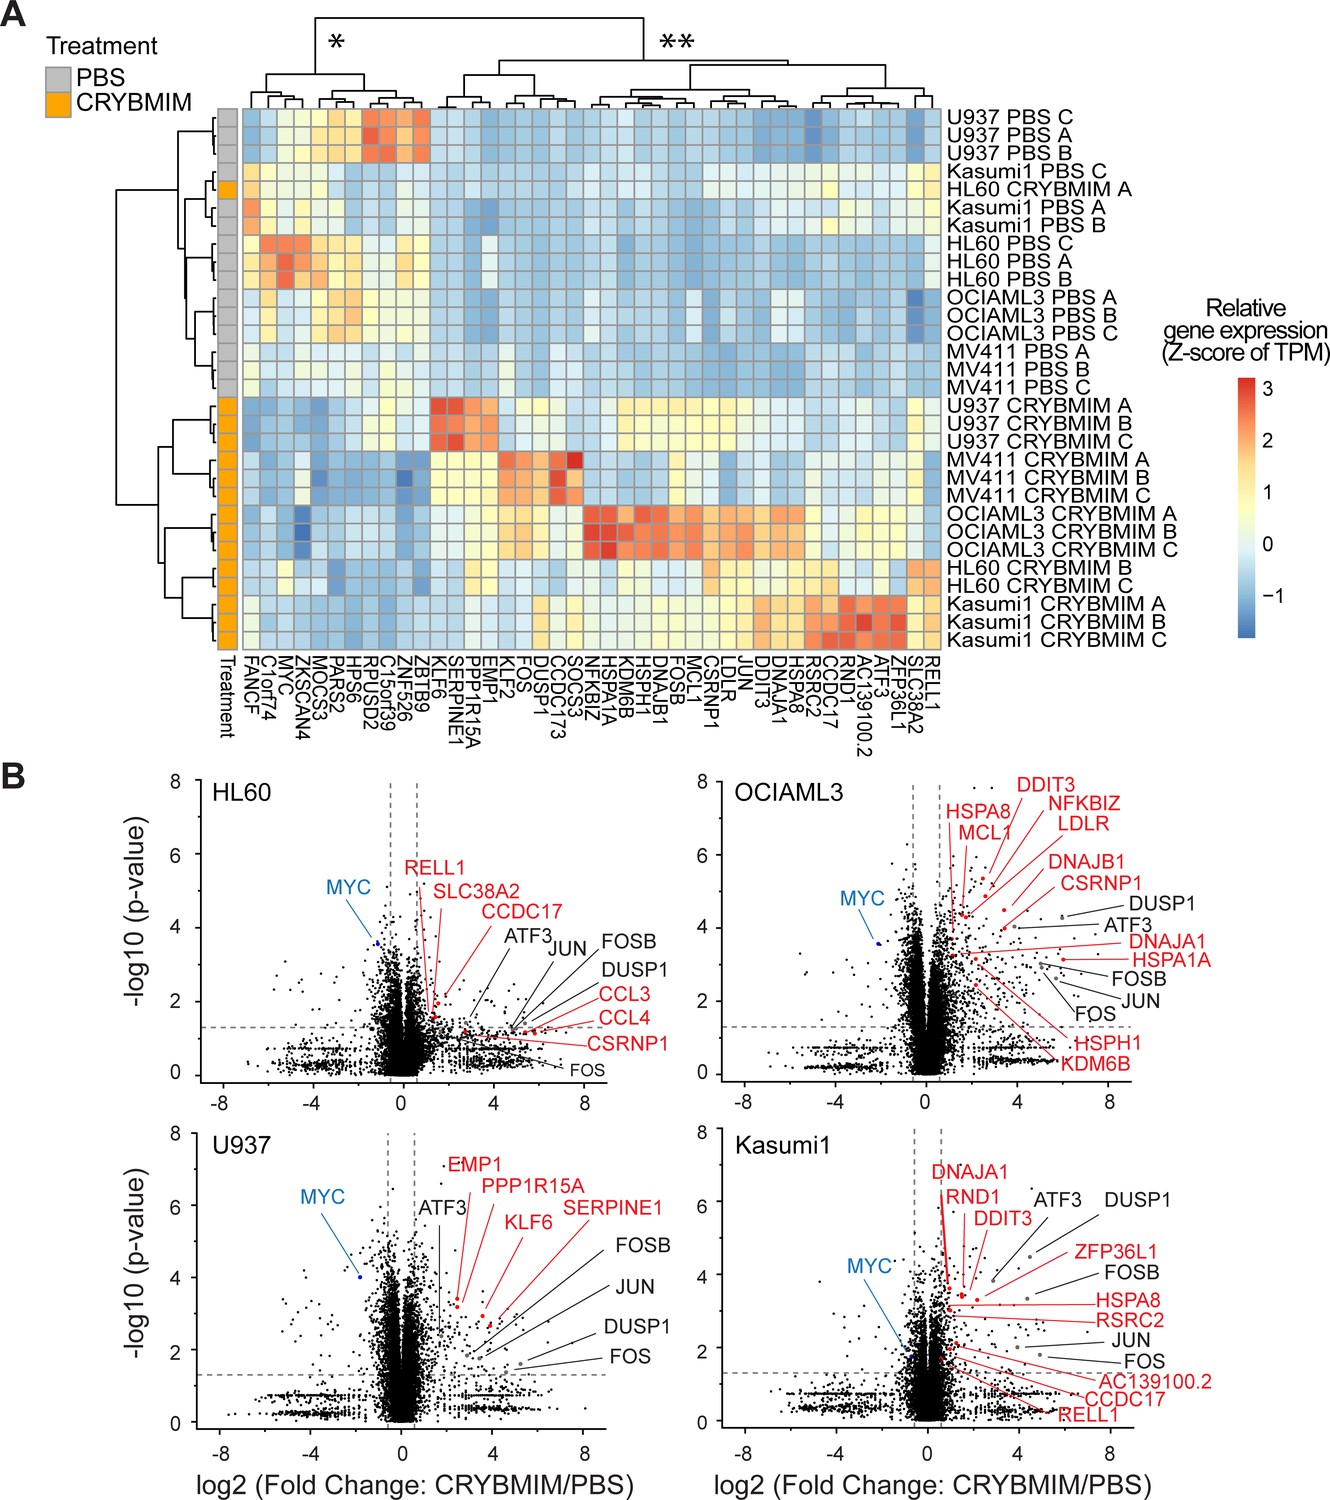
MYB transcription complexes induce shared and repress distinct gene expression programs in genetically diverse AML cells, as remodeled by peptidomimetic CRYBMIM inhibition.
(A) Gene expression of five genetically diverse AML cell lines treated with 20 µM CRYBMIM (brown) as compared to PBS control (gray) for 1 hr, and measured by transcriptome RNA sequencing. Blue to red color gradient denotes relative gene expression of transcripts per million reads (TPM). Unsupervised clustering demonstrates gene sets that are repressed (*) and induced (**) by CRYBMIM and are shared and distinct among diverse AML cell lines, respectively, with top differentially expressed genes labeled. Data represent biological triplicates (A, B, C). (B) Volcano plots of differentially expressed genes following treatment with 20 µM CRYBMIM for 1 hr in genetically diverse AML cell lines. Vertical dashed lines denote relative changes in transcript abundance, and horizontal dashed line denotes statistical significance of biological triplicates (p=0.05).
Figure 10 with 1 supplement
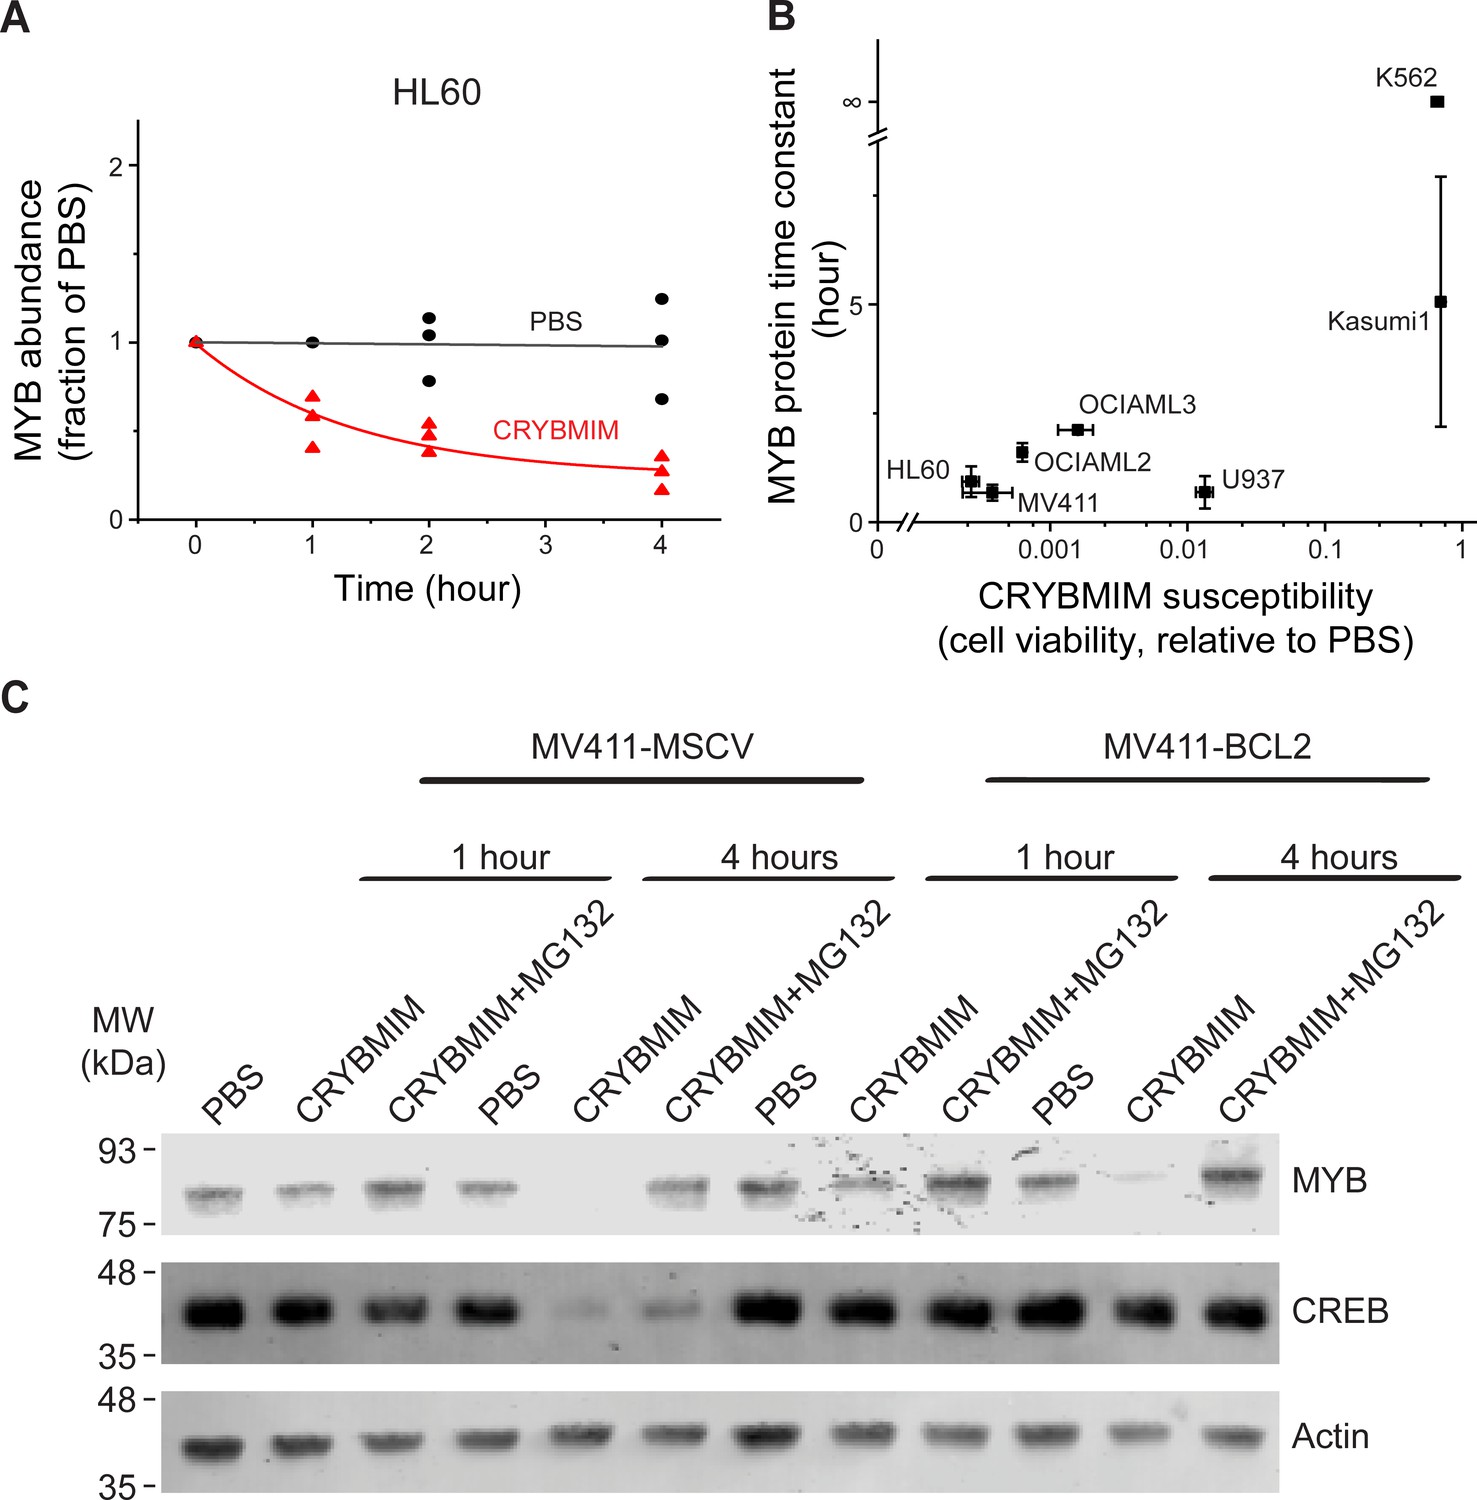
Peptidomimetic remodeling of MYB transcriptional complexes leads to rapid MYB proteolysis.
(A) Quantification of MYB abundance in HL60 cells as a function of duration of 20 µM CRYBMIM treatment (red) as compared to PBS control (black) using Western blot image densitometry. Lines represent single exponential decay fits. Western blots and fits for all cell lines studied are shown in Figure 10—figure supplement 1. Symbols represent biological triplicates. (B) MYB protein half-life, as estimated by exponential decay kinetics, in genetically diverse AML cell lines as a function of CRYBMIM susceptibility (Pearson r = 0.94, excluding resistant K562). Horizontal bars represent standard deviation of CRYBMIM susceptibility. Vertical bars represent standard deviation of time constants. (C) Western blots of MYB and CREB in MV411 AML cells transduced with MSCV retroviruses encoding GFP control (MV411-MSCV) or BCL2 (MV411-BCL2), treated with 20 µM CRYBMIM or PBS control with or without 10 µM of MG132 for 1 or 4 hr, as indicated. Actin serves as loading control.
Figure 10—figure supplement 1
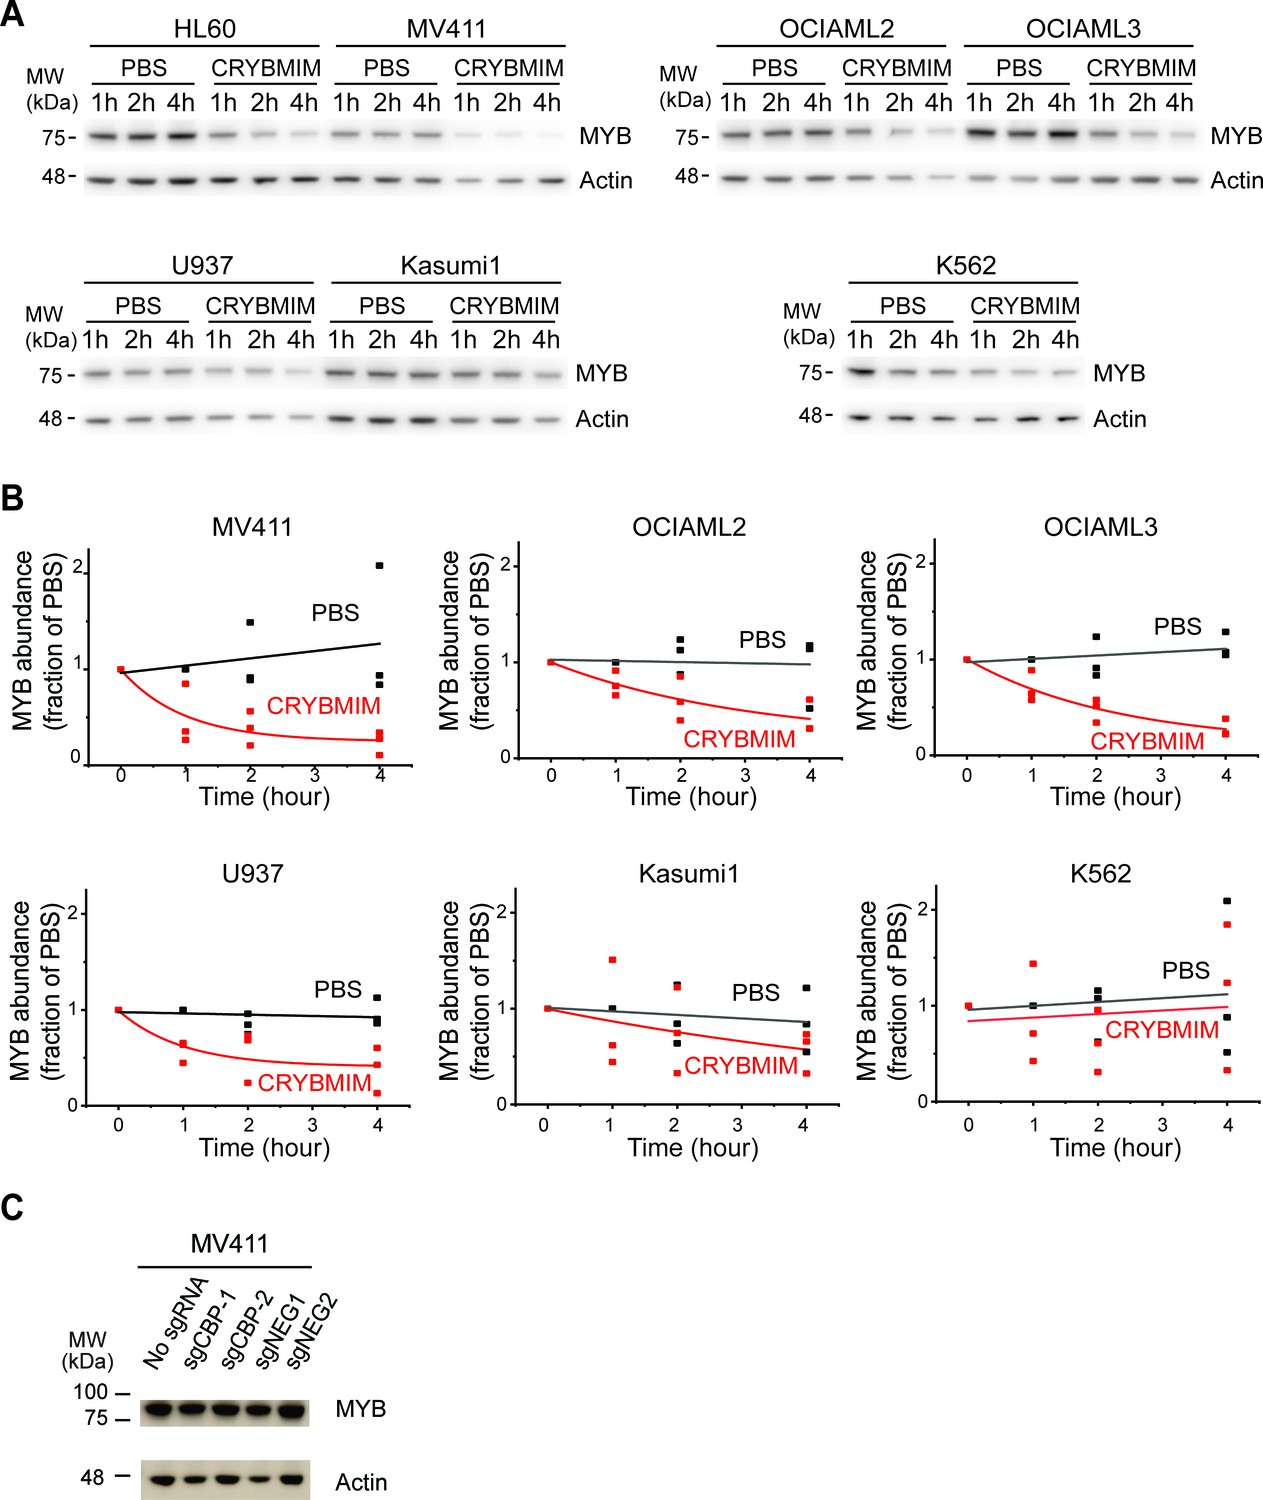
CRYBMIM causes MYB proteolysis with differential degradation rates in AML cells.
(A–B) Western blots (A) and quantification of MYB protein abundance (B) in AML cells upon 1, 2, or 4 hr of 20 µM CRYBMIM (red) or PBS (black) treatment using image densitometry. Lines indicate single exponential fits. Actin serves as loading control. (C) Western blots demonstrating MYB protein abundance in MV411 cells expressing sgCBP-1 and sgCBP-2 as compared to control sgNEG1 and sgNEG2. Actin serves as the loading control.
Figure 11 with 1 supplement
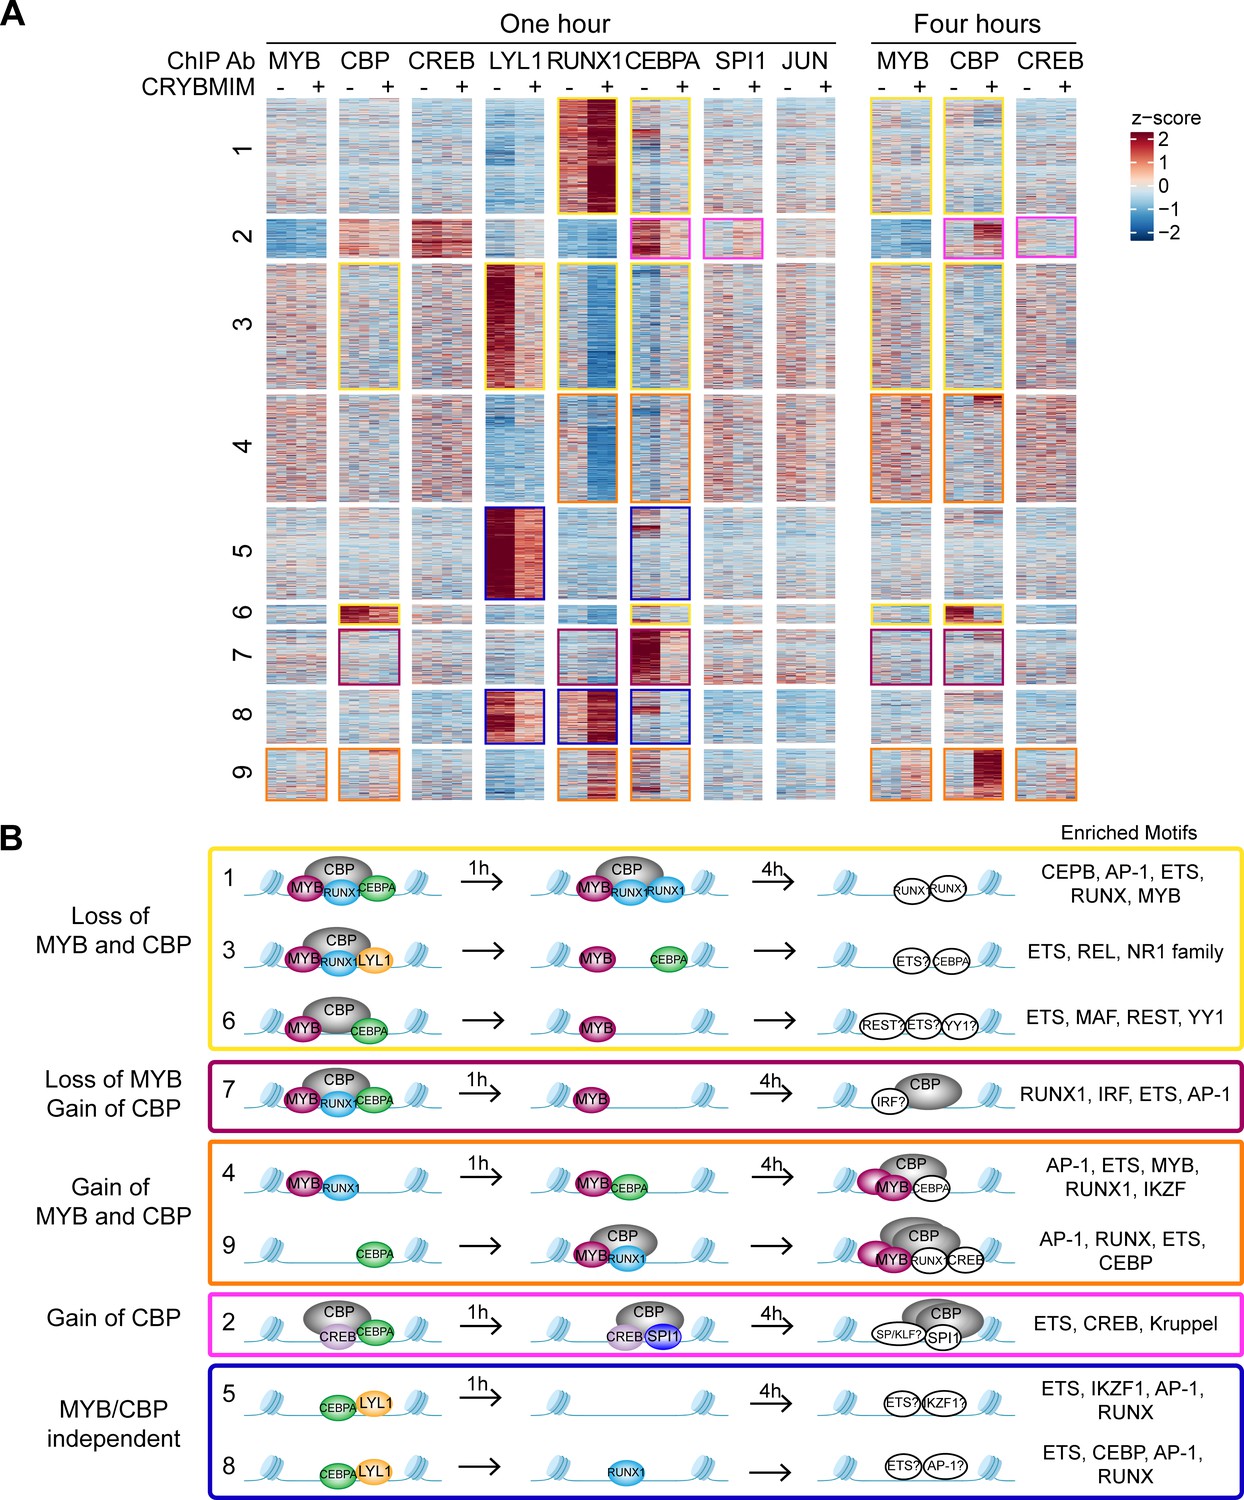
Chromatin dynamics of CRYBMIM remodeled MYB transcription factor complexes in AML cells.
(A) Heatmap of transcription factor chromatin occupancy in MV411 cells as a function of time of control PBS or CRYBMIM treatment. Nine clusters identified using k-means clustering are marked by yellow (loss of MYB and CBP), purple (loss of CBP and gain of MYB), orange (gain of MYB and CBP), pink (gain of CBP), and blue (no apparent changes of MYB and CBP) boxes, based on the similarity of their z-scores, with red and blue representing enrichment or depletion of factors, respectively. (B) Groups of clusters comprising similar responses to CRYBMIM treatment based on MYB and CBP/P300 dynamics. Sequence motifs enriched at specific loci for each cluster are listed. Factors in white denote factors presumed to be enriched based on sequence motif enrichment.
-
Figure 11—source data 1
Differentially increased or decreased peaks measured by multiple TF ChIP-seq in 1 hr CRYBMIM vs PBS-treated MV411 cells.
- https://cdn.elifesciences.org/articles/65905/elife-65905-fig11-data1-v4.xlsx
Figure 11—figure supplement 1
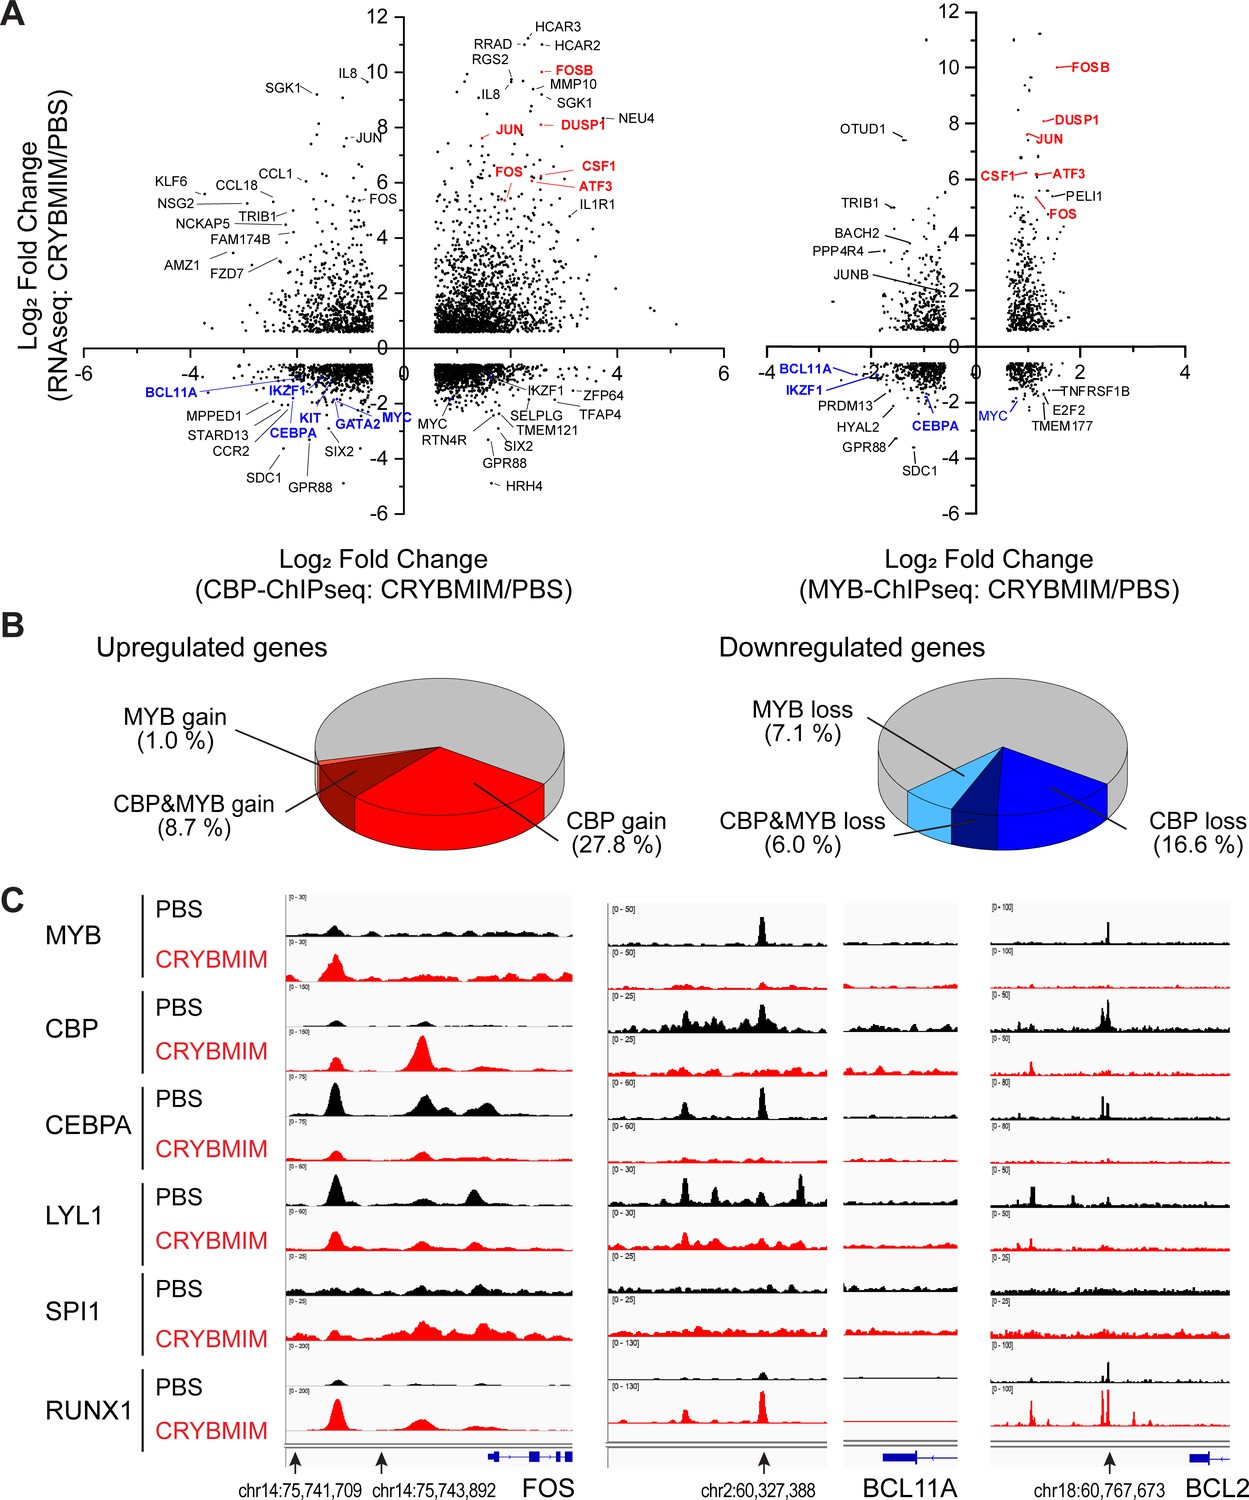
Oncogenic MYB transcription complexes sequester CBP/P300 to control AML gene expression.
(A) Relative gene expression as measured by transcriptome RNA-seq as a function of relative chromatin occupancy of CBP/P300 (left) and MYB (right) as measured by ChIP-seq in MV411 cells treated with 20 µM CRYBMIM versus PBS control for 4 hr. Genes are labeled for greatest peak fold change >1.5 and FDR < 0.1. (B) Distribution of upregulated (left) and downregulated (right) genes with respect to the relative gain (red) and loss (blue) chromatin occupancy of CBP/P300 and MYB. (C) Chromatin occupancy of specific factors in FOS (left), BCL11A (middle), and BCL2 (right) loci that are upregulated, downregulated and not changed, respectively, upon CRYBMIM (red) as compared to PBS control (black) treatment.
Figure 12
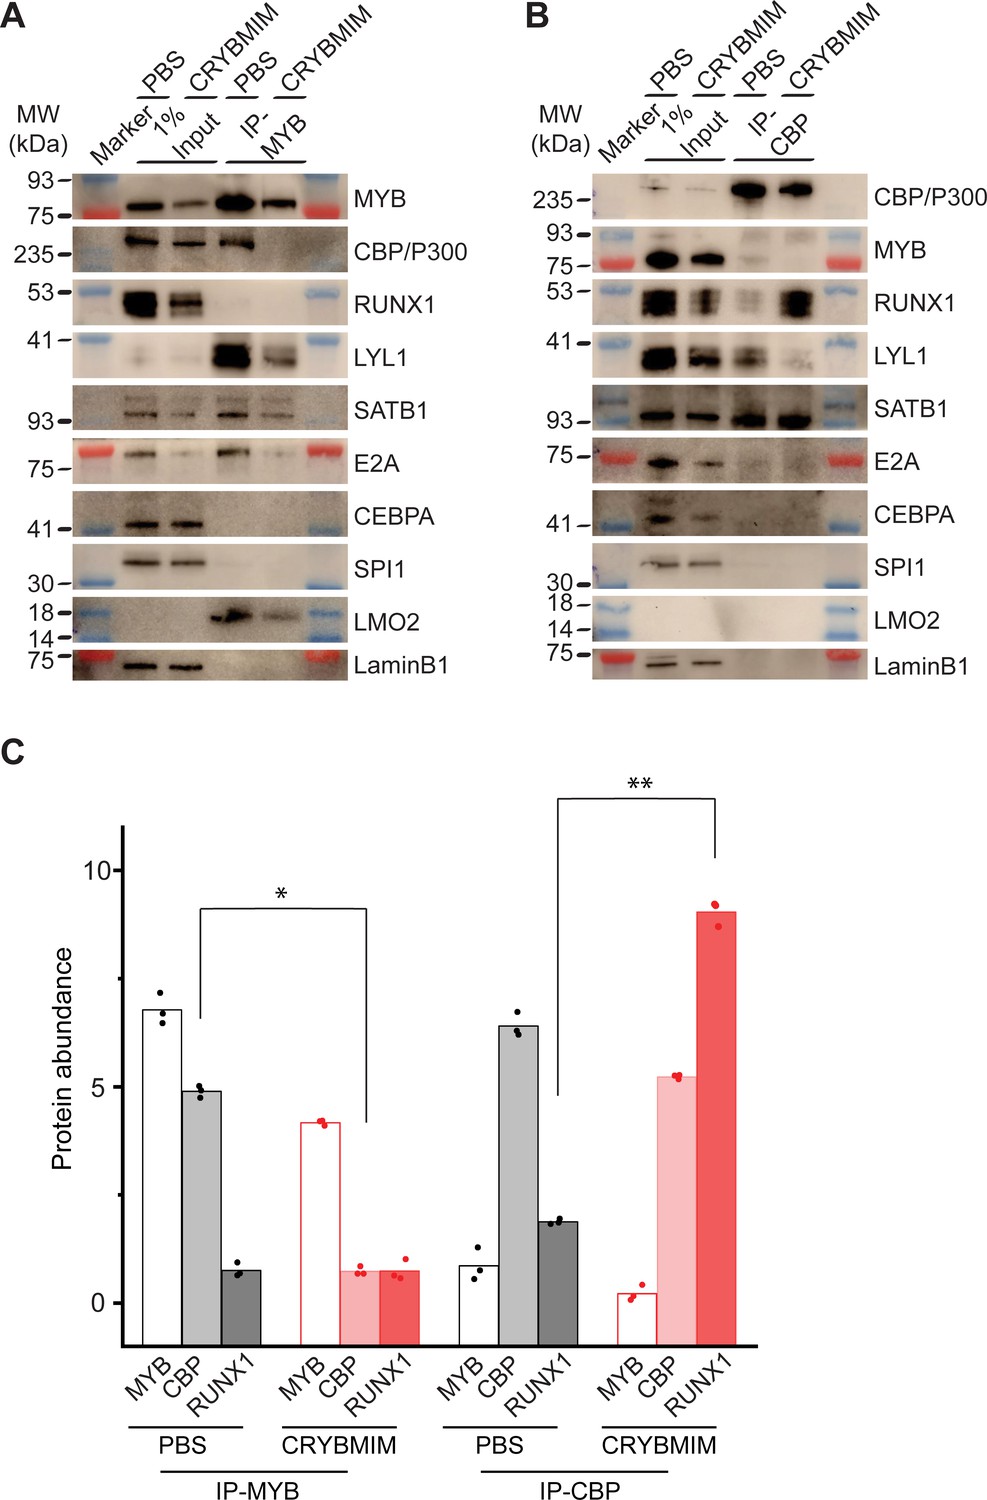
Peptidomimetic blockade of MYB:CBP/P300 by CRYBMIM releases CBP/P300 that recruits RUNX1 to chromatin.
(A–B) Western blots of specific transcription factors in nuclear complexes with immunoprecipitated MYB (A) and CBP/P300 (B) in MV411 cells upon treatment with 10 µM CRYBMIM or PBS control for 1 hr. Blue and red bands indicate molecular weight markers. LaminB1 serves as loading control. (C) Abundance of MYB, CBP/P300 and RUNX1, as measured by western blot image densitometry, in immunoprecipitated MYB and CBP/300 nuclear complexes in MV411 cells treated with CRYBMIM or PBS control. Symbols represent biological triplicates; *p=4.7e-6, t-test for CBP in MYB complex upon CRYBMIM treatment, **p=3.4e-6, t-test for RUNX1 in CBP/P300 complex CRYBMIM treatment.
Figure 13
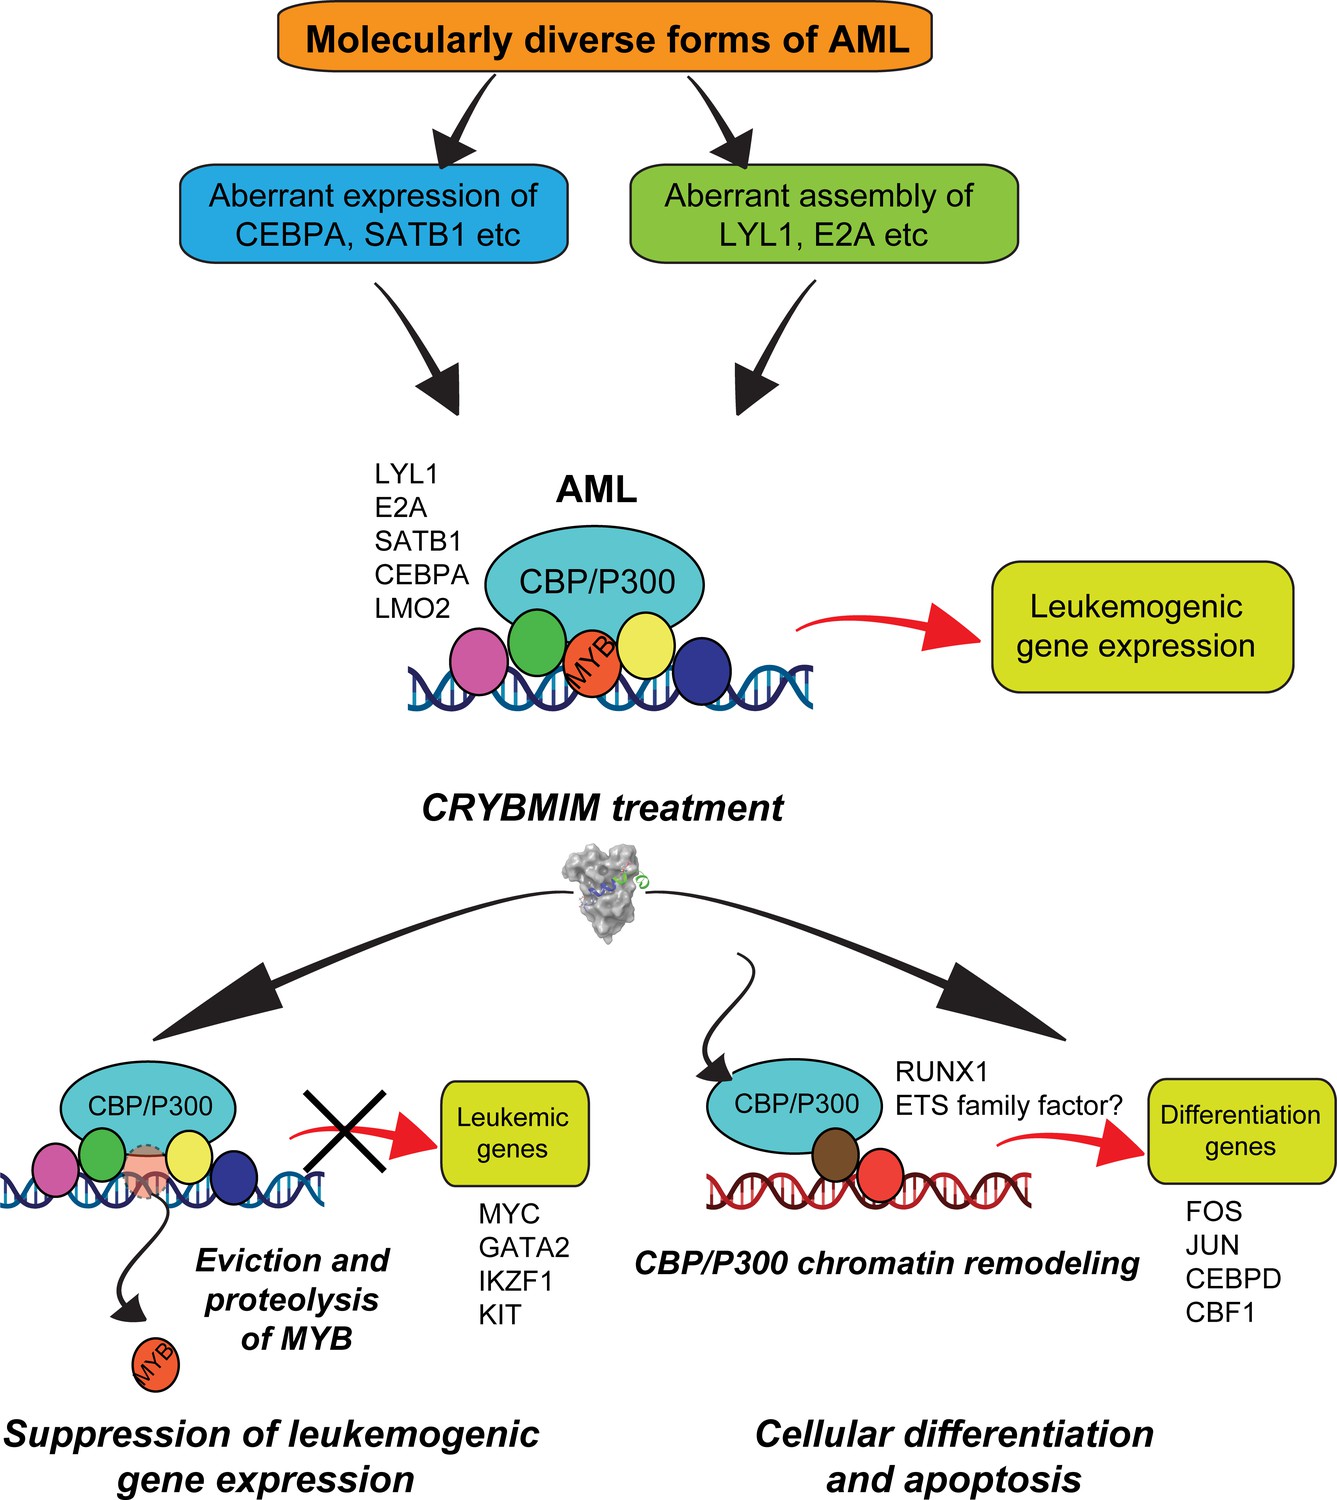
Convergent organization of aberrant MYB complexes controls oncogenic gene expression in acute myeloid leukemia.
Schematic of the molecular organization of MYB transcription factor complexes, induced convergently in genetically diverse subtypes of AML, leading to oncogenic gene expression that requires MYB:CBP/P300 interaction and causes susceptibility to its peptidomimetic remodeling, leading to MYB chromatin eviction and proteolysis, and CBP/P300 release to induce cellular differentiation and apoptosis.
Tables
Appendix 1—key resources table
| Reagent type (species) or resource | Designation | Source or reference | Identifiers | Additional information |
|---|---|---|---|---|
| Cell line (Homo-sapiens) | MV411 | ATCC | Cat# CRL-9591, RRID:CVCL_0064 | |
| Cell line (Homo-sapiens) | MOLM13 | DSMZ | Cat# ACC-554, RRID:CVCL_2119 | |
| Cell line (Homo-sapiens) | OCIAML2 | DSMZ | Cat# ACC-99, RRID:CVCL_1619 | |
| Cell line (Homo-sapiens) | THP1 | ATCC | Cat# TIB-202, RRID:CVCL_0006 | |
| Cell line (Homo-sapiens) | NB4 | DSMZ | Cat# ACC-207, RRID:CVCL_0005 | |
| Cell line (Homo-sapiens) | Kasumi1 | ATCC | ATCC Cat# CRL-2724, RRID:CVCL_0589 | |
| Cell line (Homo-sapiens) | HEL | ATCC | Cat# TIB-180, RRID:CVCL_2481 | |
| Cell line (Homo-sapiens) | OCIAML3 | DSMZ | Cat# ACC-582, RRID:CVCL_1844 | |
| Cell line (Homo-sapiens) | SKM1 | DSMZ | Cat# ACC-547, RRID:CVCL_0098 | |
| Cell line (Homo-sapiens) | U937 | ATCC | Cat# CRL-1593.2, RRID:CVCL_0007 | |
| Cell line (Homo-sapiens) | HL60 | ATCC | Cat# CCL-240, RRID:CVCL_0002 | |
| Cell line (Homo-sapiens) | K562 | ATCC | Cat# CCL-243, RRID:CVCL_0004 | |
| Antibody | anti-v-Myb + c-Myb (phospho S11) (Rabbit monoclonal, EP769Y) | Abcam | Cat# ab45150, RRID: AB_778878 | IP (7.5 µg for 100 million cells) |
| Antibody | anti-c-Myb (Rabbit monoclonal, D1B9E) | Cell Signaling Technology | Cat# 59995, RRID: AB_2799836 | WB (1:1000) |
| Antibody | anti-CBP (Rabbit monoclonal, D9B6) | Cell Signaling Technology | Cat# 7425, RRID: AB_10949975 | WB (1:500–1000), IP (15 µg for 100 million cells) |
| Antibody | anti-CBP (Rabbit polyclonal, PA1-847) | Invitrogen | Cat# PA1-847, RRID: AB_2083939 | WB (1:500–1000) |
| Antibody | anti-p300 (Rabbit monoclonal, D8Z4E) | Cell Signaling Technology | Cat# 86377, RRID: AB_2800077 | WB (1:500) |
| Antibody | anti-RUNX1 (Rabbit monoclonal, D33G6) | Cell Signaling Technology | Cat# 4336, RRID: AB_10859035 | WB (1:1000) |
| Antibody | anti-RUNX1 (Mouse monoclonal, 1C5B16) | BioLegend | Cat# 659302, RRID: AB_2563194 | WB (1:1000) |
| Antibody | anti-LYL1 (Mouse monoclonal, C-4) | Santa Cruz Biotechnology | Cat# sc-374164, RRID: AB_10986408 | WB (1:500) |
| Antibody | anti-SATB1 (Rabbit monoclonal, P472) | Cell Signaling Technology | Cat# 3643, RRID: AB_2184328 | WB (1:1000) |
| Antibody | anti-E2A (Rabbit monoclonal, D2B1) | Cell Signaling Technology | Cat# 12258, RRID: AB_2797860 | WB (1:1000) |
| Antibody | anti-CEBPA (Rabbit monoclonal, D56F10) | Cell Signaling Technology | Cat# 8178, RRID: AB_11178517 | WB (1:1000) |
| Antibody | anti-CEBPA (Mouse monoclonal, G-10) | Santa Cruz Biotechnology | Cat# sc-166258, RRID: AB_2078042 | WB (1:500) |
| Antibody | anti-SPI1 (Rabbit monoclonal) | Cell Signaling Technology | Cat# 2266, RRID: AB_10692379 | WB (1:1000) |
| Antibody | anti-LDB1 (Rabbit polyclonal) | Cell Signaling Technology | Cat# 55476, RRID: AB_2799486 | WB (1:1000) |
| Antibody | anti-LMO2 (Rabbit monoclonal, E8K6I) | Cell Signaling Technology | Cat# 87182, RRID: NA | WB (1:1000) |
| Antibody | anti-c-Jun (Rabbit monoclonal, 60A8) | Cell Signaling Technology | Cat# 9165, RRID: AB_2130165 | WB (1:1000) |
| Antibody | anti-β-Actin (Mouse monoclonal, 8H10D10) | Cell Signaling Technology | Cat# 3700, RRID: AB_2242334 | WB (1:5000) |
| Antibody | anti-β-Actin (Rabbit monoclonal, 13E5) | Cell Signaling Technology | Cat# 4970, RRID: AB_2223172 | WB (1:5000) |
| Antibody | anti-Lamin B1 (Mouse monoclonal, A-11) | Santa Cruz Biotechnology | Cat# sc-377000, RRID: AB_2861346 | WB (1:500) |
| Antibody | anti-Lamin B1 (Rabbit monoclonal, HRP Conjugate, D9V6H) | Cell Signaling Technology | Cat# 15068, RRID: AB_2798695 | WB (1:1000) |
| Antibody | anti-MED15 (Rabbit polyclonal) | Bethyl | Cat# A302-422A, RRID: AB_1907305 | WB (1:2000) |
| Recombinant DNA reagent | Human CRISPR Knockout Pooled Library GeCKO v2 | Sanjana et al., 2014 | Addgene Pooled Library #1000000049 | |
| Recombinant DNA reagent | LRG2.1 (U6-sgRNA-GFP) (Plasmid) | Tarumoto et al., 2018; Lu et al., 2018 | Addgene Plasmid #108098, RRID:Addgene_108098 | |
| Recombinant DNA reagent | LRC2.1 (U6-sgRNA-mCherry) (Plasmid) | Tarumoto et al., 2018; Lu et al., 2018 | Addgene Plasmid #108099, RRID:Addgene_108099 | |
| Recombinant DNA reagent | LentiV_Cas9_Blast (Plasmid) | Tarumoto et al., 2020 | Addgene Plasmid #125592, RRID:Addgene_125592 | |
| Recombinant DNA reagent | LentiV_Cas9_puro (EFS-Cas9-P2A-Puro) (Plasmid) | Tarumoto et al., 2018; Lu et al., 2018 | Addgene Plasmid #108100, RRID:Addgene_108100 | |
| Recombinant DNA reagent | MSCV-BCL2-IRES-GFP (Plasmid) | Sanda et al., 2013 | ||
| Sequence-based reagent | sgCBP-1; sgCBP-2; sgEP300-1; sgEP300-2; sgCDK1; sgNEG1; sNEG2 | Tarumoto et al., 2018; Lu et al., 2018 | sgRNAs See Supplementary file 1c | |
| Peptide, recombinant protein | MYBMIM | Ramaswamy et al., 2018 | See Supplementary file 1a | |
| Peptide, recombinant protein | CRYBMIM; CREBMIM; CG3; TG3; MLLMIM | This study | See Supplementary file 1a | |
| Peptide, recombinant protein | Bio-CRYBMIM; Bio-CREBMIM; FITC-CRYBMIM; FITC-CREBMIM | This study | See Supplementary file 1a | |
| Peptide, recombinant protein | RI-TAT | This study | See Supplementary file 1a | |
| Commercial assay or kit | CellTiter-Glo Luminescent Cell Viability Assay | Promega | G7571 | |
| Commercial assay or kit | CD34 MicroBead Kit UltraPure, human | Miltenyi Biotech | 130-100-453 | |
| Commercial assay or kit | Dynabeads Antibody Coupling Kit | Thermo Fisher | 14311D | |
| Chemical compound, drug | Doxorubicin | Sigma Aldrich | D1515 | |
| Software, algorithm | DepMap 19Q4 | Cancer Dependency Map Portal | RRID:SCR_017655 | |
| Software, algorithm | EMBOSS Needle | European Bioinformatics Institute | RRID:SCR_004727 | Alignment of protein sequences |
| Software, algorithm | MacroModel | Schrodinger | RRID:SCR_014879 | Force Field-based Molecular Modeling |
| Software, algorithm | MAGeCK | Li et al., 2014 | RRID:N.A. | Genome-wide CRISPR screen |
| Software, algorithm | MaxQuant (version 1.6.0.16) | Max planck institute of biochemistry | RRID:SCR_014485 | mass-spectrometric data analysis |
| Software, algorithm | trim_galore | Babraham Institute | RRID:SCR_011847 | ChIP-seq data analysis |
| Software, algorithm | bowtie2 | Johns Hopkins University | RRID:SCR_016368 | ChIP-seq data analysis |
| Software, algorithm | BEDTools suite | Quinlan and Hall, 2010 | RRID:SCR_006646 | ChIP-seq data analysis |
| Software, algorithm | MACS 2.0 | Zhang et al., 2008, Genomebiol | RRID:SCR_013291 | ChIP-seq data analysis |
| Software, algorithm | CollectRNASeqMetrics | Picard tool | RRID:SCR_006525 | RNA-seq data analysis |
| Software, algorithm | HTSeq v0.6.1. | Anders et al., 2014 Zanini et al., 2021 (in preparation) | RRID:SCR_005514 | RNA-seq data analysis |
| Software, algorithm | DESeq2 | Bioconductor | RRID:SCR_015687 | RNA-seq and ChIP-seq data analysis |
| Software, algorithm | UCSC knownGene | Meyer et al., 2013 | RRID:SCR_005780 | RNA-seq data analysis |
| Software, algorithm | Ensembl 71 | Flicek et al., 2013 | RRID:SCR_002344 | RNA-seq data analysis |
| Software, algorithm | MISO v.2.0 | Katz et al., 2010 | RRID:SCR_003124 | RNA-seq data analysis |
| Software, algorithm | RSEM v.1.2.4 | Li and Dewey, 2011 | RRID:SCR_013027 | RNA-seq data analysis |
| Software, algorithm | Bowtie v.1.0.0 | Langmead et al., 2009 | RRID:SCR_005476 | RNA-seq data analysis |
| Software, algorithm | TopHat v.2.1.1 | Trapnell et al., 2009 | RRID:SCR_013035 | RNA-seq data analysis |
| Software, algorithm | TMM method | Robinson and Oshlack, 2010 | RRID:SCR_012802 (edgeR) | RNA-seq data analysis |
| Software, algorithm | pheatmap package | Kolde, 2020 | RRID:SCR_016418 | RNA-seq data analysis |
| Software, algorithm | R programming environment with Bioconductor | Huber et al., 2015 | RRID:SCR_001905 | RNA-seq data analysis |
| Software, algorithm | dplyr | Wickham et al., 2020 | RRID:SCR_016708 | RNA-seq data analysis |
| Software, algorithm | ggplot2 | Wickham, 2016 | RRID:SCR_014601 | RNA-seq data analysis |
| Software, algorithm | RStudio | RStudio | RRID:SCR_000432 | Statistical analysis |
| Software , algorithm | ImageJ | Fiji | RRID:SCR_002285 | Image processing |
| Software, algorithm | FCS express 7 | De Novo | RRID:SCR_016431 | Flow cytometry data analysis |
| Software, algorithm | OriginPro 2018 | OriginLab | RRID:SCR_014212 | Statistical analysis |
Additional files
-
Supplementary file 1
Key material detailed information.
1a. Peptide list. List of retro-inverso peptides with extinction coefficients. 1b. AML Cell line sequencing. Mutational landscape of human AML cell lines determined by whole genome sequencing 1 c. sgRNA sequence list.
- https://cdn.elifesciences.org/articles/65905/elife-65905-supp1-v4.xlsx
-
Supplementary file 2
Genom-wide CRISPR screen and Gene expression analysis.
2a. MYBMIM GeCKO CRISPR screen gene summary. Top 50 genes are shown. The complete tables are listed in Figure 1—source data 1 and Zenodo (DOI:10.5281/zenodo.4321824) 2b-e. Differentially expressed genes measured by RNA-seq in CRYBMIM, CREBMIM vs PBS-treated MV411 cells (1 hr and 4 hr). Top 50 differentially expressed genes in response to CRYBMIM are shown. The complete tables are listed in Figure 5—source data 1 and Zenodo (DOI:10.5281/zenodo.4321824). 2 f. Gene set enrichment analysis (GSEA) for differentially expressed genes measured by RNA-seq in CRYBMIM, CREBMIM vs PBS-treated MV411 cells. Summary of GSEA on CRYBMIM-induced differentially expressed genes are shown. The complete tables are listed in Zenodo (DOI:10.5281/zenodo.4321824).
- https://cdn.elifesciences.org/articles/65905/elife-65905-supp2-v4.xlsx
-
Supplementary file 3
IP-MS and ChIP-seq analysis.
3a. Protein lists identified by IP-MS of MYB and CBP complex purification from MV411 cell nuclei. Summary of identified proteins is shown. The complete tables are listed in Figure 7—source data 1 and Zenodo (DOI:10.5281/zenodo.4321824). 3b. MYB complex functional groups. 3 c. Pathway analysis for 9 clusters of transcription factor-remodeled genes in response to CRYBMIM measured by ChIP-seq. Top 20 pathways in each cluster are shown. The complete tables are listed in Zenodo (DOI:10.5281/zenodo.4321824).
- https://cdn.elifesciences.org/articles/65905/elife-65905-supp3-v4.xlsx
-
Transparent reporting form
- https://cdn.elifesciences.org/articles/65905/elife-65905-transrepform-v4.docx
Download links
A two-part list of links to download the article, or parts of the article, in various formats.
Downloads (link to download the article as PDF)
Open citations (links to open the citations from this article in various online reference manager services)
Cite this article (links to download the citations from this article in formats compatible with various reference manager tools)
Convergent organization of aberrant MYB complex controls oncogenic gene expression in acute myeloid leukemia
eLife 10:e65905.
https://doi.org/10.7554/eLife.65905


