Disrupting cortico-cerebellar communication impairs dexterity
- Janelia Research Campus, United States
- Johns Hopkins University, United States
- Italian Institute of Technology, Italy
Figures
Figure 1
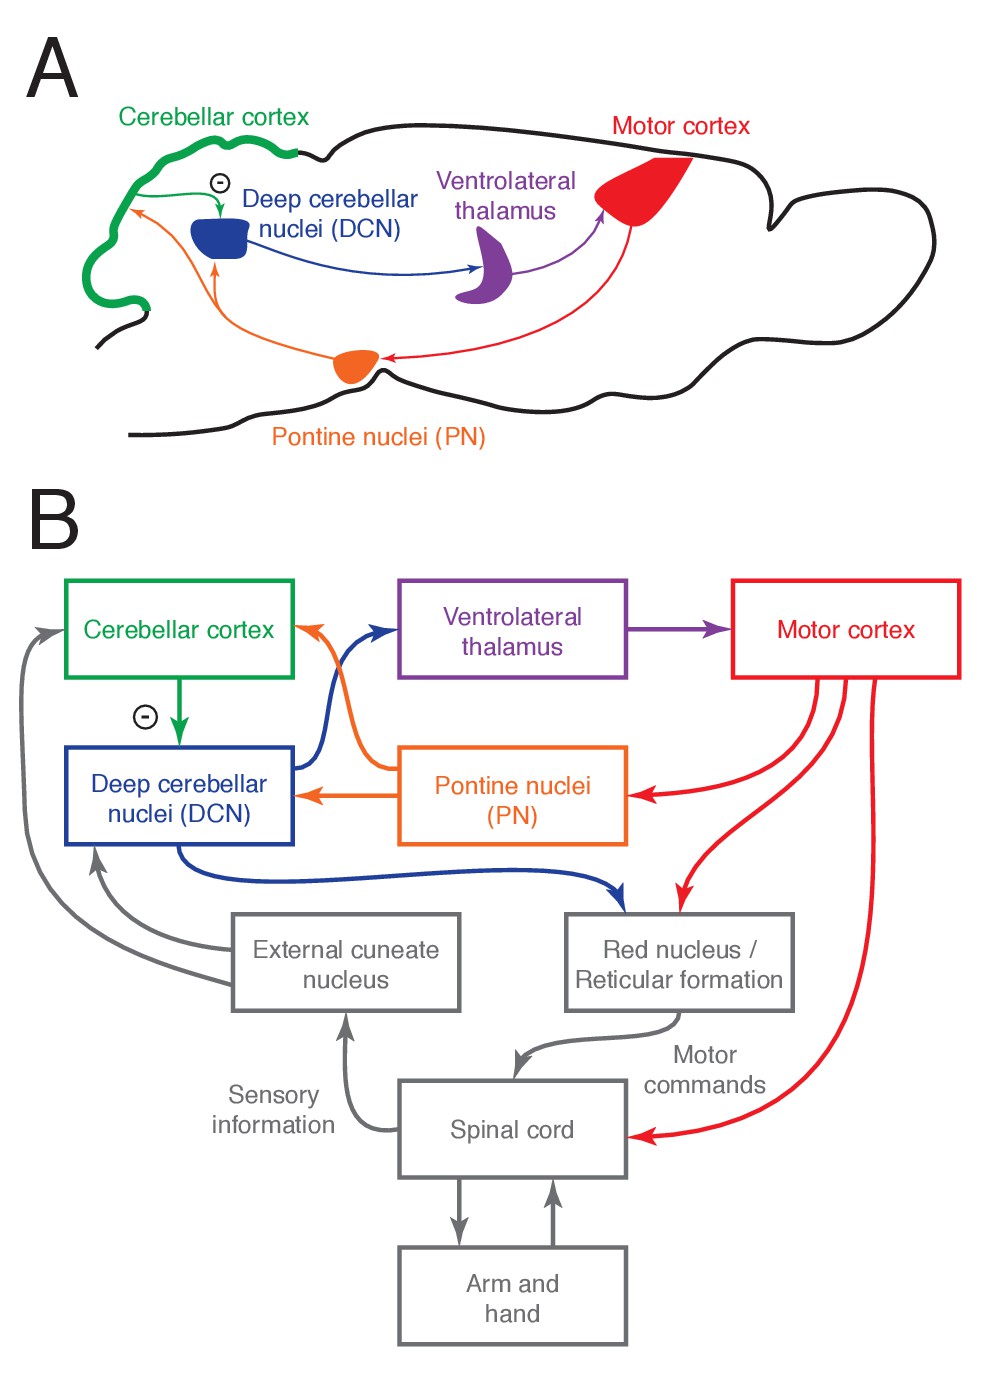
The cortico-cerebellar loop for arm and hand control in the mouse.
(A) Schematic of the main anatomical connections within the loop. (B) Relationship between the cortico-cerebellar loop and the sensorimotor periphery.
Figure 2 with 2 supplements

Firing properties of pontine nuclei (PN) neurons during a cortically dependent reach-to-grab task.
(A) Experimental setup and reach kinematics. Upper left: mice were head-fixed and trained to reach to and grab a pellet of food following an acoustic cue. Upper right: strategy for recording from motor-cortex-recipient neurons in the pontine nuclei. An optical fiber was placed over the forelimb motor cortex of mice expressing ChR2 in pyramidal tract neurons (Sim1-Cre X Ai32). A 384-channel Neuropixels probe was lowered into the pontine nuclei as a laser pulse train was delivered to cortex. After these stimuli were delivered, the animal performed the task as PN neurons were recorded. Lower: example hand trajectories aligned to the cue. The green dots indicate lift, when the animal initiates the reach-to-grab sequence. (B) Histological section showing the tip of the probe in the PN. Red line shows the amplitude of multiunit activity on the probe in response to cortical stimulation as a function of depth. (C) Raw data from eight channels near the bottom of the probe showing activity evoked in the PN by motor cortex stimulation. (D) Spike rasters and firing rates for example neurons in the task, aligned to the cue. The timing of lift is indicated by the green dots. The panels on the right show each unit’s response to cortical stimulation. (E) Firing rate z-scores for all PN neurons (n = 129), sorted according to whether the cells responded to cortical stimulation and by the magnitude of the response (n = 30 neurons were responsive). Inset at the right shows mean firing rates. (F) Effect of the cue and reaching on the firing rates of PN neurons (see Materials and methods). Upper: cue (black) and reach (red) components from generalized linear models (GLMs) for the three example neurons in (D). Gray horizontal lines at the value of 1 correspond to no effect on firing rate; values less than 1 correspond to a decrease, and values greater than 1 correspond to an increase. Lower: cue and reach components for all neurons with R2 > 0.1 (n = 103). Blue values indicate firing rate increases, and red values indicate decreases. Inset at right shows R2 for each neuron. (G) Response of PN neurons to a 2 s, 40 Hz stimulation of motor cortex. Upper: firing rate z-scores for each neuron, aligned to laser onset. Blue ticks indicate neurons with a sustained increase, and red ticks indicate neurons with a decrease. Lower left: laser-aligned spike rasters and firing rate for an example neuron suppressed by motor cortical stimulation. Lower right: scatterplot of the change in firing rate (FR) from baseline over the entire 2 s stimulation window vs. over the initial 100 ms of stimulation. Color coding as in the upper panel.
Figure 2—figure supplement 1
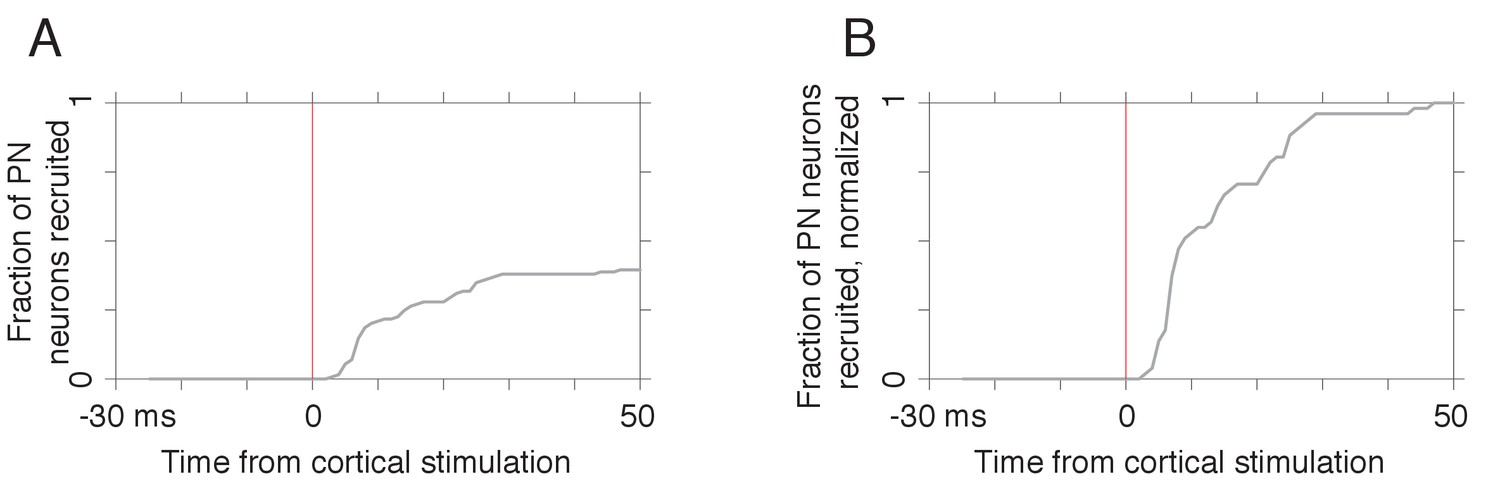
Timing of pontine nuclei (PN) responses to cortical stimulation.
(A) Fraction of PN neurons (n = 51) recruited by each lag relative to the cortical stimulation pulse (see Materials and methods). (B) Fraction of recruited neurons at each lag, normalized by the fraction of the full sample that exhibited a response.
Figure 2—figure supplement 2
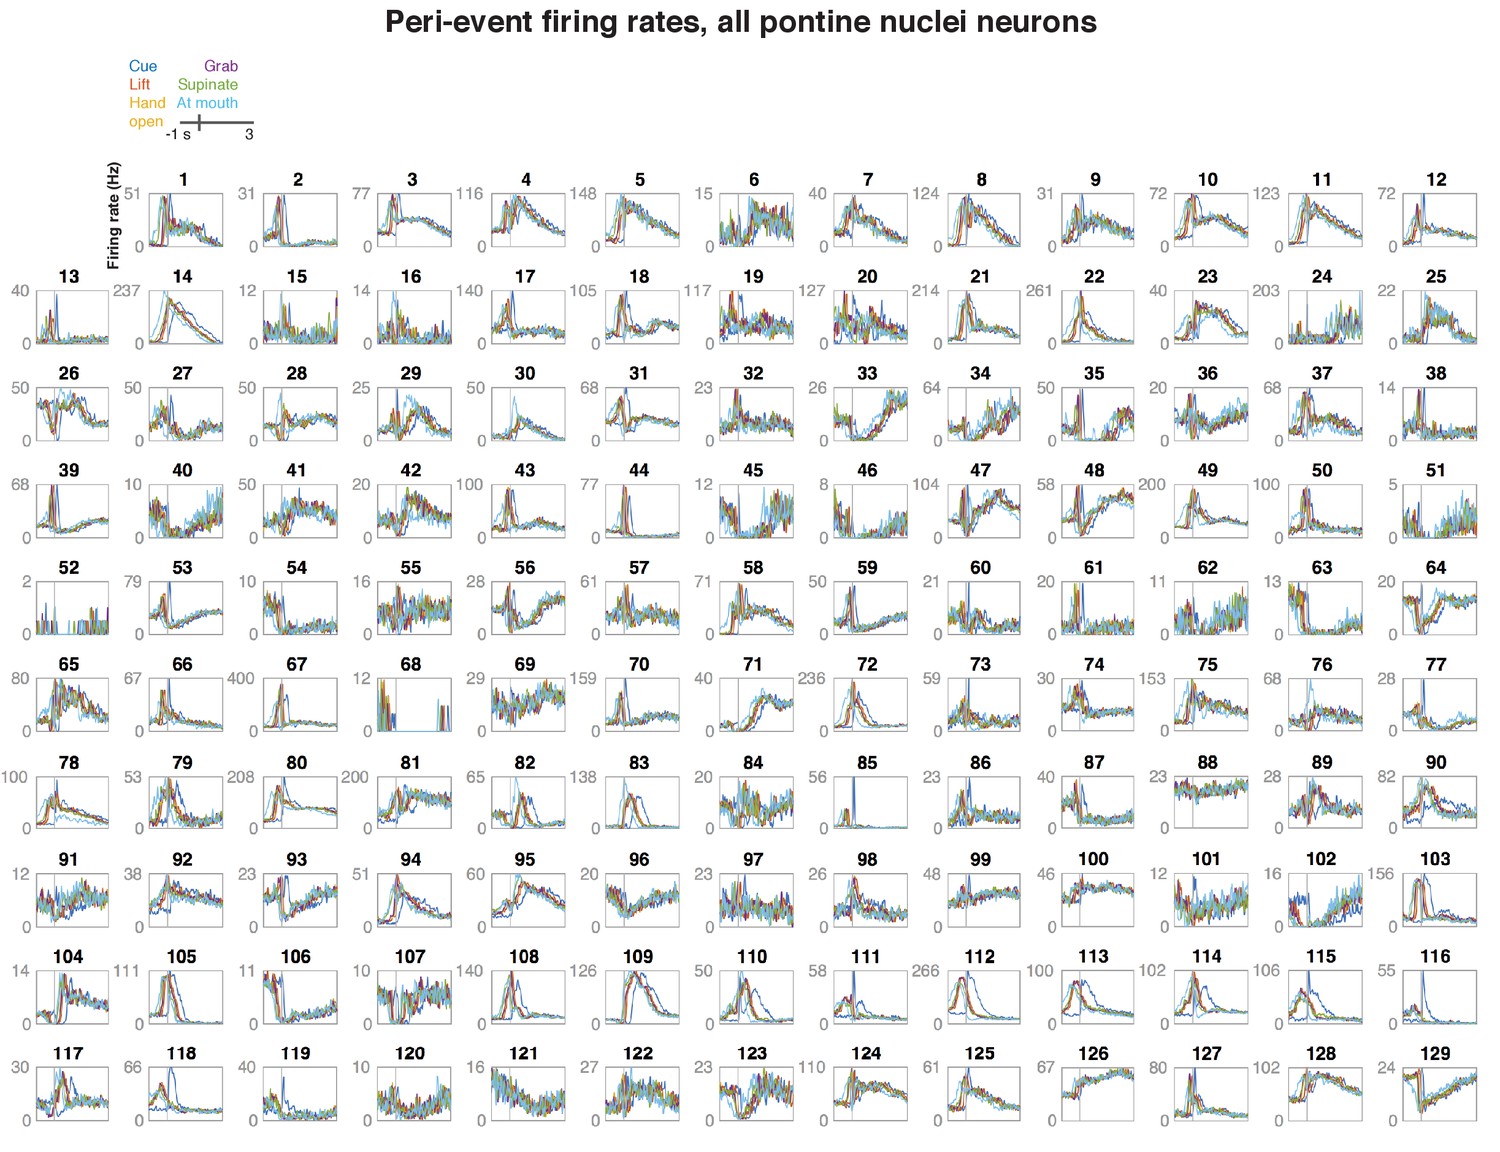
Firing rates of pontine nuclei (PN) neurons aligned to different behavioral events.
Each panel shows the trial-averaged firing rate of one PN neuron in a window of −1 to +3 s of the acoustic cue, lift, hand open, grab, supination, and the arrival of the hand at the mouth.
Figure 3 with 5 supplements
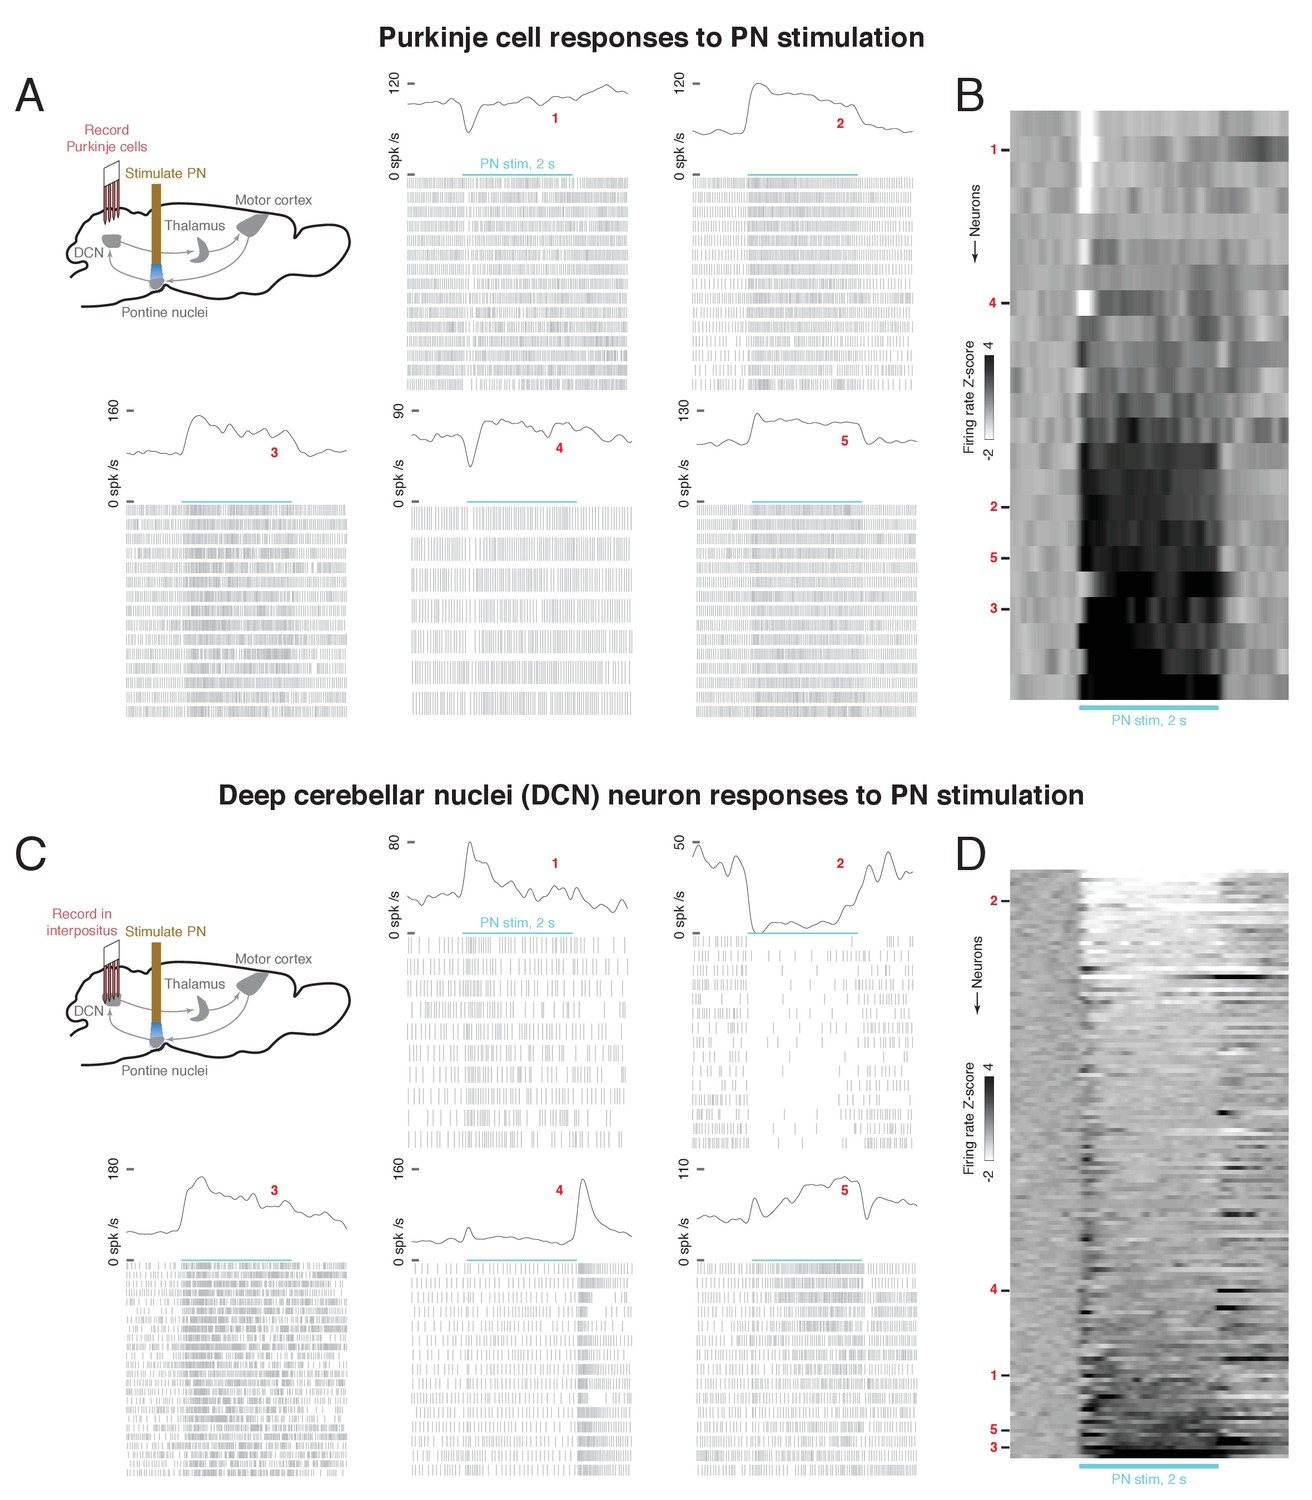
Effect of optogenetic stimulation of the pontine nuclei (PN) on Purkinje cell and deep cerebellar nuclei (DCN) activity.
(A) Upper left: schematic of Purkinje cell recording experiment. A 2s, 40 Hz laser stimulus was applied to the PN while activity was recorded in cerebellar Purkinje cells. Lower and right: laser-aligned spike times and firing rates for five example Purkinje cells. Because the firing rates are high, every third spike is shown in the raster plots, for visual clarity. (B) Firing rate z-scores for all Purkinje cells (n = 23 neurons, n = 2 mice), aligned to PN stimulus onset. (C) Upper left: schematic of DCN recording experiment. A 2 s, 40 Hz laser stimulus was applied to the PN while activity was recorded in the DCN. Lower and right: laser-aligned spike times and firing rates for five example DCN neurons. For visual clarity, every third spike is shown in the spike rasters. (D) Firing rate z-scores for all DCN neurons (n = 139 neurons, n = 8 mice), aligned to PN stimulus onset.
Figure 3—figure supplement 1
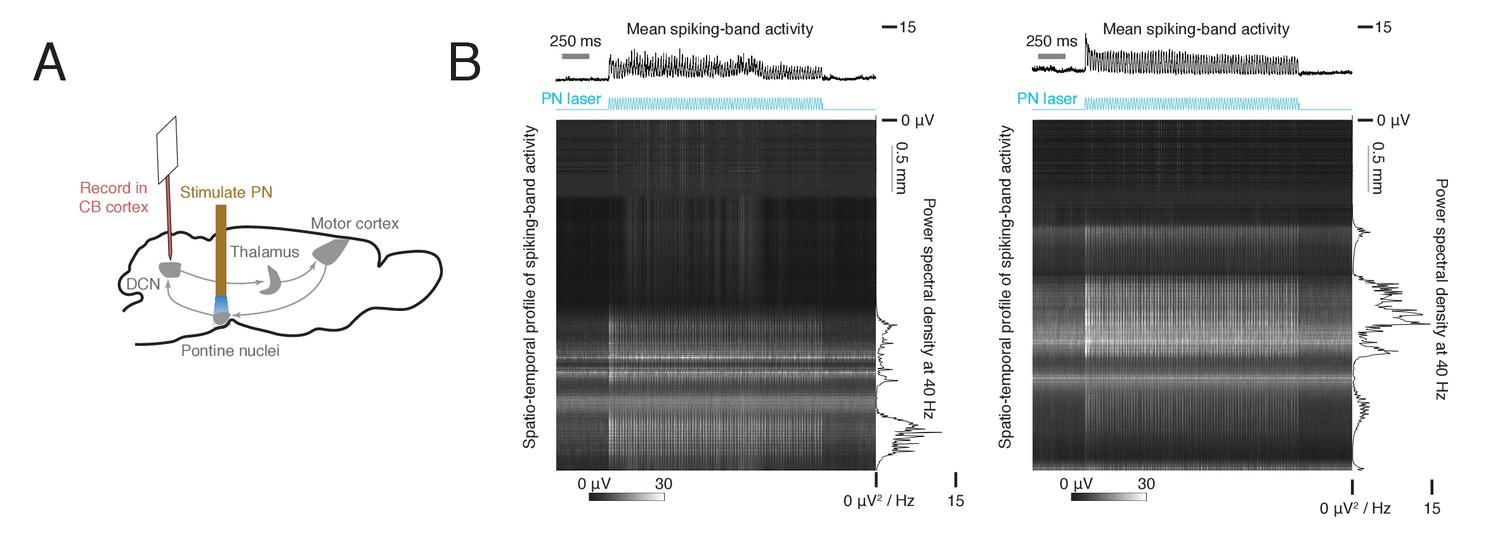
Effect of optogenetic stimulation of the pontine nuclei (PN) on multiunit activity in the cerebellum.
(A) Schematic of depth profile measurement. ChR2 expression was driven in Slc17a7-Cre mice by viral injection in the PN, and an optical fiber was implanted in the PN. Multiunit activity was recorded in cerebellar cortex (n = 2 mice) with a 384-channel Neuropixels probe as a 2 s, 40 Hz sinusoidal laser stimulus was delivered to the PN. (B) Spatio-temporal profile of the cerebellar cortical response to PN stimulation in two mice. For each animal, the heatmap shows raw data from each channel of the probe, filtered and rectified, during the PN stimulus (see Materials and methods). The upper trace shows multiunit activity over time, averaged across all channels. The right trace shows the power density at 40 Hz for each channel, as a function of depth.
Figure 3—figure supplement 2
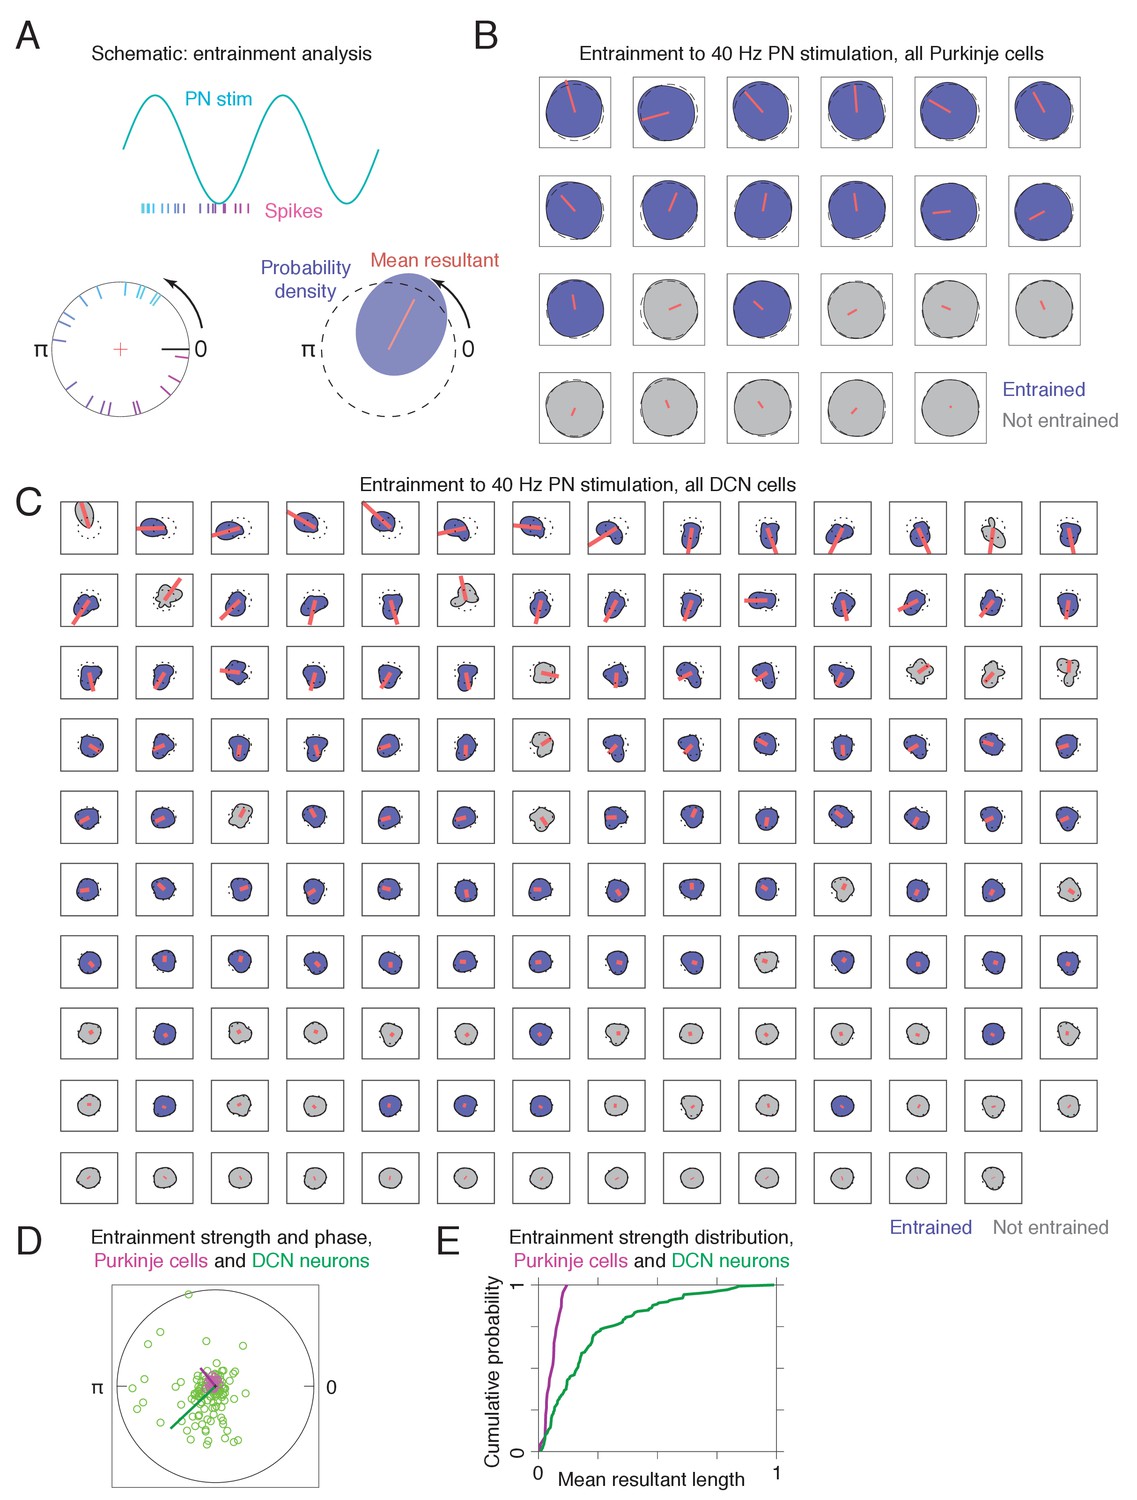
Entrainment of Purkinje cell and deep cerebellar nuclei (DCN) spikes to sinusoidal pontine nuclei (PN) stimulation.
(A) Schematic describing the analysis. For each spike, the phase of the sinusoidal stimulus at the spike time was computed. If a neuron is entrained to the stimulation, the resulting phase distribution will differ from the uniform distribution on the circle. (B) Kernel density estimates (shaded regions) and mean resultants (red lines) for Purkinje cells (n = 23). The radius is proportional to the square root of the probability density. Blue shading indicates a rejection of the null hypothesis of uniformity (Rayleigh test, q < 0.05), and gray shading indicates a failure to reject the null hypothesis. The dotted black circle indicates the uniform distribution. Neurons are sorted by mean resultant length. For visualization, the mean resultant was scaled up by a factor of 4. (C) Kernel density estimates for DCN neurons (n = 139). Plotting as in (B), except that the mean resultants are scaled by a factor of 2. (D) Comparison of entrainment strength and phase preference for Purkinje cells (magenta) and DCN neurons (green). Each point corresponds to the mean resultant for a single neuron. The black circle has a radius of unity. The green and magenta needles indicate the average direction and magnitude of Purkinje cell and DCN entrainment, respectively, and are scaled up by a factor of 6 for visualization (whereas the dots for individual neurons are not rescaled). The distribution of resultant angles differs between Purkinje and DCN neurons (p = 1e−3, Kuiper’s test), and the strength of entrainment is larger for DCN neurons (p = 4.8e−6, rank sum test). (E) Distribution of mean resultant lengths for Purkinje cells (magenta) and DCN neurons (green). A completely unsynchronized neuron (uniform phase distribution) would have a mean resultant length of 0, while a completely synchronized neuron (all spikes occur at exactly the same phase) would have a mean resultant length of 1.
Figure 3—figure supplement 3
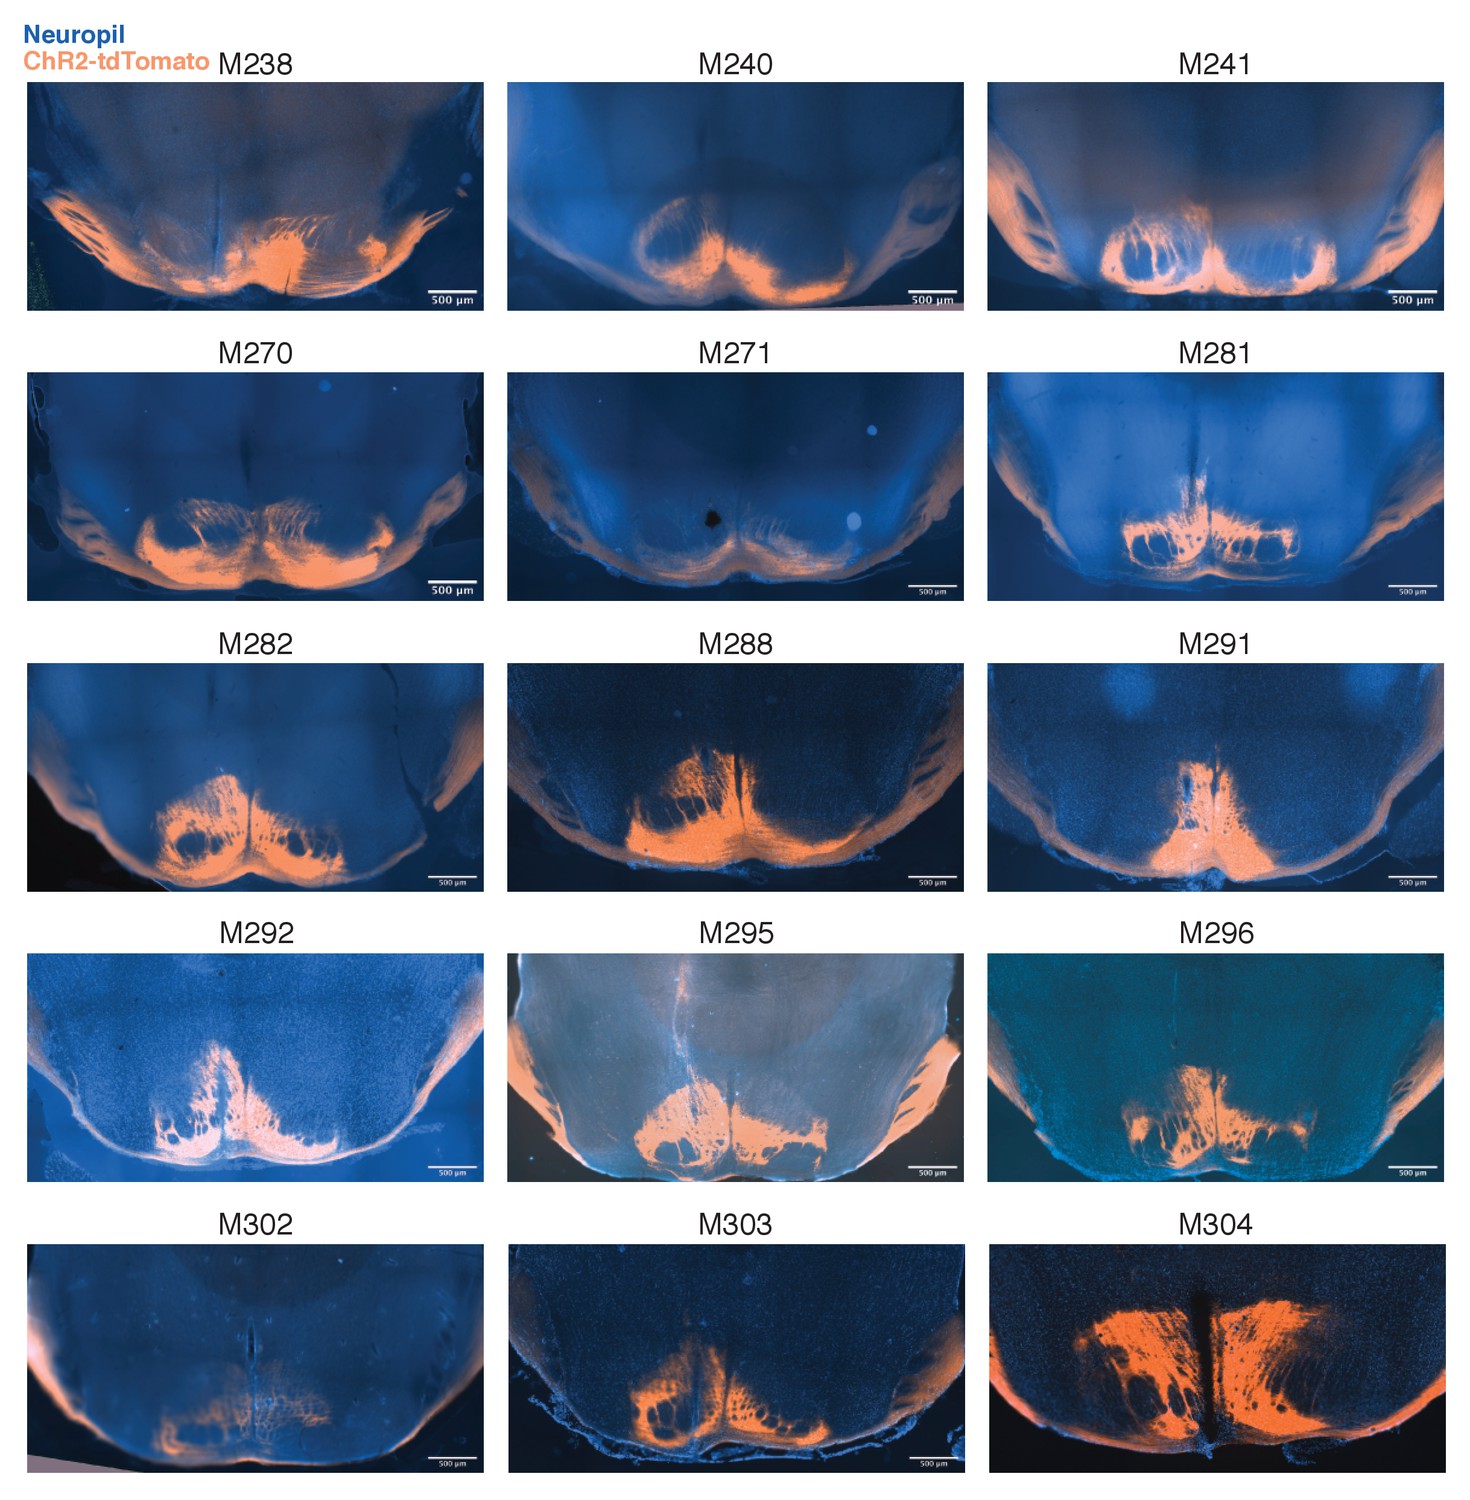
Histological sections showing the expression of ChR2 in the pontine nuclei (PN) and the position of the optical fiber.
Experimental details and behavioral results for each animal are shown in Supplementary file 1.
Figure 3—figure supplement 4
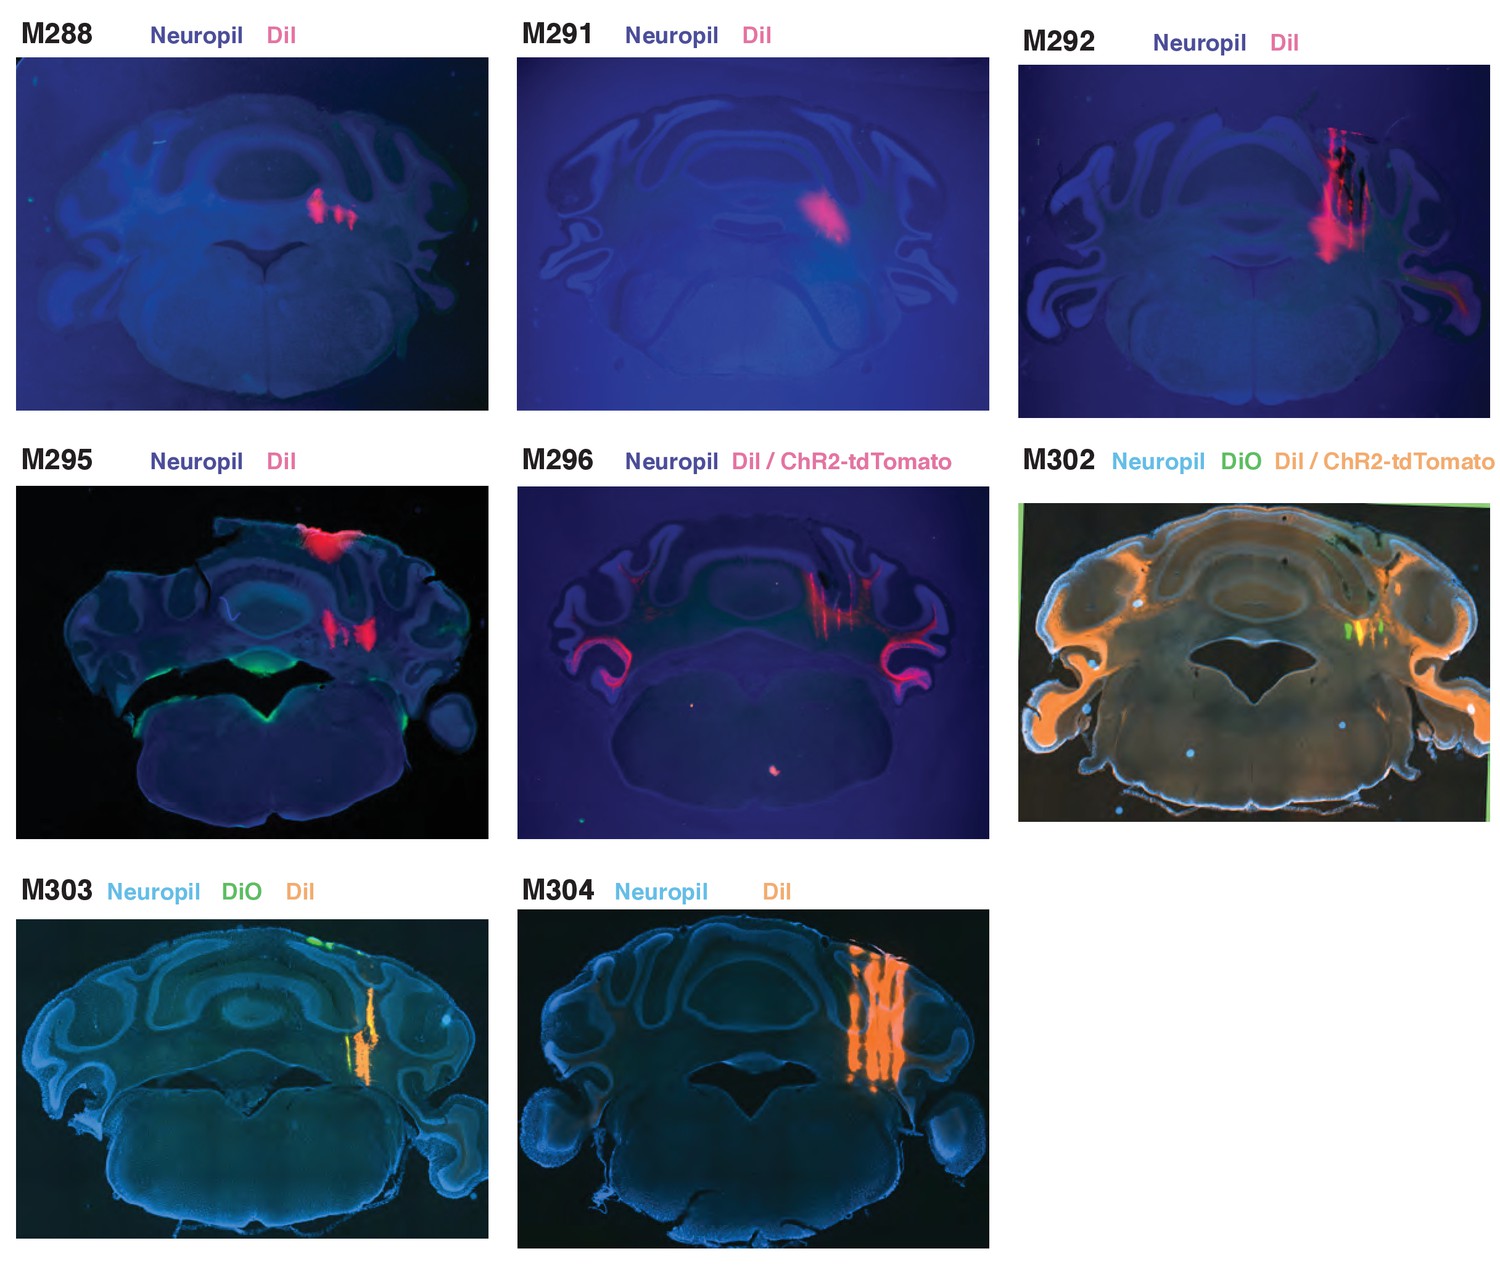
Histological sections showing targeting of four-shank silicon probes to the deep cerebellar nuclei.
Red and yellow tracks are marked by fluorescent dyes DiI and DiO, respectively. For most images, the DiI signal in the red/orange channel was much brighter than the ChR2-tdTomato signal, so ChR2 expression is not visible in these sections.
Figure 3—figure supplement 5
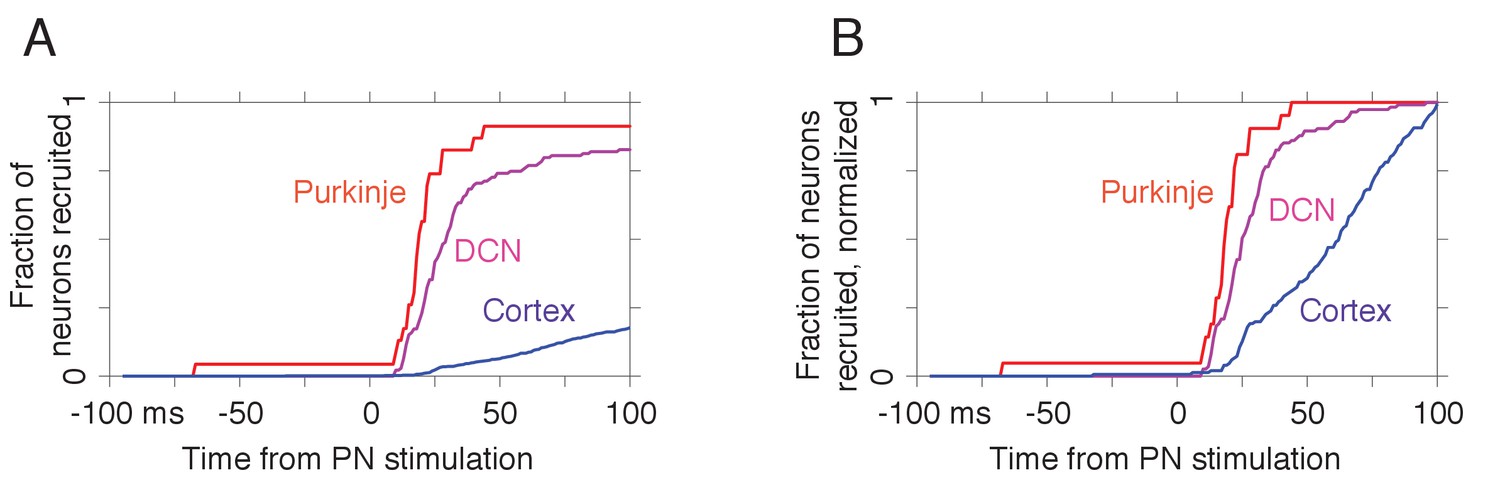
Distribution of response latencies to pontine nuclei (PN) stimulation in Purkinje cells, the deep cerebellar nuclei (DCN), and motor cortex.
(A) Fraction of Purkinje cells (n = 23), DCN neurons (n = 139), and motor cortical neurons (n = 848) recruited by each lag relative to the PN stimulation pulse. (B) Fraction of recruited neurons at each lag, normalized by the fraction of the full sample that exhibited a response. In this analysis, n = 21/23 Purkinje cells were eventually recruited by 100 ms; the corresponding numbers were n = 115/139 DCN neurons and n = 151/848 cortical neurons.
Figure 4
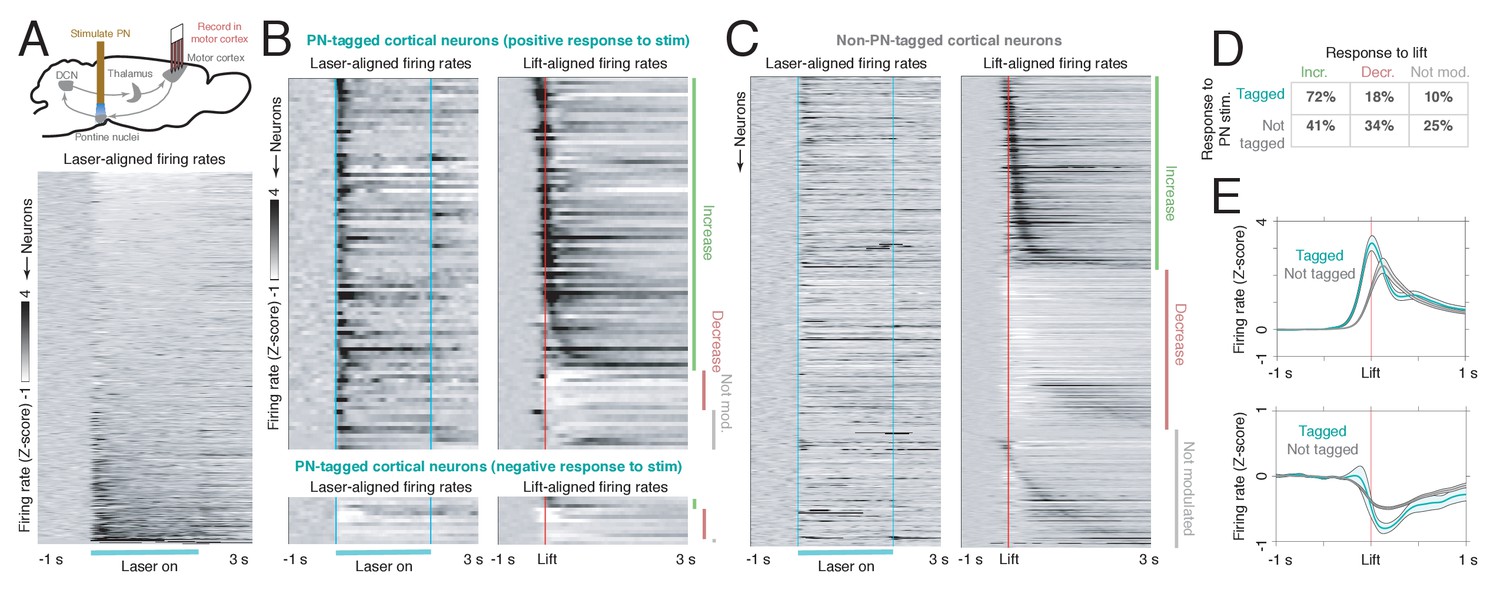
Motor cortical neurons receiving feedback from the ponto-cerebellar system have distinct functional properties during reaching.
(A) Upper: experimental schematic. Mice expressing ChR2 in the pontine nuclei (PN) were implanted with a tapered optical fiber. A 40 Hz, 2 s laser stimulus was delivered to PN neurons to identify motor cortical cells receiving PN feedback. Then, the activity of PN-tagged and non-PN-tagged neurons was compared during normal reaching. Lower: laser-aligned firing rate z-scores for all cortical neurons (n = 848), sorted by response magnitude. (B) Laser-aligned and movement-aligned neural activity for PN-tagged cortical neurons (n = 107/848, including neurons with laser-aligned increases, n = 94, and decreases, n = 13); n = 26 sessions, n = 8 mice. This includes neurons with both laser-aligned firing rate increases and decreases. Upper panel: neurons with laser-aligned firing rate increases (n = 94). Lower panel: neurons with laser-aligned firing rate decreases (n = 13). Many neurons had increased activity around lift, and a few had decreased activity. (C) Laser-aligned and movement-aligned neural activity for non-PN-tagged cortical neurons (n = 741). Approximately equal numbers of neurons had firing rate increases and decreases around lift. (D) Table showing the percentages of tagged (laser-aligned increases and decreases) and non-tagged neurons with increases, decreases, or no change in activity around lift. (E) Upper: average firing rate z-scores for tagged and non-tagged neurons with firing rate increases around lift. The average activity for the tagged group increased earlier than the activity for the non-tagged group. Lower: average firing rate z-scores for tagged and non-tagged neurons with firing rate decreases around lift.
Figure 5
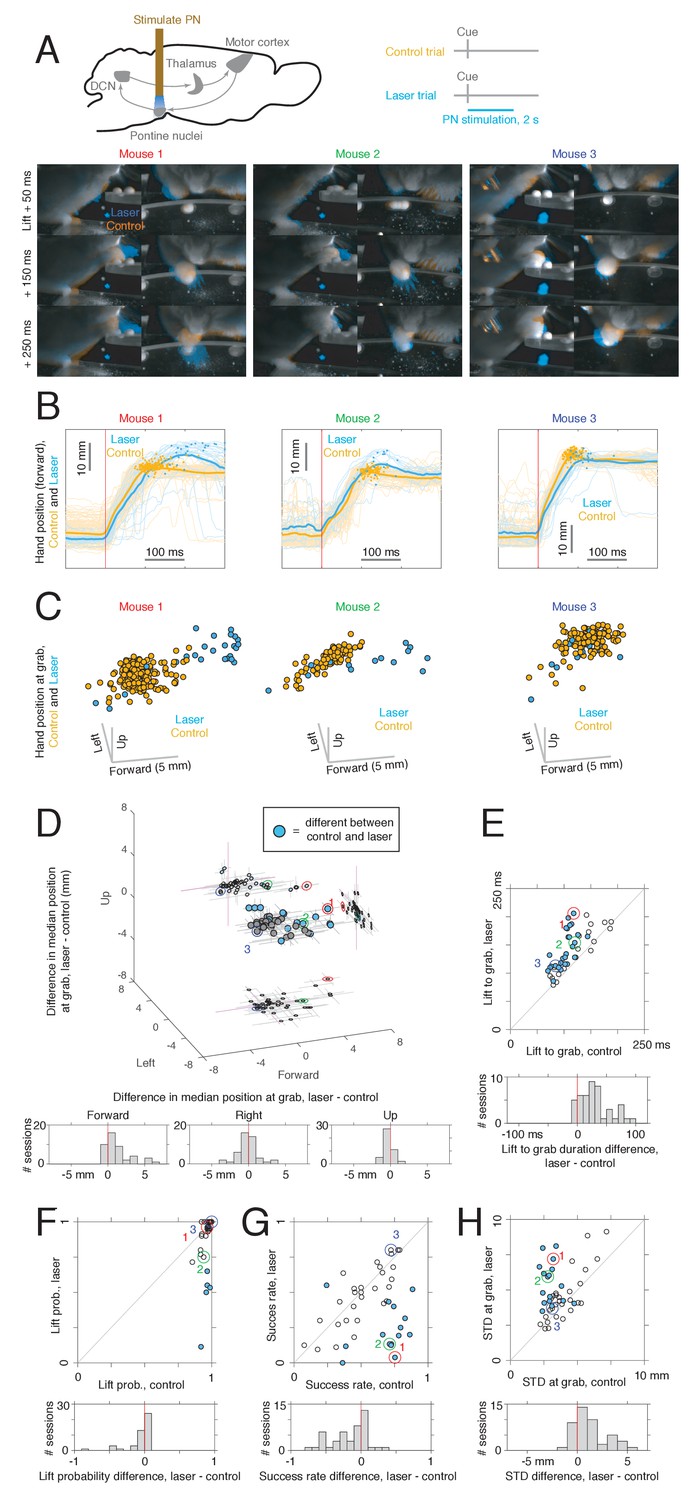
Effects of pontine nuclei (PN) stimulation on reaching.
(A) Upper: experimental schematic. Lower: video frames for control and PN laser stimulation trials for sessions from three mice. Frames from the front and side cameras are shown at offsets of 50, 150, and 250 ms from lift, averaged across trials (see Materials and methods). Orange indicates higher image intensity on control trials, and blue indicates higher intensity on laser trials. For the first two mice (left panel), this visualization shows that the animals reach farther forward on laser trials than control trials. Panels labeled 1, 2, and 3 correspond to M270 (8-15-18), M282 (12-5-18), and M240 (9-22-17), respectively. (B) Hand trajectories for the three example mice in (A). Dots indicate the position of the hand at grab. (C) Three-dimensional position of the hand at the time of grab on control and laser trials for each of the three mice in (A–B). Each point corresponds to a single trial. (D) Upper: difference in median hand position at grab between laser and control trials. Each point corresponds to a single experimental session (n = 45). Filled blue dots correspond to sessions in which a difference between control and laser was found in at least one direction (two-sided rank sum test for each direction, q < 0.05). Lines indicate bootstrapped 95% confidence intervals. Lower: histogram of differences in hand position in each spatial dimension between laser and control conditions. (E) Upper: median delay from lift to grab, laser vs. control; filled dots indicate sessions where a difference between laser and control was detected (two-sided rank sum test, q < 0.05). Lower: histogram of difference between lift-to-grab duration on laser and control trials. (F) Upper: probability of initiating a reach, laser vs. control; filled dots represent sessions where a difference between control and laser was detected (chi-square test, q < 0.05). Lower: histogram of difference in reach probability on laser and control trials. (G) Upper: success rate on first reach attempt for laser vs. control; filled dots indicate a difference between laser and control (chi-square test, q < 0.05). Lower: histogram of differences between success rate on laser and control trials. (H) Upper: standard deviation (summed across forward, left, and up directions) in the position of the hand at grab for laser vs. control trials. Each point corresponds to one experimental session, and filled dots represent sessions where a difference between control and laser was detected in at least one direction (two-sample F-test for equal variances, two-sided, q < 0.05). Lower: histogram of differences in grab position standard deviation between laser and control trials. Note: neural activity in the motor cortex, cerebellar nuclei, or both was also recorded in these sessions.
Figure 6 with 1 supplement
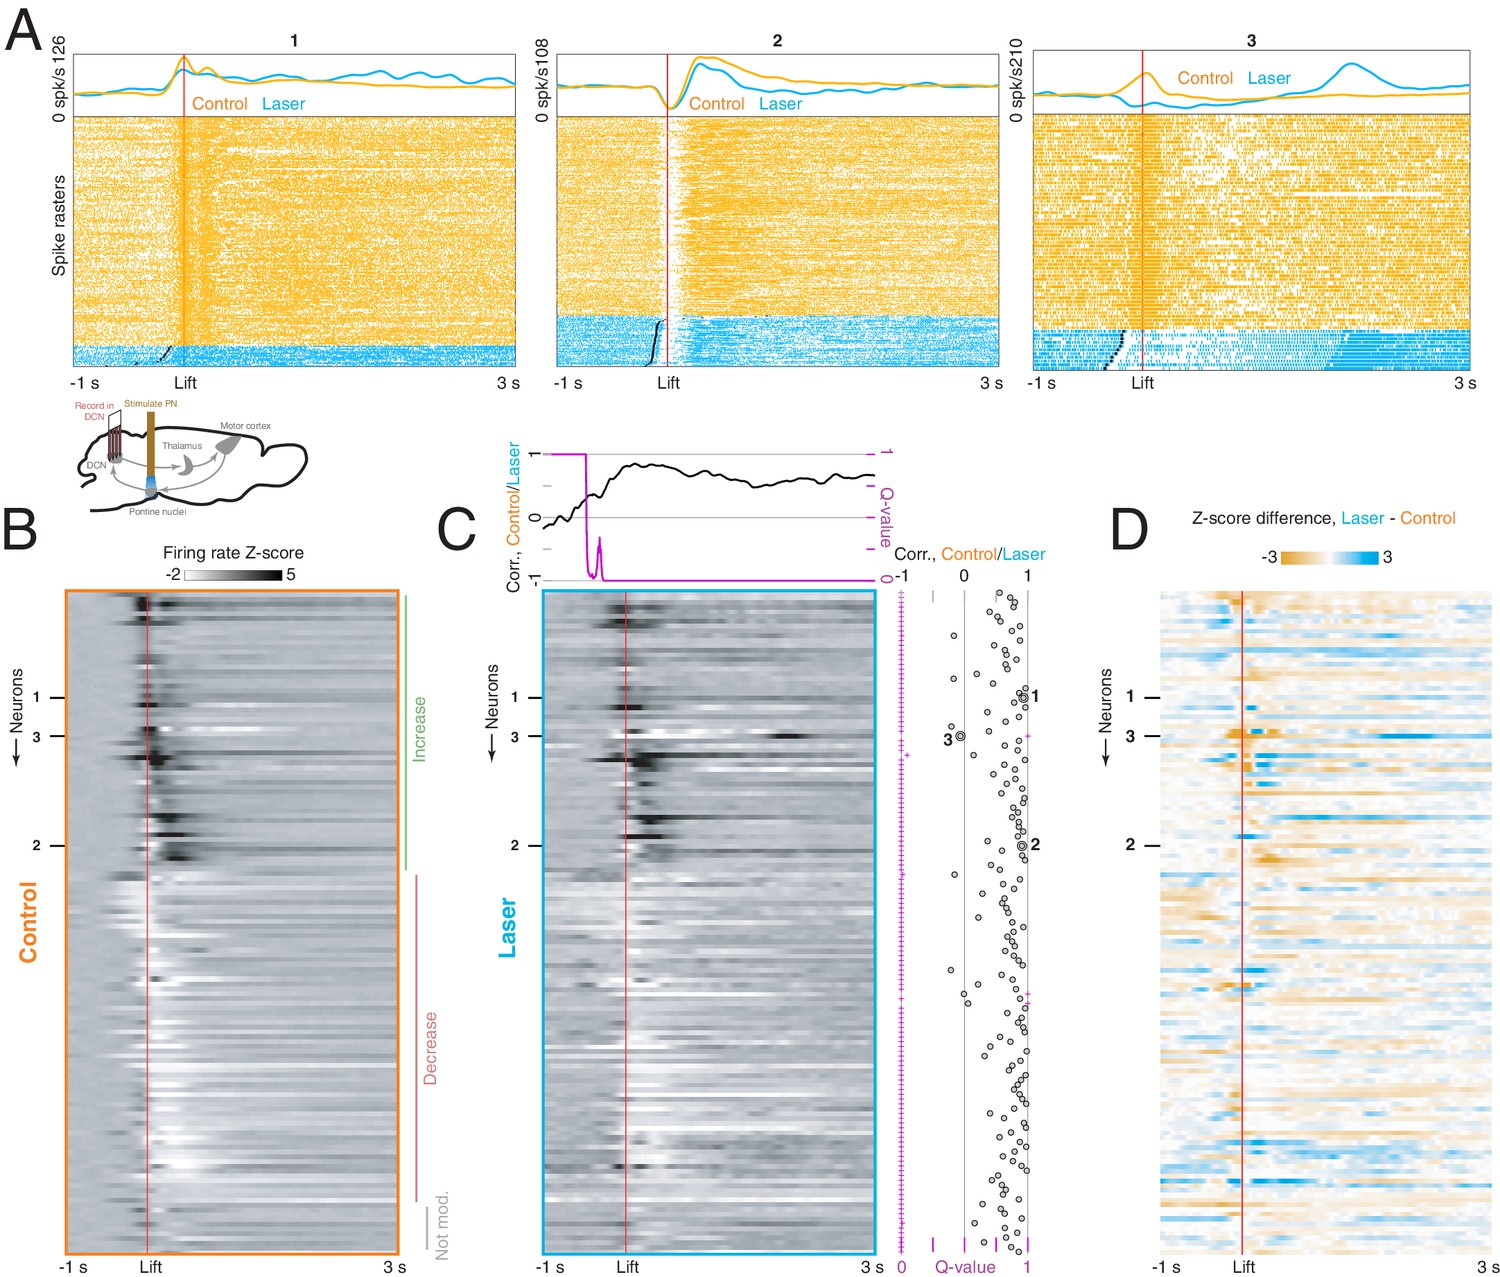
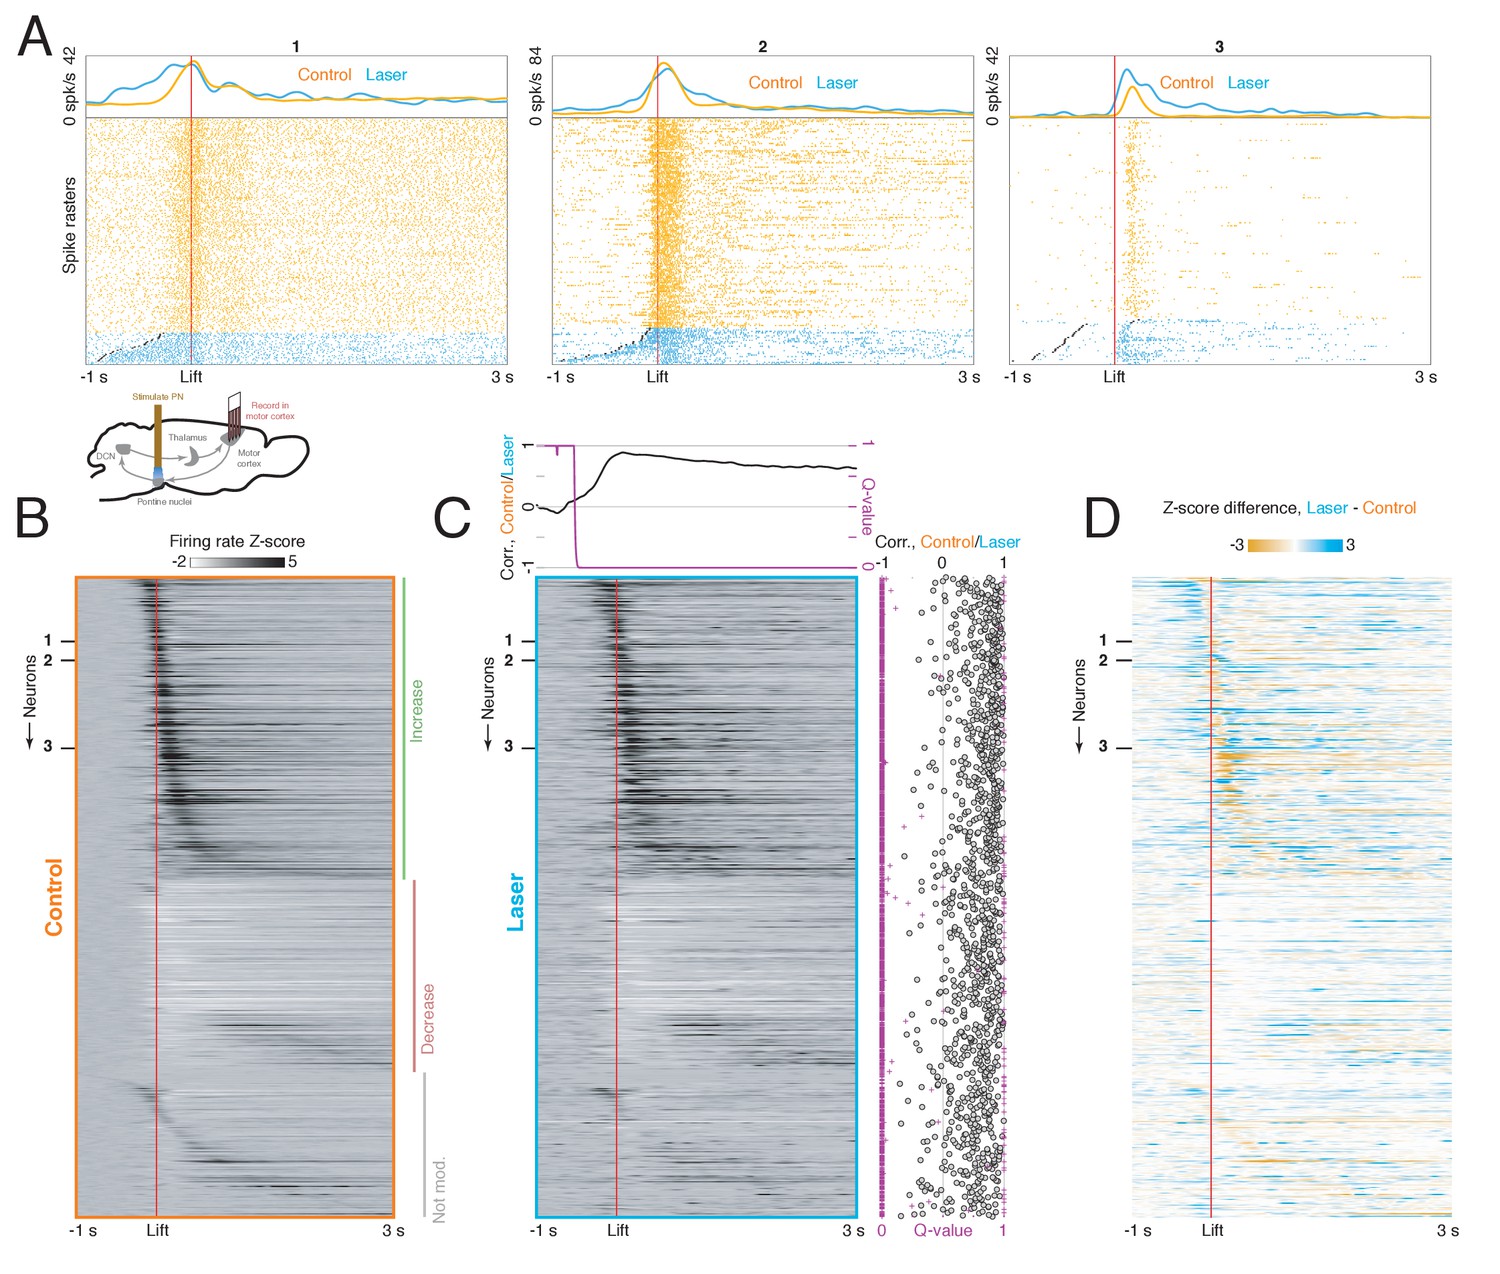
Effect of pontine nuclei (PN) stimulation on neural activity in the deep cerebellar nuclei (DCN) during reaching.
(A) Lower inset: experimental schematic. Animals performed the reaching task as neural activity in the DCN was recorded. On some trials, PN neurons were activated with a 40 Hz, 2 s laser stimulus. Top panels: lift-aligned spike times and average firing rates on control (orange) and laser trials (blue) for three DCN neurons. Black dots indicate the laser onset. (B) Heatmap displaying lift-aligned average firing rate z-scores on control trials for all DCN neurons (n = 139 neurons, n = 8 mice). (C) Heatmap displaying lift-aligned average firing rate z-scores for laser trials. Upper inset: the black line shows the rank correlation (Spearman’s ρ) between firing rates of the 139 neurons on control and laser trials at each time point. The magenta inset shows the q-value against the null hypothesis that the correlation is zero. Right inset: black circles show the rank correlation (Spearman’s ρ) between the control and laser firing rates over time for each neuron. Magenta crosses show the q-value against the null hypothesis that the correlation of control and laser values over time is zero. (D) Difference between lift-aligned z-scores for control and laser trials. Orange regions indicate neurons and time points in which the firing rate is higher on control trials, and blue regions indicate points in which the firing rate is higher on laser trials.
Figure 6—figure supplement 1
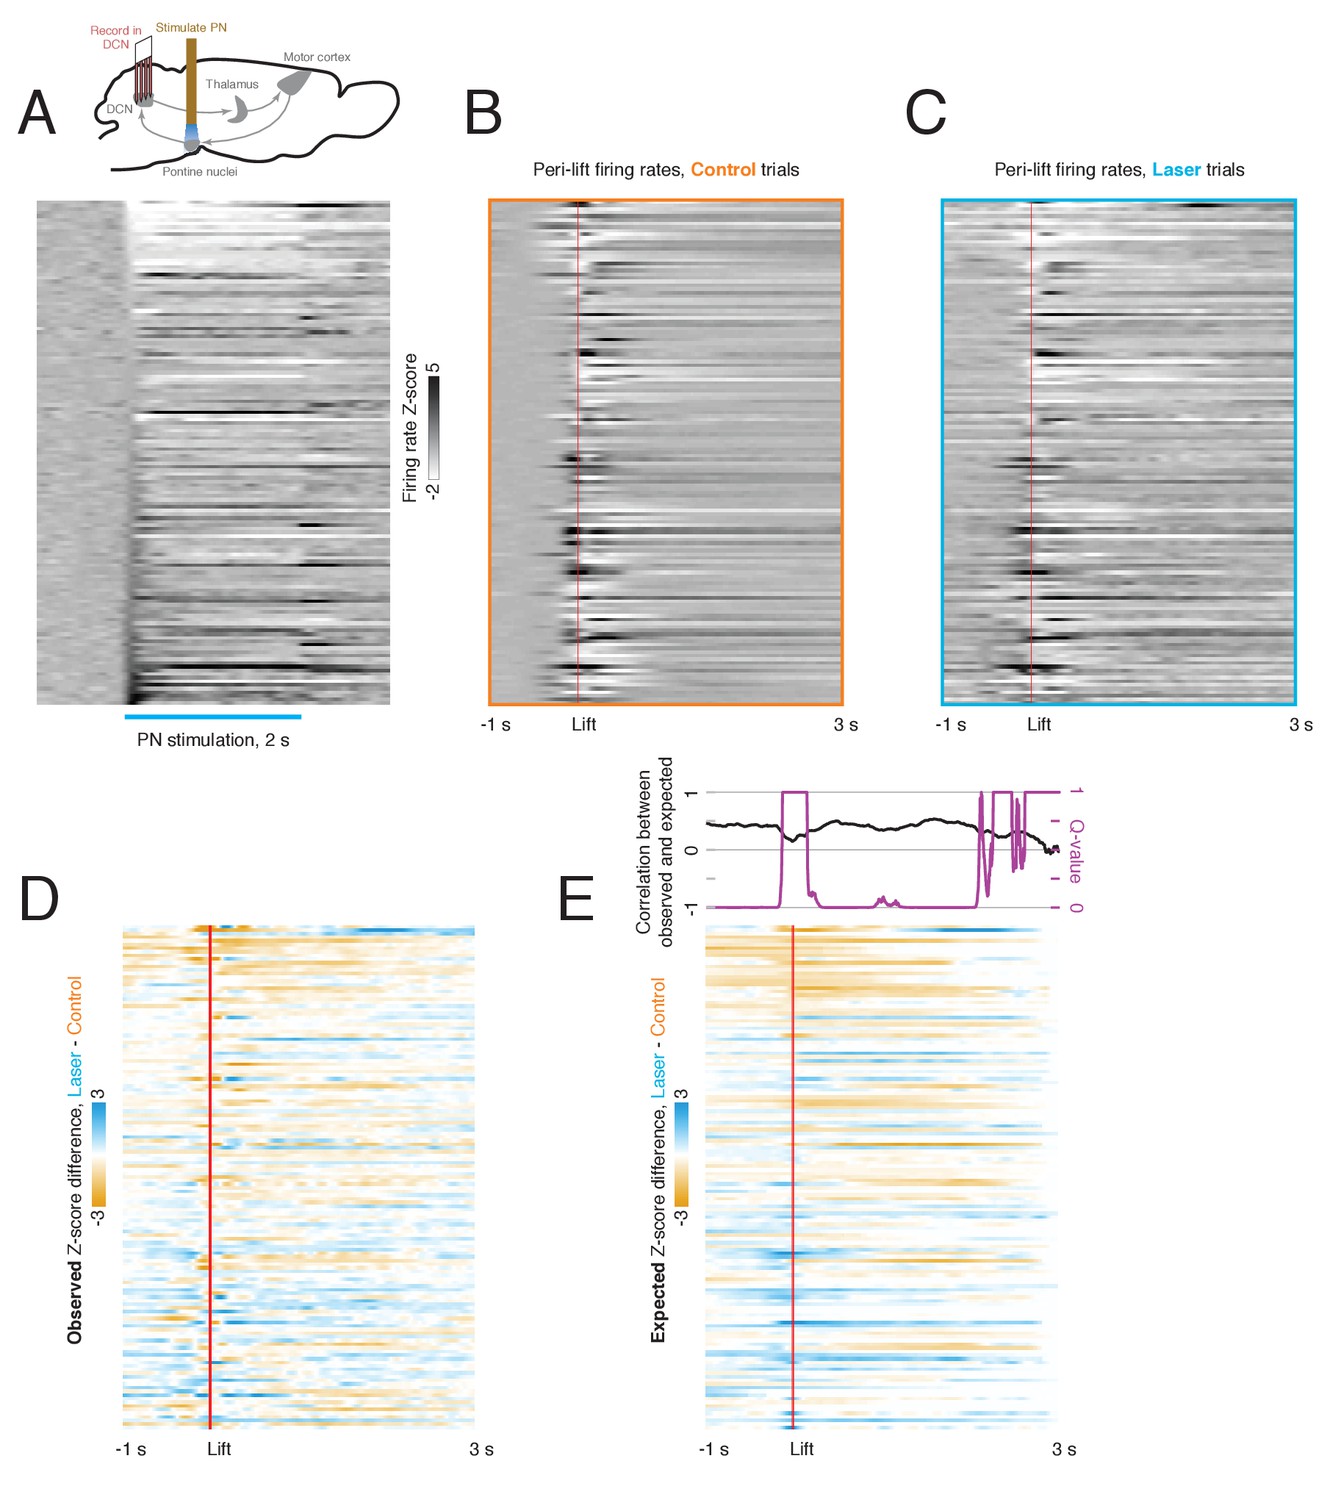
Relationship between laser-aligned and lift-aligned activity in the deep cerebellar nuclei (DCN).
(A) Upper: experimental schematic (see also Figure 6). Lower: peri-laser firing rate z-scores for DCN neurons (n = 139). Only trials in which a laser stimulus but no cue was delivered were included. Data are sorted by the average z-scored firing rate within the first 100 ms of laser onset. (B) Peri-lift firing rates on control trials for the same neurons as in (A). (C) Peri-lift firing rates on laser + cue trials. (D) Effect of pontine nuclei (PN) stimulation on neural activity in the DCN during behavior. The heatmap shows the difference in z-scored peri-lift firing rates on laser and control trials; it was obtained by subtracting the map in (A) from the map in (B). Blue indicates higher peri-lift activity on laser trials, and orange indicates higher firing rates on control trials. (E) Predicted effect of PN stimulation on neural activity during behavior based on laser-only response. For each neuron, the neural activity aligned to laser stimulation in the absence of a cue was offset at the lift-to-laser offsets in the corresponding session and averaged over trials. The resulting heatmap in the lower panel shows the lift-aligned firing rate changes expected based on the laser-only responses. The upper panel shows the correlation (Spearman’s ρ) between the expected and observed effect of the laser on the neural population at each time point (black), along with the q-value for the test against the null hypothesis that this correlation is zero.
Figure 7 with 2 supplements
Effect of pontine nuclei (PN) stimulation on neural activity in motor cortex during reaching.
(A) Lower inset: experimental schematic. Animals performed the reaching task as neural activity in motor cortex was recorded. On some trials, PN neurons were activated with a 40 Hz, 2 s laser stimulus. Top panels: lift-aligned spike times and average firing rates on control and laser trials for three motor cortex neurons. Black dots indicate the laser onset. (B) Heatmap displaying lift-aligned average firing rate z-scores on control trials for all motor cortex neurons (n = 1157 neurons, n = 10 mice). (C) Heatmap displaying lift-aligned average firing rate z-scores for laser trials. Upper inset: the black line shows the rank correlation (Spearman’s ρ) between firing rates of the 1157 neurons on control and laser trials at each time point. The magenta inset shows the q-value against the null hypothesis that the correlation is zero. Right inset: black circles show the rank correlation (Spearman’s ρ) between the control and laser firing rates over time for each neuron. Magenta crosses show the q-value against the null hypothesis that the correlation of control and laser values over time is zero. (D) Difference between lift-aligned z-scores for control and laser trials. Orange regions indicate neurons and time points in which the firing rate is higher on control trials, and blue regions indicate points in which the firing rate is higher on laser trials.
Figure 7—figure supplement 1
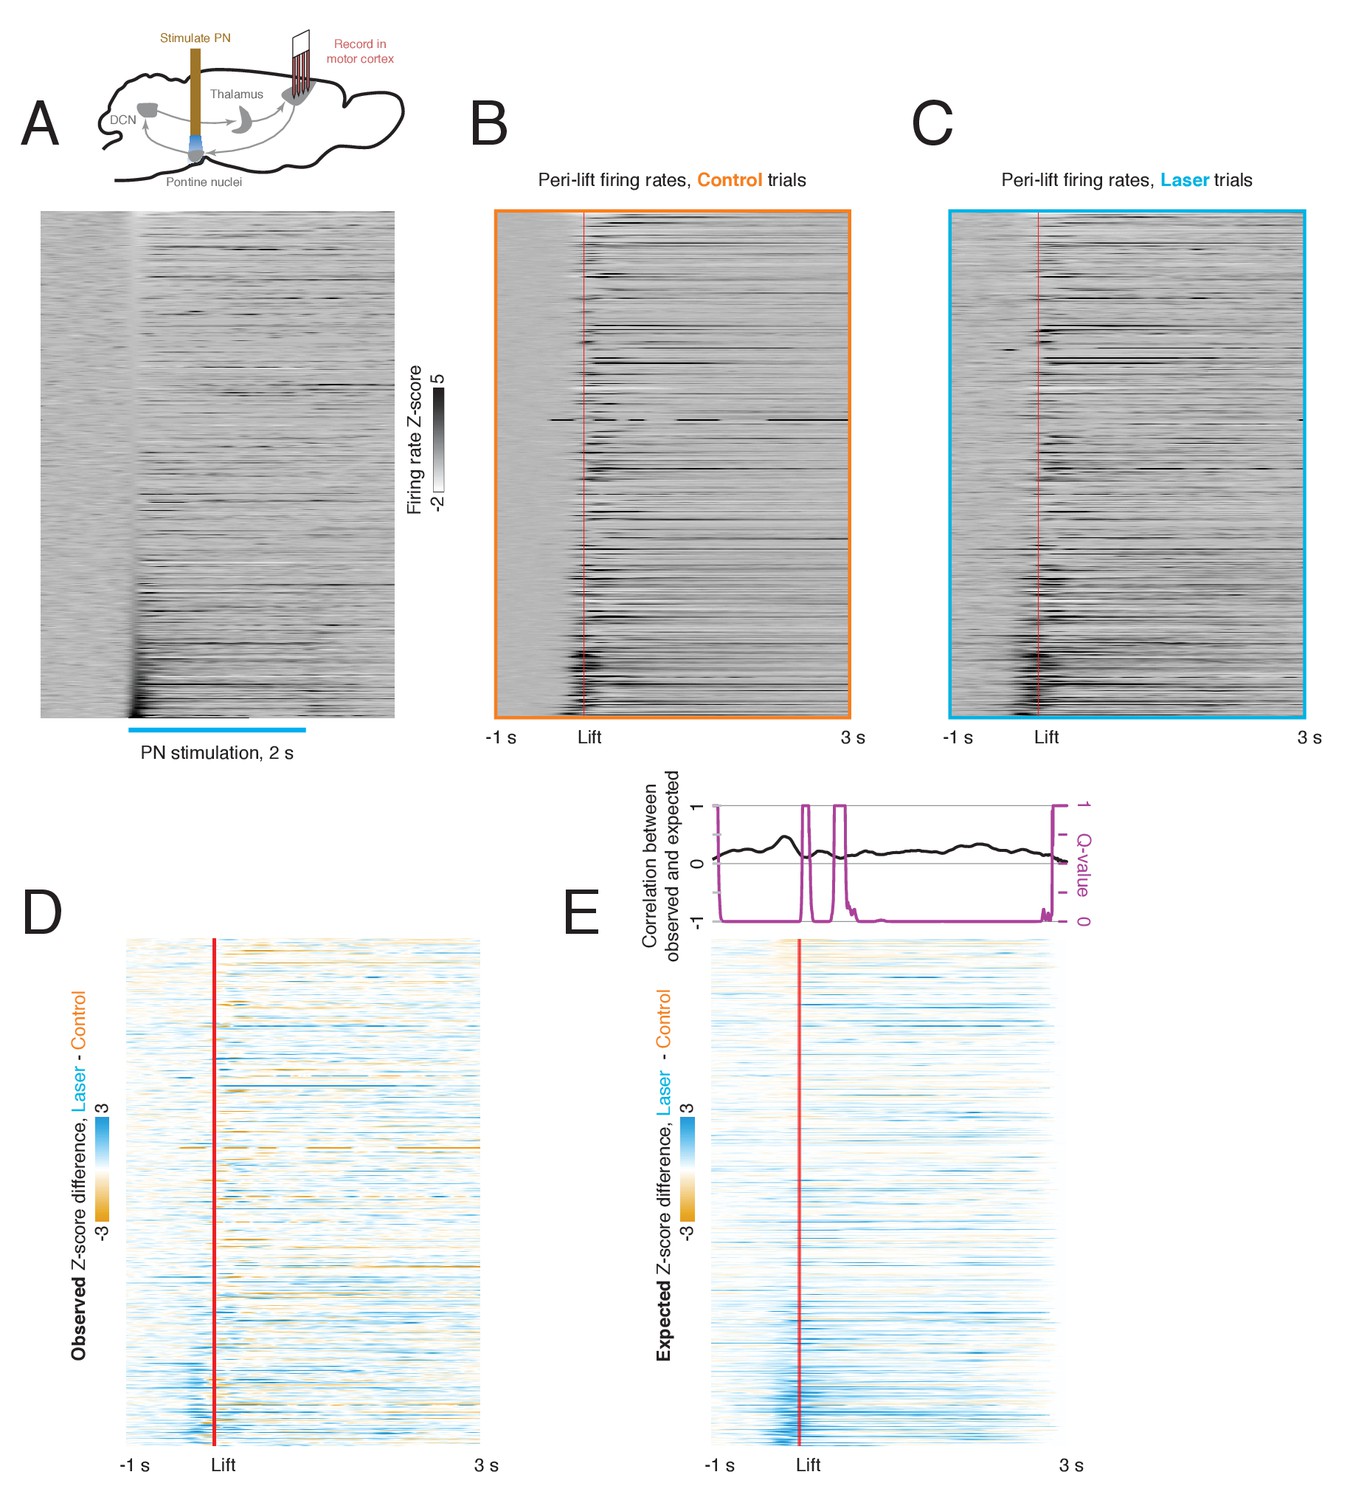
Relationship between laser-aligned and lift-aligned activity in motor cortex.
(A) Upper: experimental schematic (see also Figure 7). Lower: peri-laser firing rate z-scores for cortical neurons (n = 839). Only trials in which a laser stimulus but no cue was delivered were included. Data are sorted by the average z-scored firing rate within the first 100 ms of laser onset. (B) Peri-lift firing rates on control trials for the same neurons as in (A). (C) Peri-lift firing rates on laser + cue trials. (D) Effect of pontine nuclei (PN) stimulation on neural activity in the motor cortex during behavior. The heatmap shows the difference in z-scored peri-lift firing rates on laser and control trials; it was obtained by subtracting the map in (A) from the map in (B). Blue indicates higher peri-lift activity on laser trials, and orange indicates higher firing rates on control trials. (E) Predicted effect of PN stimulation on neural activity during behavior based on laser-only response. For each neuron, the neural activity aligned to laser stimulation in the absence of a cue was offset at the lift-to-laser offsets in the corresponding session and averaged over trials. The resulting heatmap in the lower panel shows the lift-aligned firing rate changes expected based on the laser-only responses. The upper panel shows the correlation (Spearman’s ρ) between the expected and observed effect of the laser on the neural population at each time point (black), along with the q-value for the test against the null hypothesis that this correlation is zero.
Figure 7—figure supplement 2
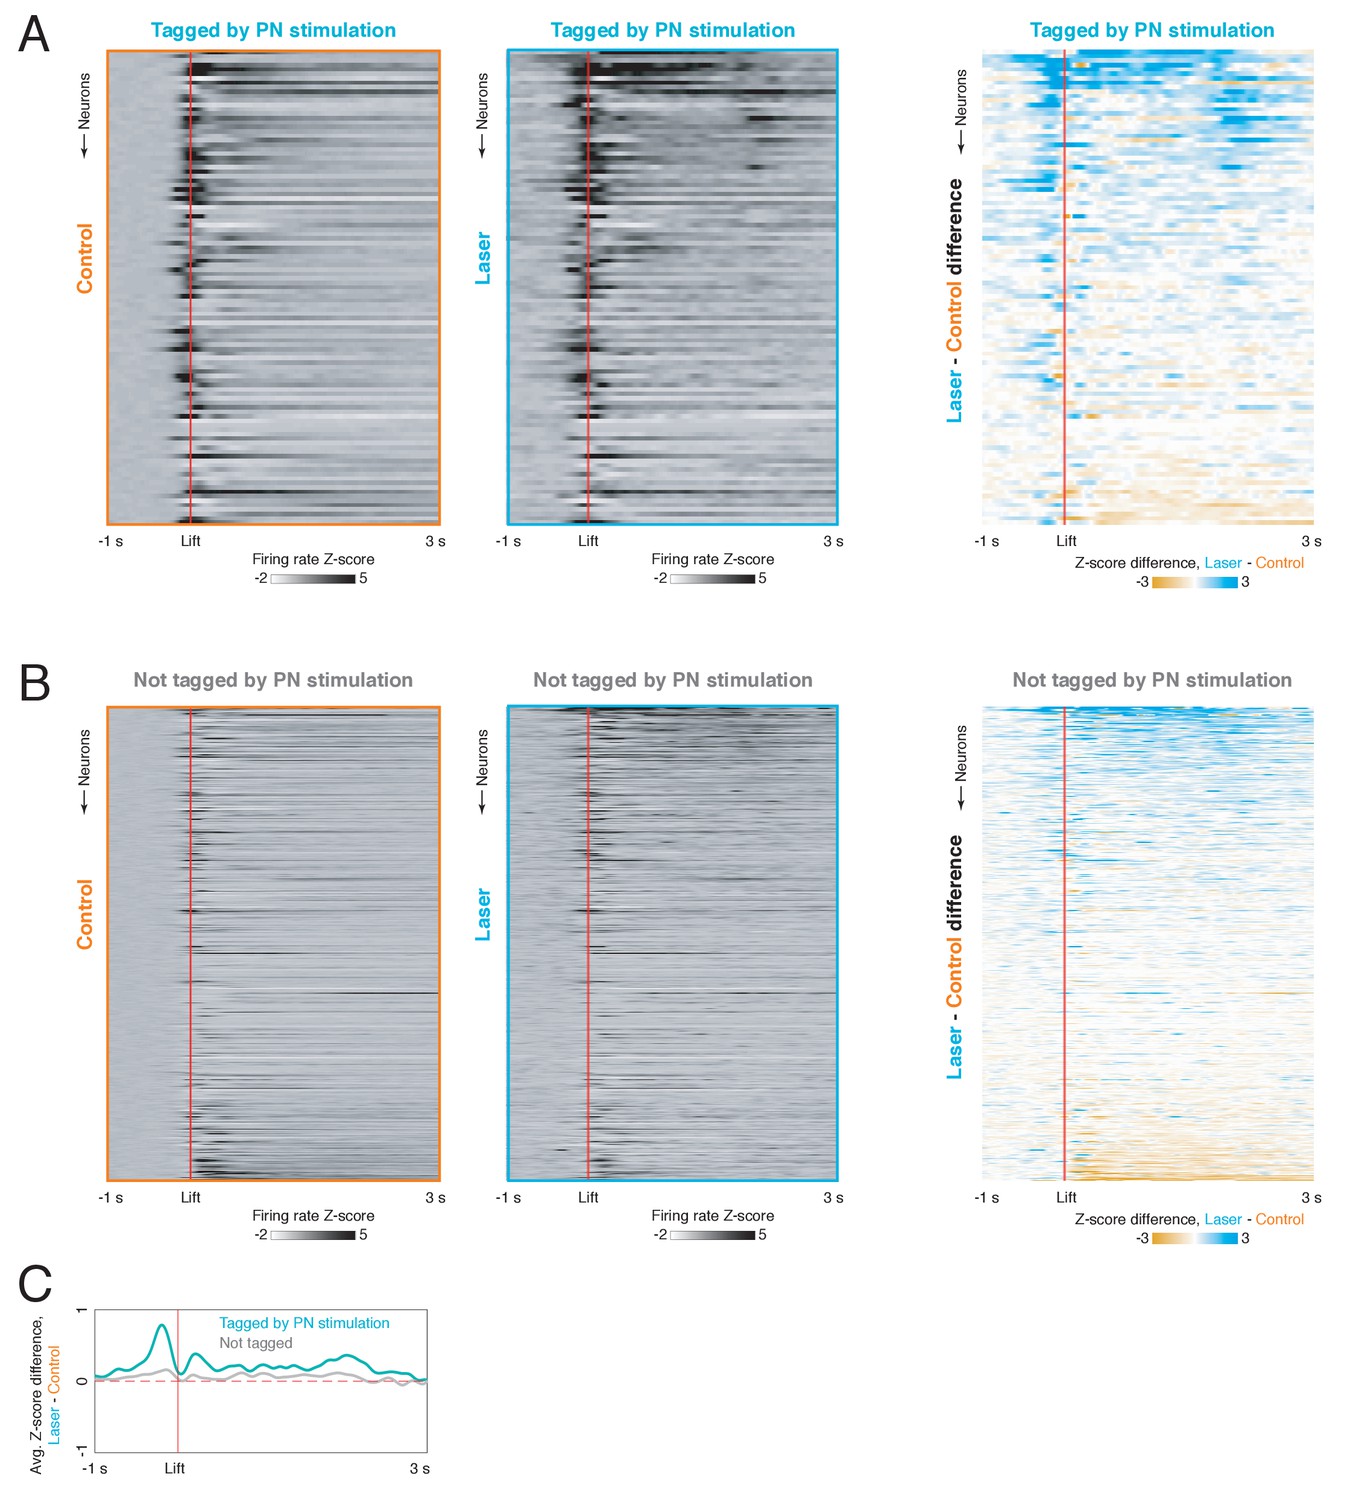
Difference in lift-aligned cortical activity on pontine nuclei (PN) stimulation and control trials for PN-tagged and non-tagged neurons.
(A) Left: firing rate z-scores aligned to movement onset for neurons tagged by PN stimulation (n = 107) on control trials. Center: lift-aligned firing rate z-scores for the same neurons on laser trials. Right: firing rate z-score differences for cortical neurons in which a response was evoked by PN stimulation. In all three panels, neurons are sorted by the average difference between control and laser conditions. (B) Firing rate z-scores aligned to movement onset on control trials (left), laser trials (center), and the difference between control and laser trials (right) for non-tagged cortical neurons (n = 741). Neurons are sorted by the average laser – control difference, as in (A). (C) Mean lift-aligned firing rate z-score differences for PN-tagged neurons (blue) and non-tagged neurons (gray).
Figure 8
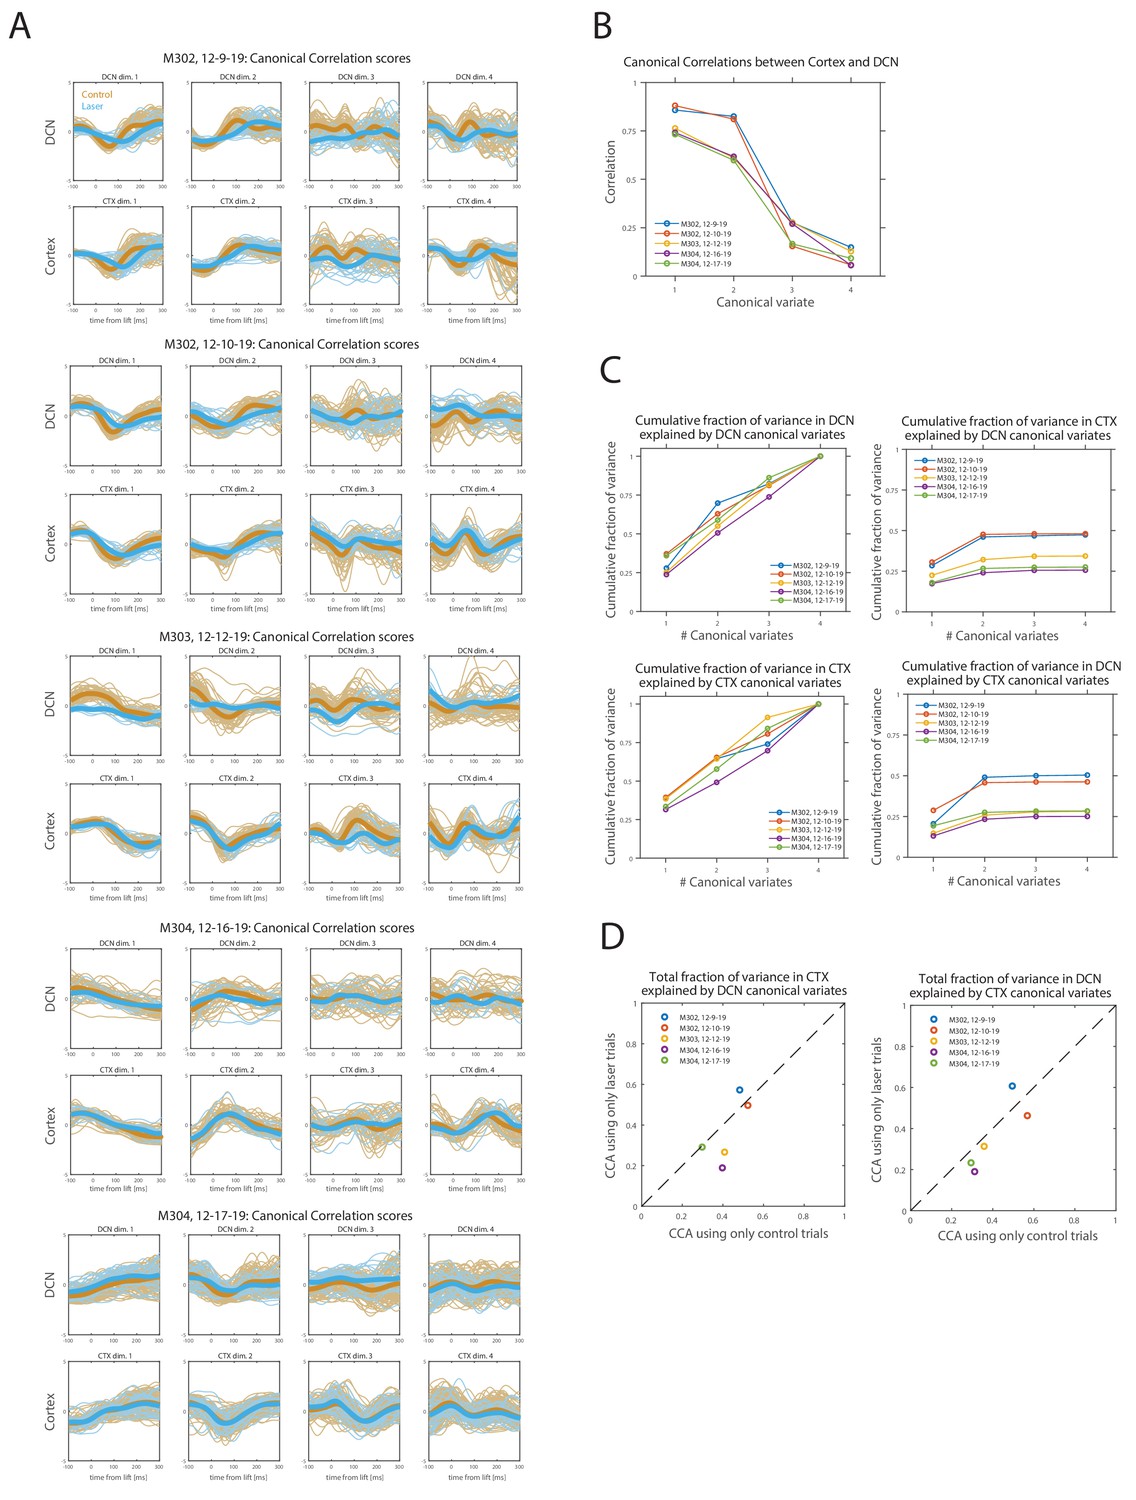
Canonical correlation analysis (CCA) of simultaneously recorded population activity (first four principal components) in motor cortex (CTX) and deep cerebellar nuclei (DCN).
(A) Lift-aligned canonical correlation scores for CTX and DCN for each session (n = 5; see Materials and methods). Each column is a pair of canonical variates, ordered by canonical correlation values. Control trials are orange and pontine nuclei (PN) stimulation (laser) trials are blue, with thicker lines representing the means. Trials of both types were used in CCA. (B) Canonical correlations for the four pairs of canonical variates, in each of the sessions in (A). (C) Cumulative fraction of (standardized) sample variance in the population activity recorded in CTX or DCN that is explained by an increasing number of canonical variates in the same or opposite region. The total fraction of variance explained by the complete set of canonical variates (#canonical variates = 4) is one by construction within the same region but depends on canonical correlations for the opposite region. (D) Comparison of the total fraction of variance explained in CTX (left) or DCN (right) by the complete set of canonical variates of the opposite region, between two alternative CCAs performed using either only laser trials or only control trials (matching the number of laser trials, see Materials and methods).
Figure 9 with 1 supplement
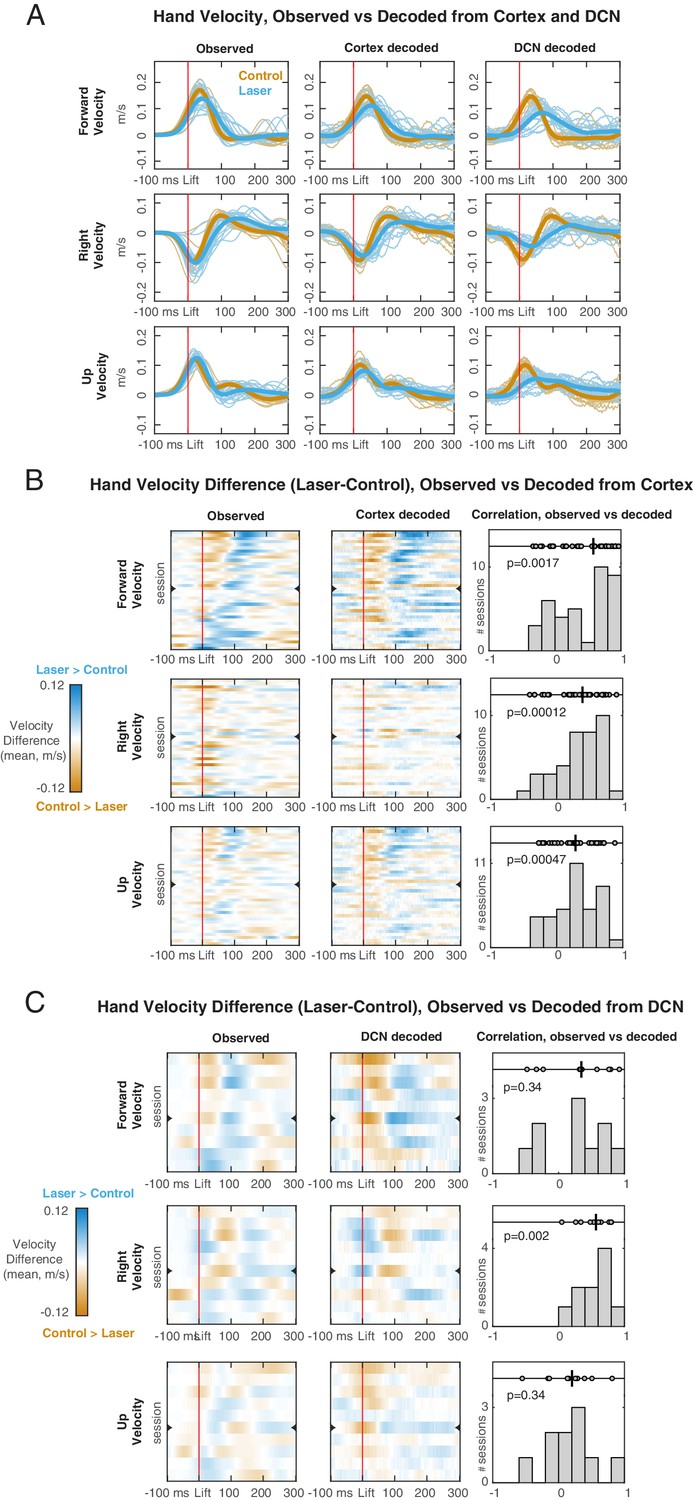
Hand velocity decoding from neural activity in motor cortex and deep cerebellar nuclei (DCN).
(A) Observed (left column) vs. decoded (center cortex, right DCN) velocity trajectories in each direction for a session with simultaneous recordings. Blue lines represent all trials with pontine nuclei (PN) perturbation (‘laser’) and their mean (thicker line). Orange lines represent all ‘test control’ trials, not used for training the decoder, and their mean. (B) Observed vs. decoded mean differences in velocity between laser and control test trials, for each of the sessions with cortical recordings (n = 38). In the heatmaps (left observed, center decoded) rows are sessions, ordered based on the observed mean velocity difference in the forward direction in the 100 ms following lift. Orange regions indicate time points in which the velocity is higher on control trials, and blue regions indicate points in which the velocity is higher on laser trials. The row denoted with a mark is the session shown in (A). Right panels show the distribution of rank correlations (Spearman’s ρ) between the observed and decoded differences in velocity over time (i.e., between corresponding rows of the heatmaps). Within each panel, individual correlations and their median (black line) are shown on top, with p-value of the two-sided sign rank test against the null hypothesis of zero median, and histogram of correlation values across sessions is shown at the bottom. (C) Same as (B), for each of the sessions with DCN recordings (n=10).
Figure 9—figure supplement 1
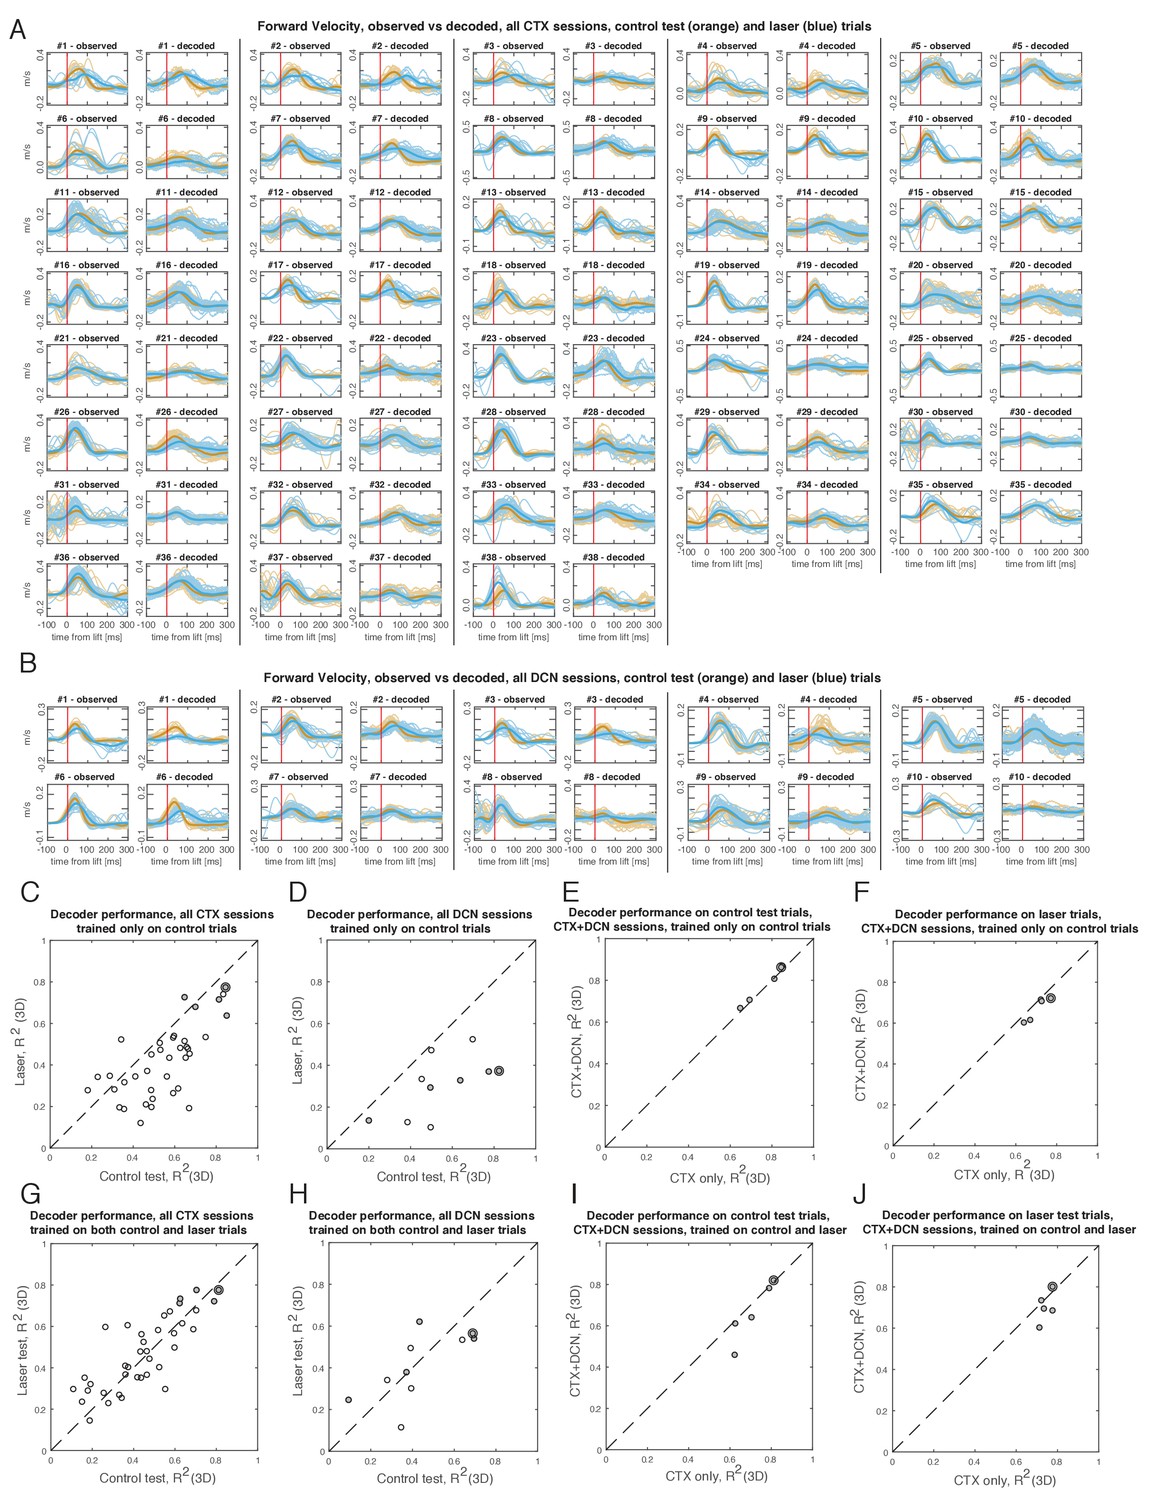
Hand velocity decoding from neural activity in motor cortex (CTX) and deep cerebellar nuclei (DCN), for all sessions with recordings in at least one of the regions (n=38 CTX sessions, n=10 DCN sessions; n=5 sessions had simultaneous recordings in both regions).
(A) Observed vs. decoded velocity trajectories in the forward direction, for all sessions with cortical recordings. Blue lines represent all trials with pontine nuclei (PN) perturbation (‘laser’ trials) and their mean (thicker line). Orange lines represent all ‘test control’ trials, not used for training the decoder, and their mean. Sessions are ordered as in Figure 9B. (B) Same as (A), but for all sessions with DCN recordings. Sessions are ordered as in Figure 9C. (C) Performance of the decoders – which are trained only on a subset of control trials – in control test vs. laser trials, for all sessions with cortical recordings. Filled circles represent sessions with simultaneous cortical and DCN recordings, and outer circle denotes session in Figure 9A. Performance metric is the coefficient of determination (R²) between decoded and observed hand velocities, after pooling all directions together. The decoded velocities better reproduced the observed velocities in control than laser trials (mean R2 for control test trials [0.55] > mean R2 for laser trials [0.42], p=0.002; two-tailed Welch t-test). (D) Same as (C), but for the DCN sessions. The decoded velocities better reproduced the observed velocities in control than laser trials (mean R2 for control test trials [0.54] > mean R2 for laser trials [0.30], p=0.005; two-tailed Welch t-test). (E) Performance of regular cortical decoders (‘CTX only’) vs. ‘augmented’ cortical decoders also using DCN activity (‘CTX+DCN’, see Materials and methods), in the sessions with simultaneous recordings (n=5), for control test trials. (F) Same as (E), but for laser trials. (G) Performance of decoders trained on a balanced subset of control and laser trials (see Materials and methods), for all sessions with cortical recordings. There were no significant differences in the performance of these decoders in control test trials (mean R2 = 0.45) compared with laser test trials (mean R2 = 0.47). (H) Same as (G) but for all sessions with DCN recordings. There were no significant differences between decoding performance in control test trials (mean R2 = 0.43) and in laser test trials (mean R2 = 0.41). (I) Performance of regular cortical decoders vs. ‘augmented’ cortical decoders for control test trials (cf. panel (E)), for decoders trained on a balanced subset of control and laser trials. (J) Same as (I), but for laser test trials (cf. panel (F)).
Videos
Video 1
Effects of pontine nuclei (PN) stimulation in an example mouse (animal 1 in Figure 5; M270, 8-15-18).
Raw video from all trials in the session are overlaid, with control trials in orange and PN stimulation trials in blue. Data are aligned to movement onset (see Materials and methods).
Video 2
Effects of pontine nuclei (PN) stimulation in an animal in which reach initiation was robustly blocked (M295, 9-9-19).
Raw video from all trials in the session are overlaid, with control trials in orange and PN stimulation trials in blue. Data are aligned to the start of the trial.
Video 3
Decoded and observed hand velocities for an example session (M302, 12-9-19).
Right: average hand velocity observed within −100 to 300 ms of movement onset. Orange corresponds to control trials, and blue to PN stimulation trials. Left and center: decoded hand velocity from motor cortex and DCN, respectively, in the same session.
Additional files
-
Supplementary file 1
Table of behavioral effects of optogenetic pontine nuclei (PN) stimulation for each experimental session.
- https://cdn.elifesciences.org/articles/65906/elife-65906-supp1-v1.numbers.zip
-
Transparent reporting form
- https://cdn.elifesciences.org/articles/65906/elife-65906-transrepform-v1.docx
Download links
A two-part list of links to download the article, or parts of the article, in various formats.
Downloads (link to download the article as PDF)
Open citations (links to open the citations from this article in various online reference manager services)
Cite this article (links to download the citations from this article in formats compatible with various reference manager tools)
Disrupting cortico-cerebellar communication impairs dexterity
eLife 10:e65906.
https://doi.org/10.7554/eLife.65906


