Single-cell transcriptomics defines heterogeneity of epicardial cells and fibroblasts within the infarcted murine heart
- Department of Molecular Cardiology, Medical Faculty and University Hospital Düsseldorf, Heinrich-Heine-University Düsseldorf, Germany
- Biologisch-Medizinisches-Forschungszentrum (BMFZ), Genomics & Transcriptomics Laboratory, Heinrich-Heine-University Düsseldorf, Germany
- Algorithmic Bioinformatics, Heinrich-Heine-University Düsseldorf, Germany
- Division of Cardiology, Pulmonology and Vascular Medicine, Medical Faculty and University Hospital Düsseldorf, Heinrich-Heine-University Düsseldorf, Germany
- Institute of Pharmacology and Clinical Pharmacology, Medical Faculty and University Hospital Düsseldorf, Heinrich-Heine-University Düsseldorf, Germany
- Section of Bioinformatics and Systems Cardiology, Klaus Tschira Institute for Integrative Computational Cardiology and Department of Internal Medicine III, University Hospital Heidelberg, Germany
Figures
Figure 1 with 4 supplements
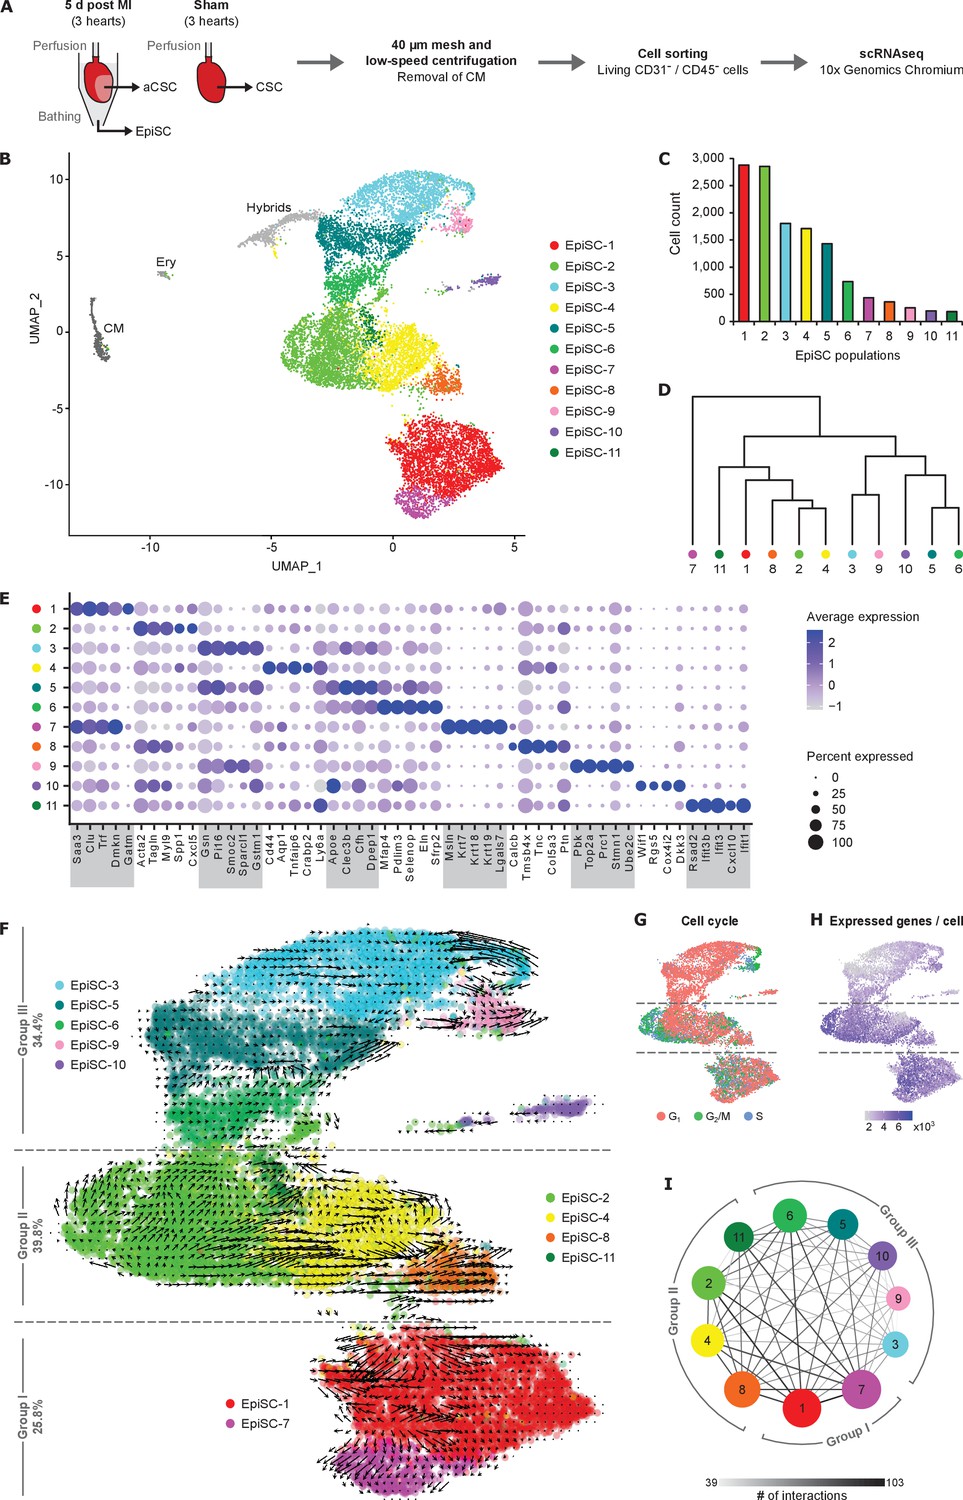
Cell populations in EpiSC from the infarcted heart.
(A) Schematic workflow. Epicardial stromal cells (EpiSC) and activated cardiac stromal cells (aCSC) were simultaneously collected from the surface and the myocardium of the isolated perfused heart by applying mild shear forces to the cardiac surface (Owenier et al., 2020) at 5 days post myocardial infarction (MI) (n = 3). CSC were purified from three non-infarcted control hearts 5 days after sham surgery. Mesh purification, low-speed centrifugation, and cell sorting by flow cytometry were performed to remove cardiomyocytes, CD31+ endothelial cells, CD45+ immune cells, and apoptotic or necrotic cells before analysis using the 10x Genomics Chromium platform. (B) UMAP plot of clustered single-cell RNA sequencing (scRNAseq) data of the pooled EpiSC fraction (n = 13,796 single cells). CM, cardiomyocytes; Ery, erythrocytes. (C) Cell count of EpiSC populations. (D) Dendrogram of EpiSC populations according to average RNA expression. (E) Dot plot of top five marker genes for each EpiSC population. (F) RNA velocity of EpiSC populations projected on the UMAP plot. Arrows show the local average velocity evaluated on a regular grid, indicating estimated future states. (G) Feature plot displaying the predicted classification in G1, G2/M, and S phase for each cell according to cell cycle gene expression scores. (H) Feature plot displaying the number of unique genes detected in each cell. (I) Networks visualizing the number of potential specific interactions between EpiSC populations as determined by CellPhoneDB.
-
Figure 1—source data 1
Source data for EpiSC population cell counts summarized in Figure 1C.
- https://cdn.elifesciences.org/articles/65921/elife-65921-fig1-data1-v1.xlsx
Figure 1—figure supplement 1
Excluded hybrid and non-stromal cell populations in the EpiSC fraction.
(A) DoubletFinder tool was used to detect cell doublets with hybrid transcriptomes. (B) Heat map showing the expression of markers for cardiomyocytes (CM) and erythrocytes (Ery) used to identify residual populations of non-stromal cells.
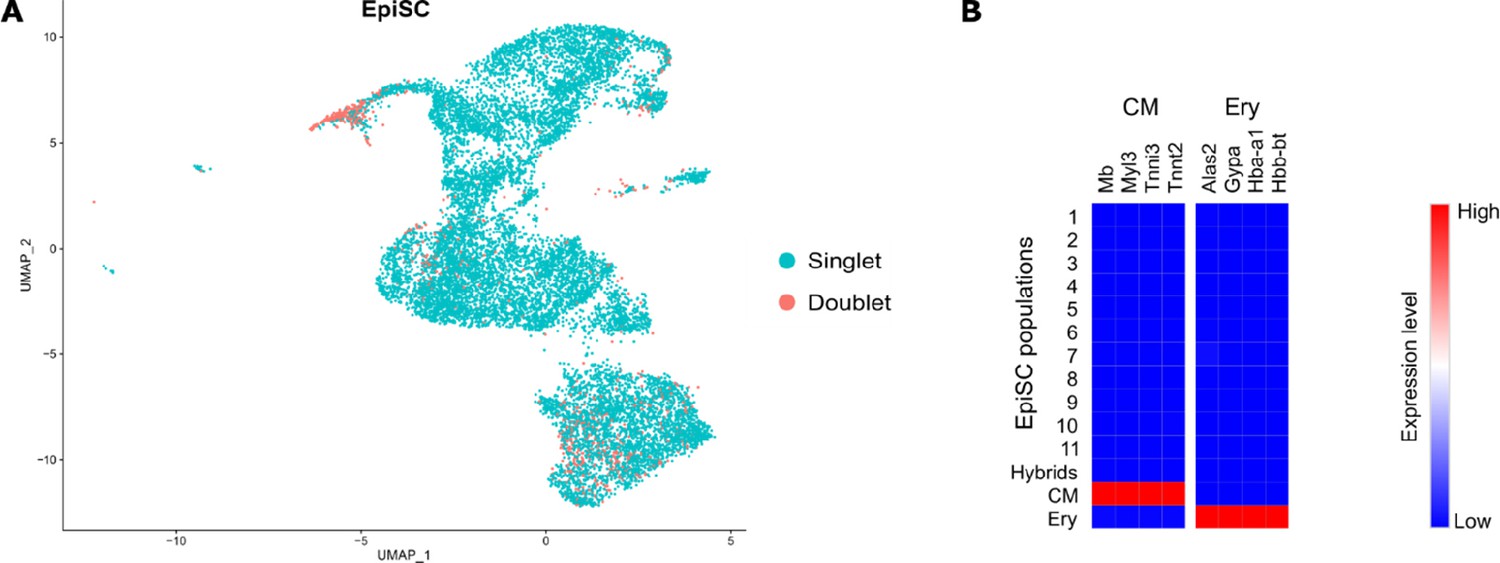
Figure 1—figure supplement 2
Gene ontology terms typifying EpiSC populations.
Over-represented gene ontology (GO) terms in epicardial stromal cell (EpiSC) population marker genes as analyzed by Scillus.
Figure 1—figure supplement 3

Top 10 marker genes of EpiSC populations.
Heat map showing the expression of the top 10 most differentially expressed genes in identified epicardial stromal cell (EpiSC) populations (color-coded according to their identity).
Figure 1—figure supplement 4
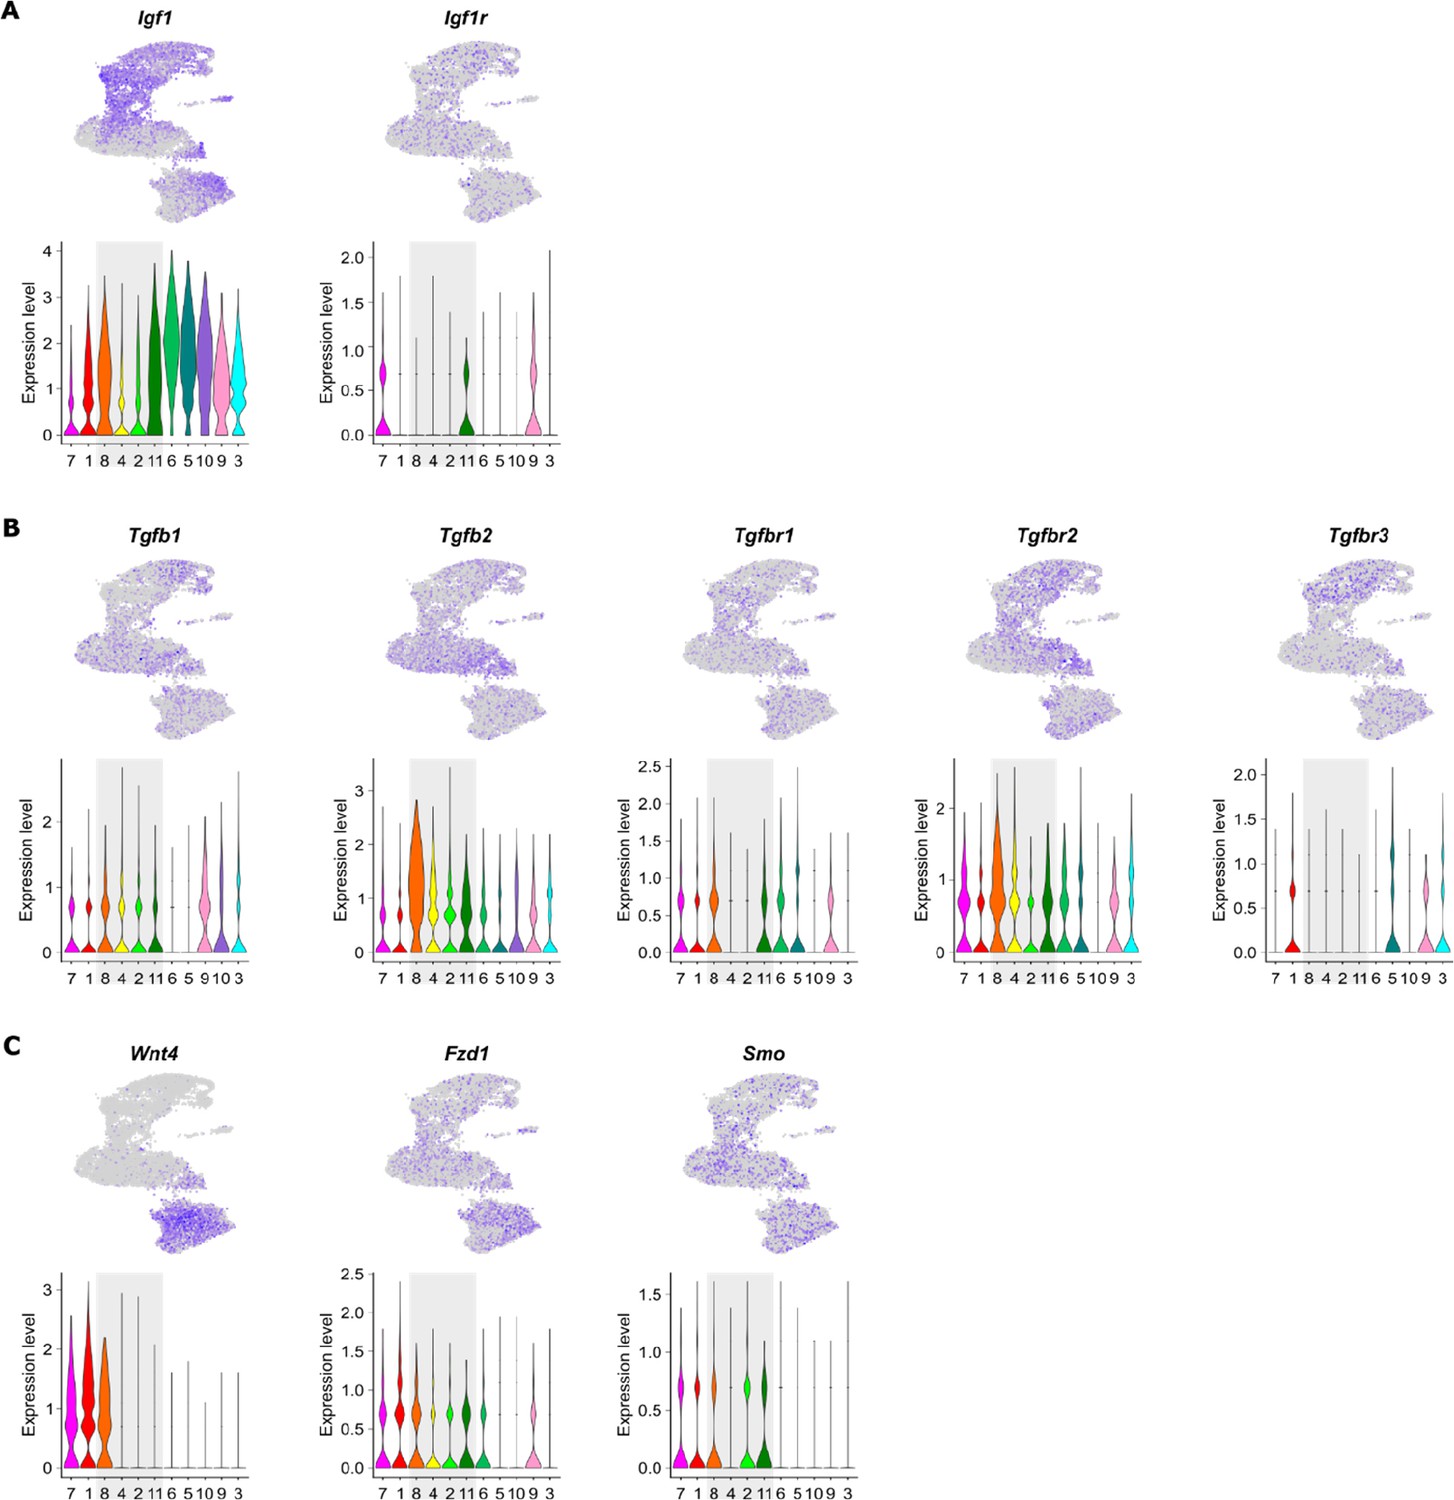
Receptor–ligand pairs in EpiSC populations.
Feature plots and violin plots visualizing the expression levels of selected receptor–ligand pairs across different epicardial stromal cell (EpiSC) populations as identified by CellPhoneDB. (A) Insulin-like growth factor 1 (IGF1) and its receptor IGF1R. (B) Transforming growth factor beta-1 (TGF-β1), TGF-β2, and their receptors TGFBR 1, 2, and 3. (C) Wnt4 and its receptors frizzled-1 (FZD1) and smoothened (SMO).
Figure 2 with 3 supplements
Molecular characterization and location of EpiSC populations.
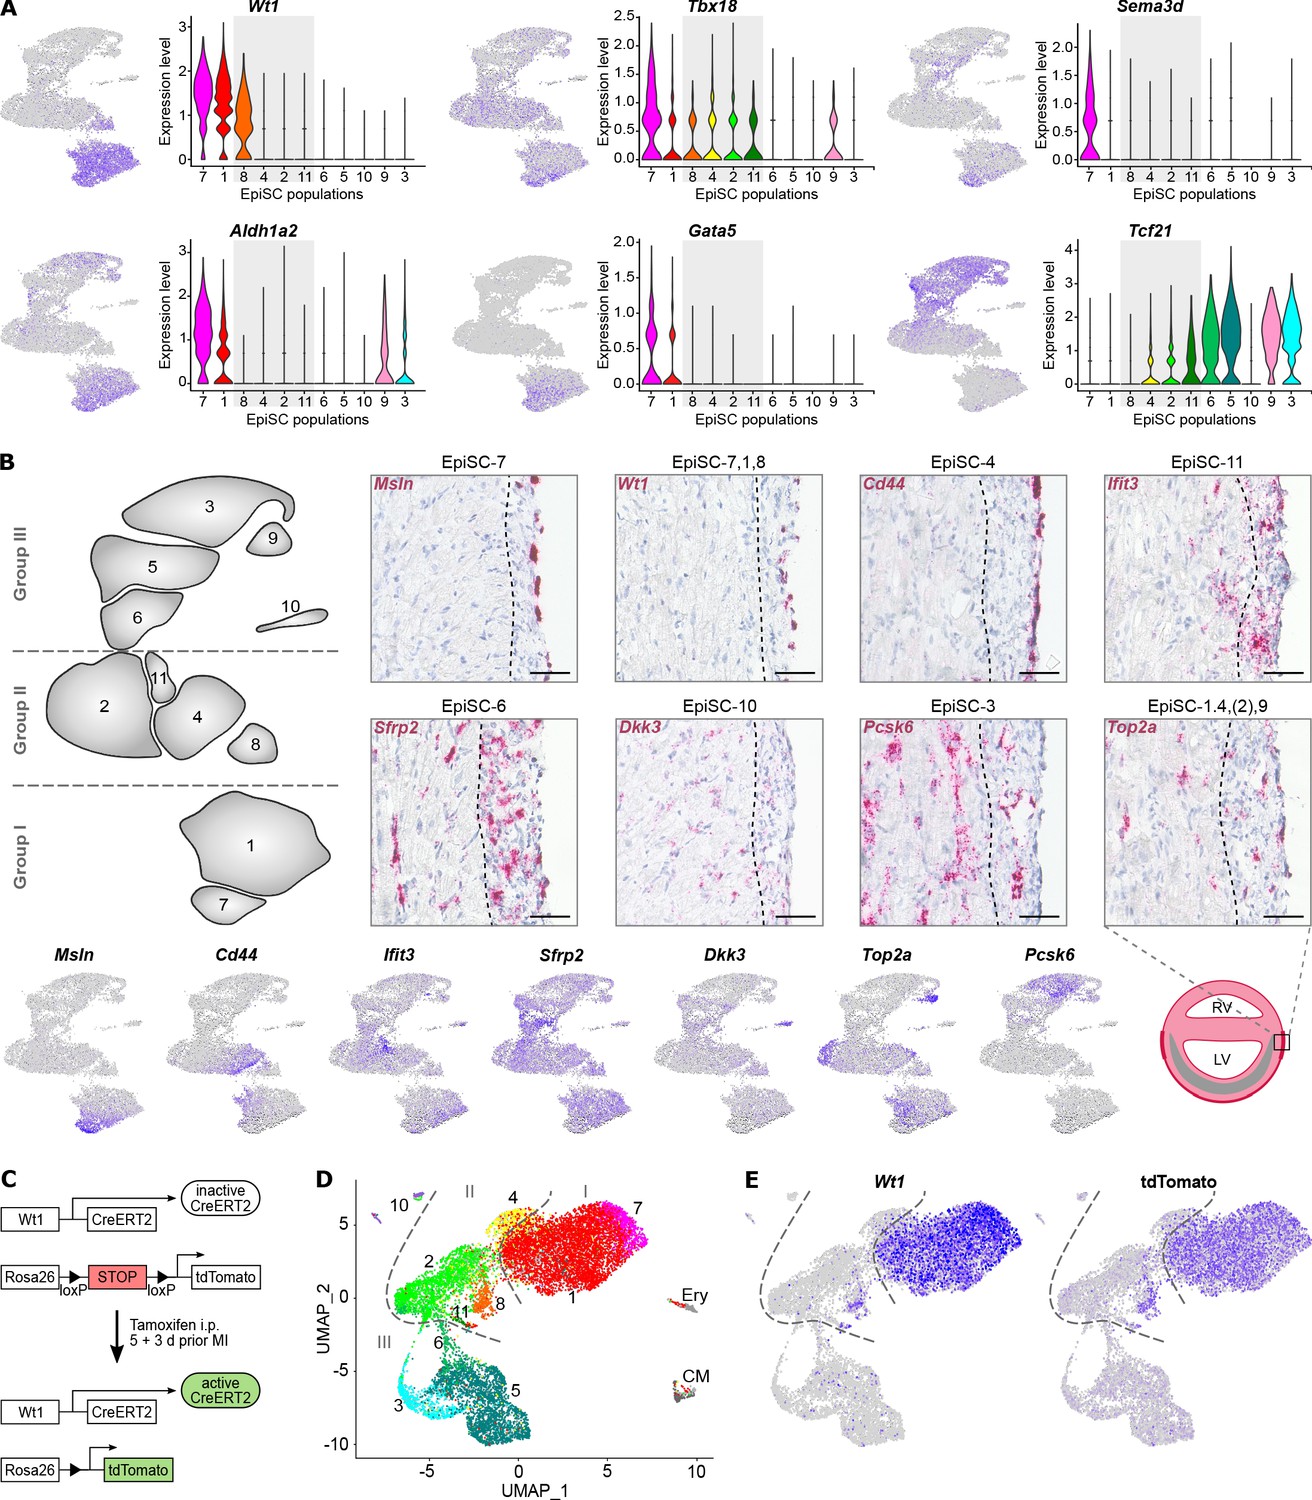
(A) Expression of epicardial progenitor cell markers proposed in the literature as visualized in feature and violin plots. (B) Upper panel: RNA in situ hybridization of epicardial stromal cell (EpiSC) population identifiers (red) in heart cryosections 5 days post myocardial infarction (MI). Representative images (n = 4 hearts) of the infarct border zone are shown. The dotted line marks the interface between myocardial/epicardial tissue according to cell morphology. Nuclei were stained with hematoxylin (blue). Scale bars, 50 µm. Lower panel: feature plots visualizing selected EpiSC population molecular identifiers and scheme of the post-MI heart with the infarct zone in grey. RV, right ventricle; LV, left ventricle. (C–E) Lineage tracing of Wt1-expressing cell populations post MI using Wt1CreERT2RosatdTomato mice. The experimental design is outlined in (C). UMAP plot of clustered scRNAseq data of the EpiSC fraction (n = 13,373 single cells) pooled from two hearts 5 days post MI is shown in (D). Expression of Wt1 and tdTomato is visualized in (E).
Figure 2—figure supplement 1
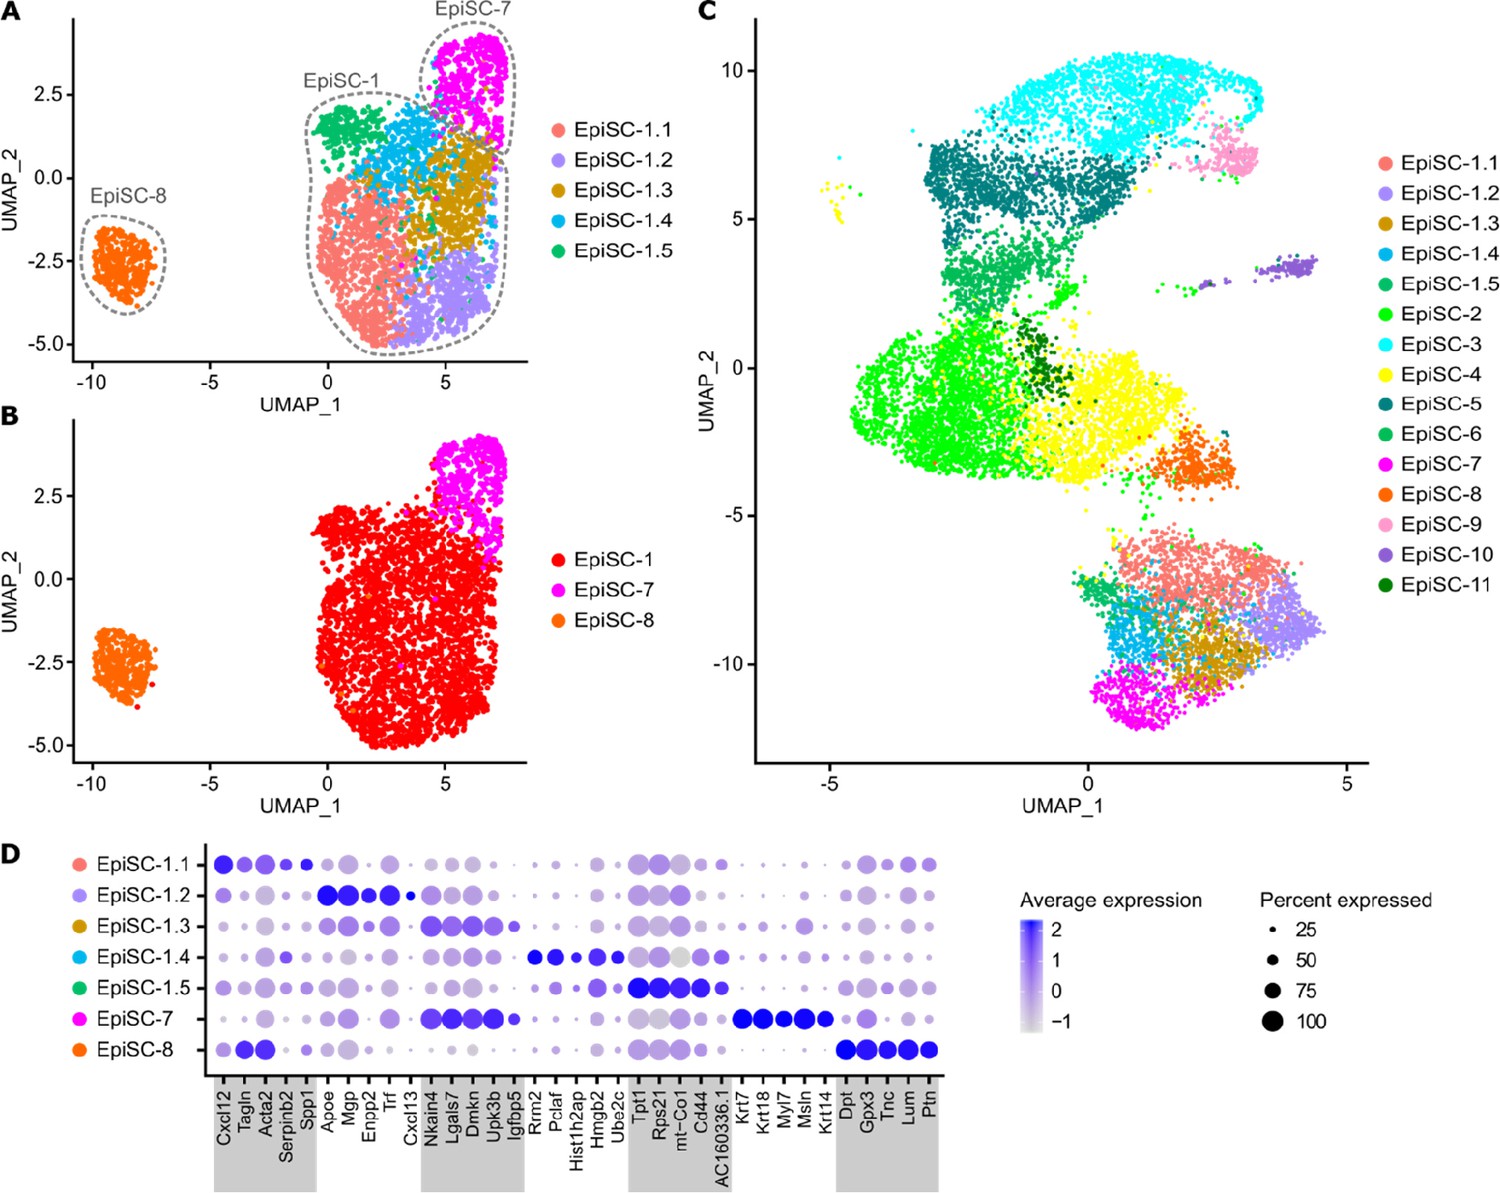
Subclusters of Wt1-expressing EpiSC populations.
(A) UMAP plot of subclusters (Sub) of Wt1-expressing epicardial stromal cell (EpiSC)-7, -1, and -8. (B) UMAP plot of the subclustering with labeling according to previous identity. (C) Transfer of subcluster labeling to UMAP plot of all EpiSC populations showing the position of identified subclusters. (D) Dot plot of top five marker genes for each subcluster together with EpiSC-7 and EpiSC-8.
Figure 2—figure supplement 2

Expression of epicardial markers previously identified in the developing zebrafish heart in mouse post-MI EpiSC.
Expression of epicardial population markers identified in the developing zebrafish heart by Weinberger et al., 2020 visualized in the whole epicardial stromal cell (EpiSC) fraction (A and B) and in Wt1-expressing subclusters (C and D) via feature plots and heat maps. For each of the three zebrafish epicardial populations (Epi1, Epi2, Epi3), selected marker genes are shown.
Figure 2—figure supplement 3

Wt1-expressing subclusters in Wt1CreERT2RosatdTomato EpiSC.
UMAP plot of the epicardial stromal cell (EpiSC) fraction from lineage tracing experiments using Wt1CreERT2RosatdTomato mice with assignment of previously defined subclusters of Wt1-expressing EpiSC.
Figure 3
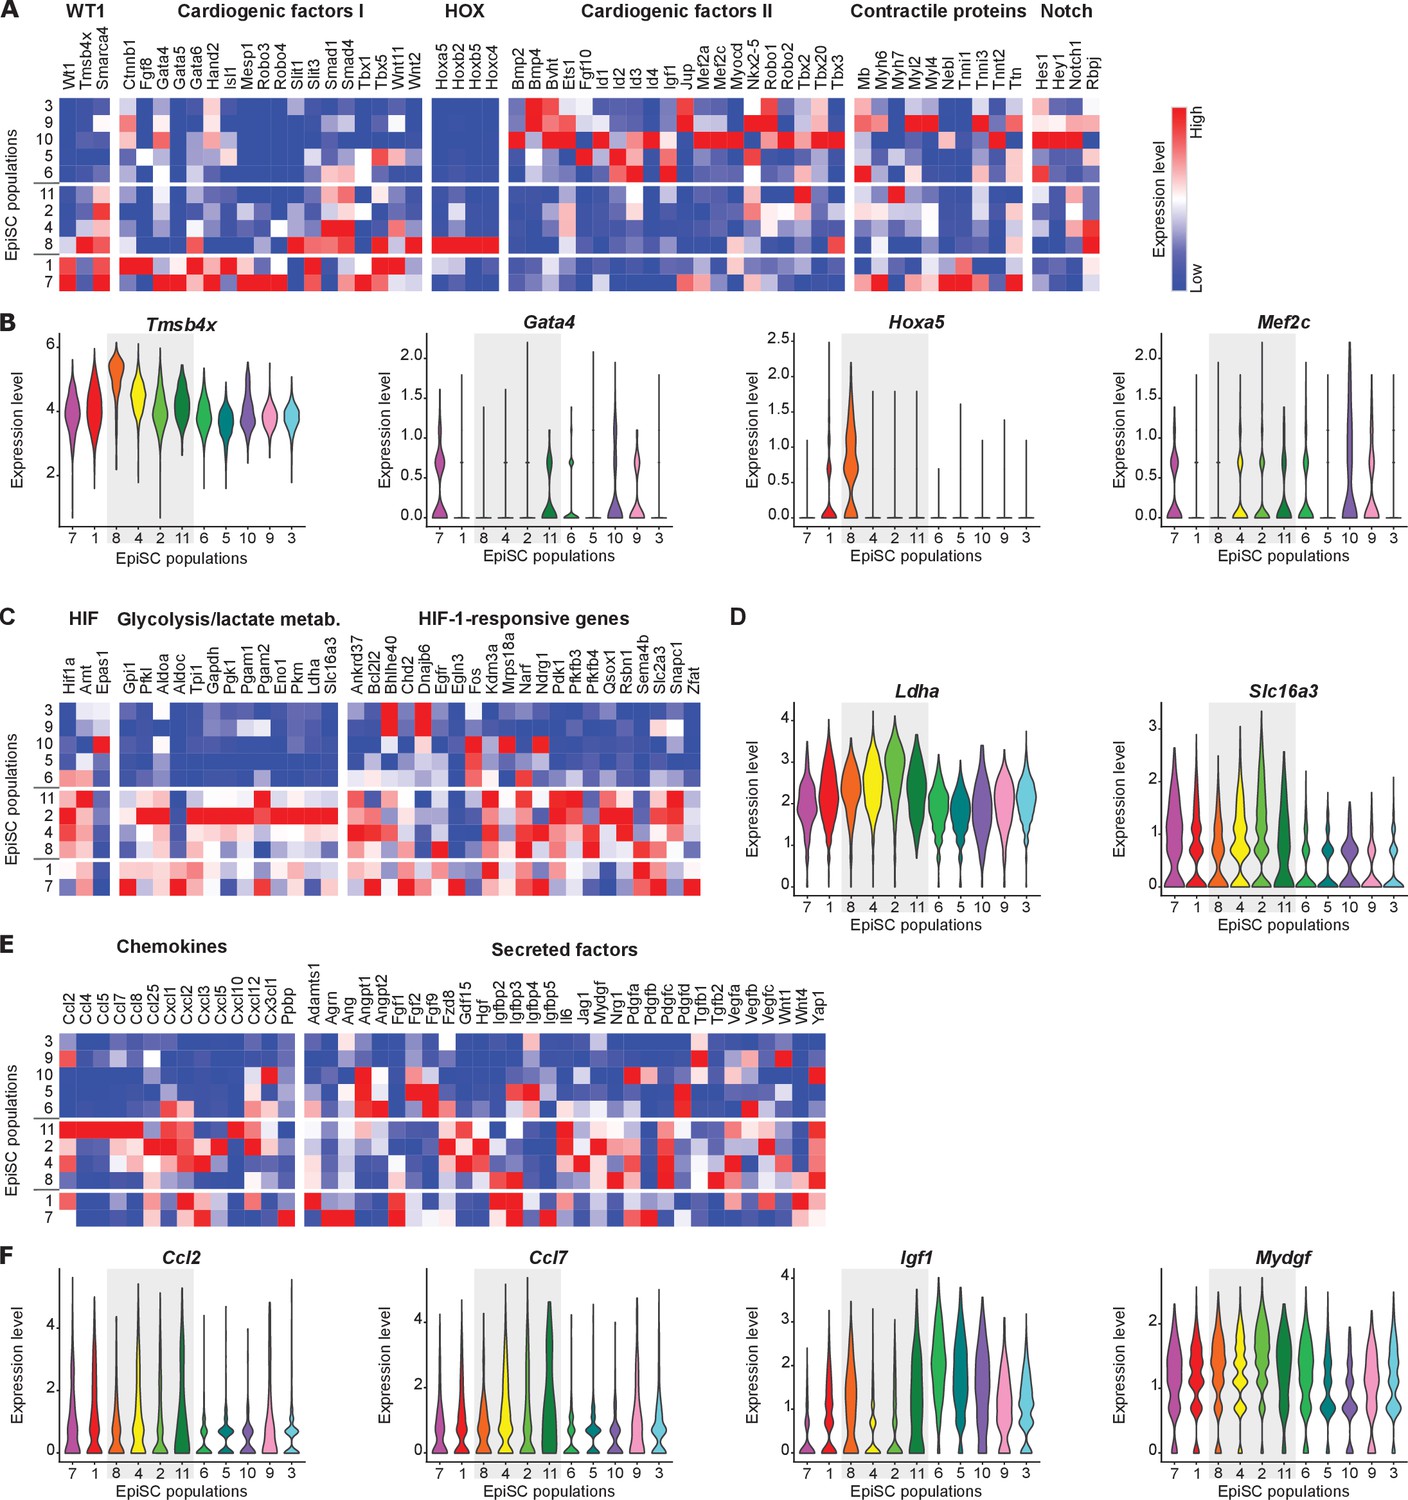
Functional characterization of EpiSC populations.
(A, B) Heat maps (A) and violin plots (B) of selected genes showing the expression of cardiogenic factors and Notch target genes. (C, D) Heat maps (C) and violin plots (D) of genes associated with HIF-1 signaling. (E, F) Heat maps (E) and violin plots (F) of genes encoding chemokines and further secreted factors.
Figure 4 with 7 supplements
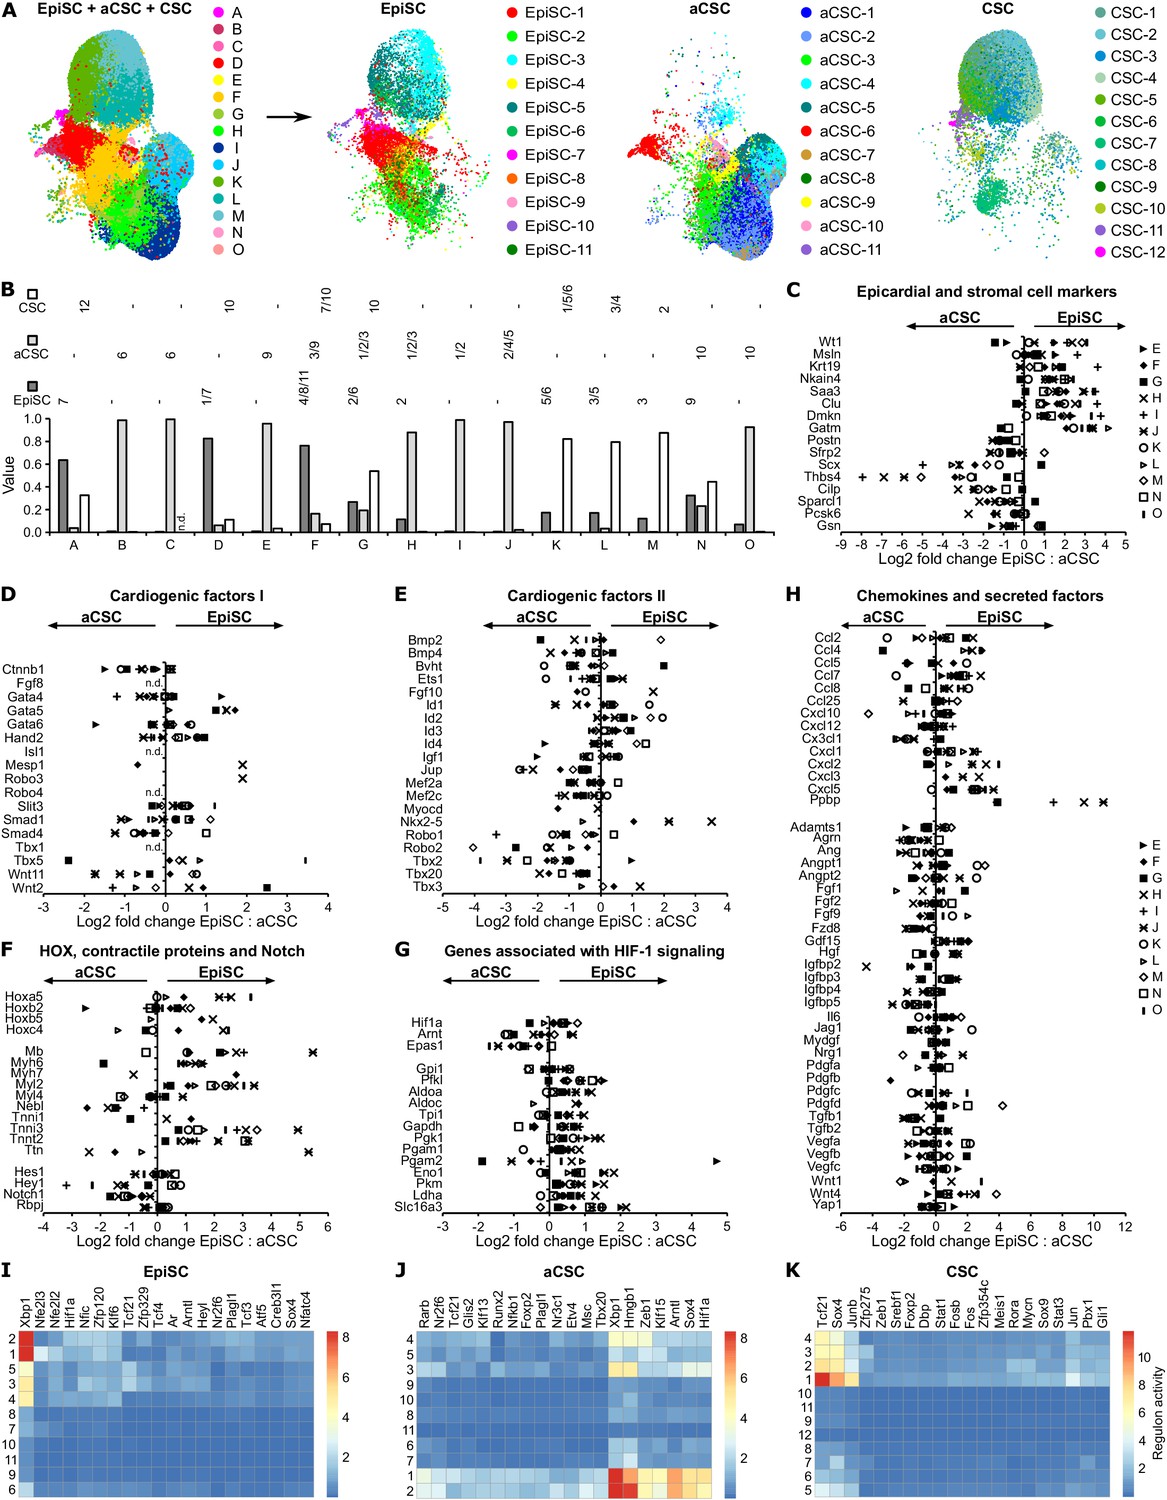
Comparison of EpiSC, aCSC, and CSC.
(A) Canonical correlation analysis (CCA) space alignment of epicardial stromal cells (EpiSC), activated cardiac stromal cells (aCSC), and CSC single-cell RNA sequencing (scRNAseq) data in one UMAP plot (left) and split in one plot each (right). Cells are color-coded according to their assignment to CCA clusters (left) or previously identified populations (right). (B) Contribution of EpiSC, aCSC, and CSC fractions to CCA clusters. n.d., not detected. (C–H) Comparison of EpiSC and aCSC gene expression profiles in CCA clusters D-O regarding epicardial and stromal cell markers (C), cardiogenic factors (D and E), HOX transcription factors, contractile proteins and Notch target genes (F), genes associated with HIF-1 signaling (G) as well as chemokines and other secreted factors (H) as log2 fold change. n.d., not defined. (I–K) Gene regulatory network analysis in EpiSC (I), aCSC (J), and CSC (K) populations by SCENIC.
Figure 4—figure supplement 1
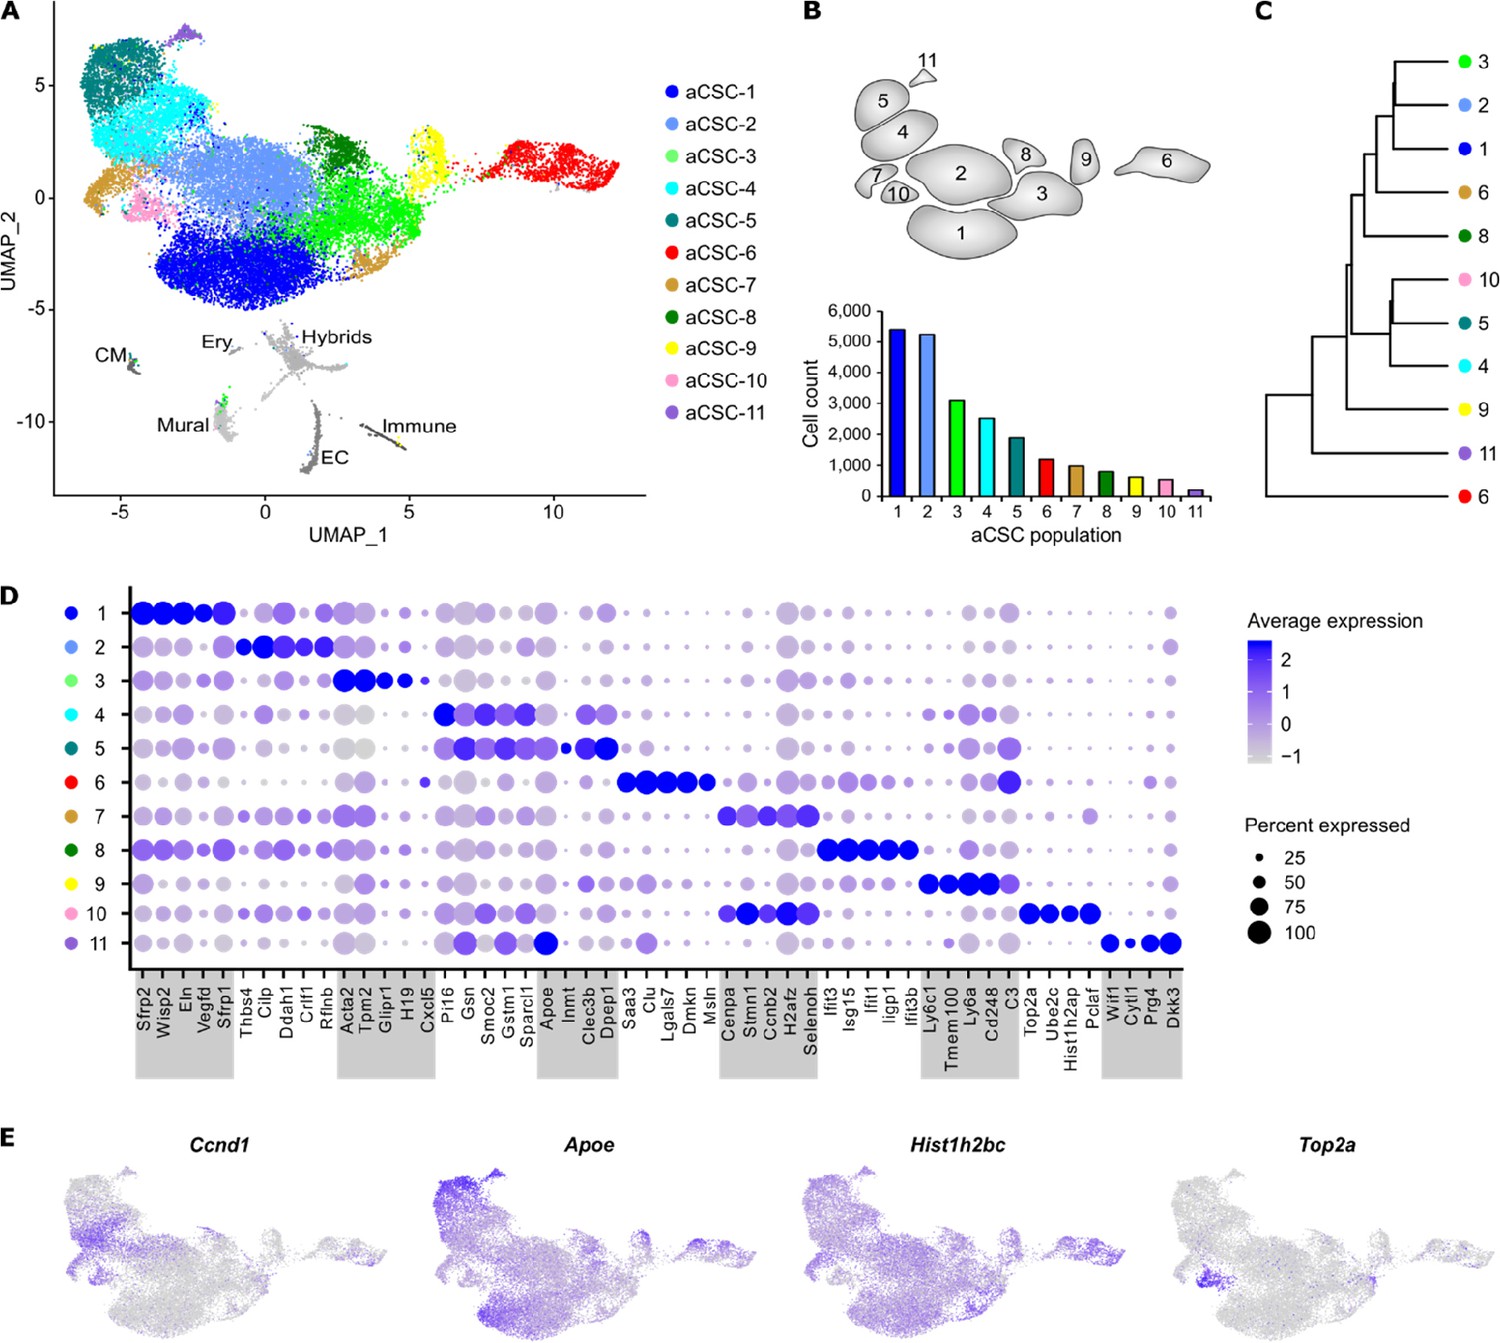
Cell populations in aCSC from infarcted myocardium.
(A) UMAP plot of clustered single-cell RNA sequencing (scRNAseq) data of the pooled activated cardiac stromal cell (aCSC) fraction (n = 24,470 single cells). Each point represents a single cell, and identified cell populations are color-coded. CM, cardiomyocytes; Ery, erythrocytes; EC, endothelial cells. (B) Scheme of the populations from (A) and population cell counts of aCSC. (C) Dendrogram of aCSC populations according to average RNA expression. (D) Dot plot of top five marker genes for each aCSC population. (E) Feature plots of selected population marker genes visualizing the segregation of aCSC-4 and -5 (Ccnd1, Apoe) or aCSC-7 and -10 (Hist1h2bc, Top2a), respectively.
-
Figure 4—figure supplement 1—source data 1
Source data for aCSC population cell counts summarized in Figure 4—figure supplement 1B.
- https://cdn.elifesciences.org/articles/65921/elife-65921-fig4-figsupp1-data1-v1.xlsx
Figure 4—figure supplement 2
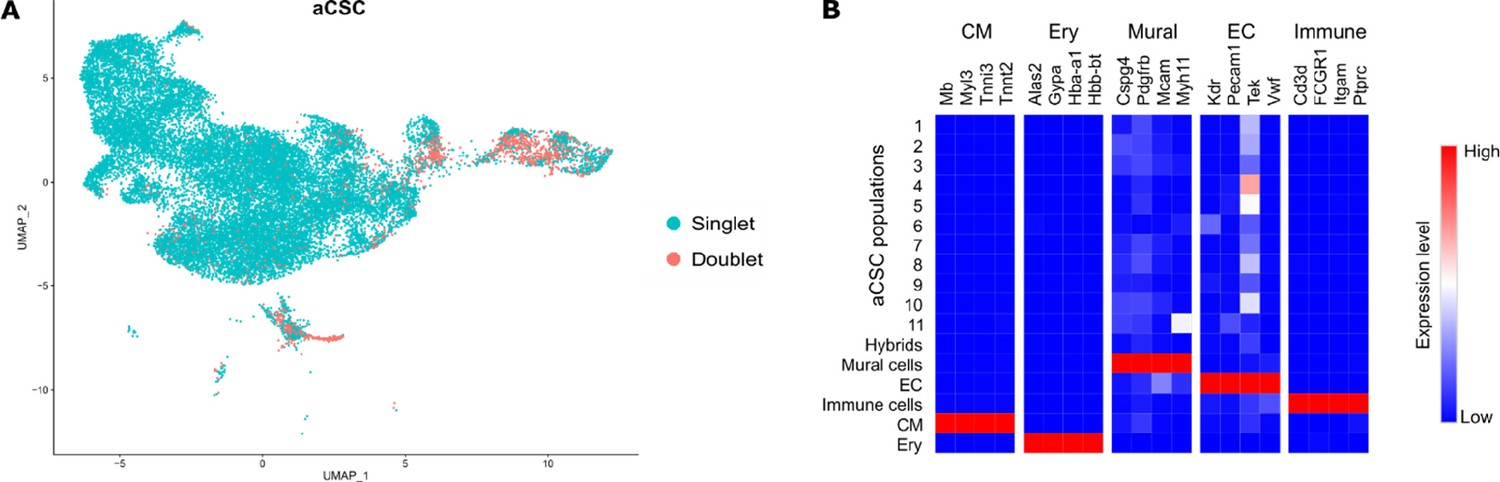
Excluded hybrid and non-stromal cell populations in the aCSC fraction.
(A) DoubletFinder tool was used to detect cell doublets with hybrid transcriptomes. (B) Heat map showing the expression of markers for mural cells, endothelial cells (EC), immune cells, cardiomyocytes (CM), and erythrocytes (Ery) used to identify residual populations of non-stromal cells.
Figure 4—figure supplement 3
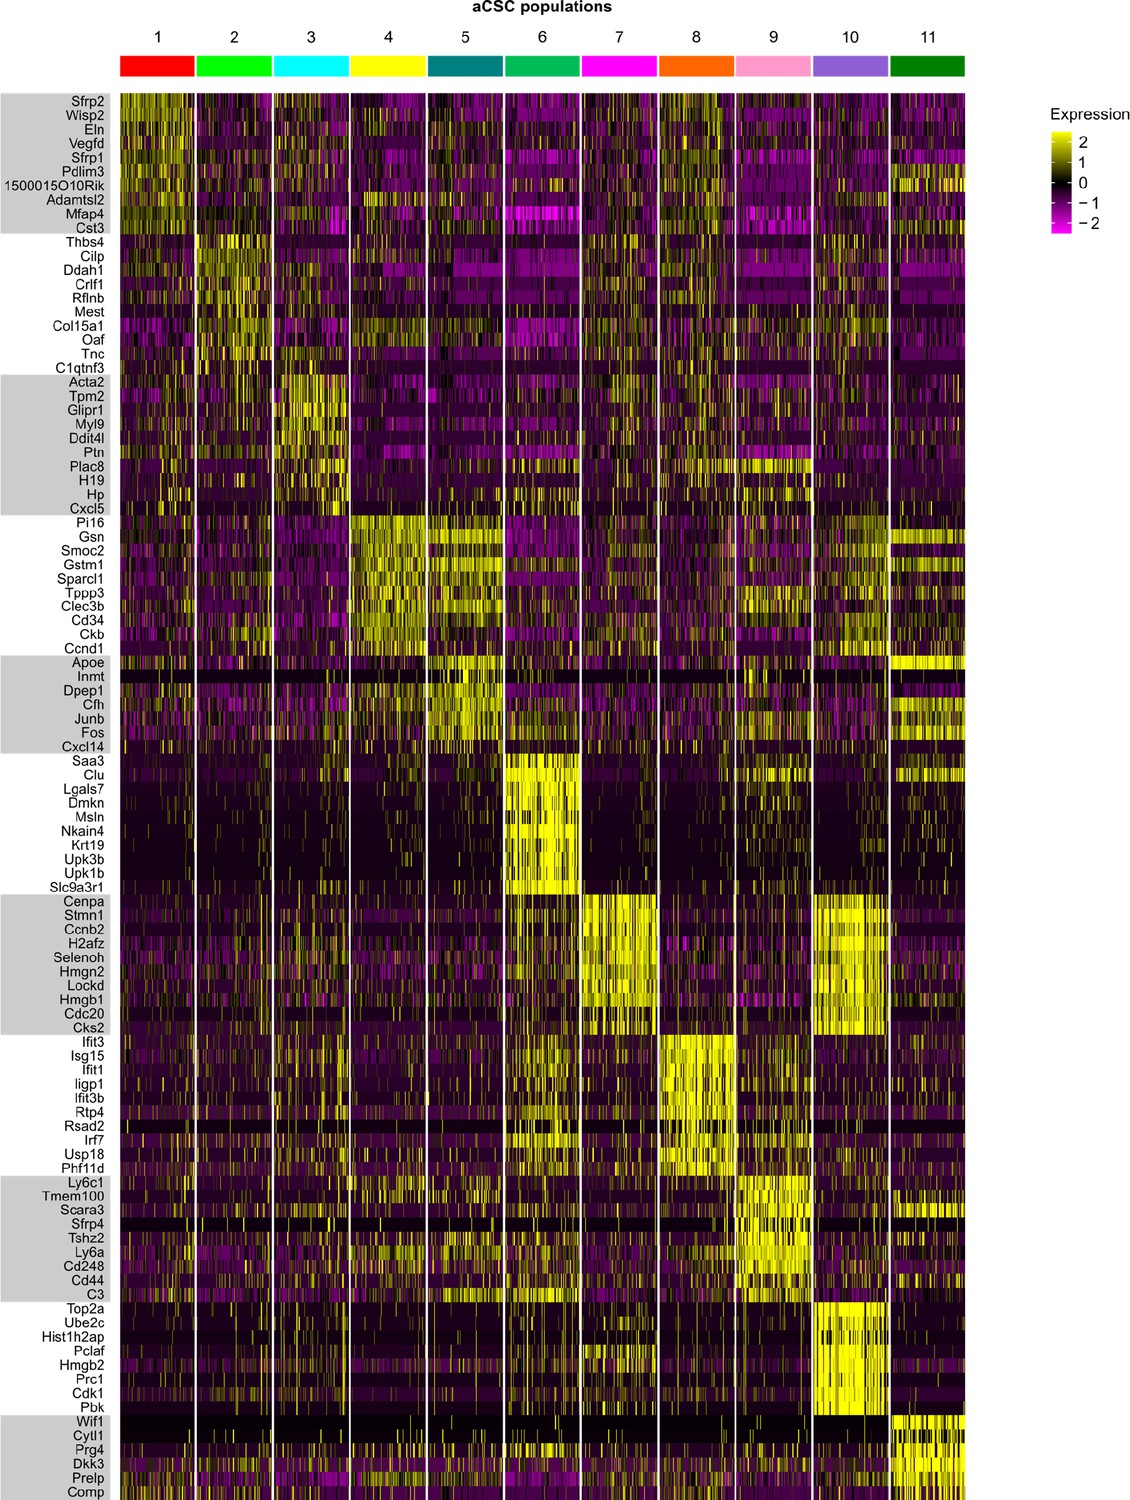
Top 10 marker genes of aCSC populations.
Heat map showing the expression of the top 10 most differentially expressed genes in identified activated cardiac stromal cell (aCSC) populations (color-coded according to their identity).
Figure 4—figure supplement 4

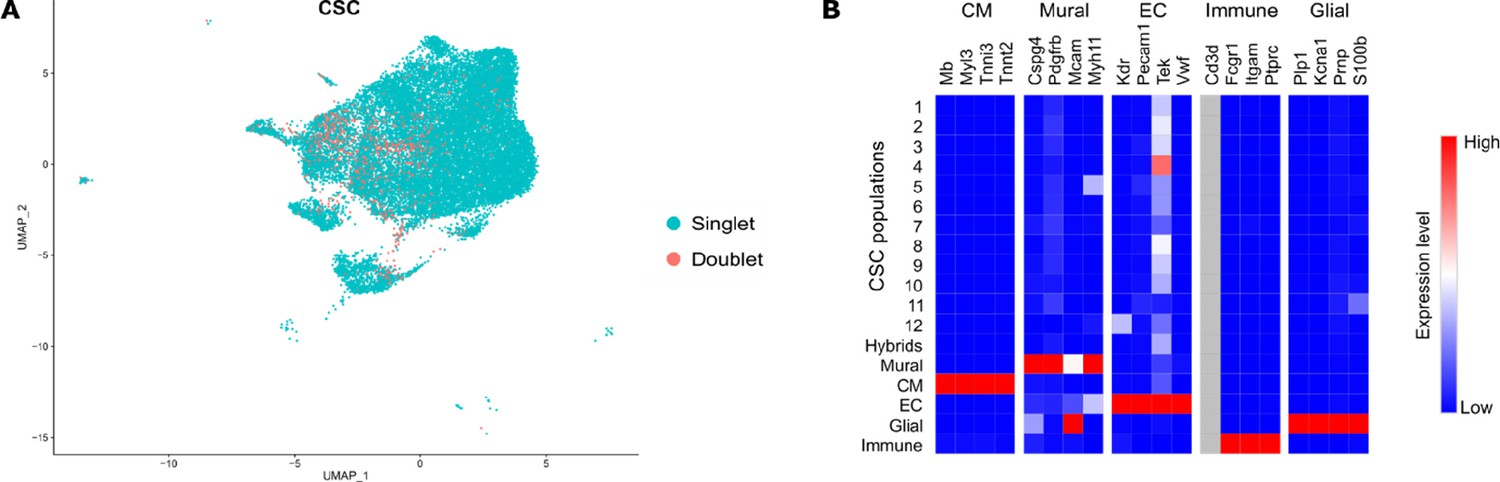
Cell populations in CSC from uninjured hearts.
(A) UMAP plot of clustered single-cell RNA sequencing (scRNAseq) data of the pooled cardiac stromal cell (CSC) fraction (n = 24,781 single cells). Each point represents a single cell and identified cell populations are color-coded. CM, cardiomyocytes; EC, endothelial cells. (B) Scheme of the populations from (A) and population cell counts of CSC. (C) Dendrogram of CSC populations according to average RNA expression. (D) Dot plot of top five marker genes for each CSC population. (E) Feature and violin plots visualizing expression of epicardial marker genes Msln and Wt1.
-
Figure 4—figure supplement 4—source data 1
Source data for CSC population cell counts summarized in Figure 4—figure supplement 4B.
- https://cdn.elifesciences.org/articles/65921/elife-65921-fig4-figsupp4-data1-v1.xlsx
Figure 4—figure supplement 5
Excluded hybrid and non-stromal cell populations in the CSC fraction.
(A) DoubletFinder tool was used to detect cell doublets with hybrid transcriptomes. (B) Heat map showing the expression of markers for mural cells, cardiomyocytes (CM), endothelial cells (EC), glial cells, and immune cells used to identify residual populations of non-stromal cells (grey filling, gene expression not detected).
Figure 4—figure supplement 6
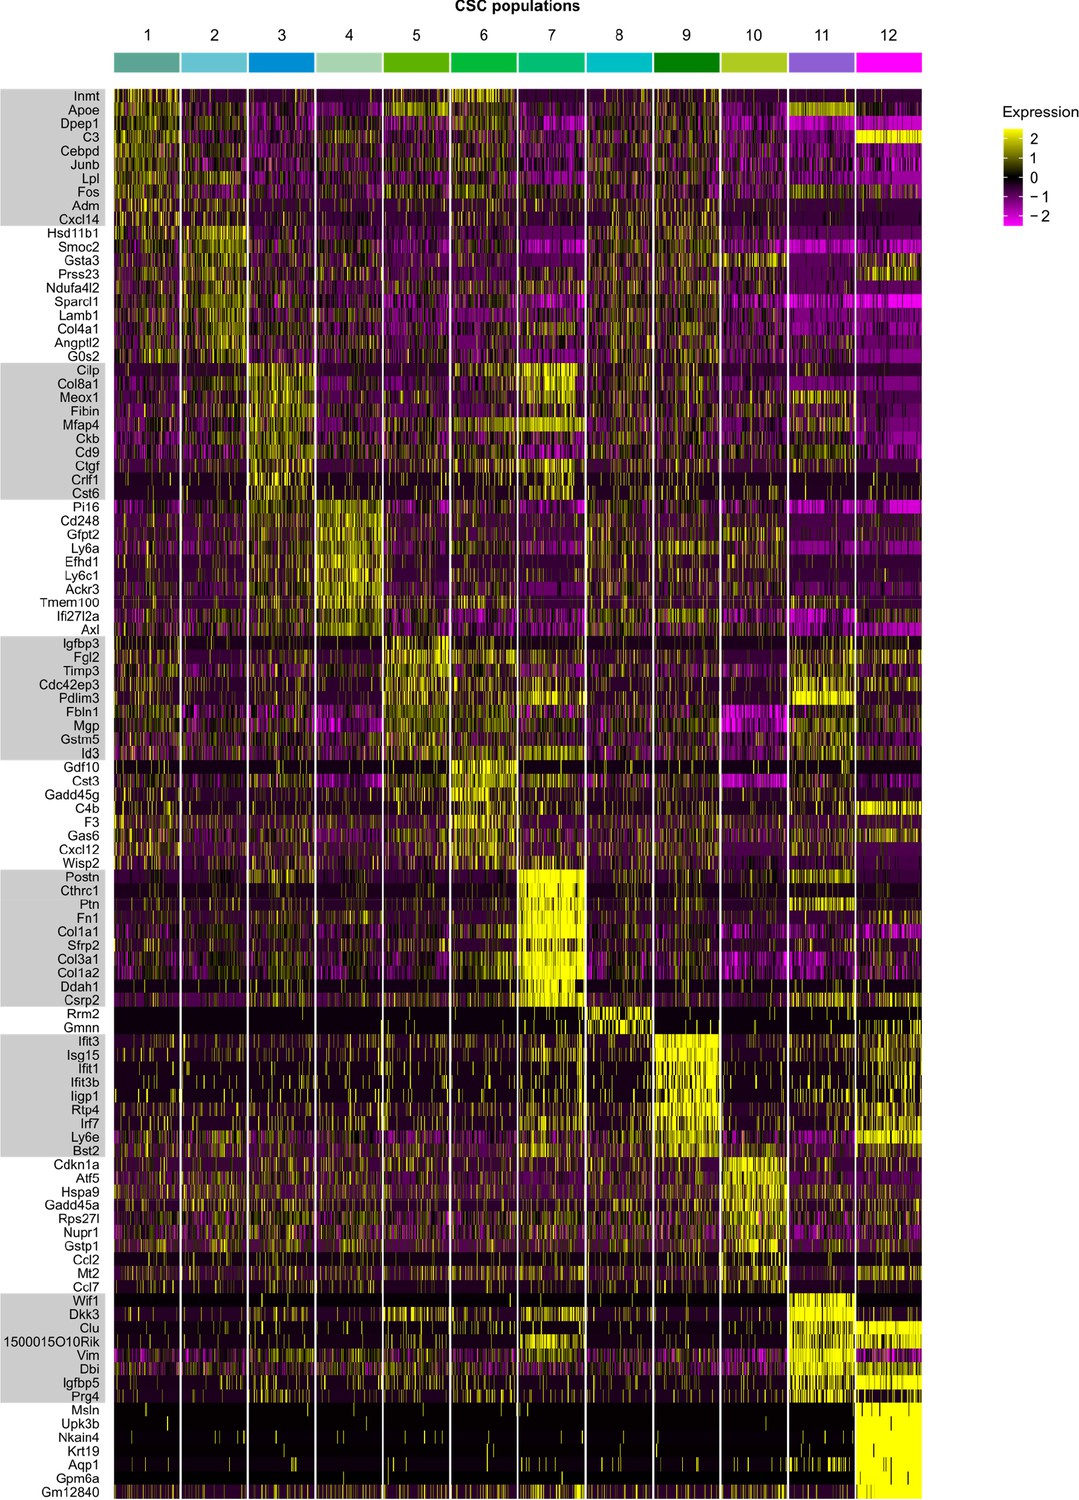
Top 10 marker genes of CSC populations.
Heat map showing the expression of the top 10 most differentially expressed genes in identified cardiac stromal cell (CSC) populations (color-coded according to their identity).
Figure 4—figure supplement 7

Comparison of EpiSC to CSC.
(A–C) Relative expression of epicardial and stromal cell markers (A), genes associated with HIF-1 signaling (B), and genes associated with cell proliferation (C) in cardiac stromal cell (CSC) and epicardial stromal cell (EpiSC) fractions from canonical correlation analysis (CCA) clusters as log2 fold change. (D) Volcano plot of differentially expressed genes among EpiSC and CSC in CCA cluster A.
-
Figure 4—figure supplement 7—source data 1
Source data for differentially expressed genes among EpiSC and CSC in CCA cluster A displayed in Figure 4—figure supplement 7D.
- https://cdn.elifesciences.org/articles/65921/elife-65921-fig4-figsupp7-data1-v1.xlsx
Tables
Key resources table
| Reagent type (species) or resource | Designation | Source or reference | Identifiers | Additional information |
|---|---|---|---|---|
| Strain, strain background (Mus musculus) | C57BL/6J | Janvier Labs | Strain name: C57BL/6JRj | |
| Strain, strain background (M. musculus) | STOCK Wt1tm2(cre/ERT2)Wtp/J | The Jackson Laboratory; PMID:18568026 | Stock no. 010912; RRID:IMSR_JAX:010912 | |
| Strain, strain background (M. musculus) | B6;129S6-Gt(ROSA)26Sortm14(CAG-tdTomato)Hze/J | The Jackson Laboratory | Stock no. 007908; RRID:IMSR_JAX:007908 | |
| Chemical compound, drug | Tamoxifen | Sigma-Aldrich | T5648 | |
| Chemical compound, drug | 7AAD | BioLegend | 420404 | (1:100) |
| Chemical compound, drug | Fixable Viability Dye eFluor 780 | eBioscience | 65–0865 | (1:100) |
| Other | Collagenase CLS II | Biochrom | C2-22 | Enzyme blend; now available from Sigma-Aldrich, C2-BIOC |
| Antibody | APC-conjugated rat monoclonal anti-CD31 | BioLegend | 102410, clone 390; RRID:AB_312905 | (1:100) |
| Antibody | PE-Cy7 rat monoclonal anti-CD45 | BD Biosciences | 552848, clone 30-F11; RRID:AB_394489 | (1:400) |
| Commercial assay or kit | RNAscope 2.5 HD Reagent Kit-RED | Advanced Cell Diagnostics | 322350 | |
| Sequence-based reagent | RNAscope Probe Mm-Msln | Advanced Cell Diagnostics | 443241 | |
| Sequence-based reagent | RNAscope Probe Mm-Wt1 | Advanced Cell Diagnostics | 432711 | |
| Sequence-based reagent | RNAscope Probe Mm-Cd44 | Advanced Cell Diagnostics | 479191 | |
| Sequence-based reagent | RNAscope Probe Mm-Ifit3 | Advanced Cell Diagnostics | 508251 | |
| Sequence-based reagent | RNAscope Probe Mm-Sfrp2 | Advanced Cell Diagnostics | 400381 | |
| Sequence-based reagent | RNAscope Probe Mm-Pcsk6 | Advanced Cell Diagnostics | 593361 | |
| Sequence-based reagent | RNAscope Probe Mm-Top2a | Advanced Cell Diagnostics | 491221 | |
| Sequence-based reagent | RNAscope Probe Mm-Dkk3 | Advanced Cell Diagnostics | 400931 | |
| Software, algorithm | CellRanger | 10x Genomics | ||
| Software, algorithm | Seurat | PMID:29608179 | RRID:SCR_007322 | |
| Software, algorithm | DoubletFinder | PMID:30954475 | RRID:SCR_018771 | |
| Software, algorithm | Scillus | https://github.com/xmc811/ Scillus Xu, 2021 | ||
| Software, algorithm | GOrilla | PMID:19192299 | RRID:SCR_006848 | |
| Software, algorithm | Velocyto.py | PMID:30089906 | RRID:SCR_018167 | |
| Software, algorithm | CellPhoneDB | PMID:32103204 | RRID:SCR_017054 | |
| Software, algorithm | SCENIC | PMID:28991892 | RRID:SCR_017247 |
Additional files
-
Supplementary file 1
Average gene expression levels in EpiSC, aCSC, and CSC populations.
- https://cdn.elifesciences.org/articles/65921/elife-65921-supp1-v1.xlsx
-
Supplementary file 2
Genes with significantly enriched expression among EpiSC, aCSC, and CSC populations.
- https://cdn.elifesciences.org/articles/65921/elife-65921-supp2-v1.xlsx
-
Supplementary file 3
Selected ligand–receptor interactions between EpiSC populations as predicted by CellPhoneDB.
- https://cdn.elifesciences.org/articles/65921/elife-65921-supp3-v1.xlsx
-
Supplementary file 4
Average gene expression levels in subclusters of Wt1-expressing EpiSC populations.
- https://cdn.elifesciences.org/articles/65921/elife-65921-supp4-v1.xlsx
-
Supplementary file 5
Genes with significantly enriched expression among subclusters of Wt1-expressing EpiSC populations.
- https://cdn.elifesciences.org/articles/65921/elife-65921-supp5-v1.xlsx
-
Supplementary file 6
Genes with significantly enriched expression in group I and group II populations vs group III populations.
- https://cdn.elifesciences.org/articles/65921/elife-65921-supp6-v1.xlsx
-
Supplementary file 7
Average gene expression levels in clusters from CCA space alignment of EpiSC, aCSC, and CSC with separation in EpiSC, aCSC, and CSC, including p-values of differential expression.
- https://cdn.elifesciences.org/articles/65921/elife-65921-supp7-v1.xlsx
-
Supplementary file 8
Genes with significantly enriched expression among clusters from CCA space alignment of EpiSC, aCSC, and CSC.
- https://cdn.elifesciences.org/articles/65921/elife-65921-supp8-v1.xlsx
-
Transparent reporting form
- https://cdn.elifesciences.org/articles/65921/elife-65921-transrepform-v1.docx
Download links
A two-part list of links to download the article, or parts of the article, in various formats.
Downloads (link to download the article as PDF)
Open citations (links to open the citations from this article in various online reference manager services)
Cite this article (links to download the citations from this article in formats compatible with various reference manager tools)
Single-cell transcriptomics defines heterogeneity of epicardial cells and fibroblasts within the infarcted murine heart
eLife 10:e65921.
https://doi.org/10.7554/eLife.65921


