Developmental emergence of two-stage nonlinear synaptic integration in cerebellar interneurons
- Sorbonne Université et CNRS UMR 8256, Adaptation Biologique et Vieillissement 9 Quai 10 St Bernard, France
- Department of Neuroscience, Institut Pasteur, CNRS URA 21821, 25 rue du Dr Roux, France
- Institute of Science and Technology Austria, Am Campus 1, Austria
- Paris Brain Institute, CNRS UMR 7225 - Inserm U1127 – Sorbonne Université, Groupe 12 Hospitalier Pitié Salpêtrière 47 Boulevard de l'Hôpital, France
Figures
Figure 1
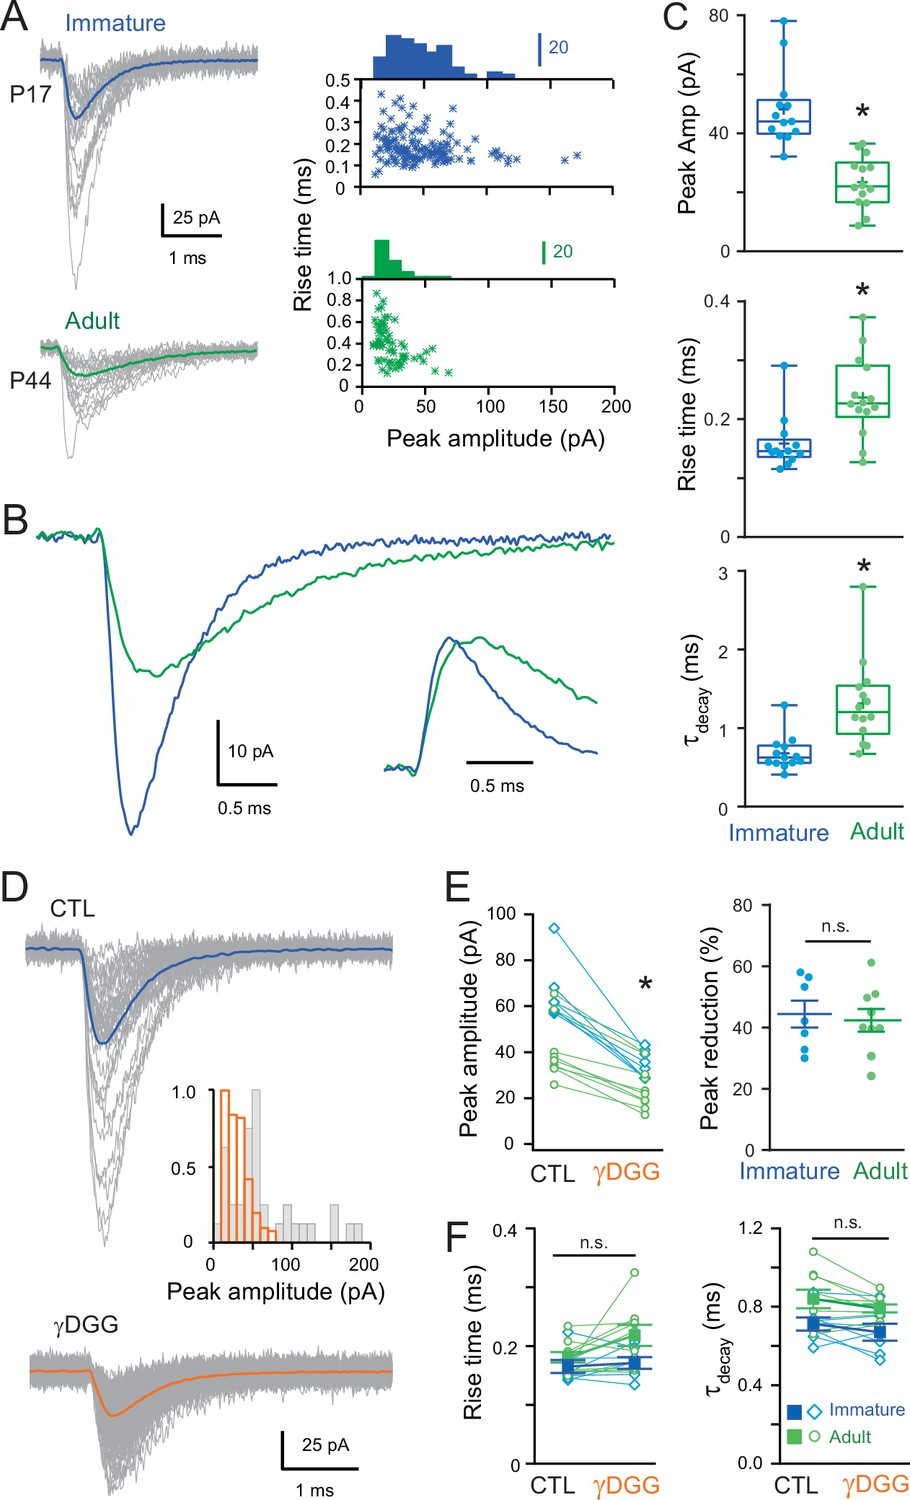
Developmental maturation of the AMPA receptor (AMPAR)-mediated miniature excitatory postsynaptic current (mEPSC) in stellate cell (SC).
(A) Left panels show superimposed single mEPSCs (gray) and the corresponding average (bold) recorded at −70 mV obtained from a representative immature SCs (P17, blue trace) and adult SCs (P44, green trace). Right panels show plots of the 10–90% rise time versus peak amplitude, with the superimposed amplitude distributions. A significant correlation was observed in the adult SC (p < 0.05, Spearman rank correlation, r = −0.59). (B) Superimposed mEPSC average aligned on event onset. Inset: traces normalized to their peak. (C) Box and whisker plots showing the median (line) peak amplitude, 10–90% rise time and decay (τdecay) at both ages (P 17.4 ± 0.27 days, n = 13 and P 45 ± 1.75 days, n = 14, respectively), the 25th and 75th percentile (box), range (whiskers), and mean (+). Superimposed filled circles represent individual cells (asterisks denote p < 0.05; p = 2.18e−5, p = 0.0028, and p = 3.0e−4, respectively). (D) Representative examples of single mEPSC events (gray) and the corresponding average (bold) recorded from an immature SC for control (CTL) and in the presence of gamma-D-Glutamylglycine (γDGG) (1 mM). Inset shows the corresponding mEPSC peak amplitude distributions. (E) The effect of γDGG on mEPSCs at the two ages (n = 7 with p = 0.002 and n = 9 with p = 0.005, respectively): left panel its effect on individual mean peak amplitude for each SC (blue for immature and green for adult SC); and right panel, summary plot showing the % reduction of mEPSC peak amplitude (p = 0.83). (F) Plot summarizing the effect of γDGG on mEPSC rise time (left panel; for immature SC p = 0.52 and for adult SC p = 0.09) and decay (τdecay, right panel, for immature SC p = 0.44 and for adult SC p = 0.53) at the two ages for individual cells (open symbols) and on population averages (± standard error of the mean (SEM)). See Figure 1—source data 1.
-
Figure 1—source data 1
Developmental maturation of the AMPAR-mediated mEPSC in SC.
- https://cdn.elifesciences.org/articles/65954/elife-65954-fig1-data1-v1.xlsx
Figure 2
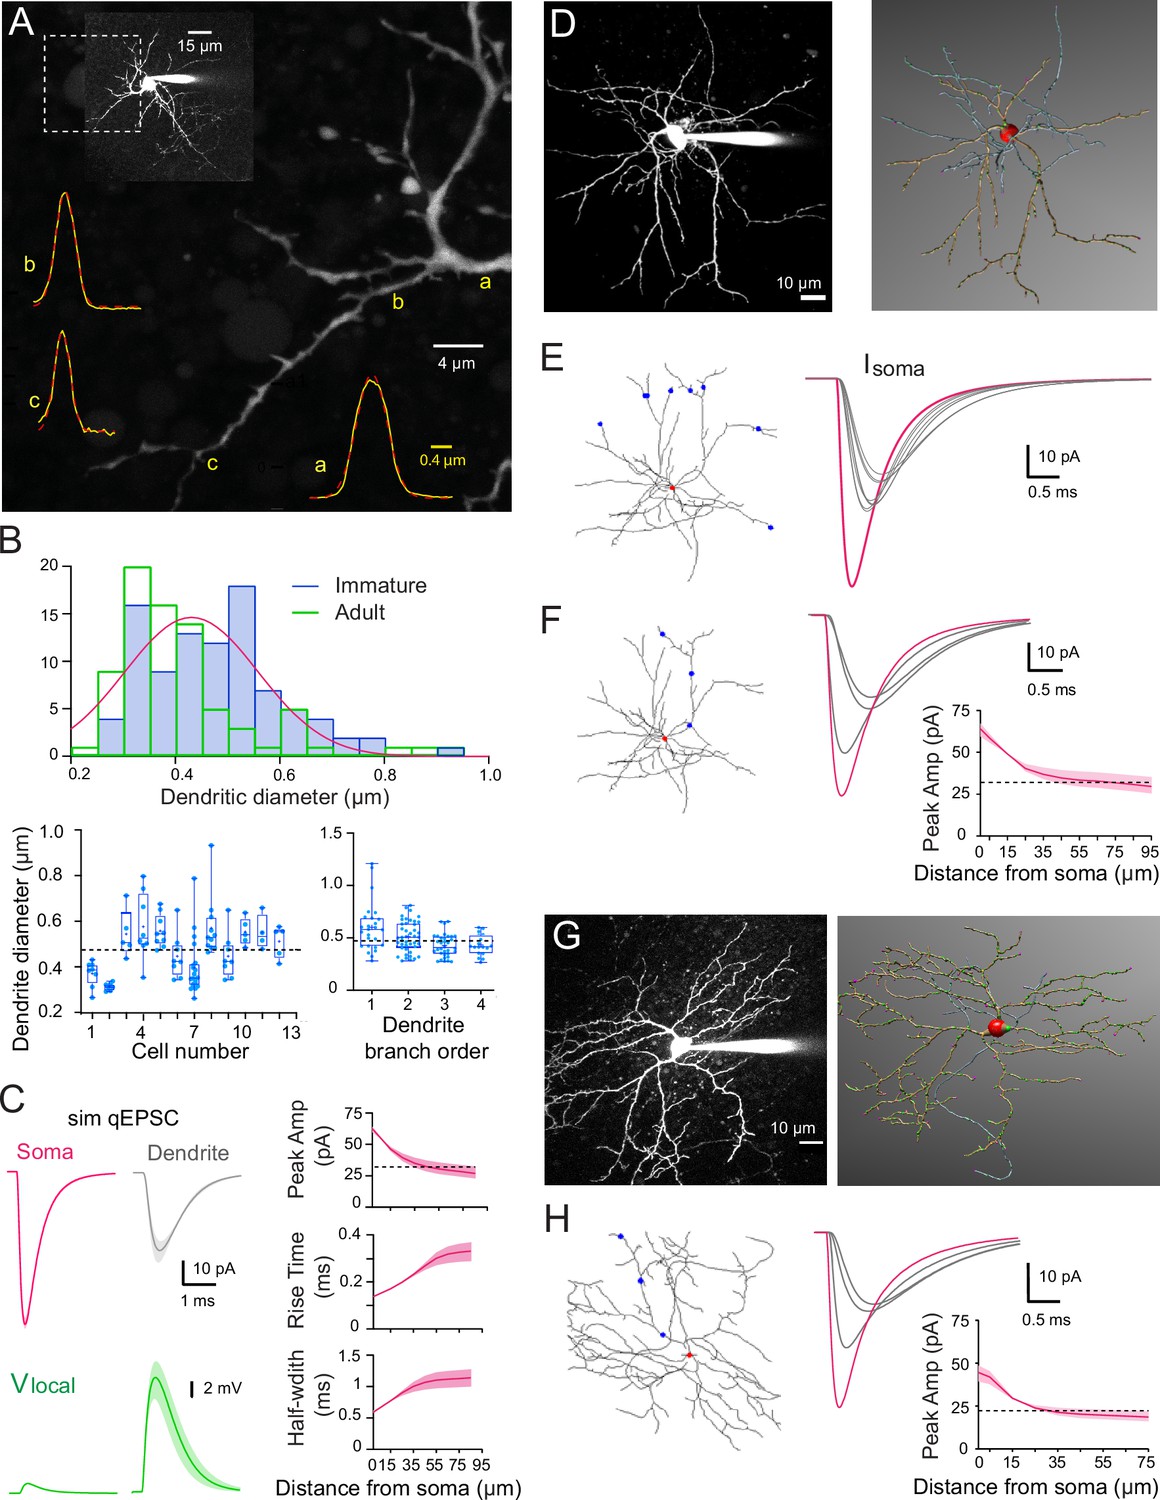
Numerical simulations of stellate cell (SC) dendrites indicate significant cable filtering and large local depolarizations in immature SC.
(A) Maximal intensity projection of one-photon confocal images of an immature SC labeled with Alexa 488. Examples of intensity profiles (yellow line) of three dendritic locations from proximal to distal = a, (b and c) superimposed on the image. Dendrite diameter is approximated by the full-width half-maximum (FWHM) of the Gaussian fit of the line profile (broken red line). (B) Top: histogram showing the distribution of immature SC dendrite diameters from 93 dendrites (in blue) and the adult SC distribution (from Abrahamsson et al., 2012; in green), with a Gaussian fit indicating a mode centered at 0.43 ± 0.008 μm. Bottom left: summary box and whisker plot showing dendritic diameters for individual SCs. Superimposed filled circles represent individual dendritic branch measurements. Bottom right: summary box and whisker plot showing dendritic diameters as a function of dendritic branch order in immature SC. Filled circles represent individual dendritic diameters (with p = 0.19 between orders 1 and 2, p = 0.014 between orders 2 and 3, and p = 0.046 between orders 3 and 4). The dotted line indicates the mean dendritic diameter for immature SC. (C) Numerical simulations of somatic quantal excitatory postsynaptic currents (qEPSCs) in a passive immature SC under voltage-clamp (Cm = 0.9 pF/cm2, Rm = 20,000 Ω.cm2, and Ri = 150 ± 50 Ω.cm) with a dendritic diameter set to 0.47 µm. Left: top traces show simulated qEPSCs (sim qEPSC at a Vm = −70 mV) in response to a quantal synaptic conductance (gsyn) injected at the soma (magenta) and at a distance of 45 μm on a dendrite (gray trace). gsyn was set to reproduce the experimental qEPSCs following somatic synapses activation (see Figure 3). Bottom traces (green), the corresponding local voltage transients at the site of synaptic conductance injection. Boundaries of shaded region indicate simulations with a Ri of 100–200 Ωcm. Right: summary plot shows the distance dependence of simulated qEPSC amplitude, rise time, and half-width. Boundaries of the shaded region indicate simulations with a Ri of 100–200 Ω.cm. The dotted line indicates the 50% amplitude reduction. (D) Two-photon laser scanning microscopy (2PLSM) image of a P16 SC (maximal intensity projection) patch loaded with 30μM Alexa 594 and the corresponding 3D reconstruction in NeuronStudio (red: soma, brown: dendrite, blue: axon). (E) Superimposed numerical simulation of qEPSCs in the reconstructed P16 SC (with Cm = 0.9 pF/cm2, Rm = 20,000 Ω.cm2, and Ri = 150 Ω.cm) in response to a quantal conductance (gsyn) at the soma (red dot, magenta trace) or at a distance of 60μm on six different dendritic branches (blue dots, gray traces). gsyn was set to reproduce immature qEPSCs evoked by somatic synapses. (F) Simulated qEPSCs from synapse locations at the soma (red dot, magenta trace) or along a single dendrite (blue dot, gray traces). The summary plot shows the simulated qEPSC amplitudes as a function of synaptic location along the somatodendritic compartment. Boundaries of the shaded region indicate simulations with a Ri of 100–200 Ω.cm. The dotted line indicates the 50% amplitude reduction. (G) Same as in (D) but for a P42 SC. (H) Same as in (F) but with the reconstructed P42 SC and gsyn to reproduce experimental adult somatic qEPSC. See Figure 2—source data 1.
-
Figure 2—source data 1
Numerical simulations of SC dendrites indicate significant cable filtering and large local depolarizations in immature SC.
- https://cdn.elifesciences.org/articles/65954/elife-65954-fig2-data1-v1.xlsx
Figure 3
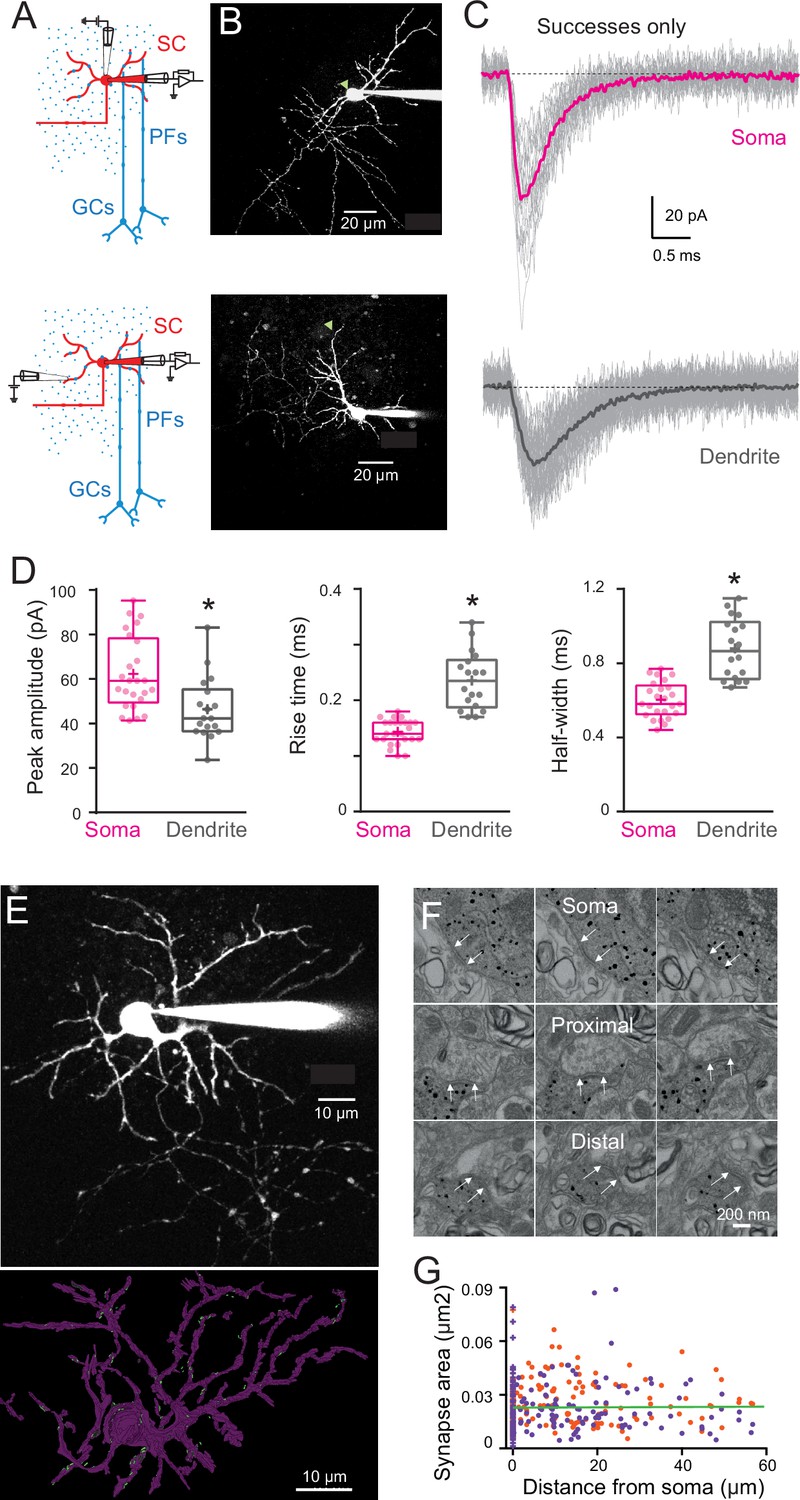
Quantal excitatory postsynaptic current (EPSC) properties and postsynaptic density (PSD) areas for synapses contacting the soma and dendrites of immature stellate cell (SC).
(A) Diagram of a parasagittal cerebellar slice showing parallel fibers (PFs) projecting perpendicular (blue dots) to the dendritic plane of SCs (in red), allowing precise positioning of the stimulus electrode with respect to the soma (top panel) or an isolated SC dendrite (lower panel). (B) Two-photon laser scanning microscopy (2PLSM) images (maximal intensity projection) of two immature SC loaded with the patch-pipette with 30 μM Alexa 594 with the location of stimulating pipette indicated with a green triangle. (C) Single trials (gray) showing detected EPSCs (successes only) in response to extracellular stimulation at the soma (top) and on a dendrite (bottom) under low release probability conditions (external [Ca2+]/[Mg2+] was 0.5/5 mM; failure rate >90%). The corresponding averaged traces are in bold and represent the estimate of a quantal EPSC (qEPSC). (D) Box and whisker plots showing the median (line) peak amplitude, 10–90% rise time and full-width half-maximum (half-width) following somatic (magenta) or dendritic (gray) synapses activation (n = 25 and n = 18, respectively), the 25th and 75th percentile (box), range (whiskers), and mean (+). Superimposed filled circle represents individual cells (asterisks denote p < 0.05; p = 0.001, p = 4.31e−8, and p = 1.49e−6, respectively). (E) 2PLSM image of an Alexa 594-loaded P14 SC (maximal intensity projection) before fixation and (below) its 3D rendering after an electron microscopy (EM) reconstruction. Light dots indicate postsynaptic density (PSD) locations. Scale bar, 10 μm (F) Electron micrographs of an immunogold labeled SC soma with proximal and distal dendritic segments. The outer bound of excitatory synapses are indicated by arrows. Scale bar, 200 nm. (G) Plot of synapse area versus distance from soma. Orange and purple circles indicate data obtained from two immature SCs (P14, n = 172 synapses and P17, n = 220 synapses – total n = 392). The green line is a linear fit through all the points (R2 = 0.001, p = 0.85). See Figure 3—source data 1.
-
Figure 3—source data 1
qEPSC properties and PSD areas for synapses contacting the soma and dendrites of immature SC.
- https://cdn.elifesciences.org/articles/65954/elife-65954-fig3-data1-v1.xlsx
Figure 4
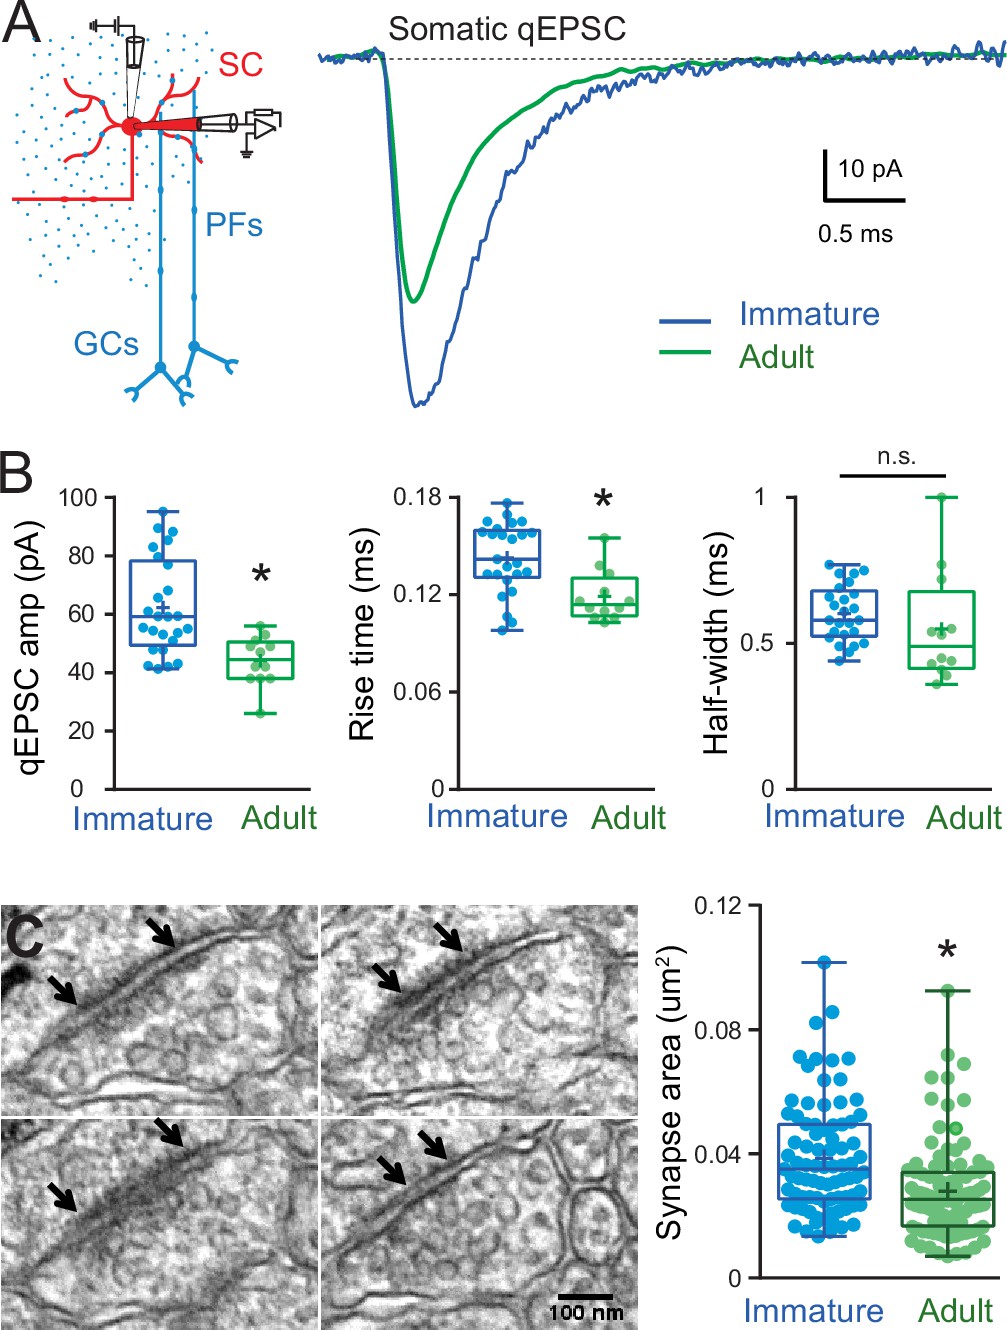
Developmental changes in somatic quantal excitatory postsynaptic current (qEPSC) properties and somatic postsynaptic density (PSD) size.
(A) The left panel shows a diagram of a parasagittal cerebellar slice showing parallel fibers (PFs) projecting perpendicular (blue dots) to the dendritic plane of a stellate cell (SC) (in red), showing the stimulus electrode (top) position above the soma. The right panel shows the superimposition of representative qEPSC averages aligned on event onset, from immature SC (blue trace) and adult SC (green trace, from Abrahamsson et al., 2012). (B) Summary box and whisker plot showing the qEPSC amplitude, 10–90% rise time and half-width for immature (blue, n = 25) and adult (green, n = 12) SC (asterisks denote p < 0.05; p = 6.2e−4, p = 0.0035, and p = 0.074, respectively). (C) Serial electron micrographs of an asymmetrical synapse made by axon terminals on an immature SC soma. Right panel: summary box and whisker plot showing the synapse area obtained from immature (n = 83 synapses from three cells) and adult SC (n = 97 synapses from two cells) somata. Superimposed filled circle represent individual synapses (asterisks denote p < 0.05; p = 1.03e−5). The outer boundaries of an excitatory synapse are indicated by arrows. Scale bar is 100 nm. See Figure 4—source data 1.
-
Figure 4—source data 1
Developmental changes in somatic qEPSC properties and somatic PSD size.
- https://cdn.elifesciences.org/articles/65954/elife-65954-fig4-data1-v1.xlsx
Figure 5
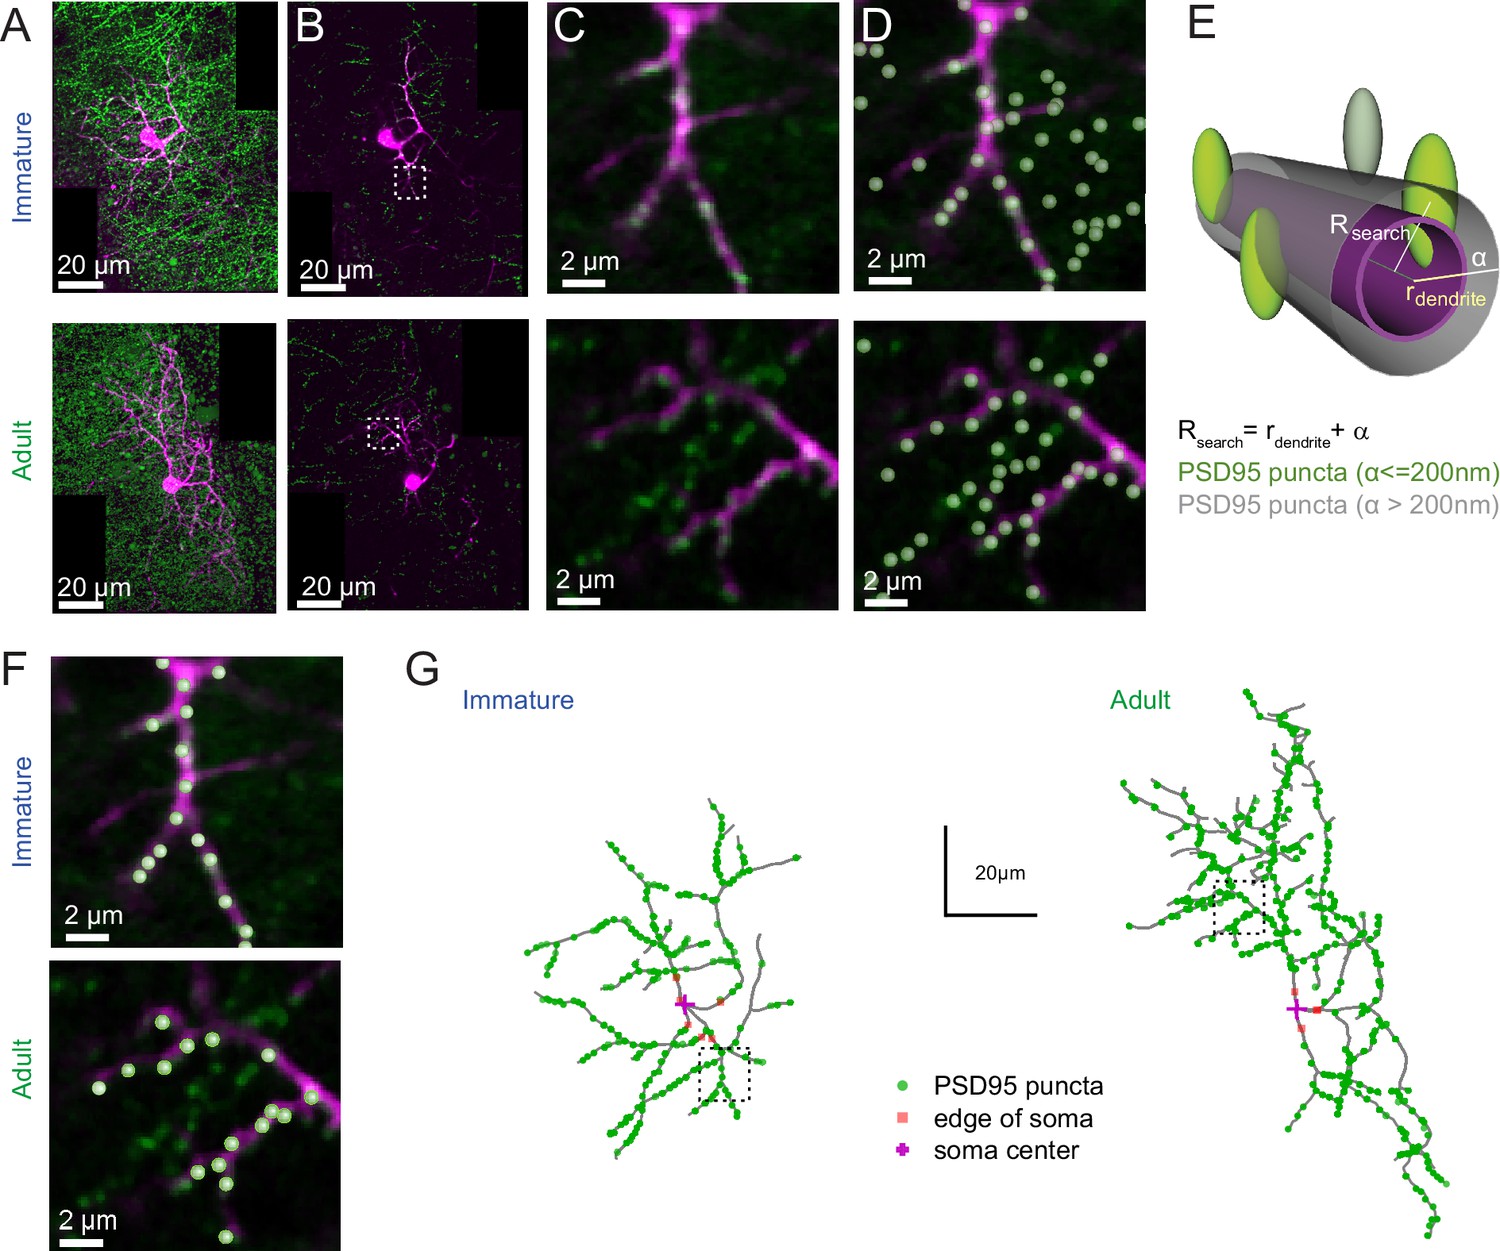
PSD95 puncta distribution on immature and adult stellate cell (SC).
(A) Maximum intensity projection of merged images showing a P14 (top) and P42 (bottom) SC labeled with Alexa 594 (magenta) and Venus-tagged PSD95 puncta (green). (B) Example of single optical sections from (A). (C) Inset indicated in (B) showing details of a dendritic branch with Venus-tagged PSD95 puncta. (D) Detected PSD95 puncta on the same focal plane overlayed on the fluorescent image. (E) Diagram describing the criteria for assignment of PSD95 puncta to a dendrite branch. Puncta were considered as associated with the dendrite if their centers were located within a search radius (Rsearch) defined as the local dendritic radius rdendrite + α, where α = 0.2 μm. (F) Examples of detected PSD95 puncta connected to dendritic structure in an immature (top) and adult (bottom) SC. (G) Skeleton representation of the dendritic tree of an immature (left) and adult (right) SC with detected PSD95 puncta in green. The edge and the center of the soma are indicated by orange squares and magenta crosses, respectively.
Figure 6
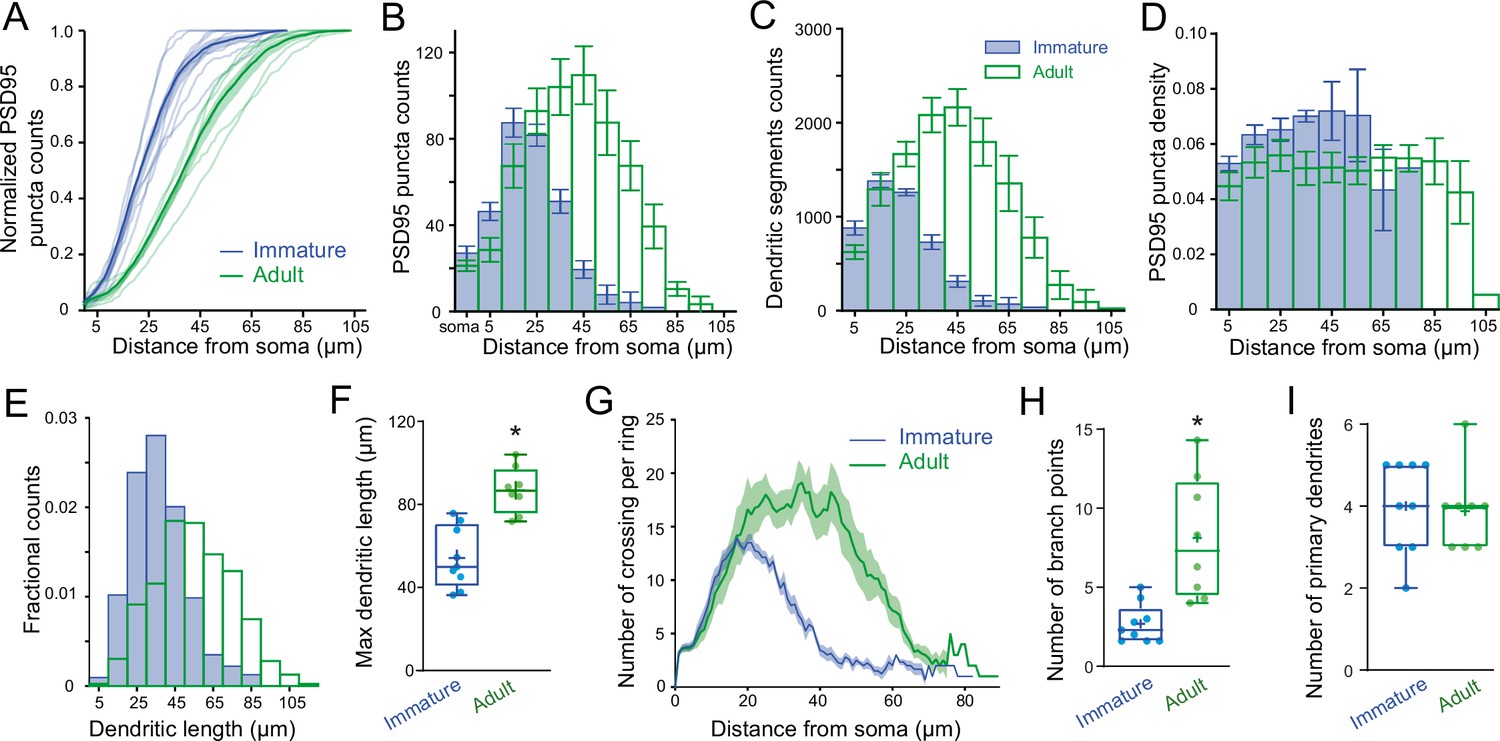
PSD95 puncta distribution and morphological analysis of immature and adult stellate cell (SC).
(A) Cumulative plot showing Venus-tagged PSD95 puncta distributions for nine immature (blue) and eight adult (green) SCs. The bold trace is the population average (shaded region indicates SEM), showing a significant difference between immature and adult distributions (Kolmogorov–Smirnov test p < 0.0001). (B) Superimposed histograms of the mean PSD95 puncta count on the soma and dendrites of immature (blue) and adult (green) SC with a 10 μm increment (Pearson’s median skewness: 0.38 vs. −0.1). (C) Superimposed histograms of the average dendritic segment count (segment length of 100 nm) for immature (blue) and adult (green) SCs (Pearson’s median skewness: 0.32 vs. −0.08). (D) Dendritic mean PSD95 puncta density as a function of distance estimated from B and C (for all p > 0.05 except at 5 μm; MW test). (E) Superimposed histograms of the dendritic segment length (measured as the distance from the tip of dendrites to the soma) for immature (n = 314 dendrites, blue) and adult (n = 854 dendrites, green) SCs. (F) Summary box and whisker plot showing the maximal dendritic length per neuron for immature and adult SCs. Filled circles represent individual cells (asterisks denote p < 0.05; p = 6.0e−4). (G) Sholl analysis showing increased arbor complexity with development. (H) Summary box and whisker plot showing the number of branch points per primary dendrites for immature and adult SCs. Branches were defined as dendritic branches from primary dendrites that were longer than 10 μm. Superimposed filled circle represents individual cells (p = 0.0011). (I) Summary box and whisker plot showing the number of primary dendrites arising from the soma of immature and adult SCs, with filled circles representing individual cells (p = 0.6833). See Figure 6—source data 1.
-
Figure 6—source data 1
PSD95 puncta distribution and morphological analysis of immature and adult SC.
- https://cdn.elifesciences.org/articles/65954/elife-65954-fig6-data1-v1.xlsx
Figure 7
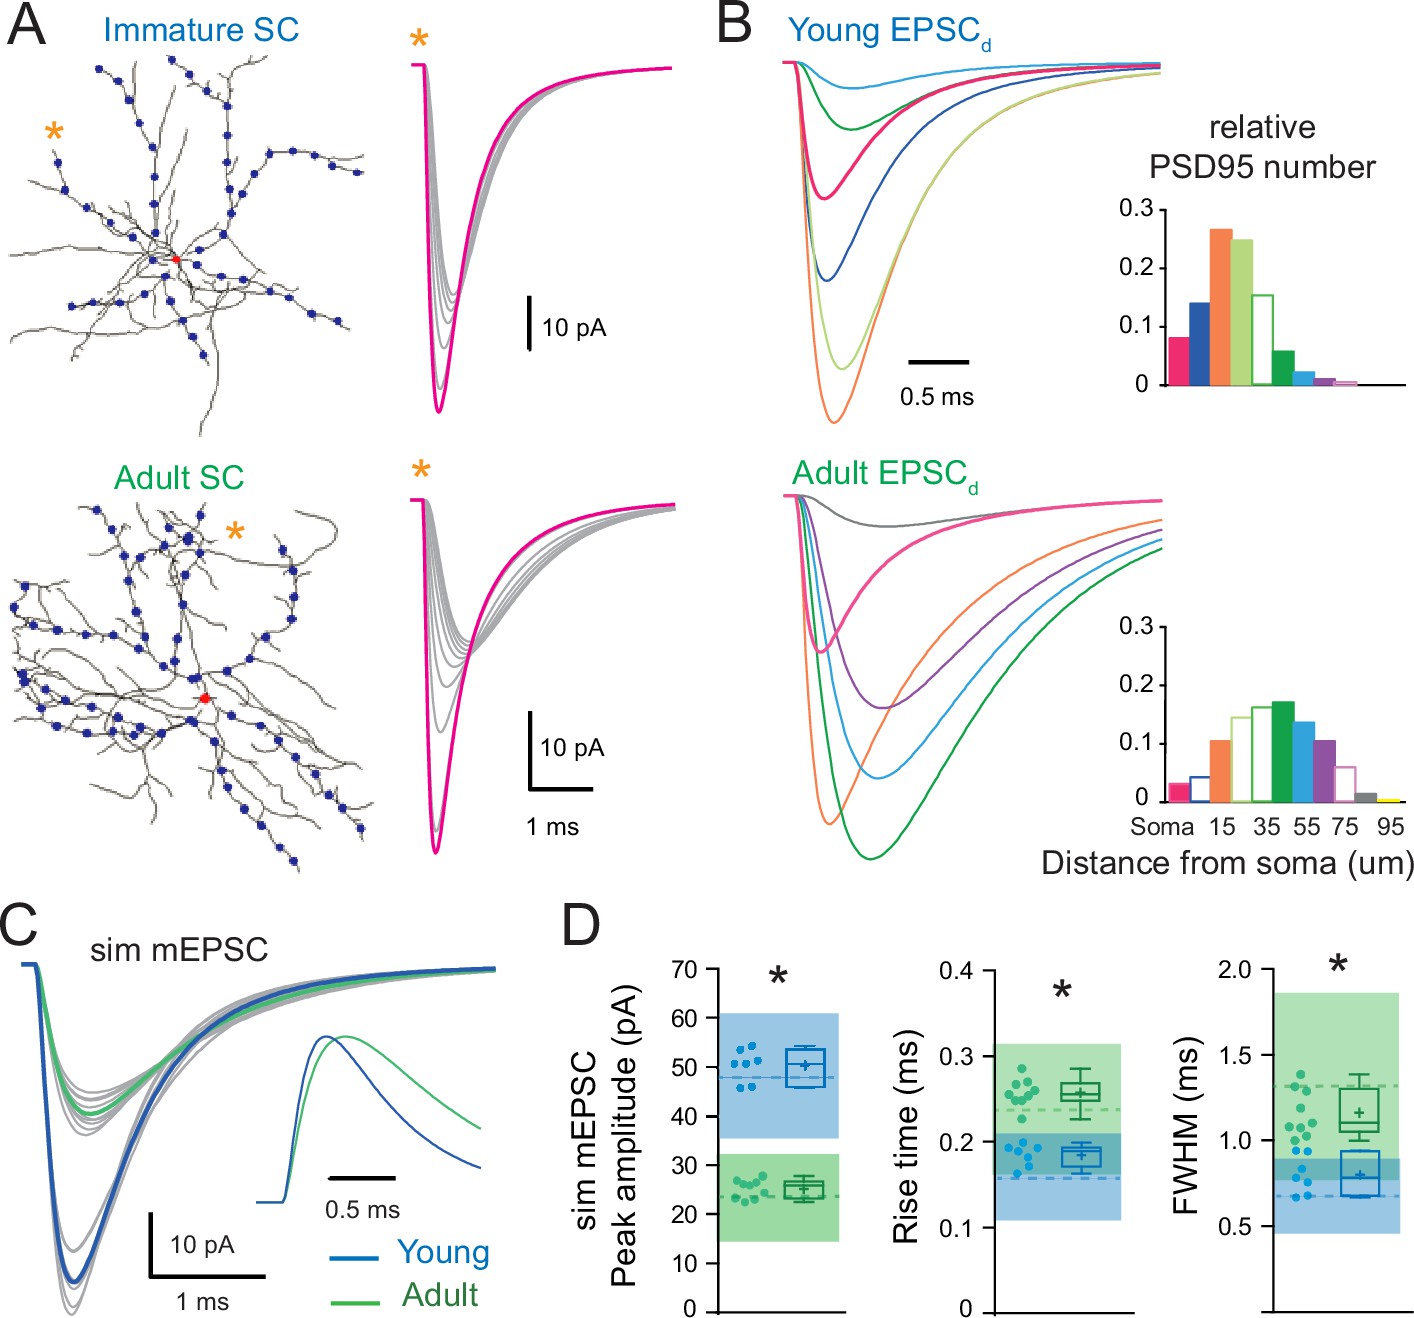
The developmental change in synaptic distribution recapitulates the developmental change in miniature excitatory postsynaptic current (mEPSC) properties.
(A) Numerical simulations of somatic and dendritic quantal excitatory postsynaptic currents (qEPSCs) for synapses placed on the soma (red dot) and at 10 μm intervals (blue dots) along seven of the longest dendrites of a reconstructed immature (P16; top) and nine of the longest dendrites of a reconstructed adult (P42; bottom) stellate cell (SC) (with Cm = 0.9 pF/cm2, Rm = 20,000 Ω.cm2, and Ri = 150 ± 50 Ωcm). The right panel shows an example of qEPSC for somatic (magenta) and dendritic (gray traces) synapses along a single dendrite labeled with an asterisk. The synaptic quantal conductances gsyn were set to reproduce the experimental qEPSCs when stimulating somatic synapses at both ages. (B) Shows simulated qEPSCs elicited at different distances from the soma that are weighted by the relative frequency of the synapse distances (qEPSCds) extracted from the histogram to the right (derived from Figure 6B). For clarity, only a subset of normalized qEPSCds are displayed with a different color for somatic and each 10 μm dendritic segments and correspond to solid bars in the histogram. (C) Superimposed mEPSC waveforms obtained from the weighted average of qEPSC for each dendrite (gray) and the corresponding averaged simulated mEPSC (bold) for the immature (P17, blue trace) and adult (P44, green trace) SC reconstructions. Inset: traces normalized to their peak. (D) Summary box and whisker plots showing the median (line) peak amplitude, 10–90% rise time and decay, the 25th and 75th percentile (box), range (whiskers), and mean (+) of the sim mEPSC for the immature (blue) and adult (green) SCs. Individual dendritic mEPSCs are illustrated with filled circles (asterisks denote p < 0.05; with p = 0.0002, p < 0.0001, and p = 0.0002, respectively). The dotted line shows the experimental mEPSC average values ±1 SD (shaded region). See Figure 7—source data 1.
-
Figure 7—source data 1
The developmental change in synaptic distribution recapitulates the developmental change in mEPSC properties.
- https://cdn.elifesciences.org/articles/65954/elife-65954-fig7-data1-v1.xlsx
Figure 8
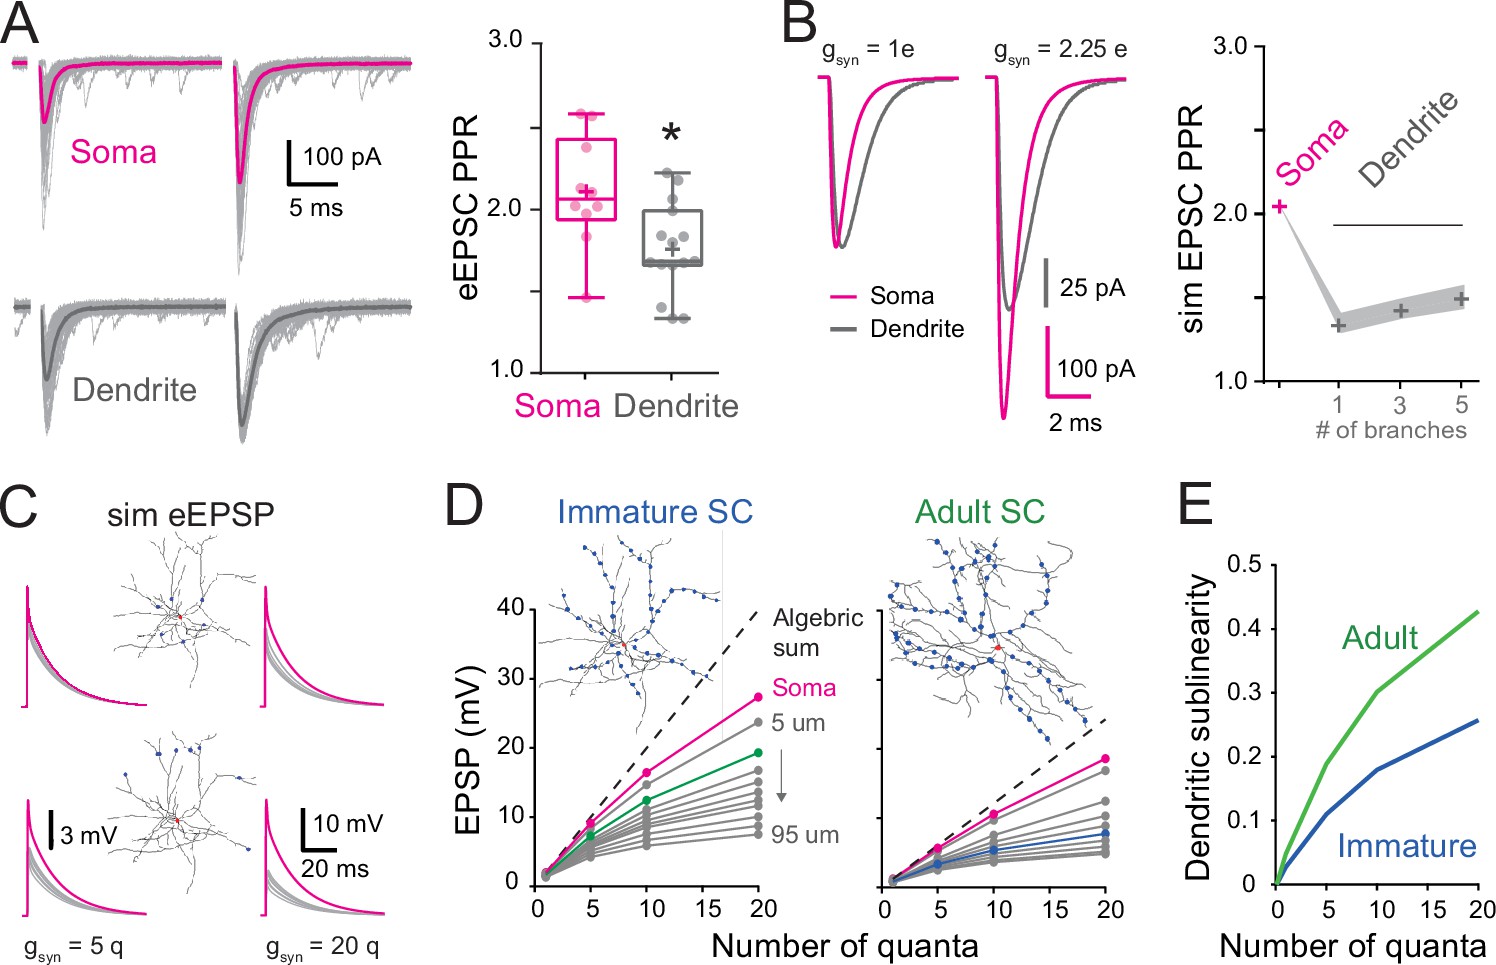
Location dependence of short-term plasticity and sublinear behavior in immature stellate cell (SC).
(A) Single-trial excitatory postsynaptic current responses (eEPSCs, gray) and their corresponding average (bold) evoked by a pair of electrical stimuli (at 50 Hz).The stimulation electrode was placed above the soma (magenta) or on the distal portion of an isolated dendrite (gray). Right: summary box and whisker plot of paired-pulse ratio of eEPSC amplitudes (paired-pulse ratio [PPR] = eEPSC2/eEPSC1) for somatic synapses (n = 10) and dendritic synapses (n = 15). The PPR ratio was assessed from recordings where the first EPSC had an amplitude inferior to 400 pA and had a failure rate below 30 % (for somatic synapses, Amp = 239.4 ± 32 pA with a half-width = 0.88 ± 0.07 ms, n = 10). Superimposed filled circles represent individual cells (asterisks denote p < 0.05; p = 1.82e−2). (B) Numerical simulations of paired-pulse facilitation of eEPSCs using the idealized SC model (Figure 2C). Simulated eEPSCs for somatic (magenta) and dendritic (gray) synapses are superimposed, showing a lower dendrite PPR. To simulate eEPSC1, the gsyn from Figure 2C was scaled to match the mean recorded eEPSC amplitude. The simulation of eEPSC2 was further scaled by a factor of 2.25. Right: summary plot showing the simulated PPR at the soma (magenta cross) and the lack of influence of a variable number of dendritic branches (gray crosses). Shaded region indicates simulations with a Ri of 100–200 Ωcm. (C) Simulated evoked EPSP (sim eEPSP) under current-clamp conditions for synapses at the soma (magenta) and at 20 or 60 μm on dendrites (gray) of a reconstructed immature SC. The gsyn peak amplitude was set to simulate 5 or 20 quanta. (D) Subthreshold input–output relationship obtained by plotting the average peak sim eEPSP amplitude for an increasing number of quanta versus the algebraic sum of the sim eEPSPs for a reconstructed immature (left; from Figure 7A) and adult (right; from Figure 7A) SC. The dotted black line has a slope of 1. The circles indicate sim eEPSP resulting from a gsyn peak amplitude of 1, 5, 10, and 20 quanta. (E) Summary plot showing dendritic sublinearity (1 − (dendritic EPSP amp/soma EPSP amp) with EPSP converted to number of quanta) as a function of the number of quanta for reconstructed immature (blue) and adult (green) SCs. See Figure 8—source data 1.
-
Figure 8—source data 1
Location dependence of short-term plasticity and sublinear behavior in immature SC.
- https://cdn.elifesciences.org/articles/65954/elife-65954-fig8-data1-v1.xlsx
Tables
Key resources table
| Reagent type (species) or resource | Designation | Source or reference | Identifiers | Additional information |
|---|---|---|---|---|
| Strain, strain background (Mus musculus – male and female) | CB6F1 | Mouse Genome Informatics | RRID:MGI:5649749 | |
| Strain, strain background (Mus musculus – male and female) | PSD-95-CreNABLED mice | Haining Zhong, Vollum Institute | DOI: https://doi.org/10.1523/JNEUROSCI.3888-14.2014 | |
| Strain, strain background (Mus musculus – male and female) | B6.129-Nos1tm1(cre)Mgmj/J | Mouse Genome Informatics | https://www.jax.org/strain/017526 | |
| Chemical compound, drug | Gabazine (SR-95531) | Abcam | Cat#:ab120042 | |
| Chemical compound, drug | QX-314 | Abcam | Cat#:ab120118 | |
| Chemical compound, drug | 7-Chlorokynurenic acid | Abcam | Cat#:ab120255 | |
| Chemical compound, drug | Alexa Fluor 488 | ThermoFisher Scientific | Cat#:A10436 | |
| Chemical compound, drug | Alexa Fluor 594 | ThermoFisher Scientific | Cat#:A10438 | |
| Chemical compound, drug | D-AP5 | Abcam | Cat#:ab120003 | |
| Chemical compound, drug | Gamma DGG | Abcam | Cat#:ab120307 | |
| Chemical compound, drug | TTX | Abcam | Cat#:Ab120055 | |
| Chemical compound, drug | Strychnine | Sigma | Cat#:S0532 | |
| Software, algorithm | Reconstruct | JC Fiala | DOI: 10.1111 /j.1365–2818.2005.01466 .x | |
| Software, algorithm | Igor Pro | Wavemetrics | RRID:SCR_000325 | |
| Software, algorithm | Neuromatic | Rothman and Silver, 2018; DOI:10.3389 | RRID:SCR_004186 | |
| Software, algorithm | GraphPad Prism 6 | GraphPad Software | RRID:SCR_002798 | |
| Software, algorithm | ImageJ | National Institutes of Health | RRID:SCR_003070 | |
| Software, algorithm | Imaris | Bitplane Imaris Software | RRID:SCR_007370 | |
| Software, algorithm | Zeiss Atlas | Zeiss | https://www.zeiss.com/microscopy/int/products/microscope-software/atlas.html |
Additional files
Download links
A two-part list of links to download the article, or parts of the article, in various formats.
Downloads (link to download the article as PDF)
Open citations (links to open the citations from this article in various online reference manager services)
Cite this article (links to download the citations from this article in formats compatible with various reference manager tools)
Developmental emergence of two-stage nonlinear synaptic integration in cerebellar interneurons
eLife 10:e65954.
https://doi.org/10.7554/eLife.65954


