Species-specific sensitivity to TGFβ signaling and changes to the Mmp13 promoter underlie avian jaw development and evolution
- Department of Orthopaedic Surgery, University of California, San Francisco, United States
Figures
Figure 1 with 1 supplement
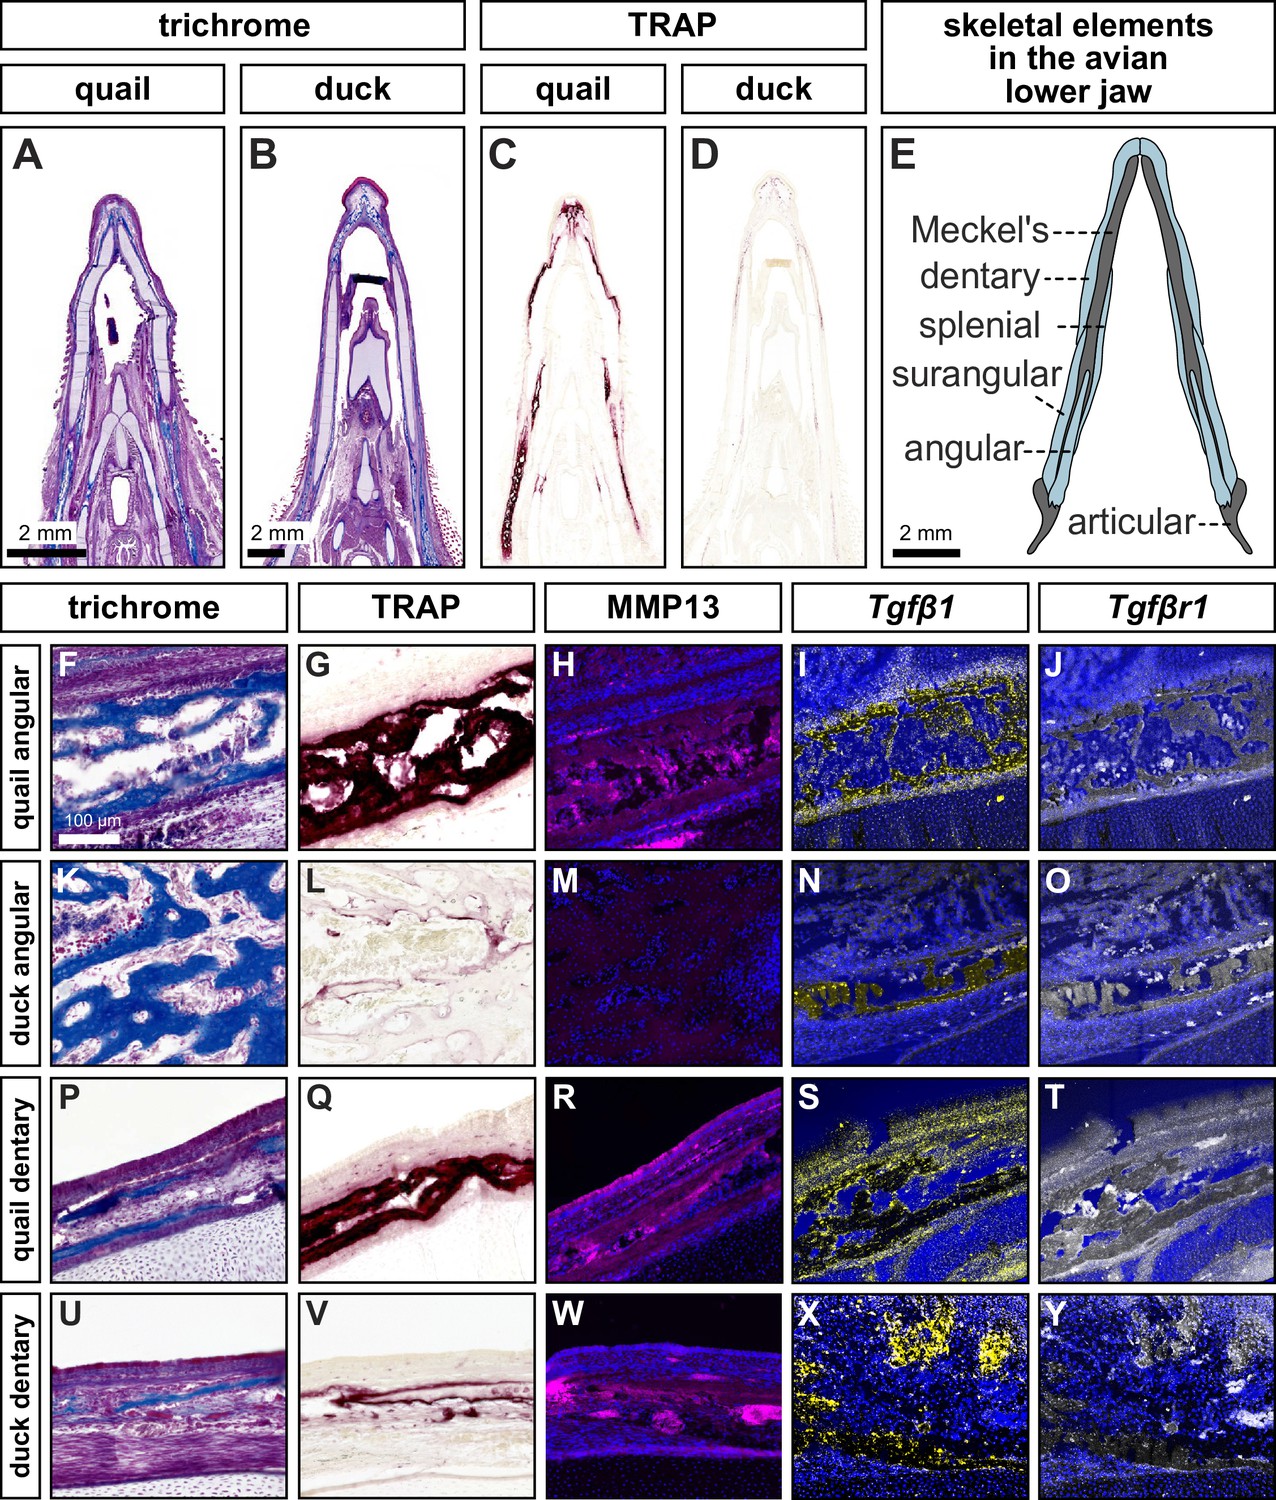
Species-specific differences in spatial domains and levels of TRAP, MMP13, Tgfβ1, and Tgfβr1.
Sections of lower jaws stained with trichrome (osteoid matrix of bone is blue) in (A) quail (n=4) versus (B) duck (n=4) at HH40. (C) Adjacent sections stained for TRAP activity (red) reveal more robust bone resorption in quail versus (D) duck. (E) Schematic of bones within the avian lower jaw. Adjacent sections through the more proximal angular bone stained with (F) trichrome, (G) TRAP, (H) MMP13 antibody (pink) and cell nuclei (blue), (I) Tgfβ1 probe (yellow), and (J) Tgfβr1 probe (white) in quail. Angular bone stained with (K) trichrome, (L) TRAP, (M) MMP13 antibody, (N) Tgfβ1 probe, and (O) Tgfβr1 probe reveals substantially less bone resorption in duck. Adjacent sections through the more distal dentary bone stained with (P) trichrome, (Q) TRAP, (R) MMP13 antibody, (S) Tgfβ1 probe, (T) and Tgfβr1 probe in quail. Dentary bone stained with (U) trichrome, (V) TRAP, (W) MMP13 antibody, (X) Tgfβ1 probe, and (Y) Tgfβr1 probe reveals more bone resorption in the dentary versus the angular bone of duck but still less bone resorption overall compared to that observed in quail.
Figure 1—figure supplement 1
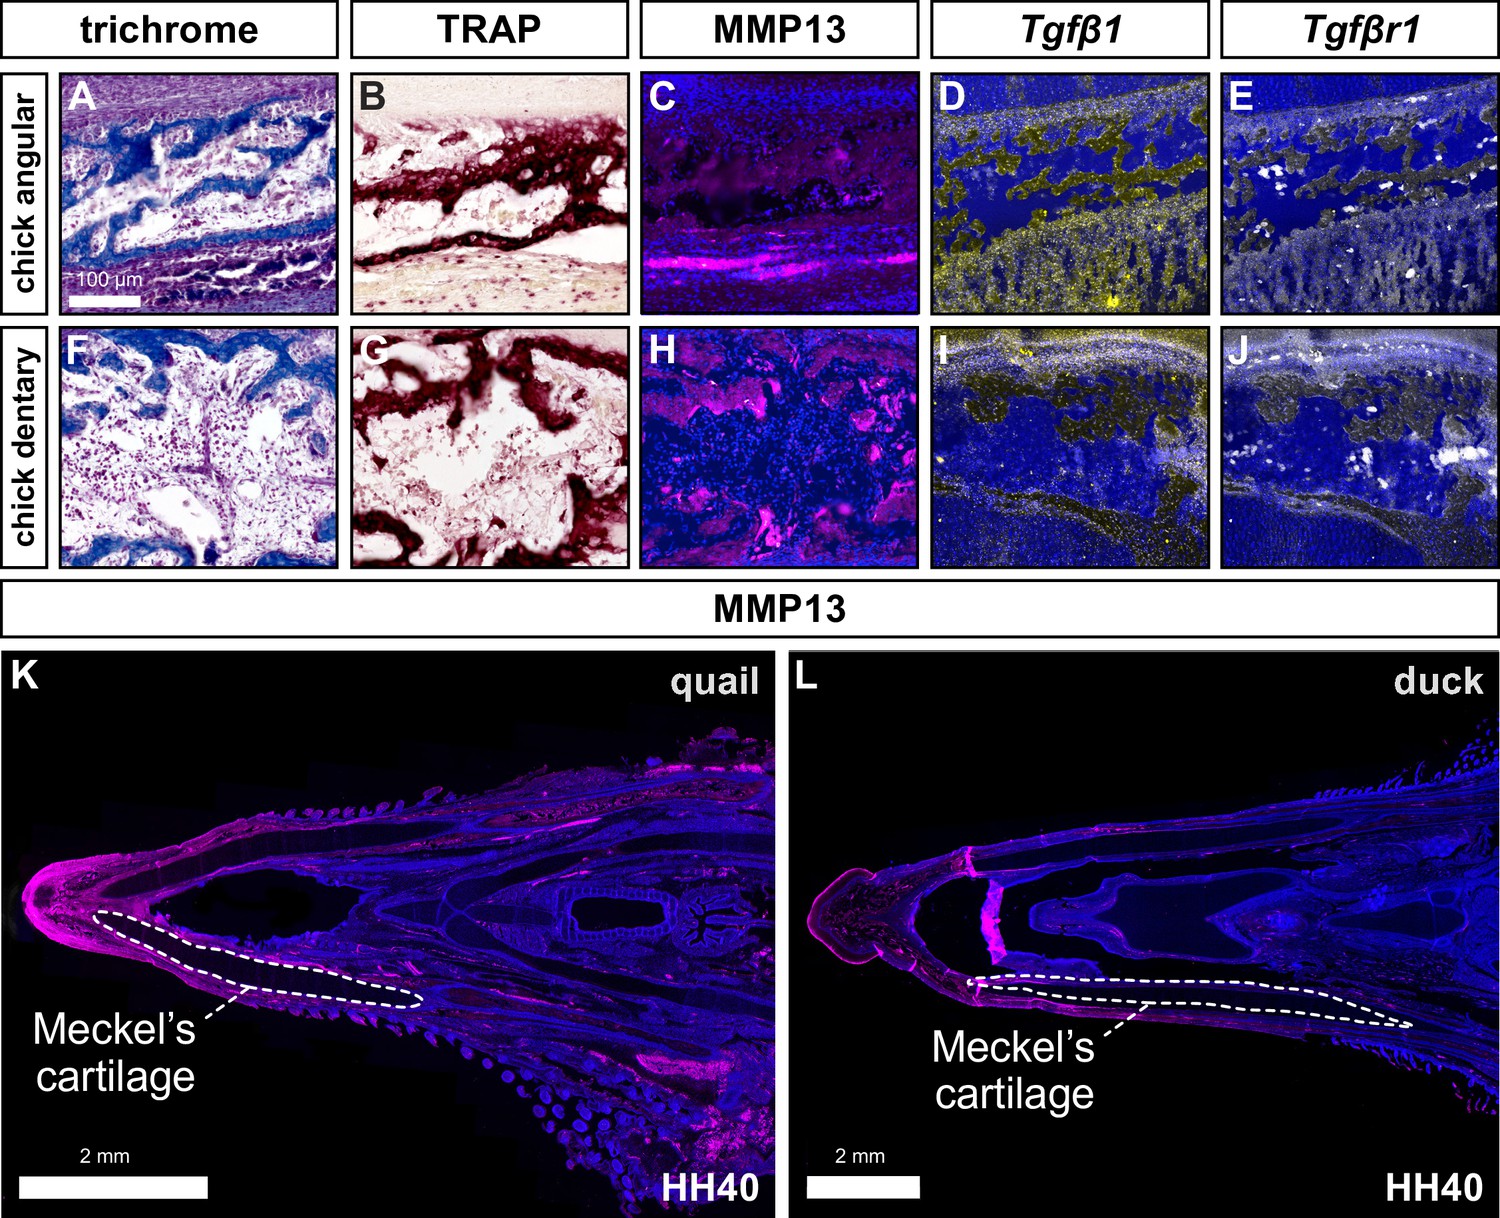
Levels of TRAP activity, MMP13, Tgfβ1, and Tgfβr1 expression in chick.
Adjacent sections of lower jaws in chick (n=4), stained for trichrome, TRAP (red), MMP13 (pink), Tgfβ1 (yellow), and Tgfβr1 (white). (A) Adjacent sections through the more proximal angular bone stained with trichrome, (B) TRAP, (C) MMP13 antibody and Hoechst dye (blue) (D) Tgfβ1 probes, and (E) Tgfβr1 probes. (F) Adjacent sections through the more distal dentary bone stained with (G) trichrome, (H) TRAP, (I) MMP13 antibody, (J) Tgfβ1 probes, (K) and Tgfβr1 probes. Lower magnification image of a section through (L) a quail lower jaw at HH40 with high levels of MMP13 protein labeled in bone (pink) and some other connective tissues but not cartilage (i.e. white-dashed line around Meckel’s cartilage). (K) Duck lower jaws show more restricted domains of labeling with the MMP13 antibody (pink).
Figure 2 with 4 supplements
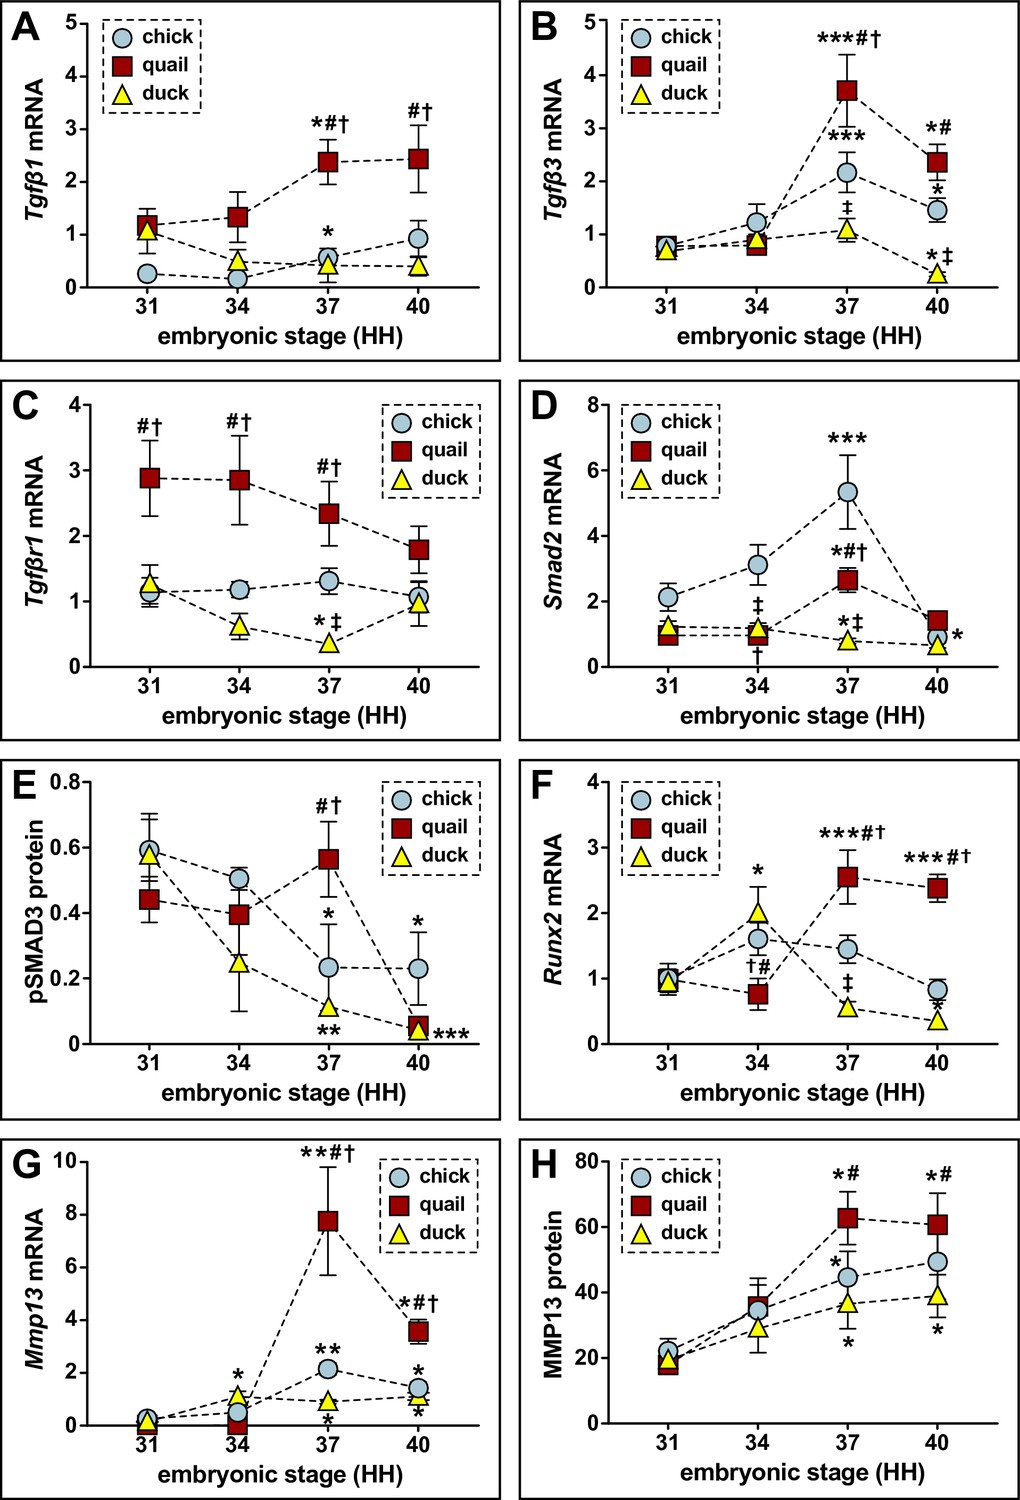
Relative mRNA and protein levels of TGFβ pathway members and targets in the developing lower jaws of chick, quail, and duck.
(A) qPCR analyses show that Tgfβ1 mRNA increases in chick (blue circles, n=8) and in quail (red squares, n=8) at HH37 and does not change in duck (yellow triangles, n=10) in later developmental stages; Tgfβ1 is higher in quail than chick or duck at HH37. (B) Tgfβ3 mRNA increases in chick and in quail at HH37, while duck levels decrease by HH40. Chick and quail have higher Tgfβ3 at HH37 compared to duck. (C) Tgfβr1 mRNA remains constant for chick and quail, whereas duck decrease at HH37. Quail maintain higher levels of Tgfβr1 from HH31 to HH37 relative to chick and duck. (D) Smad2 mRNA increases in chick and in quail at HH37, whereas duck levels decrease. At HH40, chick and quail robustly decrease compared to HH37. (E) Western blots show pSMAD3 protein levels are elevated in quail (n=12) at HH37. Duck (n=12) levels decrease over time, while chick (n=9) levels decrease at HH37 and HH40 compared to HH31. Quail have higher levels at HH37 than duck. (F) Runx2 mRNA increases in quail at HH37 and remains elevated at HH40, whereas duck increase at HH34 and then trend downward from HH37 to HH40. Chick Runx2 does not change. (G) Mmp13 mRNA increases in chick and in quail at HH37, whereas duck increase at HH34 and remains elevated until HH40. (H) MMP13 protein increases in chick, in quail, and in duck at HH37 and remains elevated at HH40. p≤0.05 and * denotes significance from HH31 within each group, # denotes significance between quail and duck at same stage, † denotes significance between chick and quail, and ‡ denotes significance between chick and duck.
Figure 2—figure supplement 1

Relative mRNA levels of TGFβ pathway members and targets in lower jaws of chick, quail, and duck.
(A) qPCR analyses reveal Tgfβ2 expression does not change in chick (blue circles; n=8) and quail (red squares; n=8) over time; however, in duck (yellow triangles; n=10), there is a decrease at HH37 and HH40; Tgfβ2 is higher in duck than chick or quail at HH31. (B) Acvrl1 does not change over time in chick; however, quail show an increase at HH37. There is a reduction in duck at HH40. Duck have higher Acvrl1 at HH34 compared to chick and quail. However, at HH37 and HH40, quail have more Acvrl1 compared to chick or duck. (C) Tgfβr2 does not change over time in chick or duck, but in quail, there is an induction at HH37. (D) Tgfβr3 does not change over time in chick, quail, or duck. (E) Smad3 in chick does not change until HH40 with a reduction. In quail and duck, Smad3 decreases at HH37 and continues to decrease for duck at HH40. Smad3 is higher in chick than quail at HH34 and is higher at HH37 compared to quail and duck. (F) Pai1 does not change over time in chick, but quail increase at HH37 and HH40, while duck decrease at the same time points. Duck Pai1 is higher at HH31 and HH34 compared to chick and quail, but at HH37 and HH40 quail it is significantly higher compared to chick and duck. (G) Mmp2 increases in chick and quail at HH37, whereas duck decrease at HH40. Chick have higher Mmp2 compared to duck at HH34 and HH37. Quail have higher Mmp2 compared to duck at HH37 and HH40. (H) Mmp9 increases in chick, quail, and duck at HH37. Quail have more Mmp9 compared to chick and duck at HH37 and HH40. p≤0.05 and * denotes significance from HH31 within each group, # denotes significance between quail and duck at same stage, † denotes significance between chick and quail, and ‡ denotes significance between chick and duck.
Figure 2—figure supplement 2
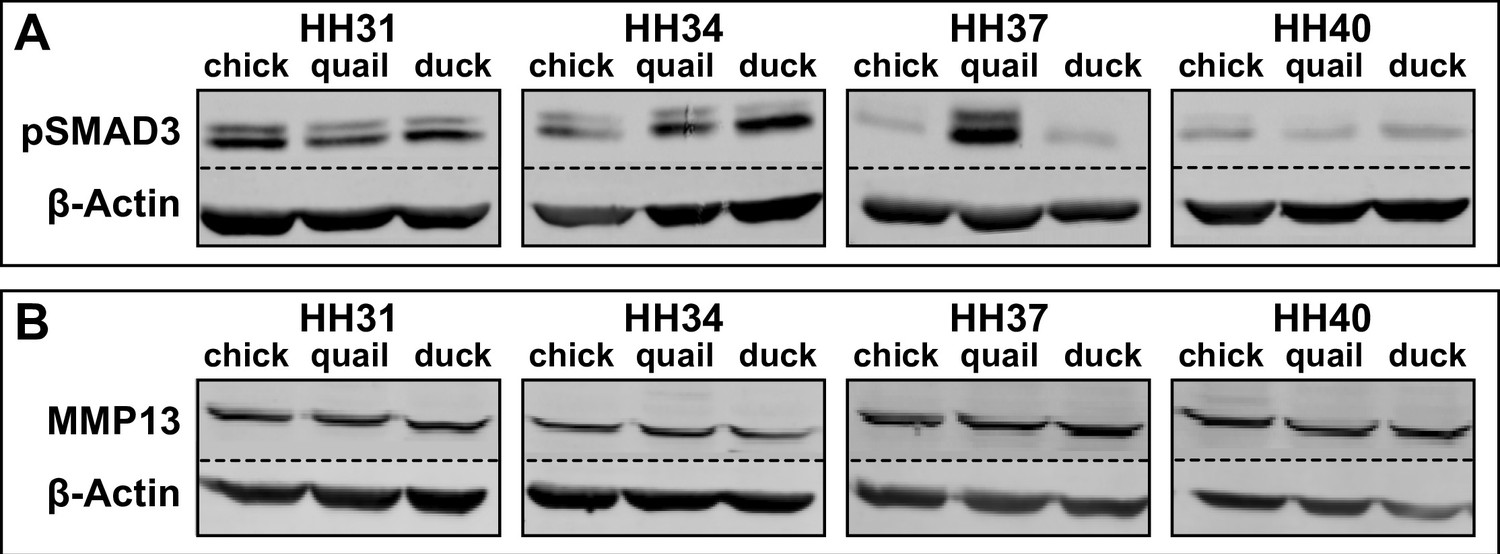
Representative western blot images.
Protein levels for (A) phosphorylated (p) SMAD3 (50 kDa) and (B) MMP13 (54 kDa) in chick (n=9), quail (n=12), and duck (n=12) jaws from stages HH31 to HH40 with β-Actin (42 kDa) as a loading control. Dashed lines represent images taken from two separate fluorescent channels on the same gel, 680RD for β-Actin, and 800CW for pSMAD3 or MMP13.
-
Figure 2—figure supplement 2—source data 1
Western blot images for phosphorylated SMAD and β-Actin.
- https://cdn.elifesciences.org/articles/66005/elife-66005-fig2-figsupp2-data1-v2.pdf
-
Figure 2—figure supplement 2—source data 2
Western blot images for MMP13 and β-Actin.
- https://cdn.elifesciences.org/articles/66005/elife-66005-fig2-figsupp2-data2-v2.pdf
Figure 2—figure supplement 3

Relative mRNA levels for markers of bone remodeling in the developing lower jaws of chick, quail, and duck.
(A) qPCR analyses reveal Mmp14 expression does not change in chick (n=8) and quail (n=8), or duck (n=10). (B) Ctsk increases in chick and quail at HH37. There is no change in duck. There is higher expression in quail compared to duck at HH37. (C) Sost increases in chick and quail at HH37. Duck Sost does not change over time. Chick and quail have higher Sost at HH37 and HH40 compared to duck at comparable stages. p≤0.05 and * denotes significance from HH31 within each group, # denotes significance between quail and duck at same stage, † denotes significance between chick and quail, and ‡ denotes significance between chick and duck.
Figure 2—figure supplement 4
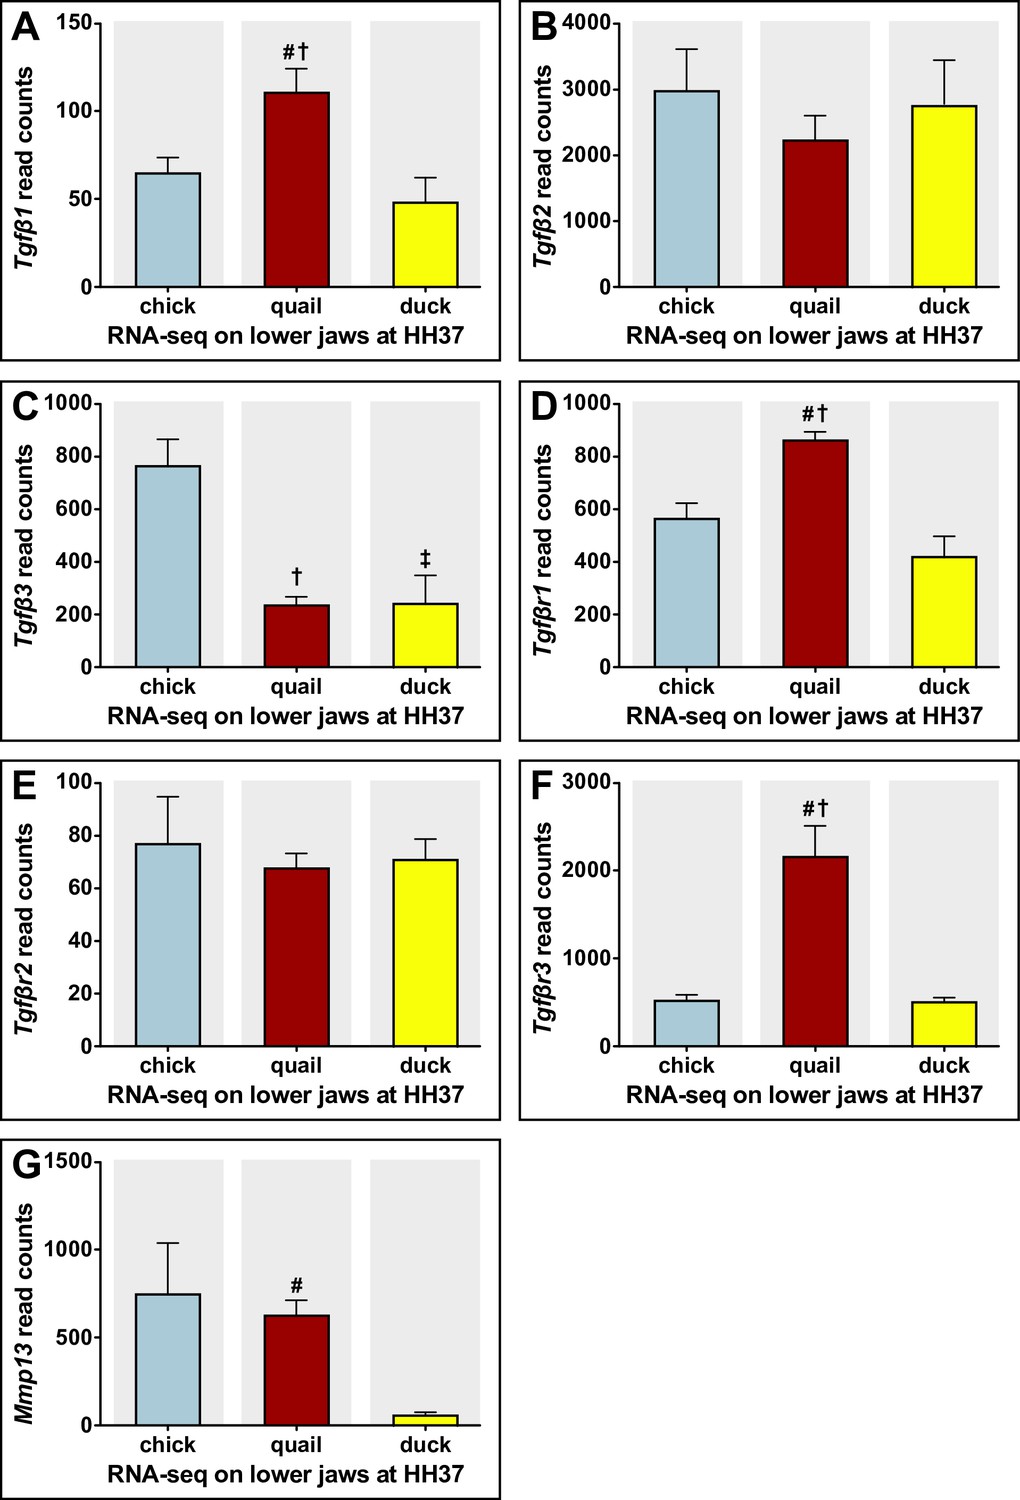
RNA sequencing analysis of TGFβ pathway members in the lower jaws of chick, quail, and duck at HH37.
Normalized read counts for (A) Tgfβ1, which is higher in quail (n=2) compared to chick (n=2) and duck (n=2). (B) Tgfβ2 is not different among chick, quail, and duck. (C) Tgfβ3 is higher in chick compared to quail and duck. (D) Tgfβr1 is higher in quail compared to chick and duck. (E) Tgfβr2 is not different among chick, quail, and duck. (F) Tgfβr3 is higher in quail compared to chick and duck. (G) Mmp13 is higher in quail compared to duck. p≤0.05 and # denotes significance between quail and duck, † denotes significance between chick and quail, and ‡ denotes significance between chick and duck.
Figure 3 with 3 supplements

Sensitivity of chick and duck cells to rTGFβ1 and effects of TGFβR1 and SMAD3 inhibition on RUNX2 and MMP13.
(A) pSMAD3 protein levels in cells treated for 2 hr with 5 ng/ml rTGFβ1 (dark gray) in chick (blue) and duck (yellow) cells show a significant induction in chick (n=8). (B) Chick and duck cells treated with rTGFβ1 for 1–24 hr. Chick Runx2 mRNA increases with rTGFβ1 treatment at 3 and 6 hr and at 24 hr, while duck Runx2 does not increase until 24 hr. In rTGFβ1 treated cells, duck have significantly lower Runx2 at every time point compared to chick (n=8). (C) Chick Mmp13 mRNA increases with rTGFβ1 treatment at 6 hr and at 24 hr, while duck Runx2 does not increase until 24 hr. In rTGFβ1 treated cells, duck have lower Mmp13 at every time point compared to chick (n=8). (D) MMP13 protein in cells treated for 24 hr with rTGFβ1 shows an induction in chick but no response in duck (n=8). (E) RUNX2 protein levels in chick cells treated for 24 hr with rTGFβ1 (dark gray), TGFβR1 inhibitor (medium gray), a combination of both rTGFβ1 and TGFβR1 inhibitor (black), SMAD3 inhibitor (white), and a combination of both rTGFβ1 and SMAD3 inhibitor (light gray). RUNX2 protein increases with rTGFβ1, but when rTGFβ1 is combined with either a TGFβr1 or a SMAD3 inhibitor, there is a significant decrease compared to rTGFβ1 alone (n=12). (F) MMP13 protein increases with rTGFβ1 treatment, but when rTGFβ1 is combined with either a TGFβR1 or a SMAD3 inhibitor, there is a significant decrease compared to rTGFβ1 alone (n=12). * denotes significance from control p≤0.05, ** denotes significance from control p≤0.01, *** denotes significance from control p≤0.001, # denotes significance from rTGFβ1, † denotes significance between chick and quail, and ‡ denotes significance between chick and duck.
Figure 3—figure supplement 1
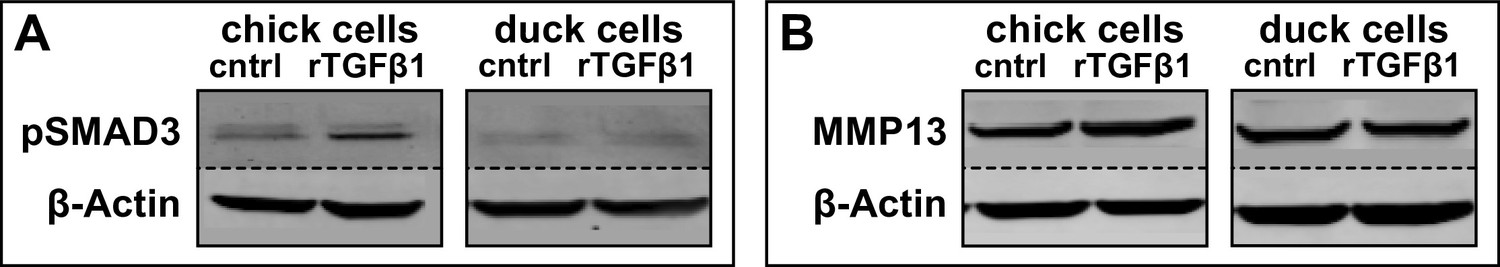
Representative western blot images.
Protein levels for (A) phosphorylated (p) SMAD3 (50 kDa) and (B) MMP13 (54 kDa) in chick (DF-1) and duck (CCL-141) cells treated with 5 ng/ml rTGFβ1 for 2 hr. β-Actin (42 kDa) is used as a loading control (n=8).
-
Figure 3—figure supplement 1—source data 1
Western blot images for pSMAD and β-Actin.
- https://cdn.elifesciences.org/articles/66005/elife-66005-fig3-figsupp1-data1-v2.pdf
-
Figure 3—figure supplement 1—source data 2
Western blot images for MMP13 and β-Actin.
- https://cdn.elifesciences.org/articles/66005/elife-66005-fig3-figsupp1-data2-v2.pdf
Figure 3—figure supplement 2

Sensitivity of chick and duck cells to rTGFβ1 and effects on TGFβ target genes.
A) Pai1 in chick (blue) and duck (yellow) cells treated for 1–24 hr with rTGFβ1 (dark gray). rTGFβ1 induces chick Pai1 mRNA at 24 hr, while duck Pai1 increases at 1 hr and 24 hr (n=8). (B) Mmp2 increases in chick cells following rTGFβ1 treatment at 6 and 24 hr, while in duck cells Mmp2 is induced at 1 and 24 hr (n=8). * denotes significance from HH31 within each group p≤0.05, ** denotes significance from HH31 within each group p≤0.01, # denotes significance between quail and duck at same stage, † denotes significance between chick and quail, and ‡ denotes significance between chick and duck.
Figure 3—figure supplement 3
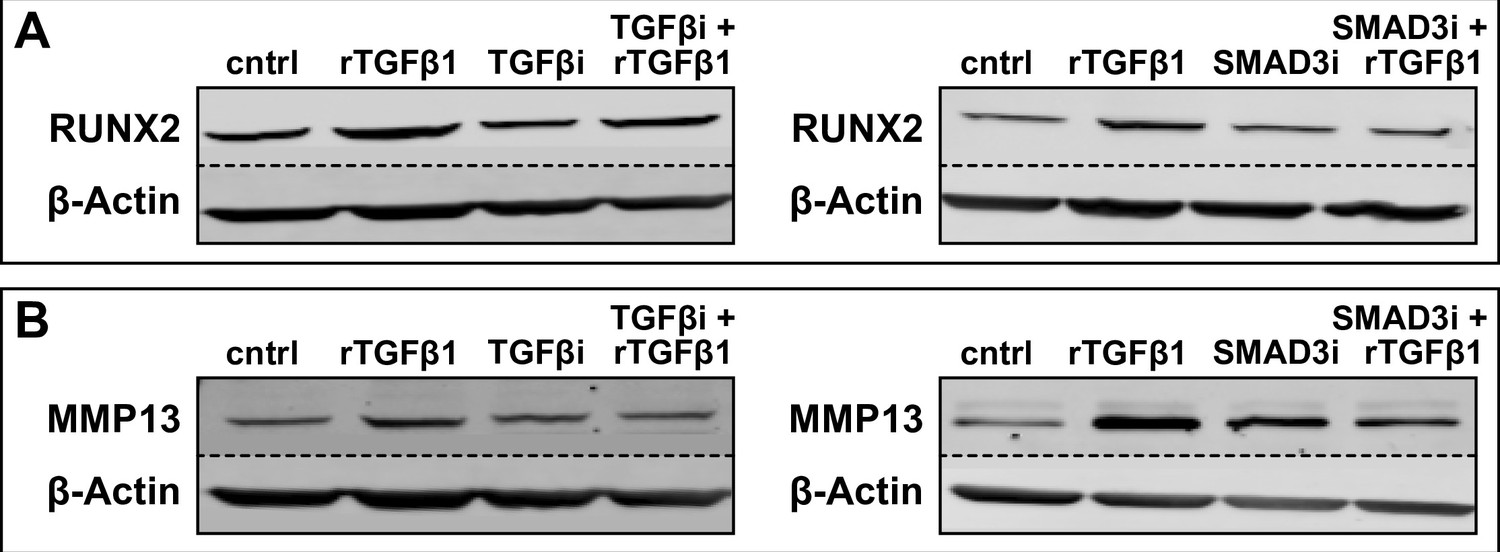
Representative western blot images.
Protein levels for (A) RUNX2 (55 kDa) and (B) MMP13 (54 kDa) in chick cells treated for 24 hr with rTGFβ1, TGFβR1 inhibitor, a combination of both rTGFβ1 and TGFβR1 inhibitor, SMAD3 inhibitor, and a combination of both rTGFβ1 and SMAD3 inhibitor (n=8). β-Actin (42 kDa) is used as a loading control.
-
Figure 3—figure supplement 3—source data 1
Western blot images for RUNX2 and β-Actin.
- https://cdn.elifesciences.org/articles/66005/elife-66005-fig3-figsupp3-data1-v2.pdf
-
Figure 3—figure supplement 3—source data 2
Western blot images for MMP13 and β-Actin.
- https://cdn.elifesciences.org/articles/66005/elife-66005-fig3-figsupp3-data2-v2.pdf
Figure 4 with 2 supplements
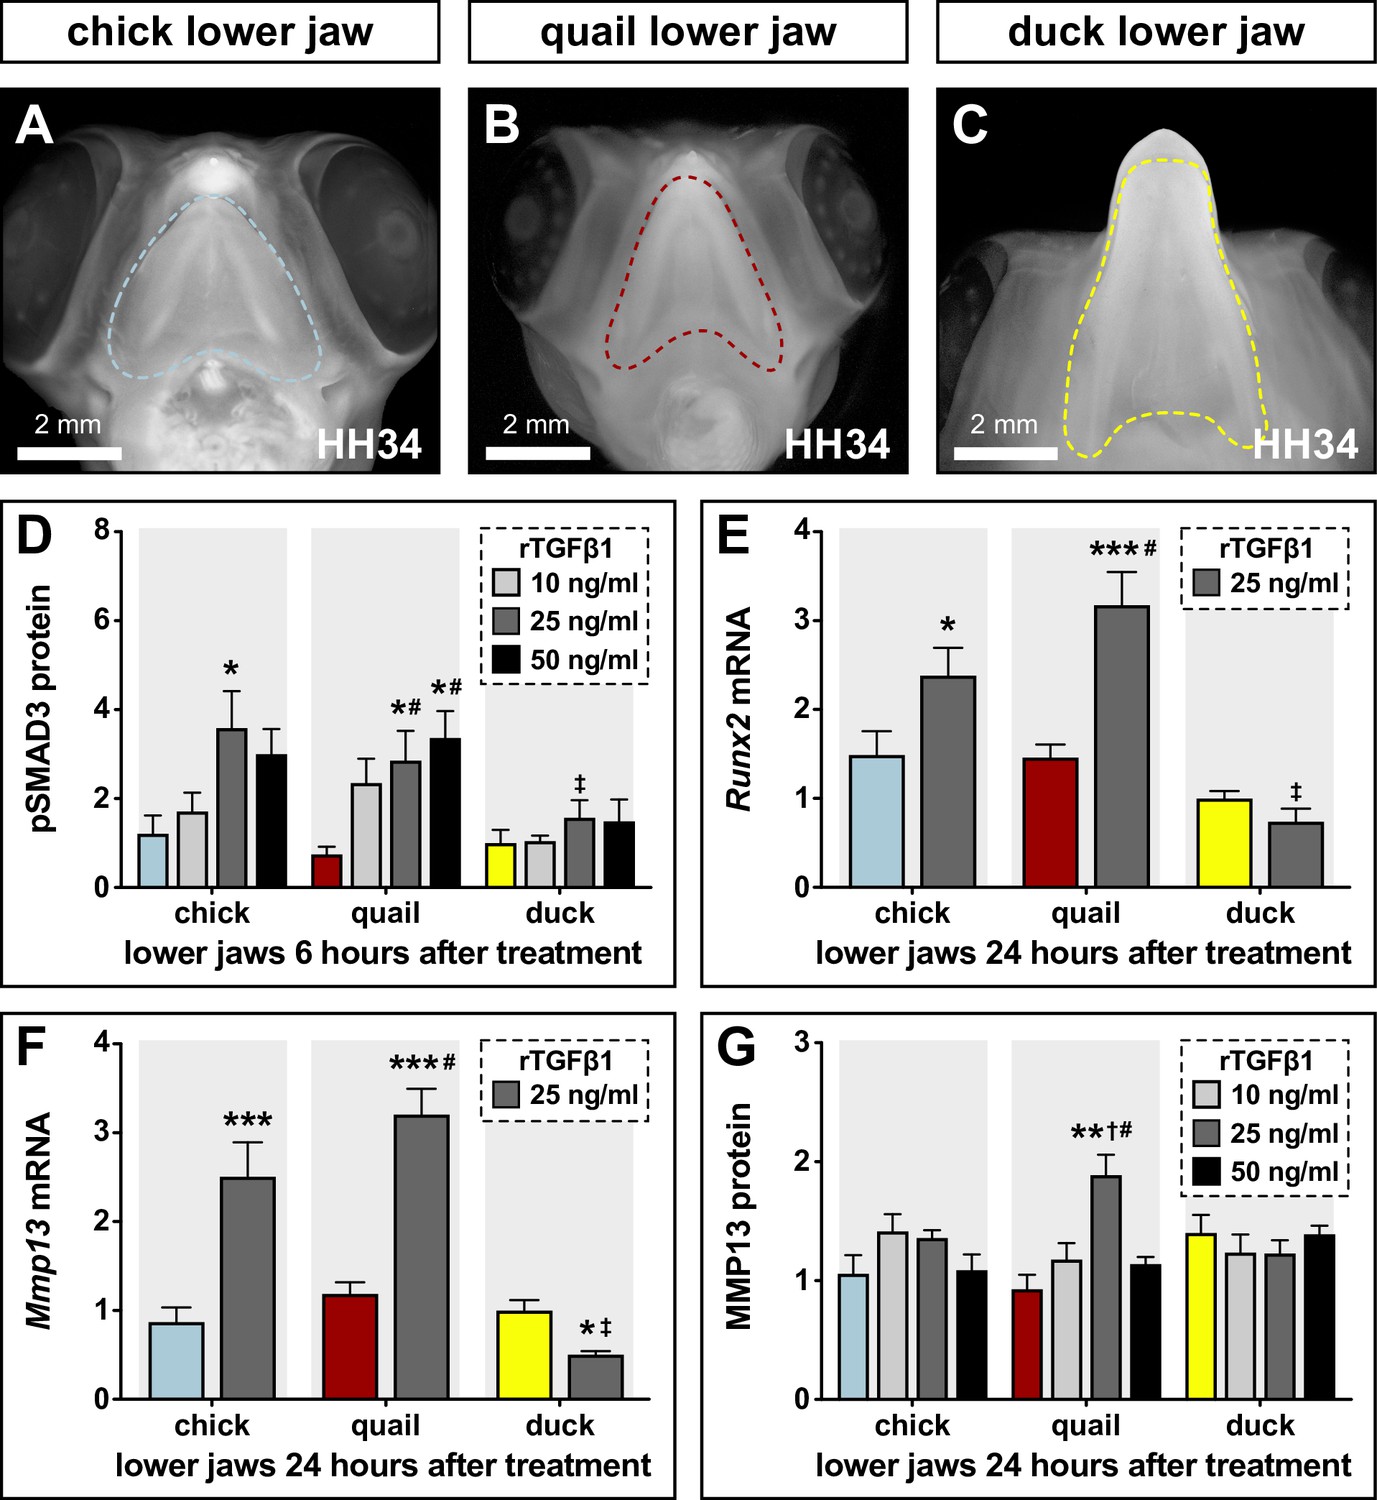
Sensitivity of chick, quail, and duck lower jaws to rTGFβ1 and the effects on RUNX2 and MMP13.
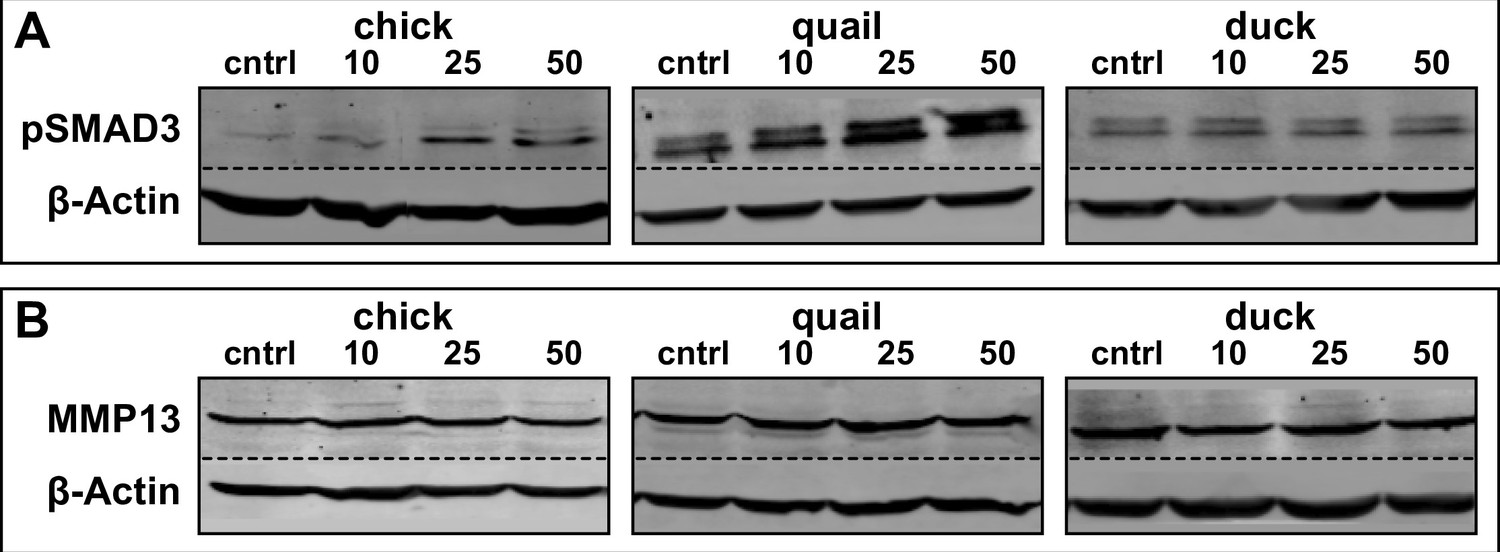
(A) HH34 chick, (B) quail, and (C) duck heads in ventral view showing the boundaries (dashed line) of the lower jaws dissected for analyses and culture experiments. (D) Chick (blue), quail (red), and duck (yellow) lower jaws treated in culture with 10 (medium gray), 25 (dark gray), and 50 (black) ng/ml of rTGFβ1 for 6 hr. pSMAD3 levels increase in chick and in quail at 25 ng/ml, while duck shows no induction. Quail pSMAD3 levels are significantly induced with 50 ng/ml treatment (n=12). (E) Chick, quail, and duck lower jaws treated with 25 ng/ml rTGFβ1 for 24 hr. Runx2 mRNA increases in chick and quail but decreases in duck (n=10). (F) Chick, quail, and duck lower jaws treated with 25 ng/ml rTGFβ1 for 24 hr. Mmp13 increases in chick and quail but decreases in duck (n=10). (G) Chick, quail, and duck lower jaws treated in culture with 10, 25, and 50 ng/ml of rTGFβ1 for 24 hr. MMP13 protein levels show an induction in quail with 25 ng/ml rTGFβ1 but no response in chick or duck. * denotes significance from HH31 within each group p≤0.05, ** denotes significance from HH31 within each group p≤0.01, # denotes significance between quail and duck at same stage, † denotes significance between chick and quail, and ‡ denotes significance between chick and duck.
Figure 4—figure supplement 1
Representative western blot images.
Protein levels for (A) pSMAD3 (50 kDa) and (B) MMP13 (54 kDa) in chick, quail, and duck lower jaws treated in culture with 10, 25, and 50 ng/ml of rTGFβ1 for 6 hr or 24 hr, respectively (n=12). β-Actin (42 kDa) is used as a loading control.
-
Figure 4—figure supplement 1—source data 1
Western blot images for pSMAD and β-Actin.
- https://cdn.elifesciences.org/articles/66005/elife-66005-fig4-figsupp1-data1-v2.pdf
-
Figure 4—figure supplement 1—source data 2
Western blot images for MMP13 and β-Actin.
- https://cdn.elifesciences.org/articles/66005/elife-66005-fig4-figsupp1-data2-v2.pdf
Figure 4—figure supplement 2
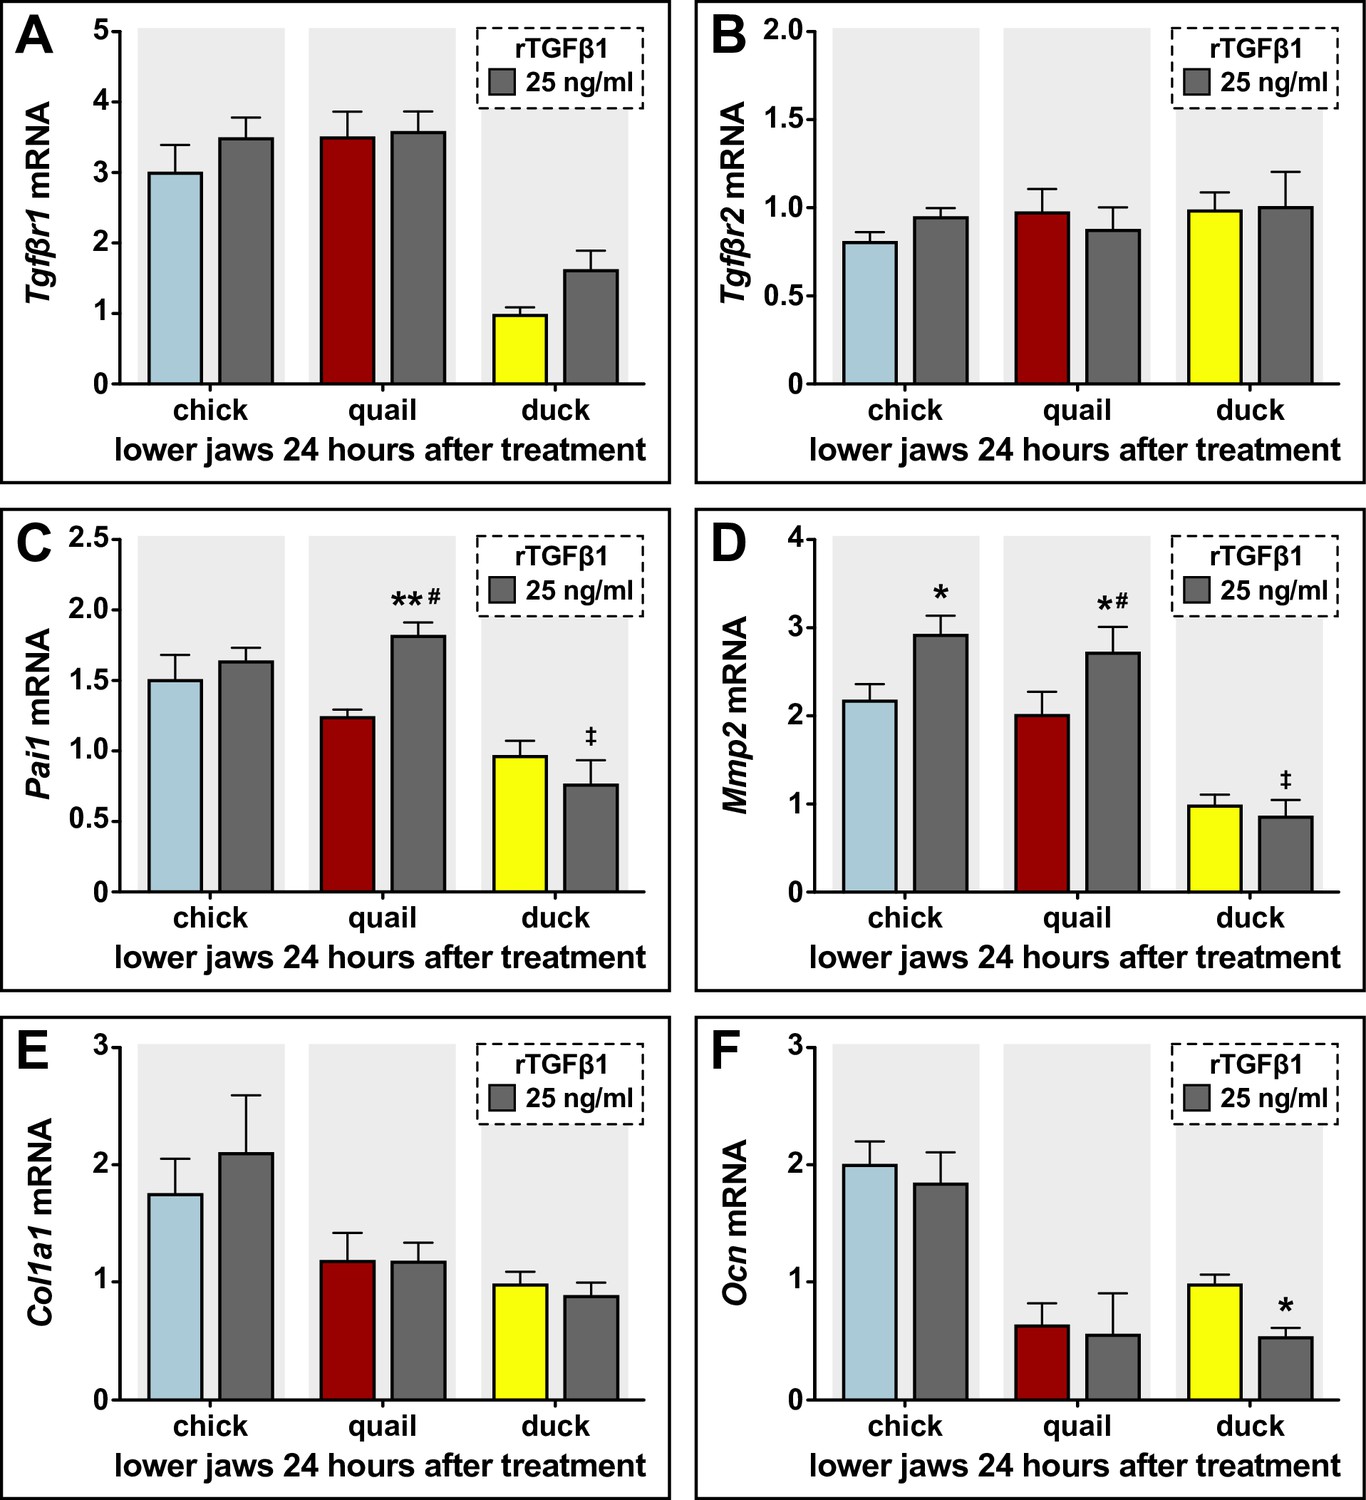
Sensitivity of chick, quail, and duck lower jaws to rTGFβ1 and effects on TGFβ target genes and Tgfβr expression.
(A) Chick (blue), quail (red), and duck (yellow) lower jaws treated in culture with 25 ng/ml (dark gray) of rTGFβ1 for 24 hr. Tgfβr1 does not change with rTGFβ1 in any species (n=10). (B) Tgfβr2 does not change with rTGFβ1 in any species (n=10). (C) Chick and duck Pai1 does not change with rTGFβ1 treatment, whereas there is an induction in quail. Quail and chick show higher Pai1 compared to duck (n=10). (D) Mmp2 increases with rTGFβ1 treatment in chick and quail lower jaws, while duck do not change. Quail and chick have higher Mmp2 compared to duck (n=10). (E) Collagen 1A1 (Col1a1) does not change with rTGFβ1 treatment in any species (n=10). (F) Ocn does not change with rTGFβ1 treatment in any species (n=10). * denotes significance from HH31 within each group p≤0.05, ** denotes significance from HH31 within each group p≤0.01, # denotes significance between quail and duck at same stage, † denotes significance between chick and quail, and ‡ denotes significance between chick and duck.
Figure 5 with 1 supplement
Effects of TGFβR1, SMAD3, and MMP13 inhibition on TRAP staining and effects of MMP13 overexpression (OE) on jaw length.
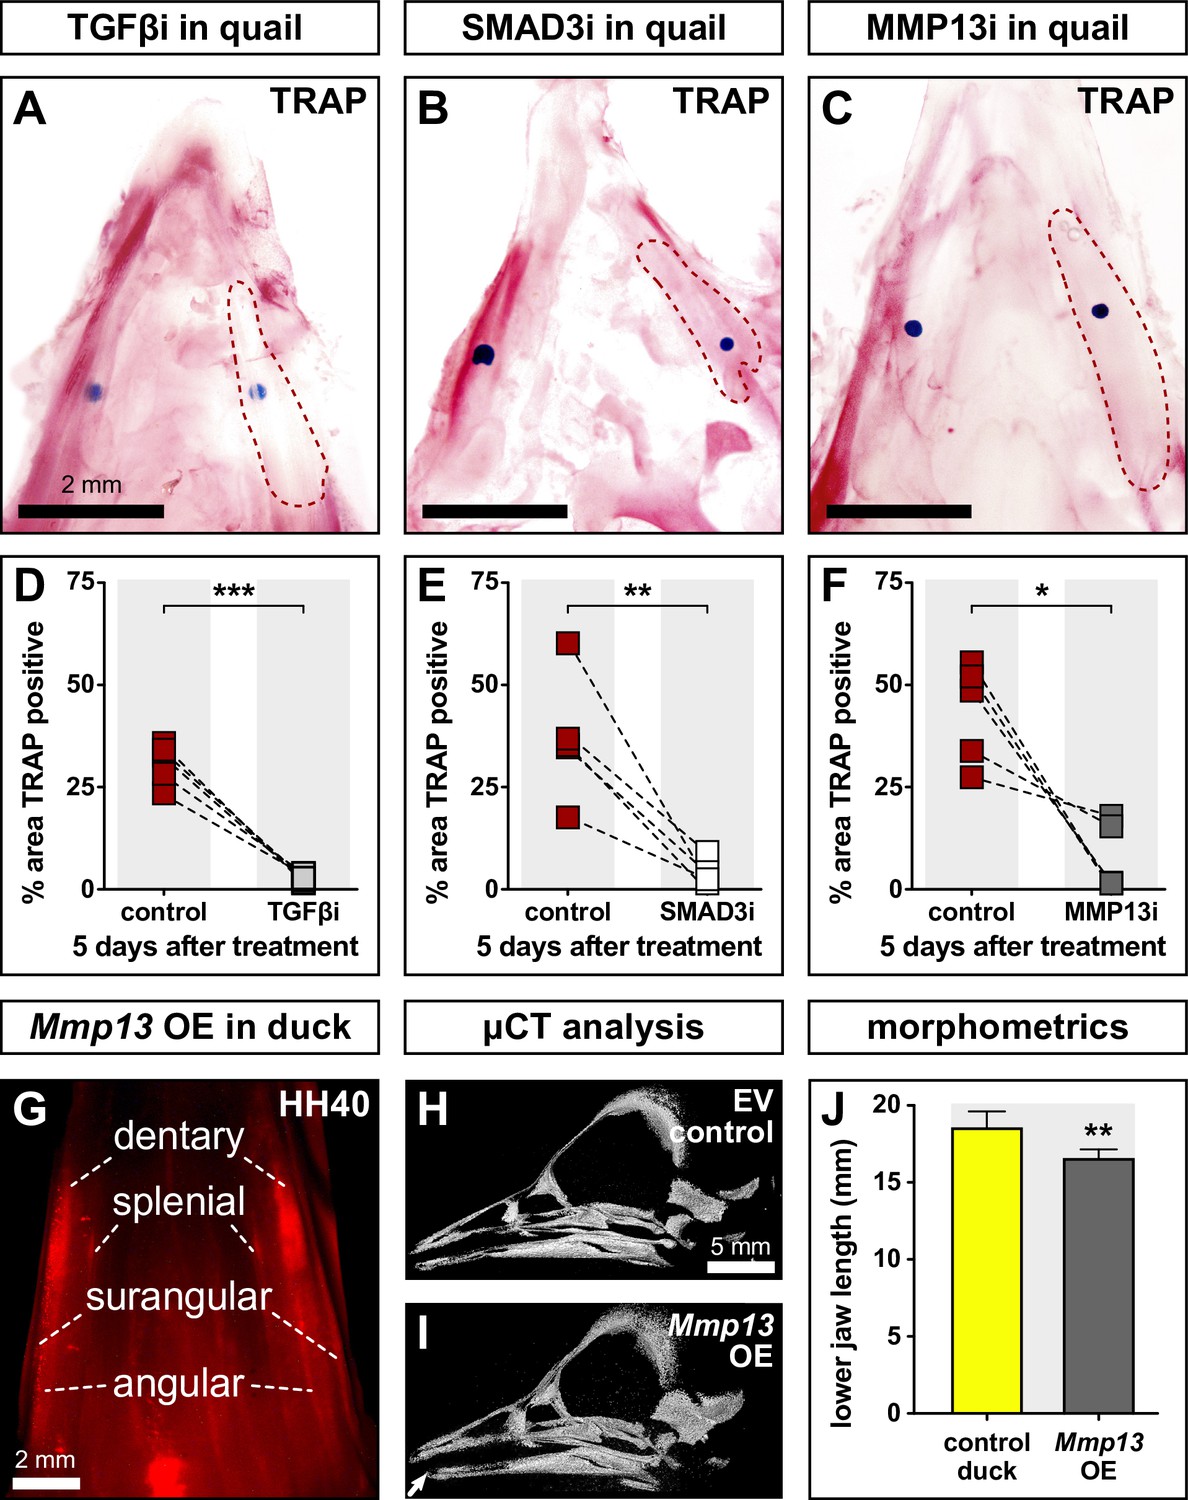
Quail lower jaws harvested at HH35 and placed in culture with control beads (left side) and treatment beads (right side) soaked in (A) TGFβR1 inhibitor (TGFβi, n=5), (B) SMAD3 inhibitor (SMAD3i, n=5), and (C) MMP13 inhibitor (MMP13i, n=5). The effects of inhibitor treatments can be seen on TRAP staining (red) after 5 days of culture (red dashed lines). Quantification of the % area of TRAP-positive staining for (D) TGFβR1 inhibitor (medium gray), (E) SMAD3 inhibitor (white), and (F) MMP13 inhibitor (dark gray) in comparison to the contralateral control side. (G) In ovo electroporations of the pPIDNB-Mmp13 OE construct were performed at HH8.5 and embryos were allowed to develop until HH35 when they were treated with a single dose of dox. Electroporation efficiency and extent of OE were evaluated during embryo collection at HH40 by detecting RFP (red). Microcomputed tomography (µCT) analysis of duck specimens electroporated with (H) empty vector or (I) Mmp13 OE construct. A 3D model was annotated with landmarks from which (J) lower jaw distances were calculated. Embryos overexpressing Mmp13 showed significantly shorter jaws compared to empty vector controls. * denotes significance from control within each group p≤0.05, ** denotes significance from control within each group p≤0.01, and *** denotes significance from control within each group p≤0.001.
-
Figure 5—source data 1
Effects of TGFβR1, SMAD3, and MMP13 inhibition on TRAP staining in quail embryos.
- https://cdn.elifesciences.org/articles/66005/elife-66005-fig5-data1-v2.pdf
-
Figure 5—source data 2
Effects of MMP13 overexpression on jaw length in duck embryos as visualized by µCT.
- https://cdn.elifesciences.org/articles/66005/elife-66005-fig5-data2-v2.pdf
Figure 5—figure supplement 1

Enzymatic activity and morphometrics following Mmp13 overexpression (OE).
(A) Functional assay to validate the enzymatic activity of overexpressed duck MMP13. HEK293 cells were transfected with pPIDNB (control) or pPIDNB-Mmp13 (Mmp13 OE), and the enzymatic activity of the cell culture medium on gelatin and collagen was assayed (n=2). Raw arbitrary fluorescence units were normalized to the control and represented as relative fluorescence units. (B) Lateral and (C) ventral view of duck skulls at HH40 with 15 landmarks (yellow circles) annotated on the surface of the lower jaw for each 3D model as shown in. The total length of each jaw side was calculated as the sum of the distances between pairs of points, from the most proximal point to the most distal point.
Figure 6 with 1 supplement
Regulation of Mmp13 via species-specific promoter elements.
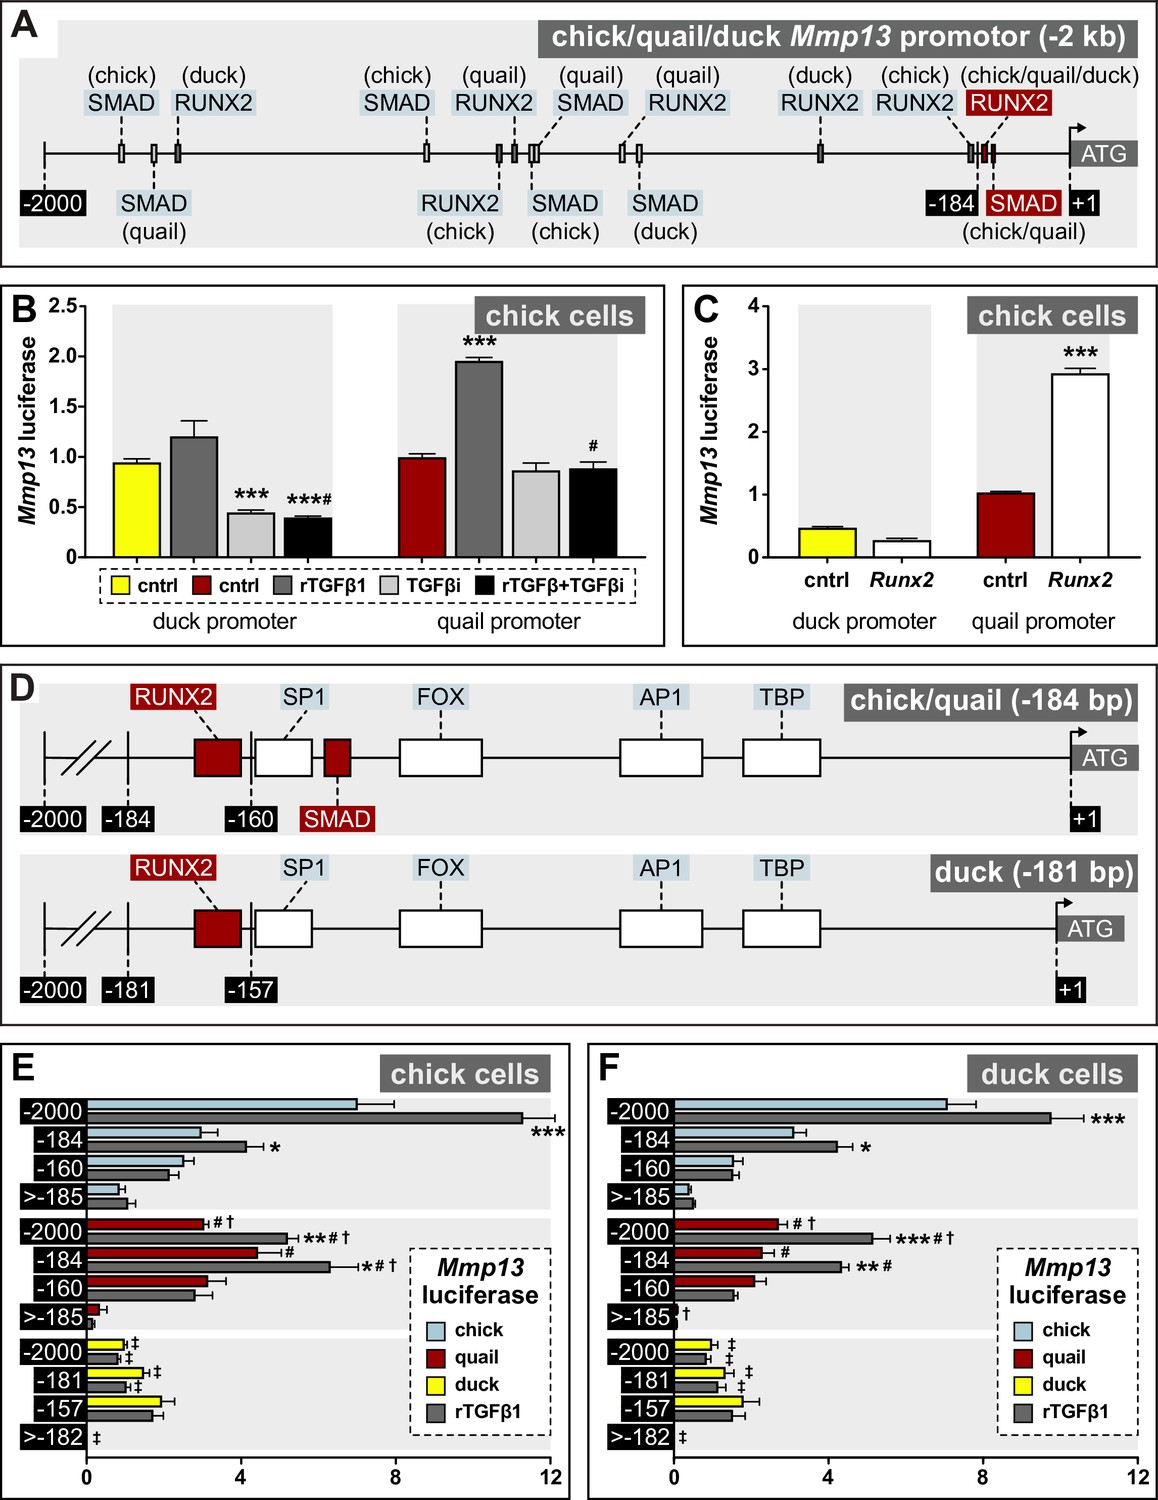
(A) Schematic of a –2 kb region of the chick, quail, and duck Mmp13 promoter upstream from the transcriptional start site (ATG). There are four SMAD-binding elements in chick, three in quail, and one in duck; and three RUNX2-binding elements in chick, quail, and duck. (B) Chick cells transfected with the –2 kb fragment of the duck (yellow) or quail (red) Mmp13 promoters attached to a luciferase reporter and treated for 24 hr with rTGFβ1 (dark gray), TGFβR1 inhibitor (medium gray), or a combination of both rTGFβ1 and TGFβR1 inhibitor (black). rTGFβ1 treatment has little effect on the duck Mmp13 promoter but induces activity in the quail promoter. TGFβR1 inhibitor as well as a combination of the TGFβR1 inhibitor and rTGFβ1 decreases activity of the duck Mmp13 promoter. The inductive effects of rTGFβ1 on the Mmp13 promoter are abolished in quail when rTGFβ1 is combined with TGFβR1 inhibitor (n=18). (C) Chick cells transfected with duck (yellow) or quail (red) Mmp13 promoters plus either an empty vector (cntrl) or with a Runx2-overexpression plasmid. Runx2 overexpression has little effect on the duck Mmp13 promoter but induces quail Mmp13 promoter activity (n=18). (D) Schematic of the –184/181 bp most proximal region of the chick, quail, and duck promoters. Chick, quail, and duck have similar binding elements for tata-binding protein (TBP), activator protein-1 (AP1), forkhead box (FOX), specificity protein-1 (SP1), and RUNX2. However, chick and quail contain a SMAD-binding element, whereas duck do not. (E) Chick and (F) duck cells transfected with either a –2 kb fragment; a –184 bp fragment including one RUNX2 and one SMAD-binding element in chick (blue) and quail; a –181 bp fragment including only a RUNX2-binding element in duck; a –160 bp fragment with no RUNX2-binding elements but including a SMAD-binding element in chick and quail; a 157 bp fragment without RUNX2 or SMAD-binding elements in duck; a –1815 bp fragment for chick and quail; or a –1818 bp fragment for duck including all binding elements upstream of the first −184/181 bp (i.e. ≤ –185/182). rTGFβ1 treatment (dark gray) induces activity of the –2 kb and –184 bp fragment for chick and quail; however, no induction is observed in the duck promotor. In the –160 bp fragment, rTGFβ1 induction is abolished in chick and quail. In the 2000–185 bp fragment, very little activity is observed (n=24). * denotes significance from untreated control within each group p≤0.05, ** denotes significance from empty vector control within each group p≤0.01, *** denotes significance from empty vector control within each group p≤0.001, # denotes significance between quail and duck, † denotes significance between chick and quail, and ‡ denotes significance between chick and duck.
Figure 6—figure supplement 1
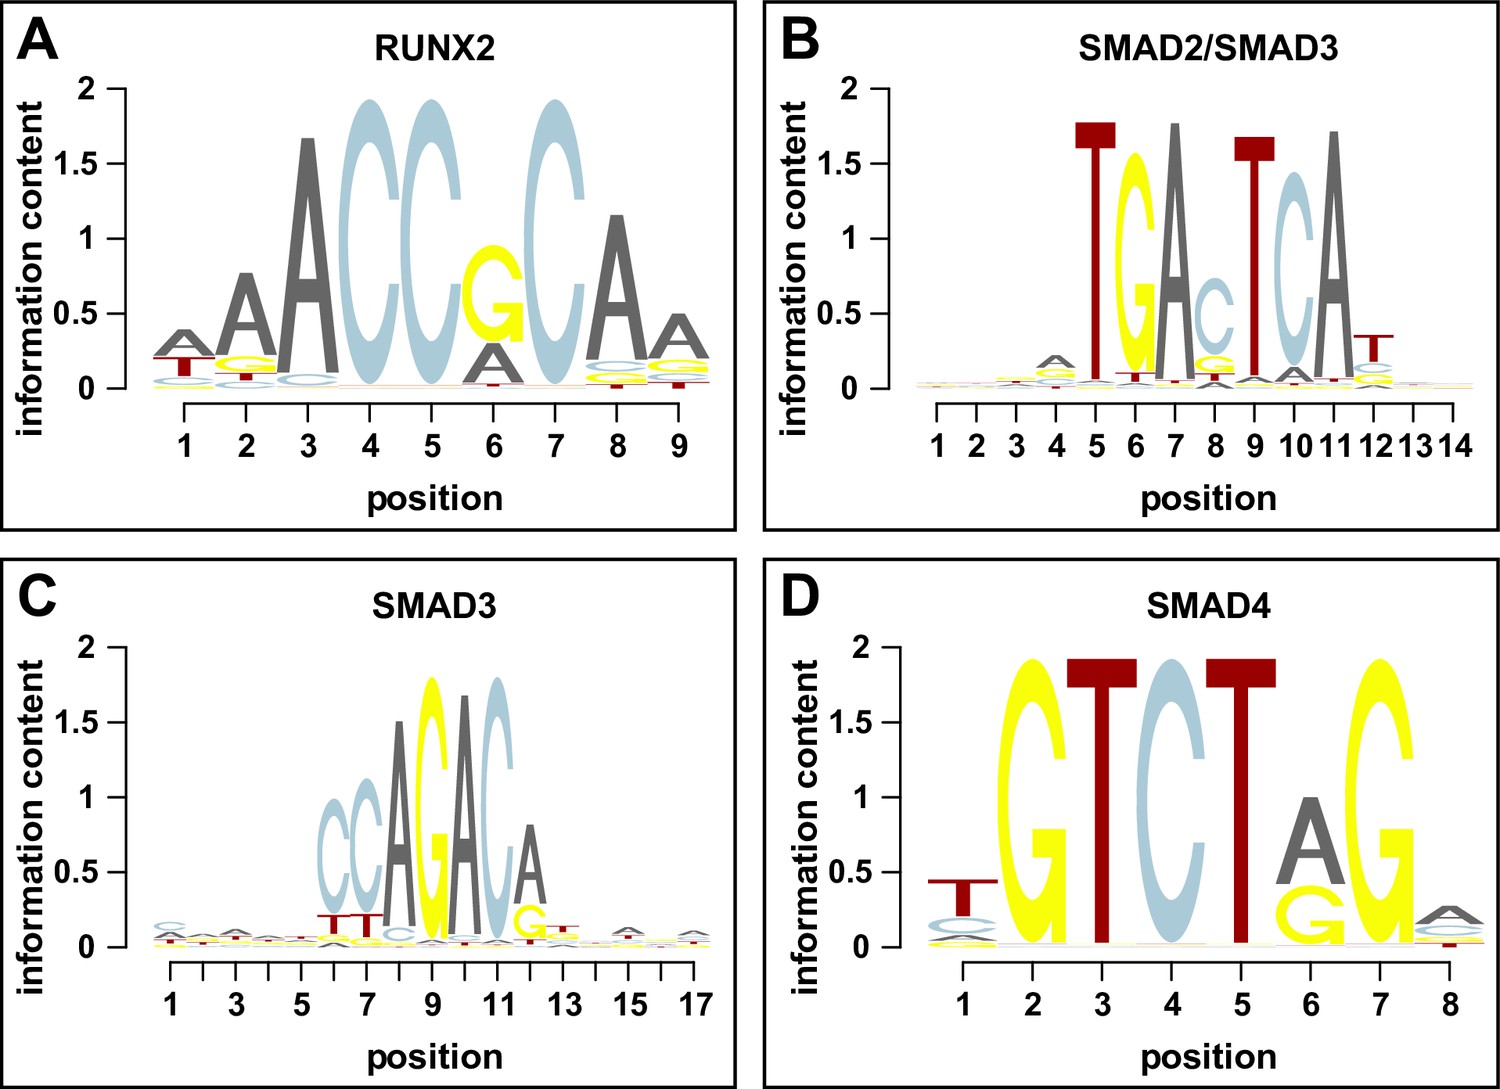
Sequence logos for RUNX2 and SMADs.
Graphical representation of the binding profiles of the position weight matrices taken from the JASPAR 2020 database for (A) RUNX2, (B) SMAD2/3 heterodimer, (C) SMAD3, and (D) SMAD4. The relative sizes of the letters indicate their frequency in the sequences, whereas the height of the letters shows the information content of the position.
Figure 7 with 1 supplement
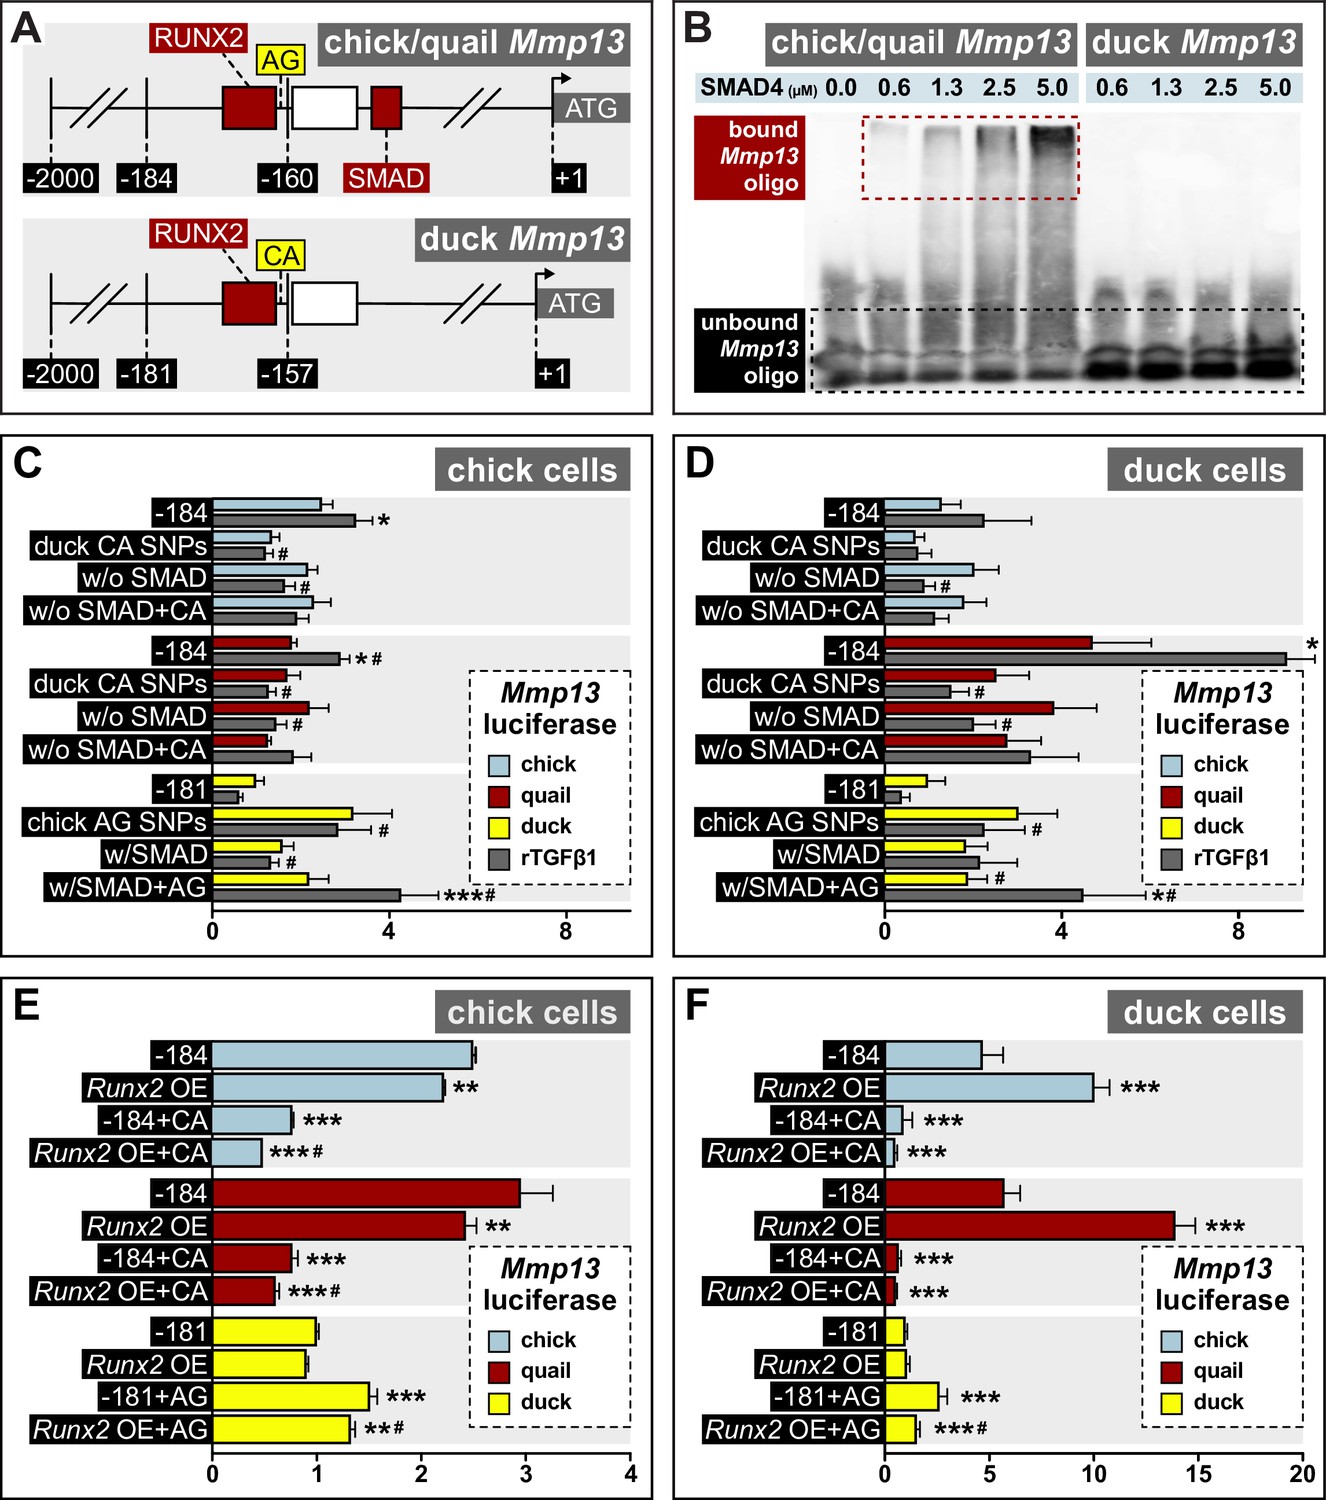
Response of the Mmp13 promoter to rTGFβ1 in relation to species-specific single nucleotide polymorphisms (SNPs) and RUNX2 and SMAD-binding elements.
(A) Schematic of the proximal region of the chick/quail (–184 bp) and duck (–181 bp) promoters. Chick/quail contain two SNPs (i.e. adenine and guanine (‘AG’)) adjacent to a RUNX2-binding element that differ from duck (i.e. cytosine and adenine (‘CA’)). (B) Electrophoretic mobility shift assay analysis of the chick, quail, and duck Mmp13 biotinylated promoter (i.e. –184 or –181) in the presence of increasing concentrations of SMAD4 recombinant protein. A dose-dependent effect is observed with a shift in bound oligo with increasing concentrations of SMAD4 protein in the chick and quail promoter. However, no shift or interaction is observed with increasing concentrations of SMAD4 protein in the duck promoter. (C) Chick and (D) duck cells transfected with the chick (blue) or quail (red) Mmp13 promoter containing either a 184 bp control fragment including the chick/quail ‘AG’ SNPs plus a RUNX2 and SMAD-binding element; a fragment with the duck ‘CA’ SNPs plus a RUNX2 and SMAD-binding element; a fragment with the chick/quail ‘AG’ SNPs plus RUNX2 but no SMAD-binding element; or a fragment including the duck ‘CA’ SNPs plus RUNX2 but no SMAD-binding element. Chick and duck cells were also transfected with the duck (yellow) Mmp13 promoter containing either a control fragment including the ‘CA’ SNPs plus a RUNX2 but no SMAD-binding element; a fragment including the chick/quail ‘AG’ SNPs plus one RUNX2 but no SMAD-binding element; a fragment including the duck ‘CA’ SNPs plus one RUNX2 and one SMAD-binding element; or a fragment including the chick/quail ‘AG’ SNPs plus one RUNX2 and one SMAD-binding element. Cells were treated with rTGFβ1 (dark gray) and assayed for luciferase activity. Switching the chick/quail SNPs to ‘CA’ SNPs abolishes rTGFβ1 induction. Switching the duck SNPs to ‘AG’ increases basal activity but does not add a rTGFβ1 response. Removing the chick/quail SMAD-binding element abolishes rTGFβ1 induction. Switching both the RUNX2 SNPs and SMAD-binding element in chick/quail with the duck sequence abolishes rTGFβ1 induction. Switching both the AG SNPs and the SMAD-binding element into the duck promoter adds a response to rTGFβ1 (n=24). * denotes significance from untreated control within each group p≤0.05, ** denotes significance from empty vector control within each group p≤0.01, *** denotes significance from empty vector control within each group p≤0.001, # denotes significance between quail and duck, † denotes significance between chick and quail, and ‡ denotes significance between chick and duck. (E) Chick and (F) duck cells transfected with the chick, quail, or duck Mmp13 promoter fragments described in (B) and (C), in combination with a Runx2 overexpression (OE) construct. In chick cells, Runx2 OE decreased Mmp13 promoter activity for both chick and quail promoters, while no change was observed in the duck promoter. Putting the duck SNPs in chick/quail leads to a decrease in Mmp13 promoter activity even with Runx2 OE. Putting the chick/quail SNPs in duck leads to a decrease in promoter activity with Runx2 OE. In duck cells, Runx2 OE induced Mmp13 promoter activity in chick and quail, while no change was observed in the duck promoter. Switching the SNPs in chick/quail to duck abolished the Runx2 induction. However, switching the SNPs in duck to chick/quail repressed promoter activity with Runx2 OE (n=24). * denotes significance from the endogenous promoter within each species p≤0.05, ** denotes significance from the endogenous promoter within each species p≤0.01, *** denotes significance from the endogenous promoter within each species p≤0.001, and # denotes significance between control SNP switch and Runx2 OE with the SNP switch within each species.
Figure 7—figure supplement 1
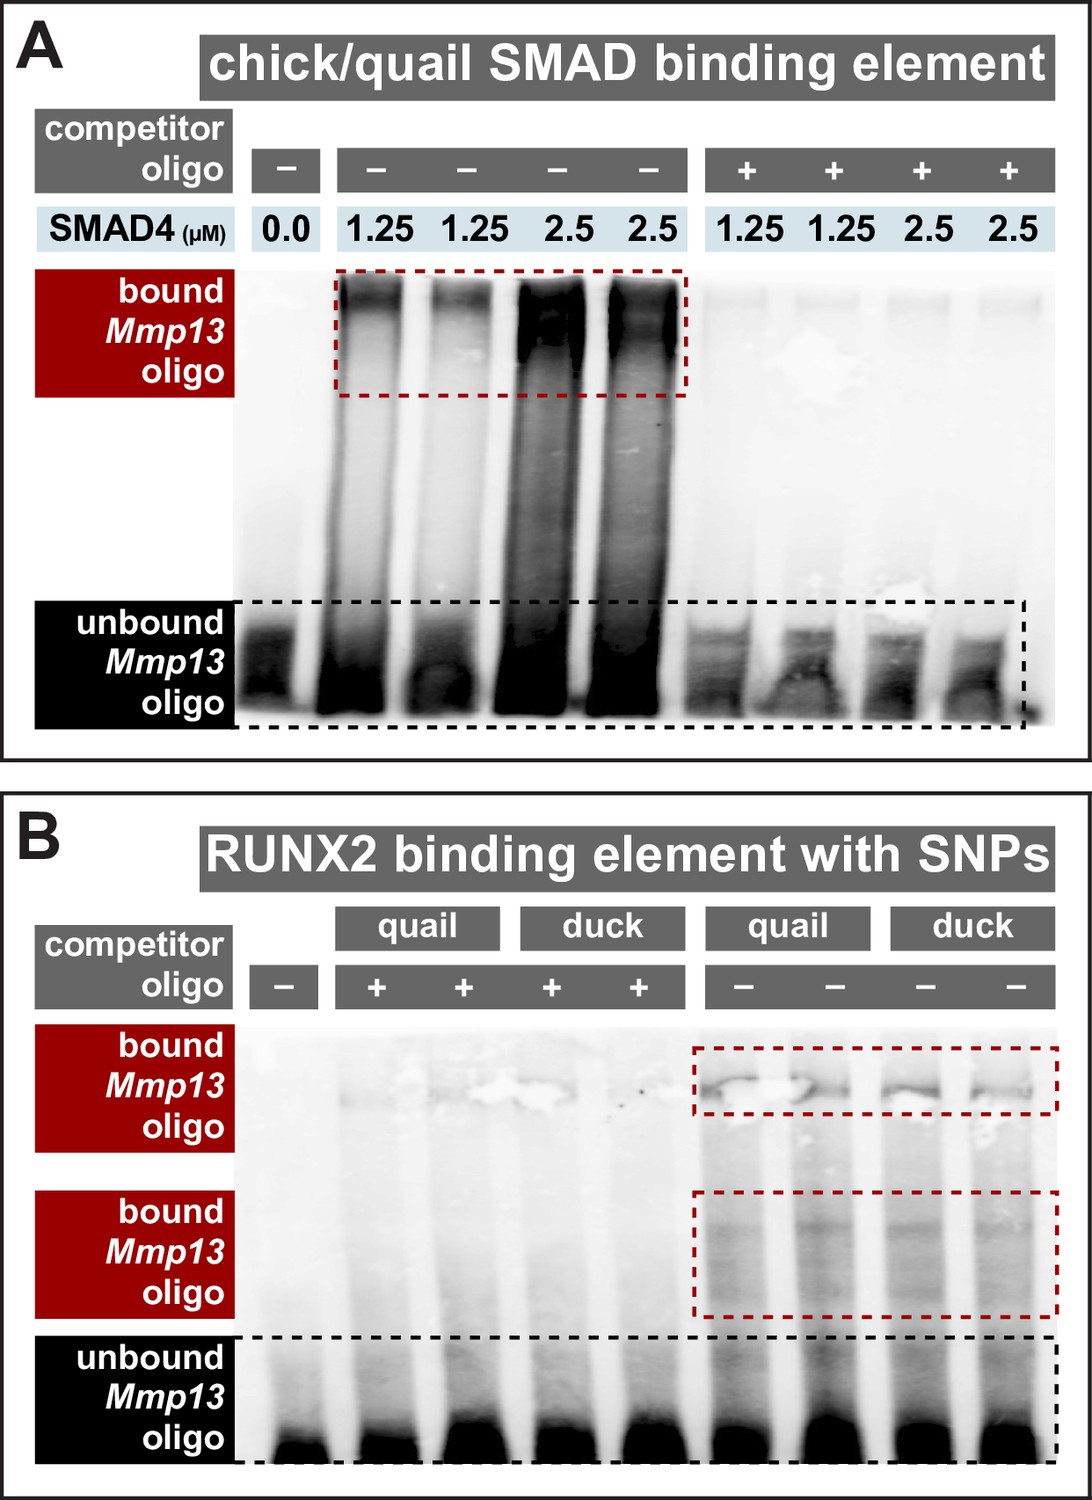
SMAD4 and RUNX2 interactions with the chick, quail, and duck Mmp13 promoter.
Electrophoretic mobility shift assay analysis of the chick, quail, and duck Mmp13 biotinylated promoter (i.e. –184 or –181 bp). (A) The chick/quail Mmp13 promoter interaction with increasing concentrations of SMAD4 recombinant protein in the absence or presence of a competitor oligo (same Mmp13 sequence without biotinylation). A dose-dependent shift in bound Mmp13 oligo is observed with increasing concentrations of SMAD4 protein. However, when treated in excess with a competitor oligo, a substantial reduction in bound Mmp13 bound oligo is observed. (B) Chick cells were transfected with empty vector or Runx2 overexpression constructs and treated with dox. The nuclear extract was collected and incubated with the quail or duck Mmp13 promoter in the presence or absence of a competitor oligo. In the presence of a competitor oligo, little to no band shifts are observed in any treatment group. However, in the absence of a competitor oligo, two band shifts are observed with both the quail and duck Mmp13 promoter constructs. No difference was observed between empty vector and Runx2 overexpression.
Additional files
-
Supplementary file 1
Materials, reagents, equipment, supplies, and software used in this study.
- https://cdn.elifesciences.org/articles/66005/elife-66005-supp1-v2.docx
-
Supplementary file 2
MMP13 antigen sequence.
- https://cdn.elifesciences.org/articles/66005/elife-66005-supp2-v2.docx
-
Supplementary file 3
Primer sequences used for PCR and qPCR analysis.
- https://cdn.elifesciences.org/articles/66005/elife-66005-supp3-v2.docx
-
Supplementary file 4
Potential binding elements within the Mmp13 promoter predicted via the JASPAR 2020 database.
- https://cdn.elifesciences.org/articles/66005/elife-66005-supp4-v2.docx
-
Transparent reporting form
- https://cdn.elifesciences.org/articles/66005/elife-66005-transrepform1-v2.docx
Download links
A two-part list of links to download the article, or parts of the article, in various formats.
Downloads (link to download the article as PDF)
Open citations (links to open the citations from this article in various online reference manager services)
Cite this article (links to download the citations from this article in formats compatible with various reference manager tools)
Species-specific sensitivity to TGFβ signaling and changes to the Mmp13 promoter underlie avian jaw development and evolution
eLife 11:e66005.
https://doi.org/10.7554/eLife.66005


