Infection-exposure in infancy is associated with reduced allergy-related disease in later childhood in a Ugandan cohort
- Immuno-modulation and Vaccines Programme, Medical Research Council/Uganda Virus Research Institute and London School of Hygiene and Tropical Medicine Uganda Research Unit, Uganda
- Division of Epidemiology and Biostatistics, School of Public Health, University of the Witwatersrand, Johannesburg, South Africa, South Africa
- Department of Non-Communicable Disease Epidemiology, London School of Hygiene and Tropical Medicine, United Kingdom
- Department of Infection Biology, London School of Hygiene and Tropical Medicine, United Kingdom
- Institute for Global Health, University College London, United Kingdom
- MRC International Statistics and Epidemiology Group, Department of Infectious Disease Epidemiology, London School of Hygiene and Tropical Medicine, United Kingdom
- Department of Clinical Research, London School of Hygiene and Tropical Medicine, United Kingdom
Figures
Figure 1
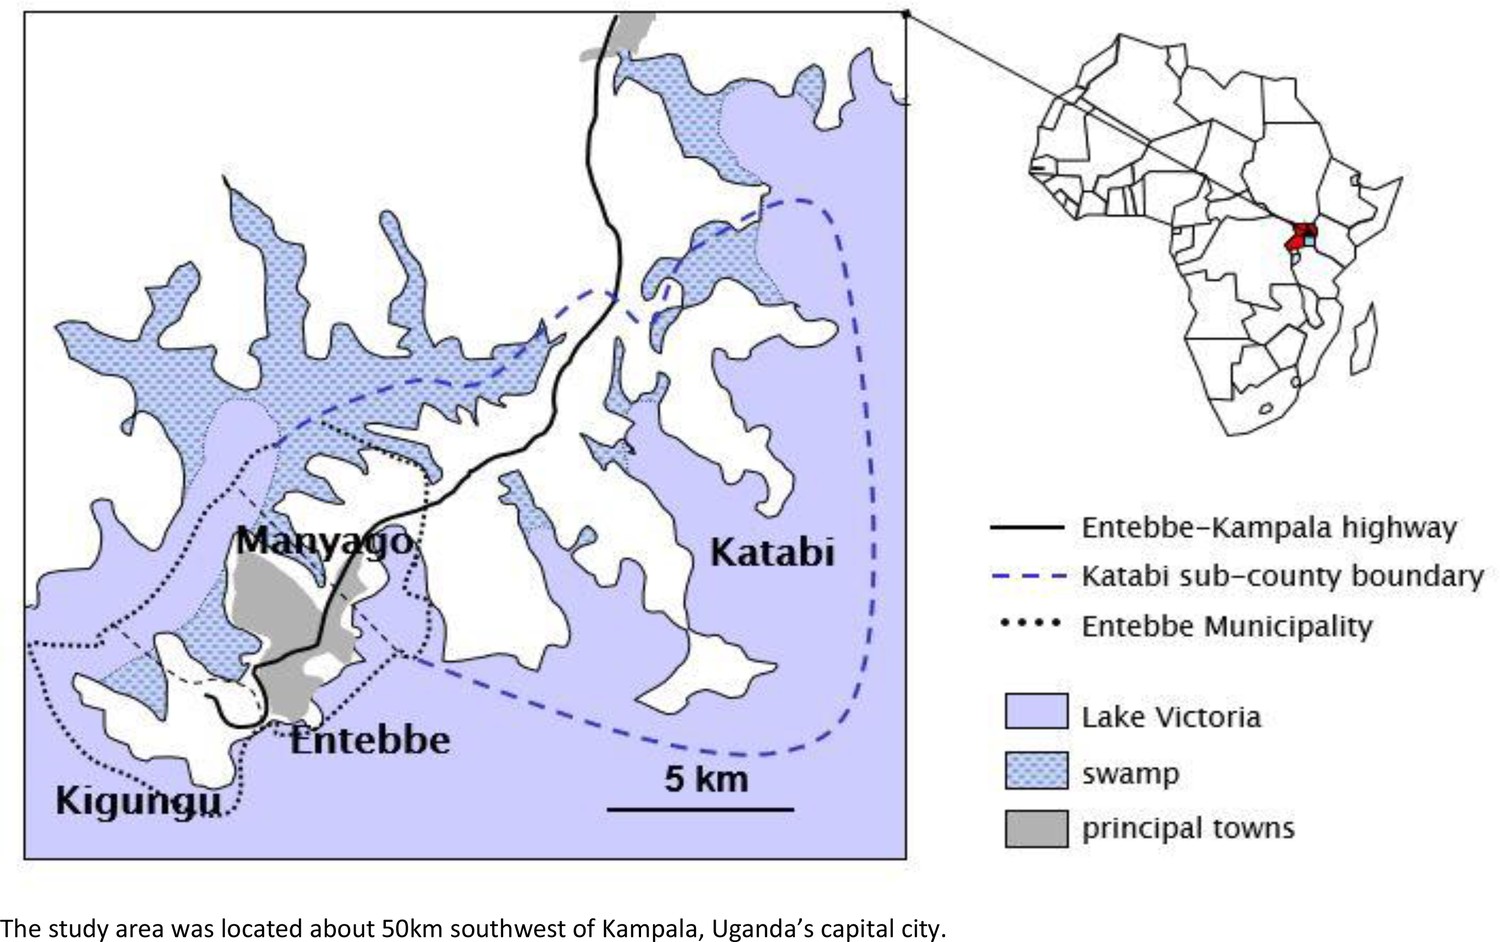
Map of Entebbe and Katabi showing the study area and the three main geographical zones of maternal residence at enrolment.
Figure 2
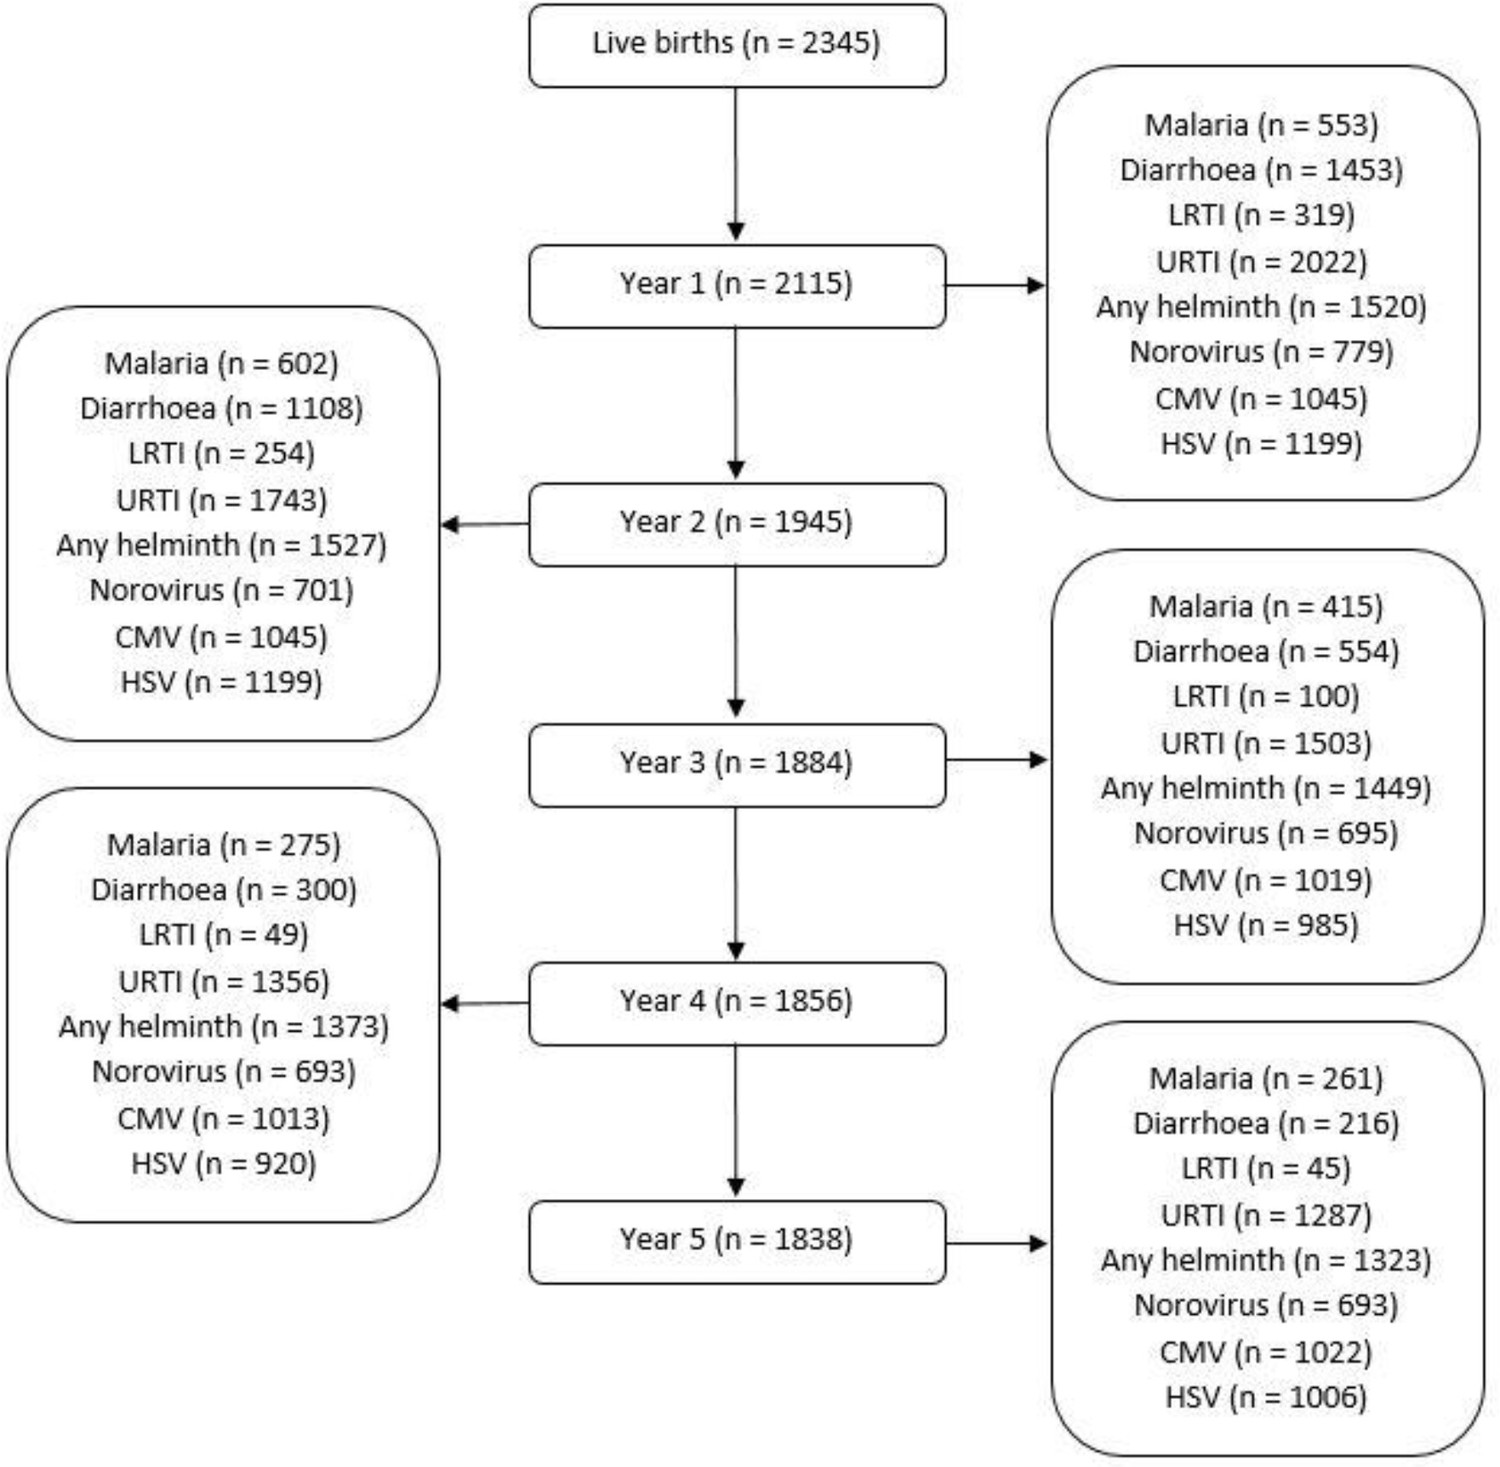
Flowchart showing number of the Entebbe Mother and Baby Study participants with data on illnesses/infections during each year.
Numbers for each year (centre column of the flowchart) represent the children who presented at the study clinic at any point during that year. Numbers for malaria, diarrhoea, lower respiratory tract infection (LRTI) and upper respiratory tract infection (URTI) represent the children who were positively diagnosed (at least once during a given year) for each of those illnesses, on presentation at the study clinic. Numbers for any helminth, norovirus, cytomegalovirus (CMV), and herpes simplex virus (HSV) represent children samples assessed for any of those infections at the respective annual visit.
Figure 3
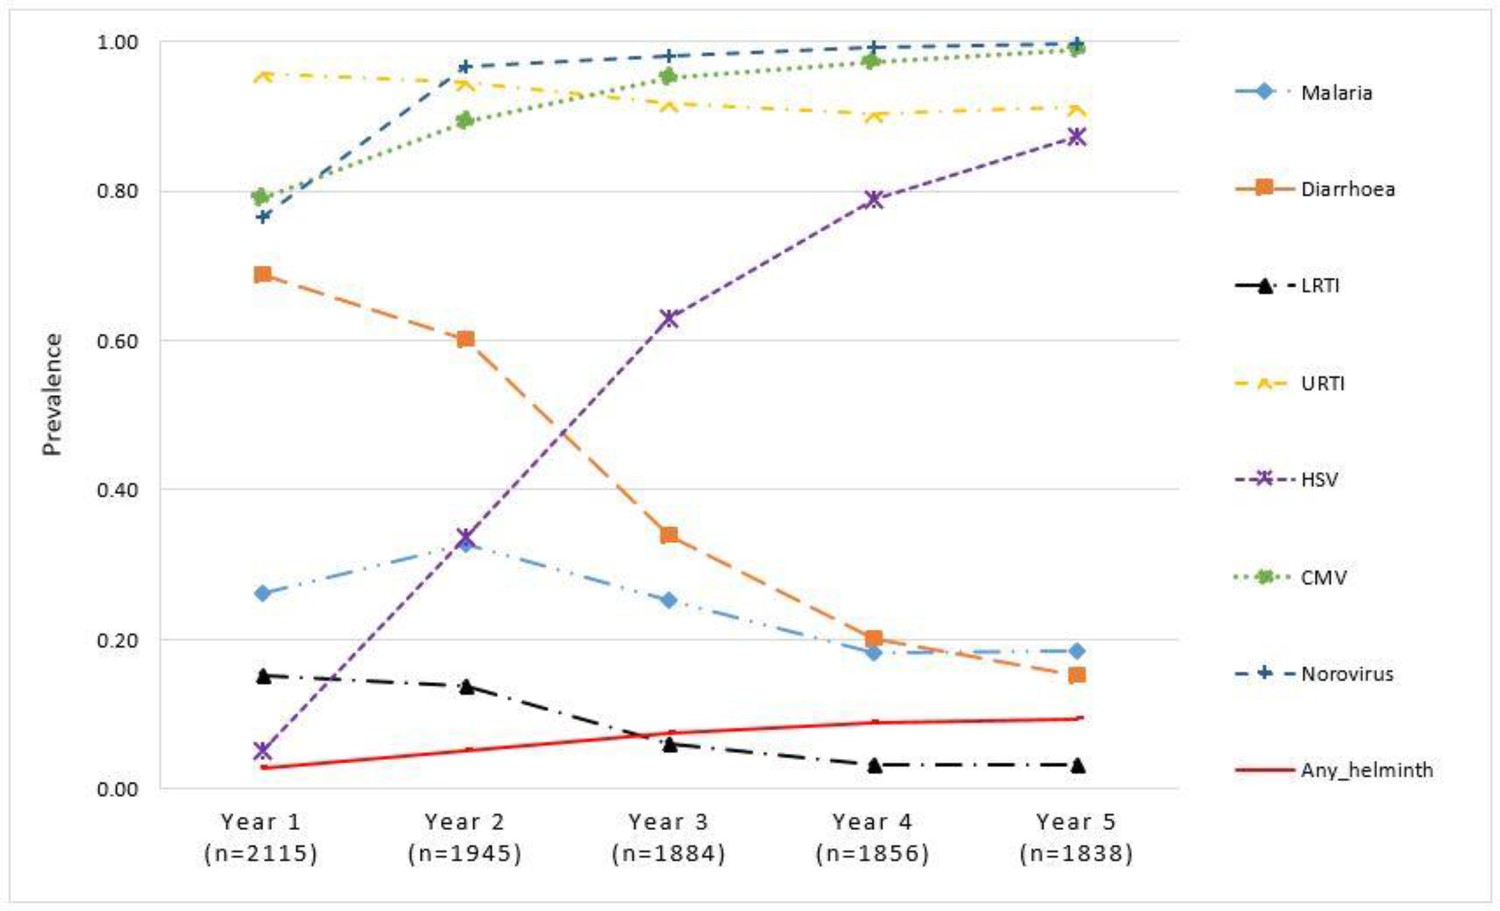
Proportion of children with illnesses/infections, over time, in the Entebbe Mother and Baby Study cohort.
Figure 4
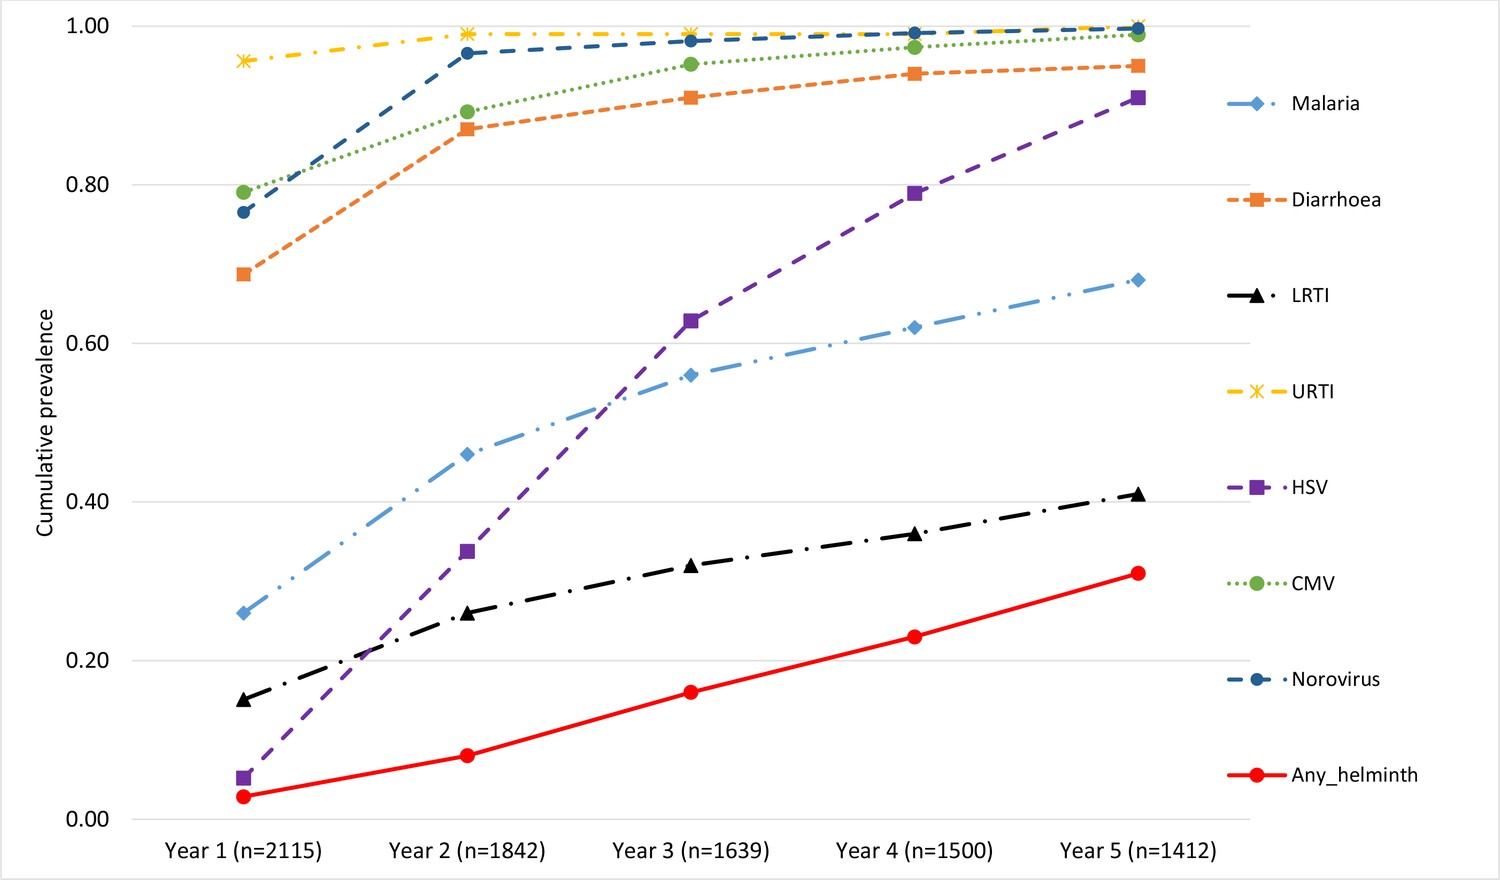
Cumulative infection experience, over time, in the Entebbe Mother and Baby Study cohort.
Figure 5
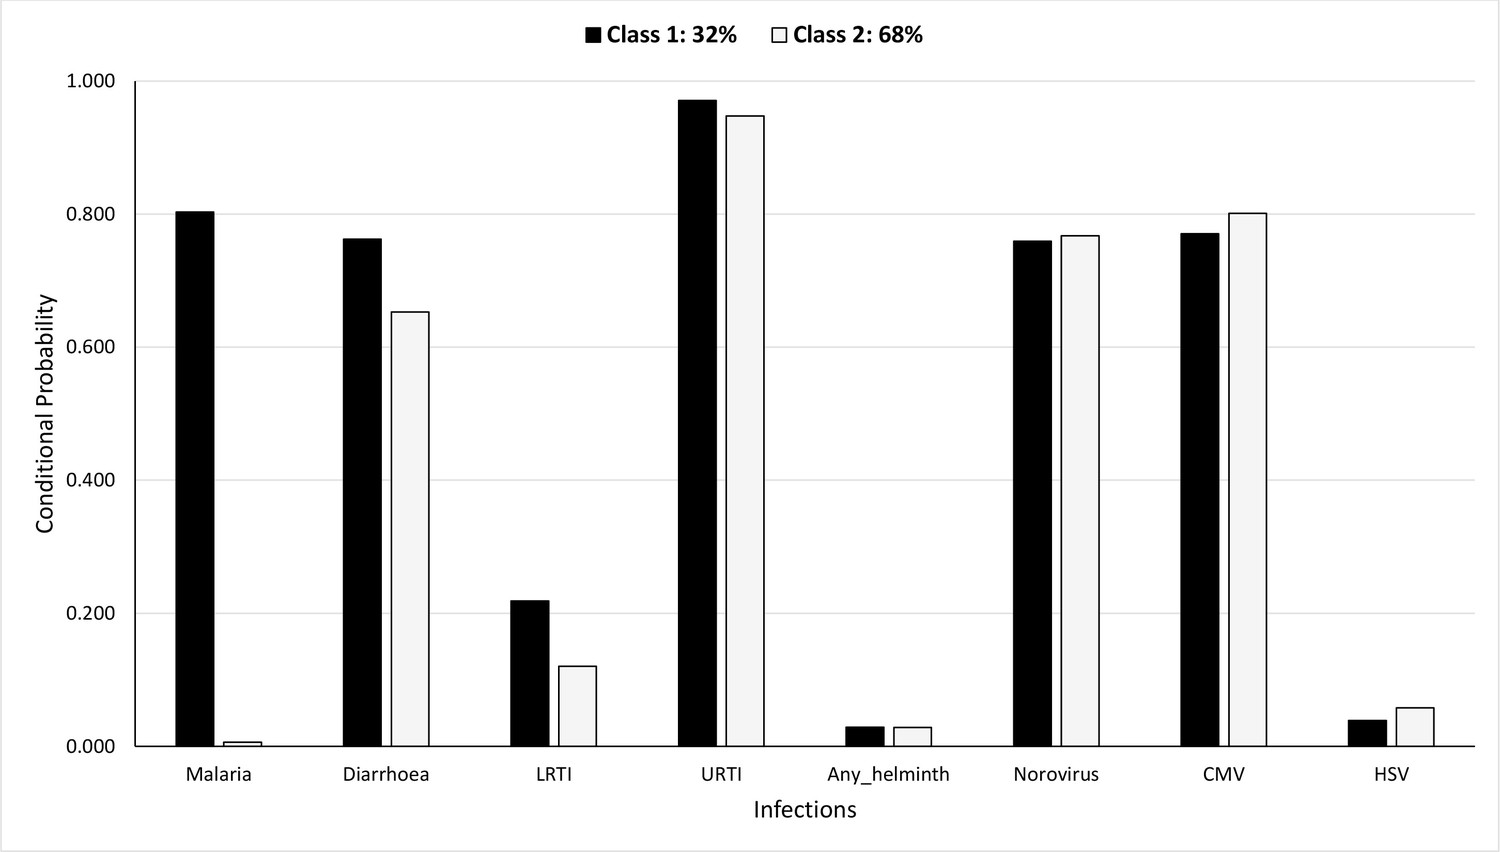
Probability of having infections conditional on latent class membership during the first year.
Figure 6
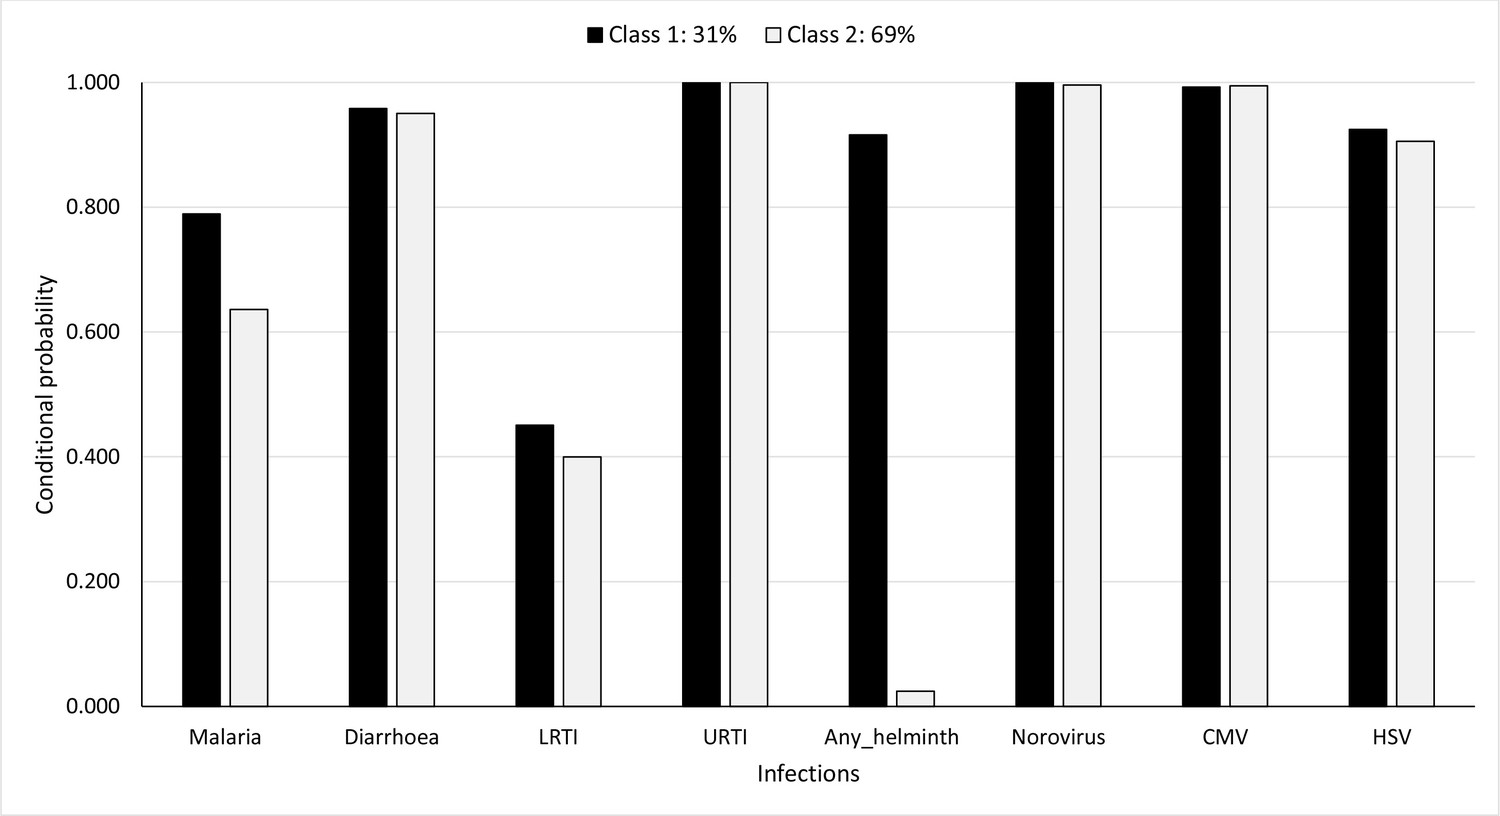
Probability of having infections conditional on latent class membership considering cumulative prevalence of infections over all the 5 years.
Tables
Table 1
Number (and proportion) of children in each latent class at year 1 and at year 5 considering cumulative infection experience.
| LC 1 | LC 2 | |
|---|---|---|
| Number (%) | Number (%) | |
| Year 1 (n = 2077) | 665 (32) | 1412 (68) |
| Year 5 (n = 1668) | 517 (31) | 1151 (69) |
-
LC is latent class. LC 1 represents the class with higher probabilities for various infections as compared to LC 2, however, the profile of infections changes at each time period.
Table 2
Odds ratio estimates for effects of covariates on membership in latent class 1 at year 1 and at year 5 considering cumulative infection experience.
| Year 1 exposure | 5-Year cumulative exposure | ||||
|---|---|---|---|---|---|
| Covariate | Odds ratio | (95% CI) | Odds ratio | (95% CI) | |
| Mother’s social economic status | |||||
| Higher vs. lower | 0.77 | (0.58, 1.02) | 0.51 | (0.31, 0.82) | |
| Household’s social economic status | |||||
| Higher vs. lower | 0.87 | (0.66, 1.14) | 0.58 | (0.25, 0.92) | |
| Maternal history of asthma or eczema | |||||
| History present vs. absent | 0.74 | (0.43, 1.27) | 0.50 | (0.24, 1.53) | |
| Area of residence at birth | |||||
| Kigungu vs. Entebbe | 0.33 | (0.18, 0.62) | 5.73 | (3.24, 8.12) | |
| Manyago vs. Entebbe | 1.20 | (0.88, 1.63) | 1.08 | (0.88, 1.63) | |
| Katabi vs. Entebbe | 2.43 | (1.62, 3.65) | 2.04 | (1.07, 3.54) | |
-
CI is confidence interval. Bold values indicate statistically significant values at the 5% level.
Table 3
Probability of allergy-related disease (ARD) outcomes and atopy at 9 years by latent class membership at year 1.
| 95% CI* | |||||
|---|---|---|---|---|---|
| ARD outcomes at 9 years | Latent class | Estimate | Lower CI | Upper CI | p-Value |
| Wheeze | LC† 1 | 0.02 | 0.007 | 0.043 | 0.030 |
| LC 2 | 0.05 | 0.038 | 0.071 | ||
| Eczema | LC 1 | 0.03 | 0.013 | 0.056 | 0.043 |
| LC 2 | 0.06 | 0.047 | 0.084 | ||
| Rhinitis | LC 1 | 0.02 | 0.007 | 0.044 | 0.015 |
| LC 2 | 0.06 | 0.045 | 0.081 | ||
| SPT-any‡ | LC 1 | 0.22 | 0.178 | 0.278 | 0.201 |
| LC 2 | 0.27 | 0.235 | 0.304 | ||
| SPT-Dermatophagoides | LC 1 | 0.14 | 0.103 | 0.188 | 0.051 |
| LC 2 | 0.20 | 0.171 | 0.232 | ||
| SPT-cockroach | LC 1 | 0.11 | 0.074 | 0.149 | 0.760 |
| LC 2 | 0.11 | 0.091 | 0.141 | ||
| SPT-Blomia | LC 1 | 0.12 | 0.089 | 0.169 | 0.144 |
| LC 2 | 0.16 | 0.138 | 0.196 | ||
| IgE-Dermatophagoides | LC 1 | 0.26 | 0.214 | 0.322 | 0.261 |
| LC 2 | 0.31 | 0.271 | 0.343 | ||
| IgE-cockroach | LC 1 | 0.30 | 0.249 | 0.361 | 0.429 |
| LC 2 | 0.33 | 0.295 | 0.370 | ||
| IgE-any§ | LC 1 | 0.42 | 0.357 | 0.478 | 0.395 |
| LC 2 | 0.45 | 0.411 | 0.490 | ||
-
*
CI is confidence interval.
-
†
LC is latent class. LC 1 represents the class with higher probabilities for various infections as compared to LC 2.
-
‡
SPT-any is skin prick test reactivity to any of Dermatophagoides mix, Blomia tropicalis, German cockroach, cat, mould, grass pollen, Bermuda grass, or peanut.
-
§
IgE-any is allergen-specific plasma IgE (asIgE) to any of house dust mite (HDM, Dermatophagoides pteronyssinus) or German cockroach.
Table 4
Probability of allergy-related disease (ARD) outcomes and atopy at 9 years by latent class membership across the first 5 years.
| 95% CI* | |||||
|---|---|---|---|---|---|
| ARD outcomes at 9 years | Latent class | Estimate | Lower CI | Upper CI | p-Value |
| Wheeze | LC† 1 | 0.02 | 0.009 | 0.065 | 0.272 |
| LC 2 | 0.05 | 0.032 | 0.066 | ||
| Eczema | LC 1 | 0.02 | 0.004 | 0.062 | 0.056 |
| LC 2 | 0.07 | 0.050 | 0.090 | ||
| Rhinitis | LC 1 | 0.02 | 0.008 | 0.067 | 0.139 |
| LC 2 | 0.06 | 0.042 | 0.080 | ||
| SPT-any‡ | LC 1 | 0.17 | 0.121 | 0.240 | 0.012 |
| LC 2 | 0.29 | 0.249 | 0.325 | ||
| SPT-Dermatophagoides | LC 1 | 0.11 | 0.069 | 0.169 | 0.010 |
| LC 2 | 0.21 | 0.180 | 0.248 | ||
| SPT-cockroach | LC 1 | 0.08 | 0.048 | 0.135 | 0.184 |
| LC 2 | 0.12 | 0.099 | 0.154 | ||
| SPT-Blomia | LC 1 | 0.11 | 0.070 | 0.169 | 0.096 |
| LC 2 | 0.17 | 0.143 | 0.206 | ||
| IgE-Dermatophagoides | LC 1 | 0.32 | 0.256 | 0.398 | 0.416 |
| LC 2 | 0.28 | 0.247 | 0.325 | ||
| IgE-cockroach | LC 1 | 0.34 | 0.271 | 0.414 | 0.658 |
| LC 2 | 0.32 | 0.279 | 0.359 | ||
| IgE-any§ | LC 1 | 0.48 | 0.403 | 0.555 | 0.316 |
| LC 2 | 0.43 | 0.386 | 0.471 | ||
-
*
CI is confidence interval.
-
†
LC is latent class. LC 1 represents the class with higher probabilities for various infections as compared to LC 2.
-
‡
SPT-any is skin prick test reactivity to any of Dermatophagoides mix, Blomia tropicalis, German cockroach, cat, mould, grass pollen, Bermuda grass, or peanut.
-
§
IgE-any is allergen-specific plasma IgE (asIgE) to any of house dust mite (HDM, Dermatophagoides pteronyssinus) or German cockroach.
Additional files
-
Supplementary file 1
Additional results tables for model fit statistics and measurement invariance for year 1 and year 5 cumulative infection experience.
(a) Model fit statistics for latent class analysis at year 1 and at year 5 considering cumulative infection experience. (b) Results for measurement invariance by sex, at year 1 and at year 5.
- https://cdn.elifesciences.org/articles/66022/elife-66022-supp1-v1.docx
-
Transparent reporting form
- https://cdn.elifesciences.org/articles/66022/elife-66022-transrepform1-v1.pdf
-
Reporting standard 1
STROBE checklist.
- https://cdn.elifesciences.org/articles/66022/elife-66022-repstand1-v1.pdf
Download links
A two-part list of links to download the article, or parts of the article, in various formats.
Downloads (link to download the article as PDF)
Open citations (links to open the citations from this article in various online reference manager services)
Cite this article (links to download the citations from this article in formats compatible with various reference manager tools)
Infection-exposure in infancy is associated with reduced allergy-related disease in later childhood in a Ugandan cohort
eLife 10:e66022.
https://doi.org/10.7554/eLife.66022


