Unexpected plasticity in the life cycle of Trypanosoma brucei
- Lehrstuhl für Zell- und Entwicklungsbiologie, Biozentrum, Julius-Maximilians-Universität, Germany
- Lehrstuhl für Bioinformatik, Biozentrum, Julius-Maximilians-Universität, Germany
Figures
Figure 1 with 2 supplements
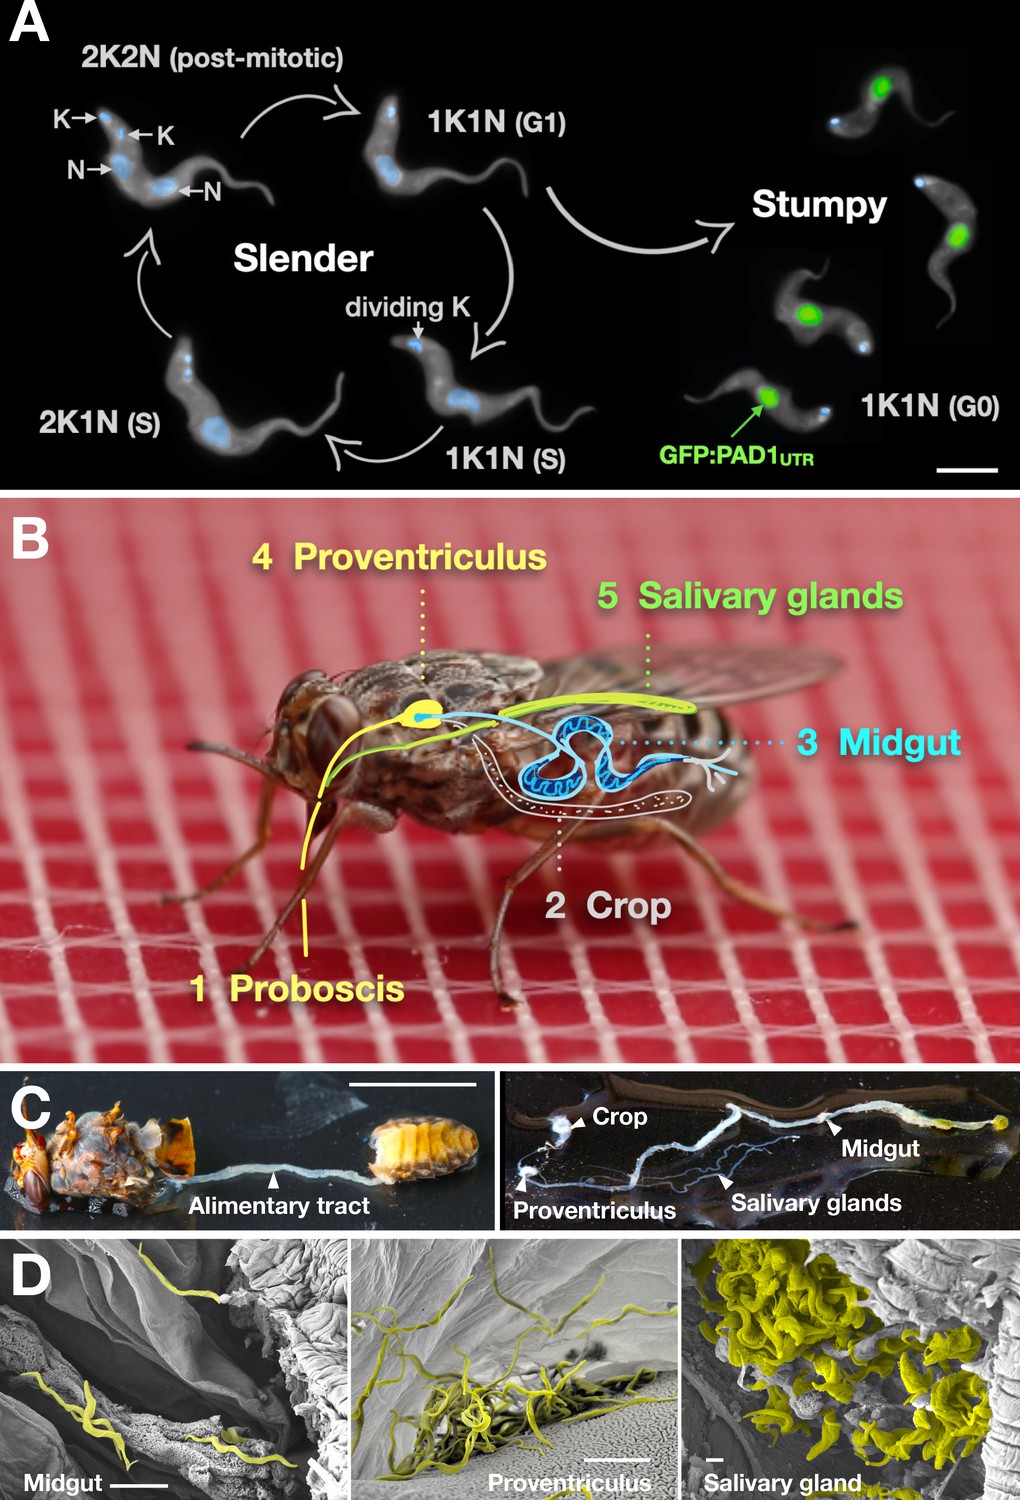
Slender trypanosomes can complete the entire life cycle in the tsetse fly vector.
(A) Cell cycle (G1/S/post-mitotic), morphology, and differentiation of bloodstream form (mammalian-infective stage) trypanosomes. Proliferation of slender trypanosomes is detectable by duplication and segregation of the mitochondrial genome (kinetoplast, K) and nuclear DNA (N) over time. Quorum sensing causes cell cycle arrest (G0) and expression of the stumpy marker PAD1. Images are false-coloured, maximum intensity projections of deconvolved 3D stacks. The green colour indicates the nuclear GFP:PAD1UTR fluorescence, the DAPI-stained kinetoplast and nucleus are shown in light blue, and the AMCA-sulfo-NHS-labelled parasite cell surface are shown in grey. Scale bar: 5 µm. (B) Trypanosome infections of tsetse flies were achieved via bloodmeal, which consists typically of 20 µl, through a silicon membrane. To complete infection in a tsetse fly after an infective blood-meal, trypanosomes first travel to the midgut, followed by the proventriculus, and finally must reach the salivary glands. (C) The first panel depicts a dissected tsetse fly for explantation of the alimentary tract. The second panel shows the explanted alimentary tract of the tsetse, with the different subcompartments labelled. Scale bar: 5 mm. (D) Scanning electron micrograph of a typical trypanosome infection of the tsetse midgut, proventriculus, and salivary glands. Parasites are false-coloured yellow. Scale bar: 1 µm.
Figure 1—figure supplement 1
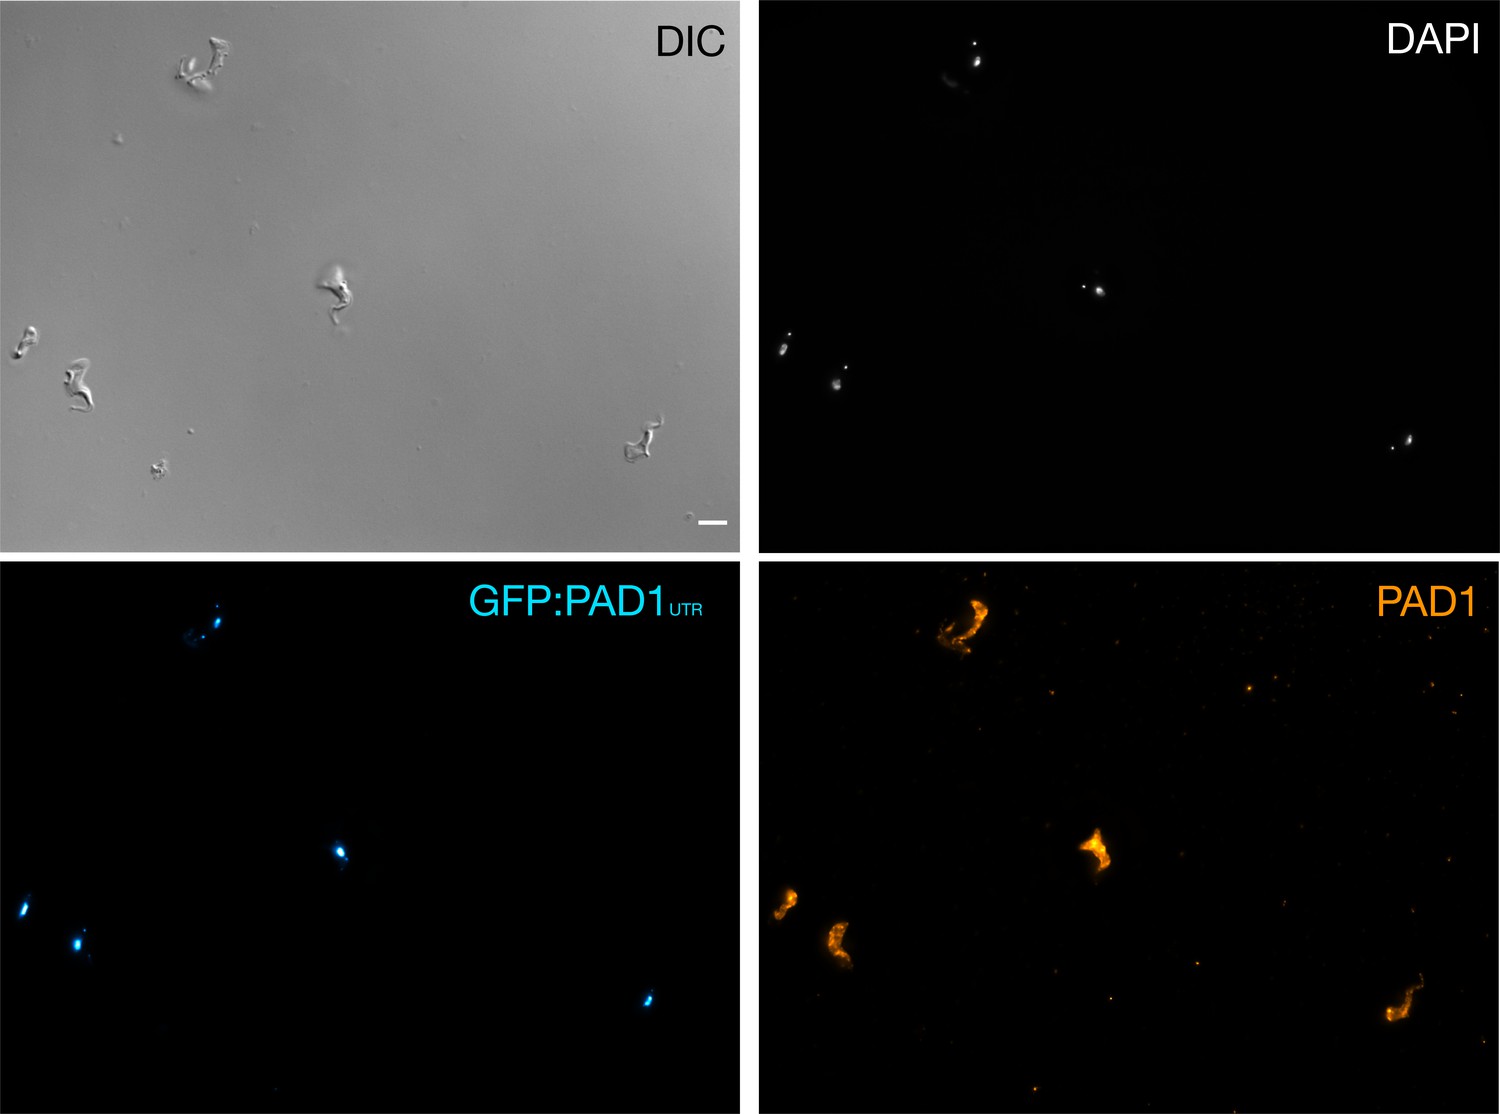
Stumpy trypanosomes express PAD1 on their surface when the GFP:PAD1UTR reporter is expressed.
Immunofluorescence using an anti-PAD1 antibody with stumpy trypanosomes (generated with SIF) from the GFP:PAD1UTR cell line. Cells were fixed in 4% paraformaldehyde and labelled with an anti-PAD1 antibody, without membrane permeabilisation, in order to only detect surface-localised proteins. DAPI (grey), GFP:PAD1UTR signal (cyan), and PAD1 protein (orange) are shown. Scale bar = 5 µm.
Figure 1—video 1
Video of a tsetse fly taking a bloodmeal through a silicone membrane.
Figure 2 with 2 supplements
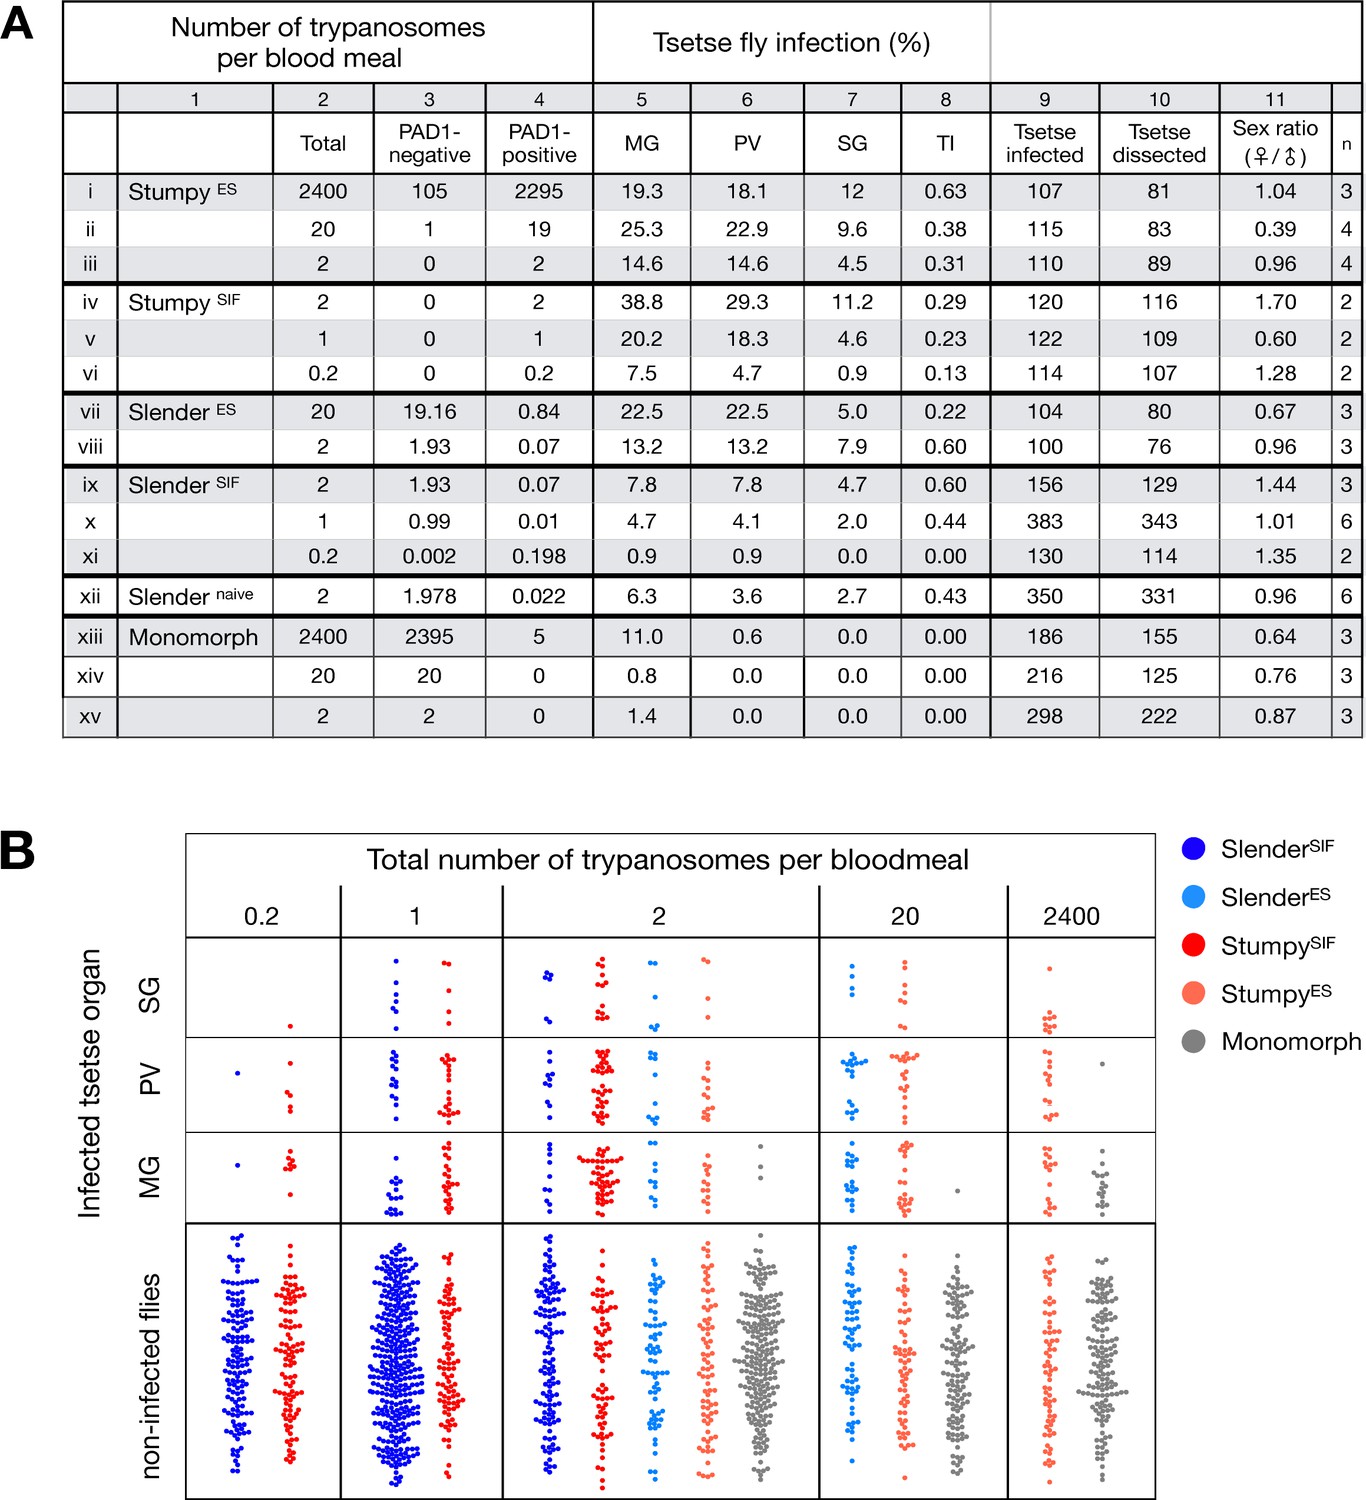
Slender trypanosomes can complete the entire tsetse infection cycle, and a single parasite is sufficient for tsetse passage.
The flies were infected with different numbers of either stumpy or slender trypanosomes. SlenderES, SlenderSIF, and monomorphic trypanosome cell lines were cultivated with regular dilution and a maximum population density of 5x10⁵ cells/ml, in order to avoid SIF accumulation. Stumpy development was induced by expression site attenuation (ES), or SIF-treatment (SIF). StumpyES induction was performed by ectopic overexpression of VSG121 for 56 hr, in the absence of SIF. SIF-mediated stumpy transition (StumpySIF) was induced by incubating slender trypanosome populations in the presence of SIF-containing conditioned medium for 48 hr. The expression of the stumpy marker PAD1 was checked before fly feeding. (A) Percent of the total fly infections is shown. MG, midgut infection; PV, proventriculus infection; SG, salivary gland infection; TI, transmission index (number of SG infections divided by MG infections); n, number of independent fly infections. (B) Graphical visualisation (beeswarm plot) of the data shown in panel A, colour-coded according to cell population used. MG, midgut; PV, proventriculus; SG, salivary gland; n, number of independent fly infection experiments.
Figure 2—figure supplement 1

Number of trypanosomes per milliliter (ml) of blood correlating to how many trypanosomes would be found in a tsetse bloodmeal.
This calculation was done using the average tsetse bloodmeal of 20 µl of blood per meal. For a number less than one per bloodmeal, such as 0.2 trypanosomes/bloodmeal, this equates to roughly every 5th fly getting a trypanosome, or a 20% chance of a trypanosome getting taken up by a fly.
Figure 2—figure supplement 2
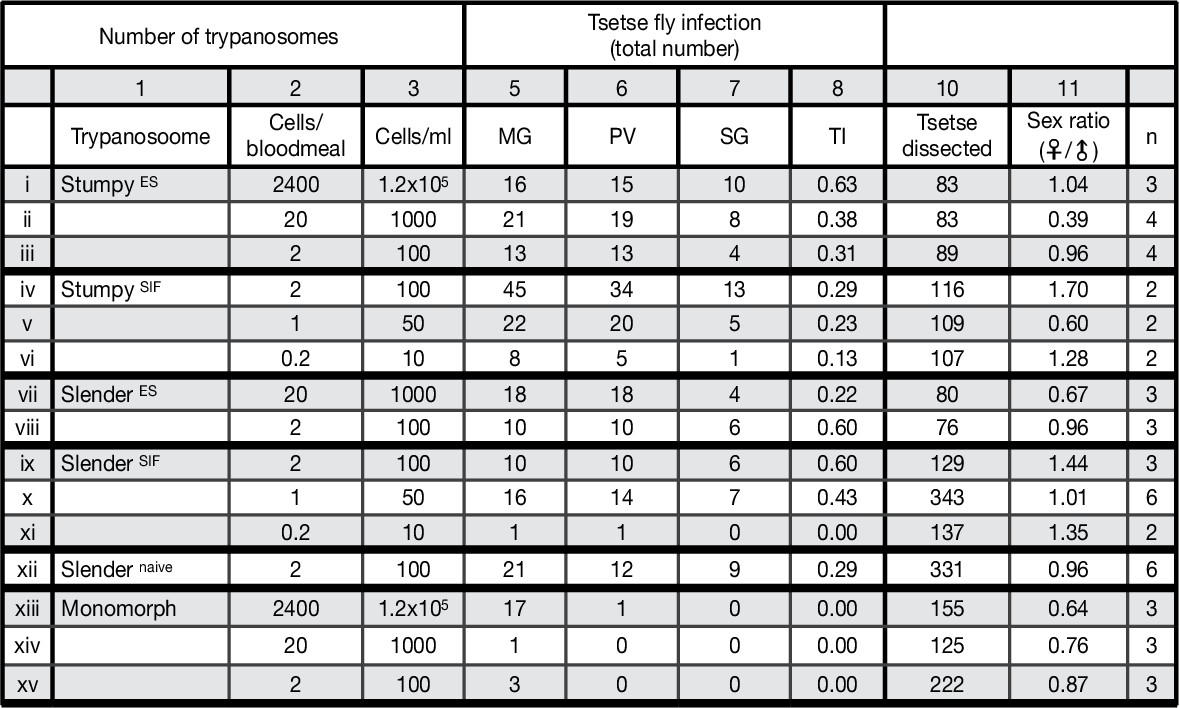
Slender trypanosomes can complete the entire tsetse infection cycle, and a single parasite is sufficient for tsetse passage.
The flies were infected with either stumpy or slender trypanosomes. Stumpy trypanosomes were generated by induction of expression site attenuation (ES), or SIF-treatment (SIF). ES-attenuation consisted of seeding slender cells cultured at 5x10⁵ cells/ml and inducing the overexpression of VSG121 for 56 hr. SIF stumpy induction was performed by seeding a slender trypanosome culture at 5x10⁵ cells/ml and harvesting after 48 hr, without dilution. All slender and monomorph cultures were harvested at or below 5x10⁵ cells/ml to avoid SIF induction. Background PAD1 expression was checked for every culture. This table shows the total numbers of each infection, as seen graphically in Figure 2B. MG, midgut infection; PV, proventriculus infection; SG, salivary gland infection; TI, transmission index (number of SG infections divided by MG infections); n, number of independent fly infection experiments. Appendix 1. Original findings of the Nobel laureate, Robert Koch, in both original German and translated into English (Kleine, 1909). He found that very few trypanosomes were found in blood samples of his patients. From this, it can be roughly calculated that just 1–2 trypanosomes would be found in a tsetse bloodmeal taken from his patients, giving our data some broader perspective.
Figure 3 with 2 supplements
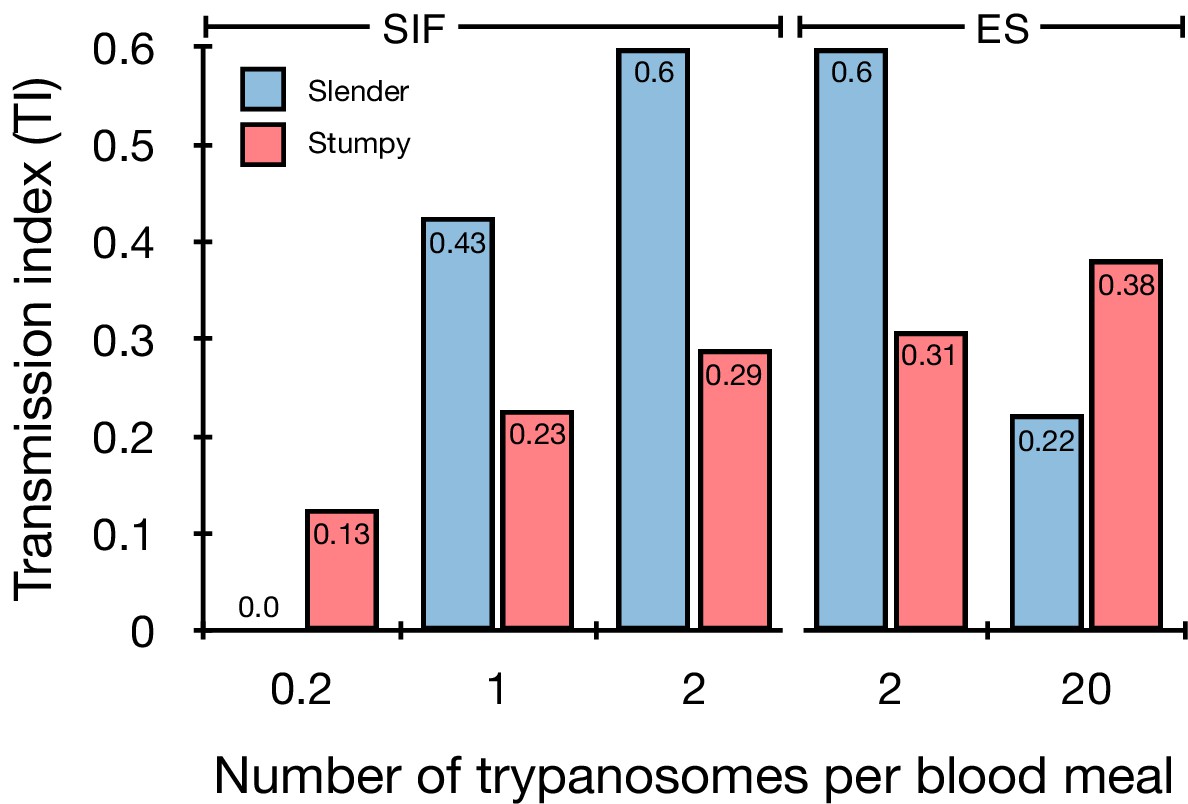
Graphical representation of the transmission index TI (number of salivary gland infections divided by the number of midgut infections) of slender (blue) and stumpy (red) trypanosomes at different numbers of trypanosomes per bloodmeal (data reproduced from Figure 2A, column 8).
A high TI indicates successful completion of the life cycle in the tsetse vector. At low infective doses, slender trypanosomes had a higher TI compared to stumpy parasites. There was no difference between stumpy parasites generated by SIF-treatment (SIF) or expression site attenuation (ES).
Figure 3—figure supplement 1
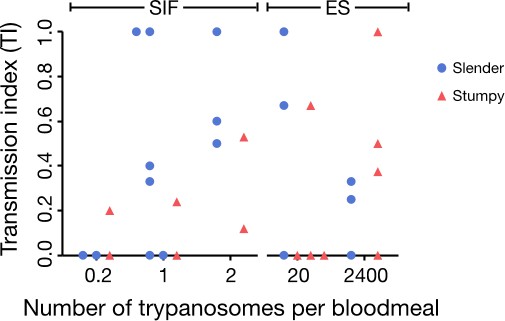
Graphical representation of the transmission index (TI - number of salivary gland infections divided by midgut infections) of slender (blue) and stumpy (red) trypanosomes for the individual experiments (n) at different numbers of trypanosomes per bloodmeal (individual replicates from data in Figure 2A, column 8).
Figure 3—figure supplement 2
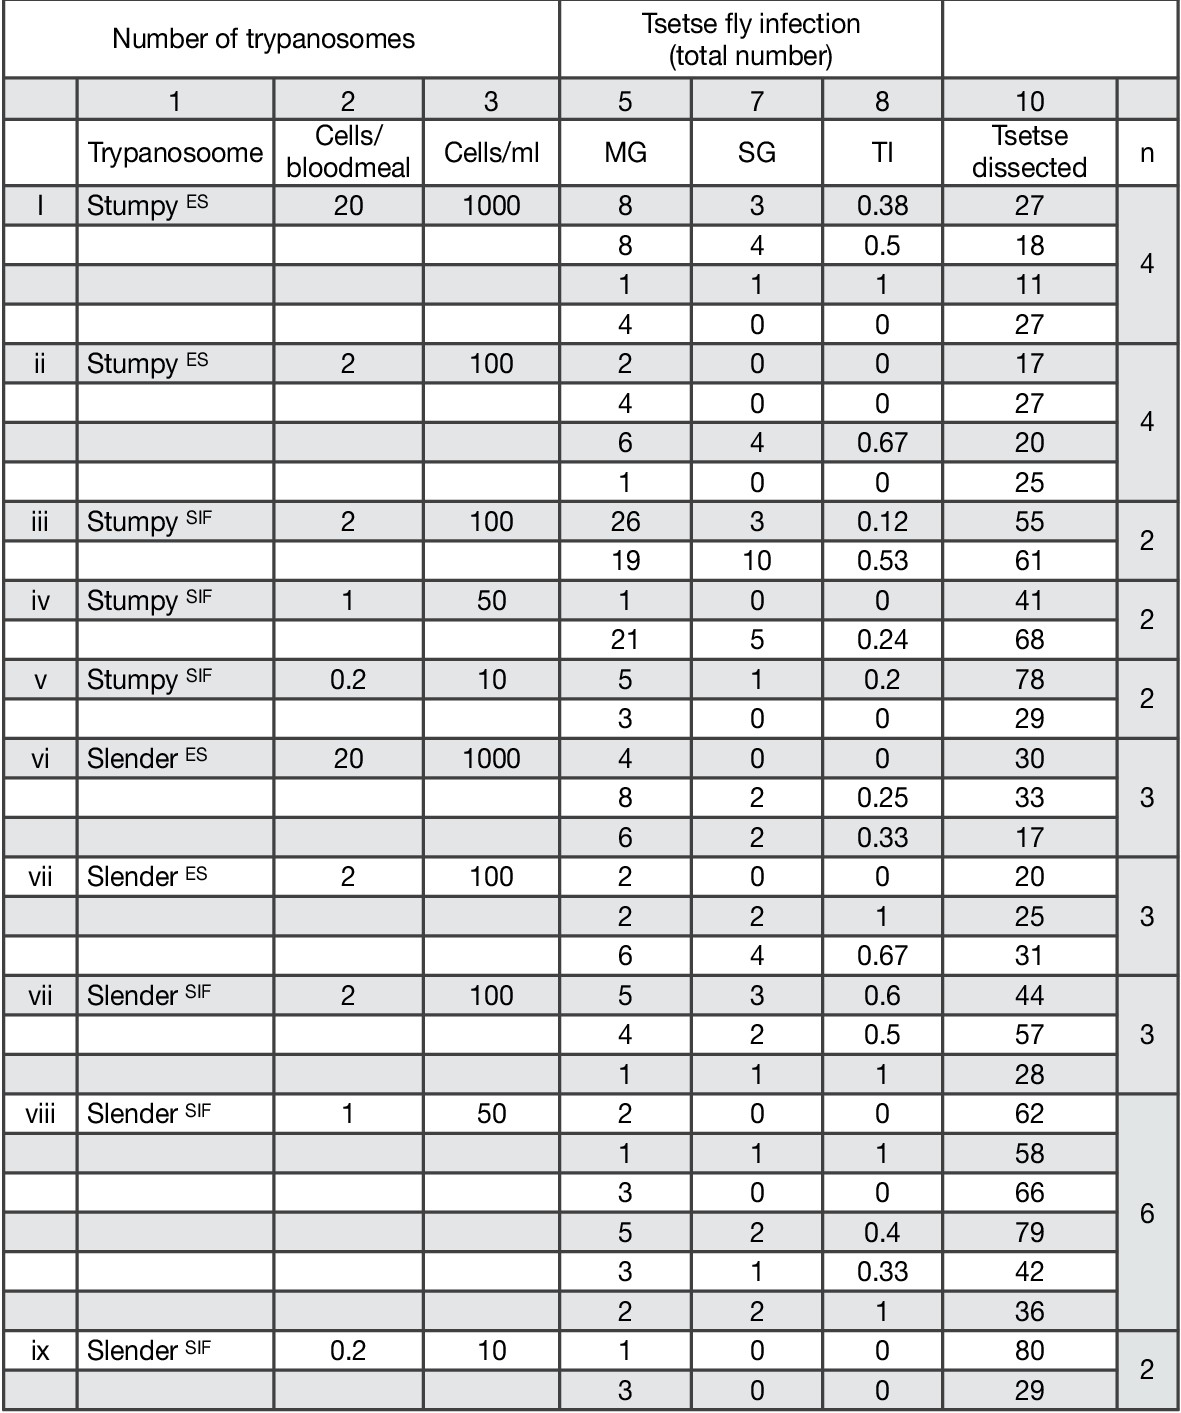
Transmission index TI (number of salivary gland infections divided by midgut infections) of slender and stumpy trypanosomes for the individual experiments (n) at different numbers of trypanosomes per bloodmeal (individual replicates from data in Figure 2A, column 8).
MG, midgut infection; PV; SG, salivary gland infection; TI, transmission index (number of SG infections divided by MG infections).
Figure 4 with 1 supplement
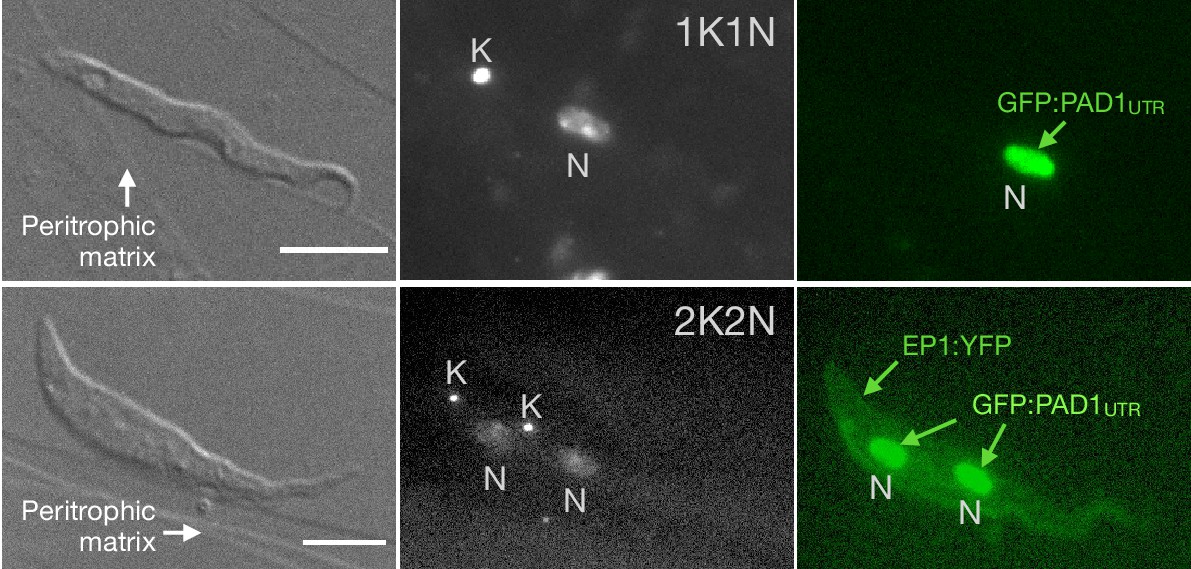
Exemplary images of procyclic trypanosomes in the explanted tsetse midgut 24 hr post infection with slender cells.
Morphology (DIC panels, left), cell cycle status (DAPI label, middle panels) and expression of fluorescent reporters (right) were scored. Note that the upper panels show a cell with procyclic morphology that is nonetheless EP1:YFP negative, indicating that the EP1 signal underestimates the total numbers of procyclic cells in the population. Scale bar: 5 µm.
Figure 4—video 1
After uptake by the tsetse fly, slender trypanosomes promptly activate the PAD1 pathway, while the continuously dividing.
Videos channels are shown in the order: DIC, GFP, DAPI. All videos were recorded at 250 fps, and the cell cycle position is indicated by DAPI staining. (A) Dividing (2K2N) long slender trypanosome in the tsetse fly, 2 hr post infection (h.p.i). No GFP:PAD1UTR signal is detectable. (B) Cell cycle arrested (1K1N) short stumpy trypanosome in the tsetse fly, 2 h p.i. The GFP:PAD1UTR reporter is expressed. (C) Dividing (2K1N) long slender trypanosome in the tsetse fly, 15 h.p.i. The GFP:PAD1UTR signal is clearly visible. (D) Dividing (2K2N) procyclic trypanosome in the tsetse fly, 48 h p.i. The cell expresses both GFP:PAD1UTR and EP1:YFP.
Figure 5 with 2 supplements
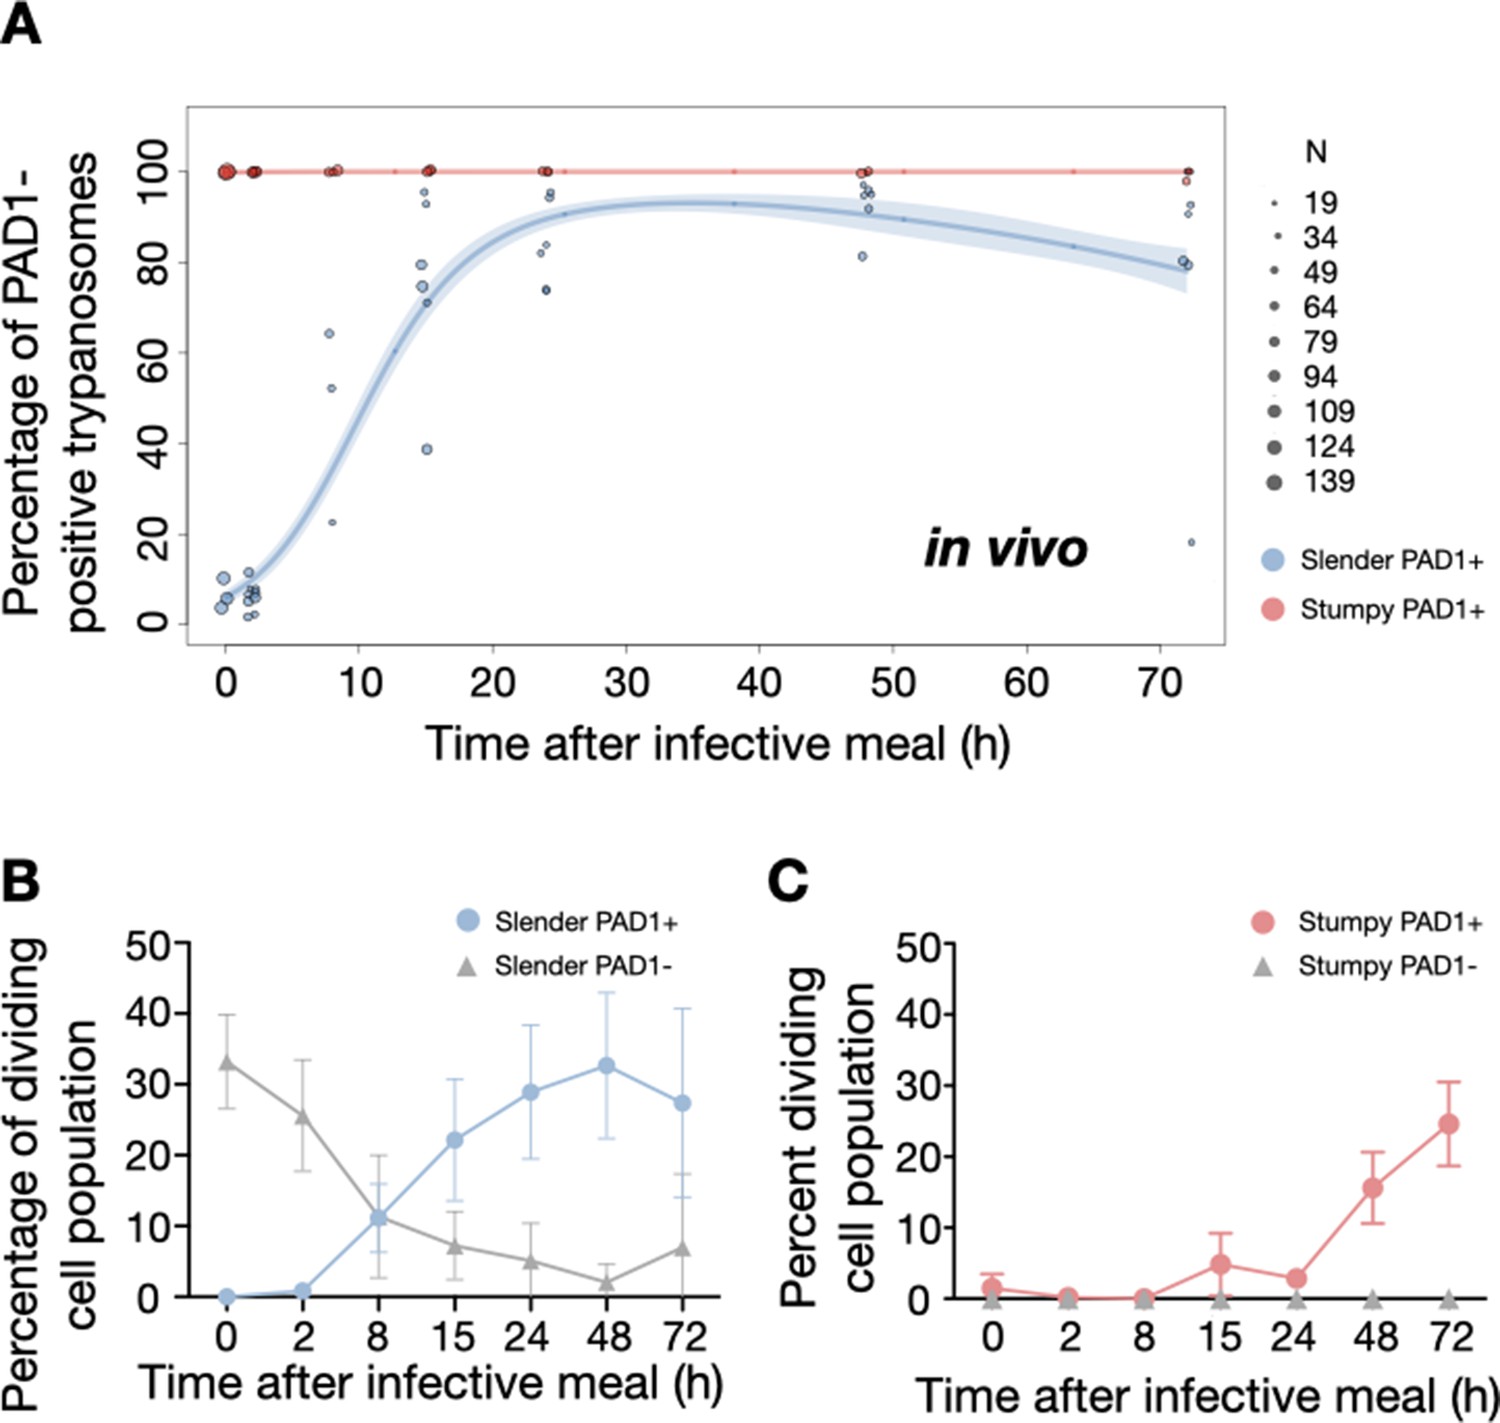
Slender trypanosomes activate the PAD1 pathway upon uptake by the tsetse fly.
Tsetse flies were infected with either slender (3.6% PAD1-positive) or stumpy (100% PAD1-positive) trypanosomes. 72 (slender) or 42 (stumpy) flies were dissected (equal sex ratios) at different timepoints after infection (for each time point, one hour was given to either slender or stumpy infected flies for dissection and cell analysis). Experiments were done at least three times. Living trypanosomes (>100 cells per time point) were microscopically analysed in the explanted tsetse midguts and scored for the expression of the fluorescent stumpy reporter GFP:PAD1UTR in the nucleus. Stumpy cells (n=1237) are red, and slender cells (n=1845) are blue. (A) Percentages of PAD1-positive slender and stumpy cells over time after uptake by the tsetse fly. Points indicate the individual experiments for either slender (blue) or stumpy (red). Point sizes correspond to the total number of cells counted per experiment. These data were fed into a point estimate model and are shown as solid lines, indicating the predicted percentage of PAD1-positive cells, based on time vs. cell type. Transparent colours indicate the associated 95% confidence bands. The difference between slender and stumpy cells over time is strongly significant (p<0.001). (B, C) Slender and stumpy trypanosomes scored as PAD1-positive or -negative were also stained with DAPI, and the cell cycle position determined based on the configuration of kinetoplast (K) to nucleus (N) at the timepoints indicated. The dividing slender population (B) and dividing stumpy population (C) are shown. As seen, the percentage of PAD1-positive slender cells steadily increased (B, blue) while the percentage of PAD1-negative cells steadily decreased (B, grey). This shows that slender cells can seamlessly turn on the PAD1 pathway, within a continuously dividing population. Stumpy cells did not show a normal cell cycle profile until 48 hr after tsetse uptake (C, red), as the cells differentiated to the procyclic stage. They did however remain PAD1-positive even as dividing parasites at 72 hr. Data are shown as mean +/- SD. Points without SD were the result of two measurements at those timepoints.
Figure 5—figure supplement 1
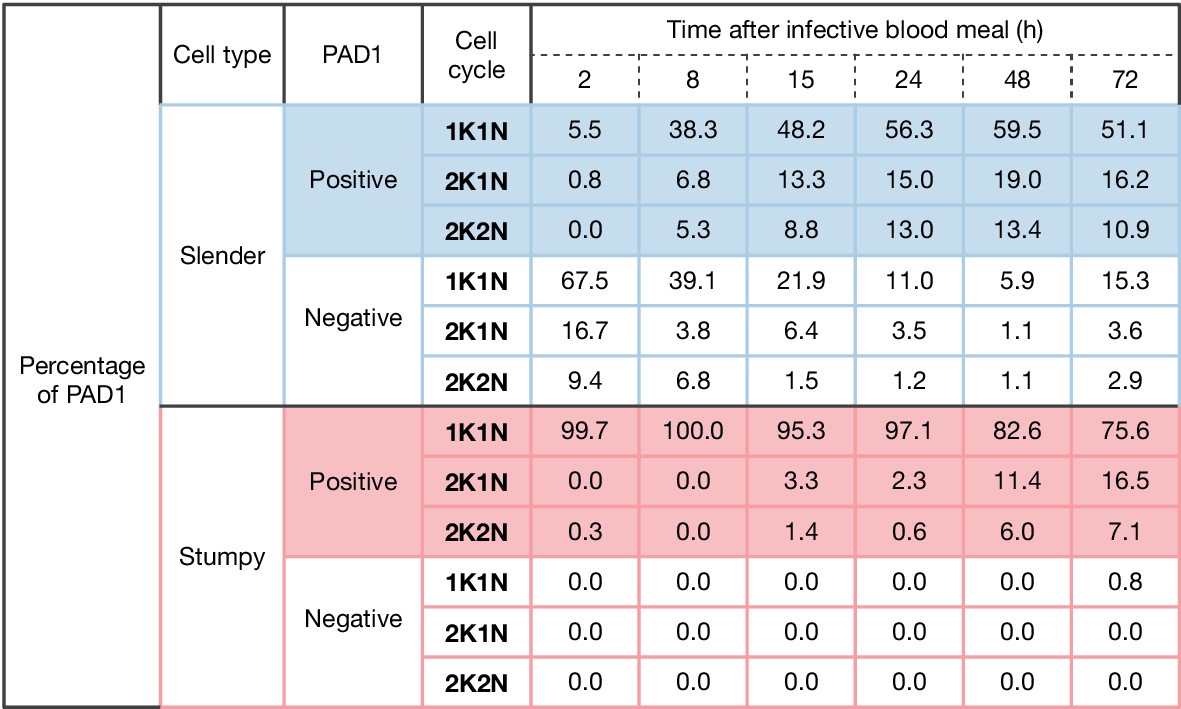
Slender populations exhibit continuous division while turning on the PAD1 pathway.
Tsetse flies were infected with either slender (3.6% PAD1-positive) or stumpy (100% PAD1-positive) trypanosomes. Seventy-two (slender) or 42 (stumpy) flies were dissected (equal sex ratios) at different timepoints after infection. Experiments were done at least three times. Living trypanosomes (>100 cells per time point) were microscopically analysed in the explanted tsetse midguts and scored for the expression of the fluorescent stumpy reporter GFP:PAD1UTR in the nucleus. Stumpy (n=1237) and slender (n=1845) trypanosomes scored as PAD1-positive or -negative were also stained with DAPI, and the cell cycle position determined based on the configuration of kinetoplast (K) to nucleus (N) at the timepoints. The percentages of either PAD1-positive (color) or -negative (white) cells for both slender (blue) and stumpy (red) are shown for each stage of the cell cycle over six time points. These data show that slender cells can turn on the PAD1 pathway, within a continuously dividing population. Stumpy cells did not show a normal cell cycle profile until 48 hr after tsetse uptake, as the cells differentiated to the procyclic stage.
Figure 5—figure supplement 2

Slender cells survive in the tsetse midgut at early timepoints after infection.
Tsetse flies were infected with either slenderSIF (blue) or stumpySIF (red) trypanosomes followed by dissection and microscopic analyses at early time points after infection (from Figure 5). During analyses, one hour was used to find as many live cells as possible in the explanted midguts of the tsetse for each cell type used for infection (slender and stumpy). As the same time was used to find cells, differences in the number of live cells counted shows if there is mass cell death of a certain cell type. Experiments were performed at least three times each. Parametric, unpaired t-tests resulted in no significant difference between the number of cells found (in a one-hour period) between slender and stumpy infections at either 2 or 8 hr after infection. Statistical tests were done using Graphpad Prism version 8.4.0 for macOS, graphpad software, San Diego, California USA.
Figure 6
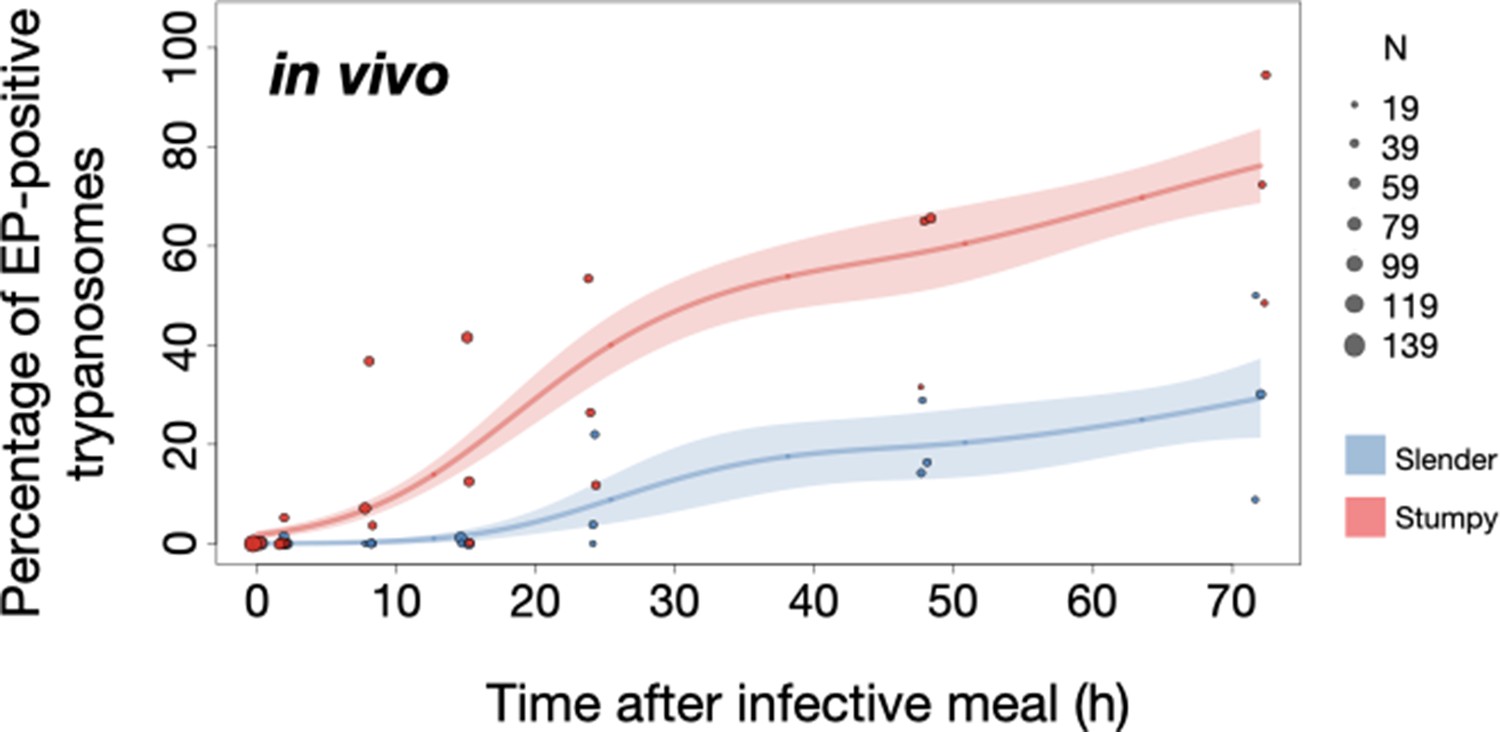
Slender trypanosomes show delayed expression of EP compared to stumpy trypanosomes, while directly differentiating to the procyclic life cycle stage in the tsetse fly.
Tsetse flies were infected with either slender (3.6% PAD1-positive) or stumpy (100% PAD1-positive) trypanosomes. 72 (slender) or 42 (stumpy) flies were dissected (equal sex ratios) at different timepoints after infection (for each time point, one hour was given to either slender or stumpy infected flies for dissection and cell analysis). Experiments were done at least three times. Living trypanosomes (>100 cells per time point) were microscopically analysed in explanted tsetse midguts and scored for the procyclic insect stage reporter EP1:YFP on the cell surface. Stumpy cells (n=1237) are shown in red and slender cells (n=1845) in blue. Points indicate the individual cell counts for either slender (blue) or stumpy (red). Point sizes correspond to the total number of cells counted per experiment. These data were fed into a point estimate model (see Materials and methods) and are shown as solid lines, indicating the predicted percentage of EP-positive cells, based on time vs. cell type. Shading above and below the lines indicates the associated 95% confidence bands. The difference between slender and stumpy cells over time was strongly significant (p<0.001).
Figure 7 with 3 supplements

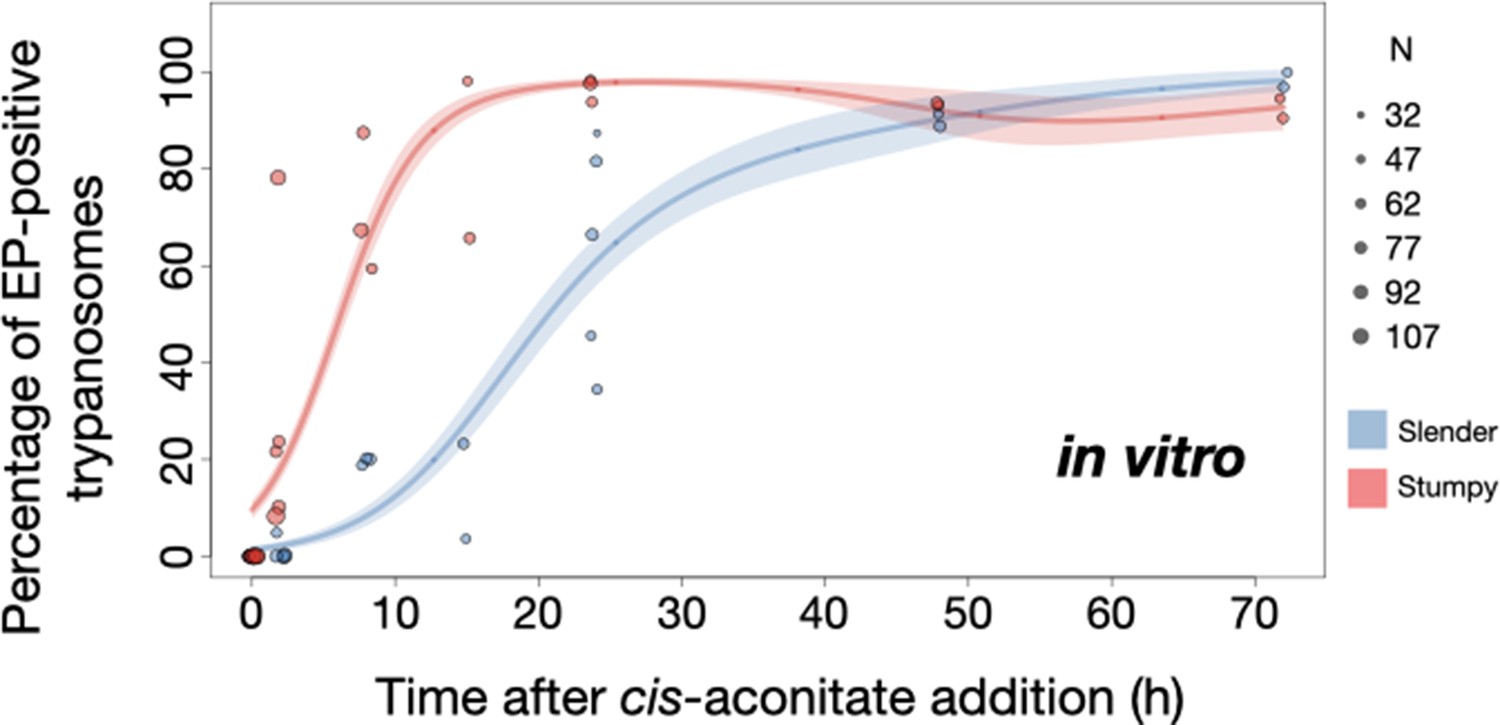
Slender trypanosomes activate the PAD1 pathway in vitro with a continuously dividing population.
Cultured slender or stumpy trypanosomes were differentiated in vitro by the addition of cis-aconitate and a temperature reduction to 27°C. At the times indicated, trypanosomes were analysed for the expression of the fluorescent stumpy reporter GFP:PAD1UTR, as in Figure 5. Slender cells (n=1653) are shown in blue and stumpy cells (n=1798) in red. Data were compiled from five independent experiments, with each time point being analysed in at least two separate experiments. (A) Percentages of PAD1-positive slender and stumpy cells over time. Points indicate the individual experiments for either slender (blue) or stumpy (red) trypanosomes. Point sizes correspond to the total number of cells counted per experiment. These data were fed into a point estimate model, and are shown as solid lines, indicating the predicted percentage of PAD1-positive cells, based on time vs. cell type. Transparent colours indicate the associated 95% confidence bands. The difference between slender and stumpy cells over time was strongly significant (p<0.001). (B, C) Slender and stumpy trypanosomes scored as PAD1-positive or -negative were also stained with DAPI, and the cell cycle position determined based on the configuration of kinetoplast (K) to nucleus (N) at the timepoints indicated. The dividing slender population (B) and dividing stumpy population (C) are shown. As seen, the percentage of PAD1-positive slender cells steadily increased (B, blue) and the percentage of PAD1-negative cells steadily decreased (B, grey). This shows that slender cells can turn on the PAD1 pathway without apparent cell cycle arrest. Although a small portion of the stumpy population was observed to to divide throughout the time points (C, red), cells did not return to a normal cell cycle profile until 48 hr after the addition of cis-aconitate. As the cells became more procyclic, they began to lose their PAD1 signal and an increase in PAD1-negative dividing cells was seen (B, C, grey). Data are shown as mean +/- SD. Points without SD were the result of two measurements at those timepoints.
Figure 7—figure supplement 1
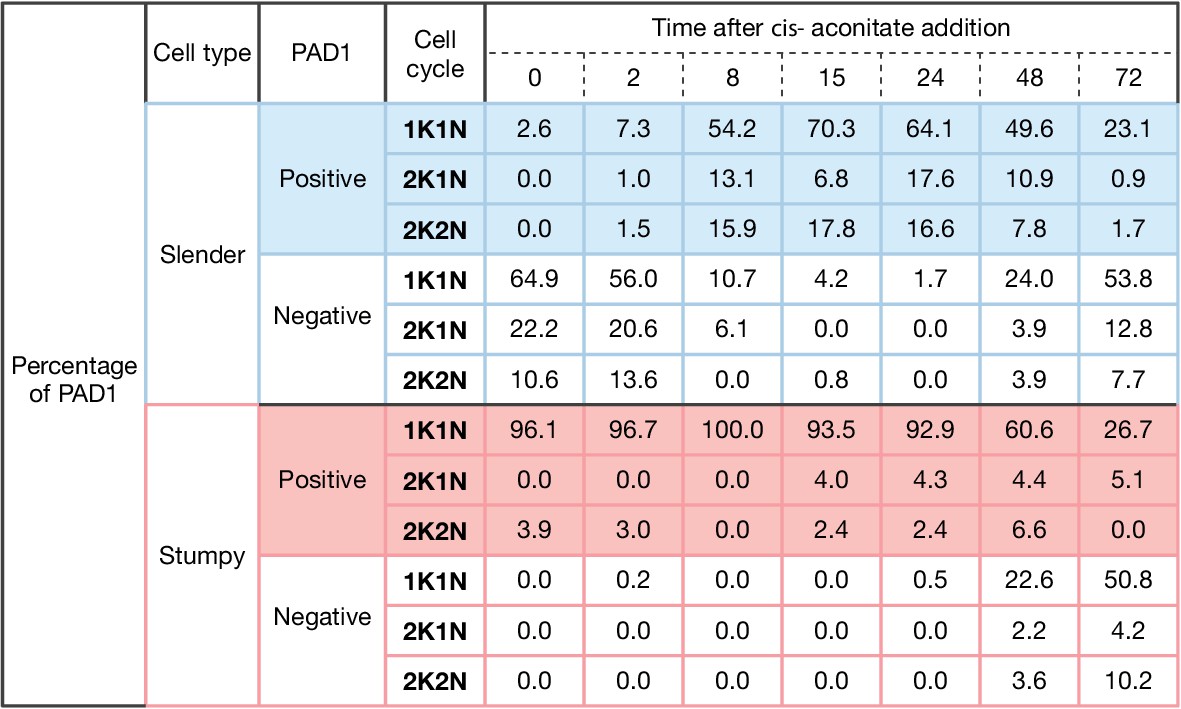
Slender trypanosomes activate the PAD1 pathway in vitro with a continuously dividing cell population.
Cultured slender or stumpy trypanosomes were differentiated in vitro by the addition of cis-aconitate and temperature reduction to 27°C. At the times indicated, trypanosomes were analysed for the expression of the fluorescent stumpy reporter GFP:PAD1UTR. Data were compiled from five independent experiments, with each time point being analysed in at least two separate experiments. Slender (n=1653) and stumpy (n=1798) trypanosomes scored as PAD1-positive or -negative were also stained with DAPI, and the cell cycle position determined based on the configuration of kinetoplast (K) to nucleus (N) at the timepoints. The percentages of either PAD1-positive (color-filled boxes) or -negative (white-filled boxes) cells for both slender (blue) and stumpy (red) are shown for each stage of the cell cycle over the seven time points. These data show that slender cells can seamlessly turn on the PAD1 pathway within a continuously dividing population. Stumpy cells did not show a normal cell cycle profile until 48 hr after tsetse uptake, as the cells differentiated to the procyclic stage.
Figure 7—figure supplement 2
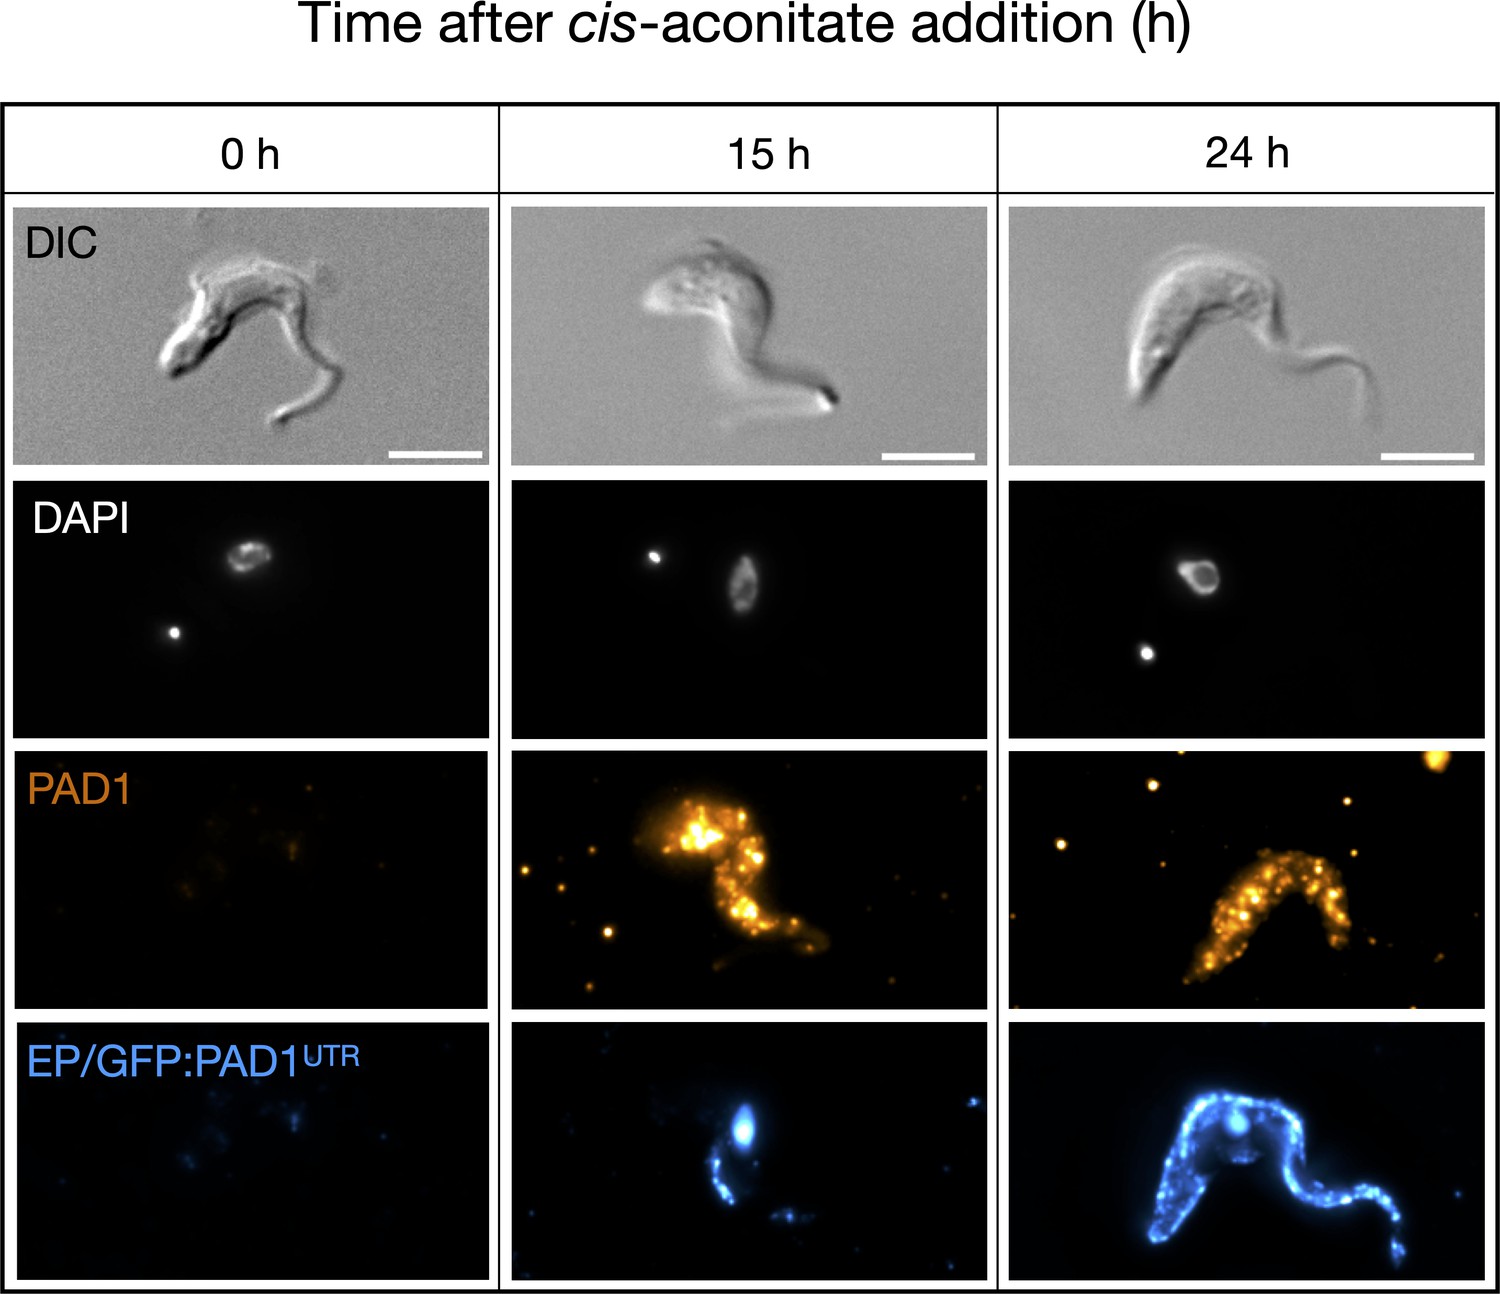
Slender cells express PAD1 and EP on their surface after the addition of cis-aconitate.
Immunofluorescence timecourse (h = hours) of slender cells from the cell line GFP:PAD1UTR after the addition of cis-aconitate. Cells were fixed in formaldehyde and labelled with both anti-PAD1 and anti-EP antibodies, without membrane permeabilisation, in order to only detect surface-localised proteins. The fluorescent nucleus seen in the ‘EP’ channel at 15 and 24 hr timepoints are from the background GFP:PAD1UTR signal (containing a nuclear localisation sequence and having the same fluorescent signal as the secondary antibody used to target anti-EP), further showing that the PAD1 mRNA signal correlates with the expression of the PAD1 protein on the cell surface. DAPI (grey), PAD1 (orange), and EP (blue) are shown. Scale bar = 5 µm.
Figure 7—figure supplement 3
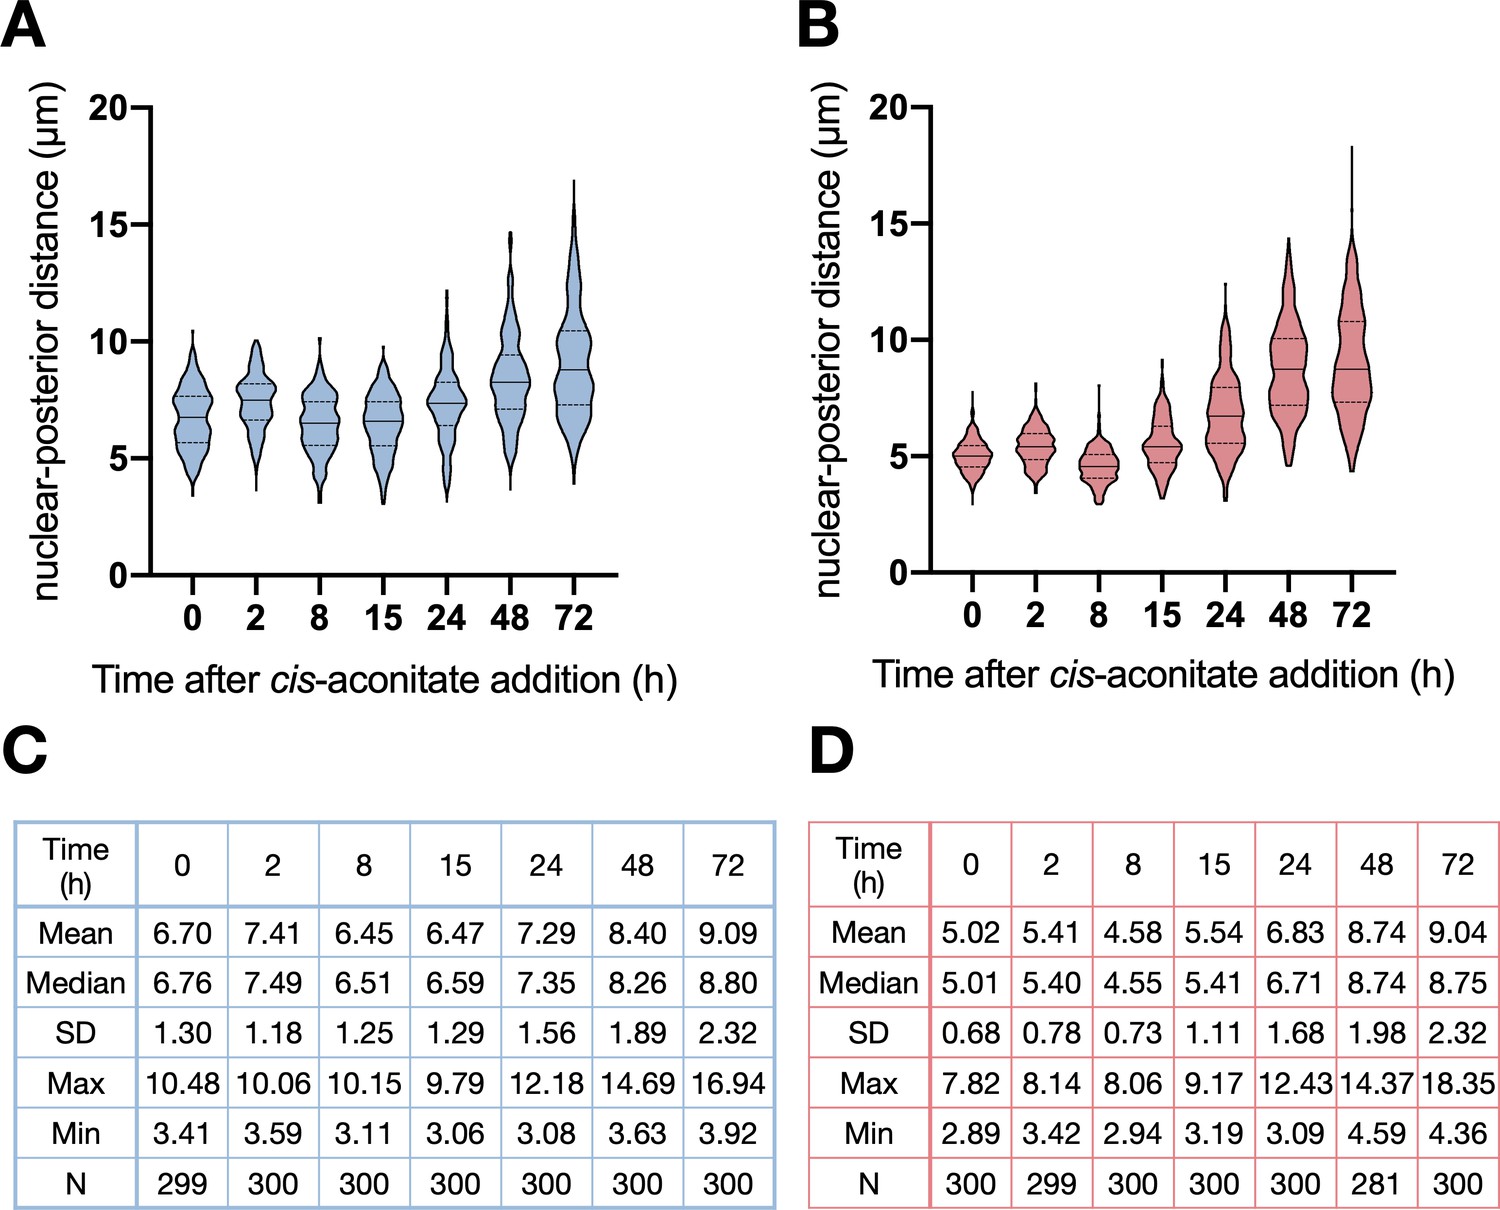
Slender trypanosomes exhibit procyclic morphology on the same time scale as stumpy trypanosomes when differentiating.
Cultured slender (harvested at or below 5x10⁵ cells/ml) or stumpy (Seeded at 5x10⁵ cells/ml and left undiluted for 48 hr before harvesting) trypanosomes were differentiated in vitro by the addition of cis-aconitate and a temperature reduction to 27°C. The distance from the centre of the cell nucleus to the posterior end of the cell, following the midline, was measured (in µm) by overlaying DIC and DAPI images, and using imageJ. Three independent experiments were conducted three times per timepoint, with 81–100 cells being analysed for each. (A–B) Violin graphs showing all data collected for slender (A) and stumpy (B) trypanosomes over several timepoints after the addition of cis-aconitate. The solid line is at the median, with dotted lines at the 25% and 75% quartiles. (C–D) Tables showing the mean, median, standard deviation (SD), maximum distance measured (Max), Minimum distance measured (Min), and the total cell number analysed (n) for each time point.
Figure 8
Slender trypanosomes show delayed expression of EP while they differentiate to the procyclic life cycle stage in vitro.
Cultured slender or stumpy trypanosomes were differentiated in vitro by the addition of cis-aconitate and a temperature reduction to 27°C. At the times indicated, trypanosomes were analysed for the expression of the procyclic fluorescent reporter EP1:YFP, as in Figure 6. Stumpy cells (n=1798) are shown in red and slender cells (n=1653) in blue. Points indicate the individual experiments for either slender or stumpy. Point sizes correspond to the total number of cells counted per experiment. These data were fed into a point estimate model and are shown as solid lines, indicating the predicted percentage of EP-positive cells, based on time vs. cell type. Shading above and below the lines indicates the associated 95% confidence bands. The difference between slender and stumpy cells over time was strongly significant (p<0.001).
Figure 9
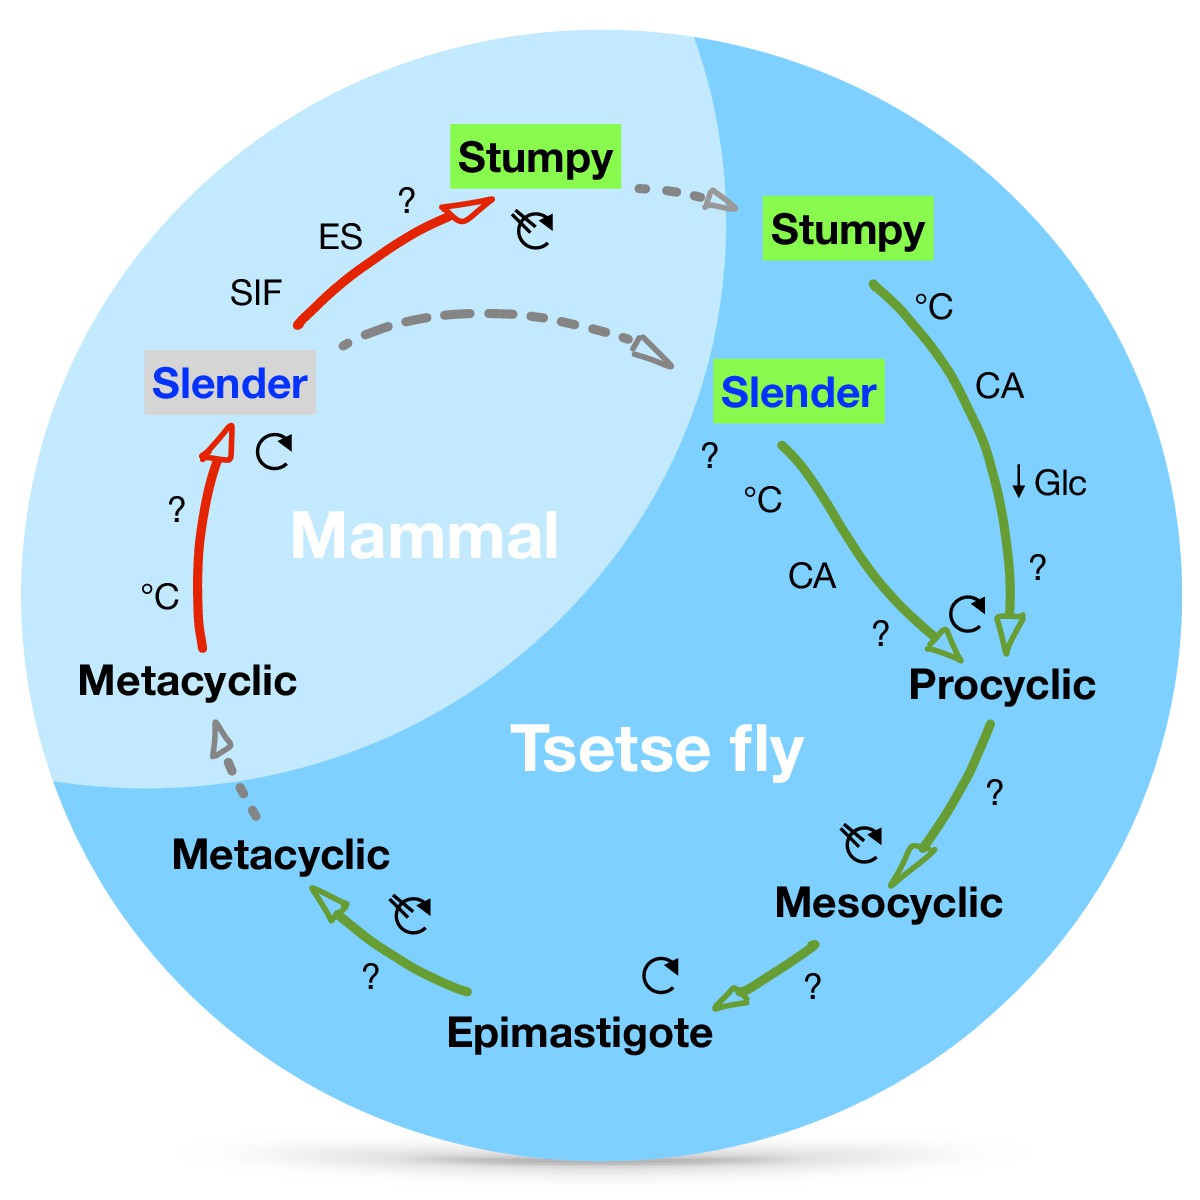
A revised life cycle for the parasite Trypanosoma brucei.
Cell-cycle-arrested (G0) metacyclic trypanosomes are injected by the tsetse fly into the mammalian host’s skin. There, the parasites re-enter the cell cycle, and proliferate as ( ) slender forms in the blood, while disseminating into the interstitium and various tissues, including fat and brain. At least two triggers (SIF or ES) launch the PAD1-dependent differentiation pathway (light green boxes) to the cell cycle-arrested (
 ) stumpy bloodstream stage. Stumpy trypanosomes can establish a fly infection when taken up with the bloodmeal of a tsetse. The work described here reveals that proliferating slender stage trypanosomes are equally effective for tsetse transmission, that a single parasite suffices, and that the population can continuously divide while differentiating to the procyclic insect stage. The triggers that initiate further developmental transitions are temperature (°C), cis-aconitate (CA) and glucose deprivation (↓Glc).
Tables
Key resources table
| Reagent type (species) or resource | Designation | Source or reference | Identifiers | Additional information |
|---|---|---|---|---|
| Cell line (Trypanosoma brucei brucei) | ‘SIF’ cell line, EATRO 1125 Antat1.1(GFP:PAD1UTR) | The GFP:PAD1UTR reporter was verified in: Zimmermann et al., 2017 | DOI:10.1371/journal.ppat.1006324 | Transfected with: p4231 (containing an NLS-GFP reporter fused to the 3’ UTR of the PAD1 gene, which inserts into the β-tubulin locus; provided by Mark Carrington) |
| Cell line (Trypanosoma brucei brucei) | ‘ES’ cell line, Antat1.1 13–90 (GFP:PAD1UTR) | This cell line was verified in: Zimmermann et al., 2017 | DOI:10.1371/journal.ppat.1006324 | Transfected with: pLew13 (Addgene plasmid 24007, G. Cross); pLew90 (Addgene plasmid 24008, G. Cross); p4231 (containing an NLS-GFP reporter fused to the 3’ UTR of the PAD1 gene, which inserts into the β-tubulin locus; provided by Mark Carrington) |
| Cell line (Trypanosoma brucei brucei) | ‘SIF’ cell line, EATRO 1125 Antat1.1(GFP:PAD1UTR) with an EP1:YFP fusion protein | The GFP:PAD1UTR reporter was verified in: Zimmermann et al., 2017 The EP1:YFP reporter was verified in: Engstler and Boshart, 2004 | DOI:10.1371/journal.ppat.1006324 DOI: 10.1101/gad.323404 | Transfected with: p4231 (containing an NLS-GFP reporter fused to the 3’ UTR of the PAD1 gene, which inserts into the β-tubulin locus; provided by Mark Carrington); pGaprone(ble)_EPGFG_rev GPY PARPYFP |
| Cell line (Trypanosoma brucei brucei) | Monomorphic cell line,T. brucei 427 MITat 1.2 13–90 | This cell line was verified in: Wirtz et al., 1999 | DOI: 10.1016/s0166-6851(99)00002-x | |
| Antibody | Anti-PAD1 (Trypanosoma brucei brucei) (Rabbit Polyclonal) | This antibody was generated and verified in: Dean et al., 2009 | DOI: 10.1038/nature07997 | IF (1:100) |
| Antibody | Anti-EP1 (Trypanosoma brucei brucei) (Mouse monoclonal) | CEDARLANE | Product code: CLP001A | IF (1:500) |
| Chemical compound, drug | Methylcellulose | Sigma Aldrich | Product code: 94378 | Methocel A4M |
| Software, algorithm | R | R core team | Package ‘mgcv’ | |
| Software, algorithm | ImageJ | NIH | DOI: 10.1038/nmeth.2089 |
Additional files
Download links
A two-part list of links to download the article, or parts of the article, in various formats.
Downloads (link to download the article as PDF)
Open citations (links to open the citations from this article in various online reference manager services)
Cite this article (links to download the citations from this article in formats compatible with various reference manager tools)
Unexpected plasticity in the life cycle of Trypanosoma brucei
eLife 10:e66028.
https://doi.org/10.7554/eLife.66028


