Distinct skeletal stem cell types orchestrate long bone skeletogenesis
- Institute for Stem Cell Biology and Regenerative Medicine, Stanford University School of Medicine, United States
- Chan Zuckerberg BioHub, United States
- Ludwig Center for Cancer Stem Cell Biology and Medicine at Stanford University, United States
- Department of Surgery, Stanford University School of Medicine, United States
- Hagey Laboratory for Pediatric Regenerative Medicine, Stanford University School of Medicine, Stanford University, United States
Figures
Figure 1 with 1 supplement
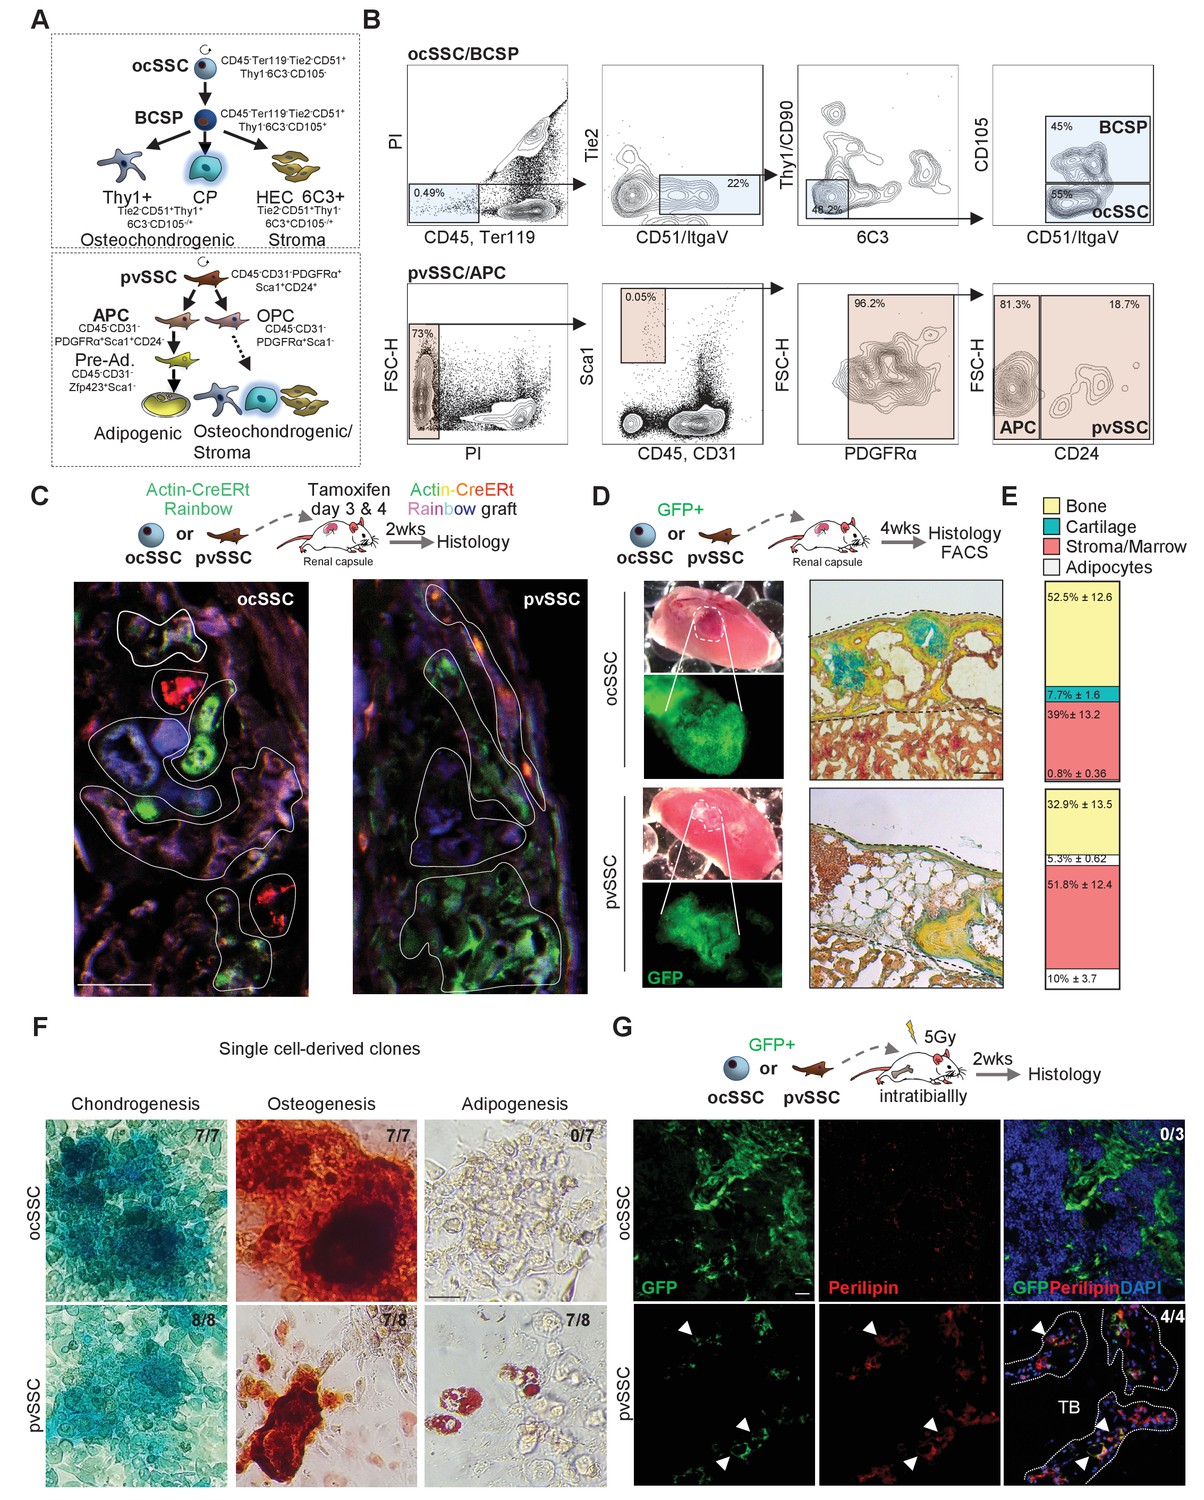
Two cell populations with skeletal stem cell characteristics in postnatal long bones.
(A) Diagram showing two previously described skeletal stem cell (SSC) populations and the downstream populations they generate, which were defined by the specific expression patterns of cell surface proteins. Top: SSC lineage tree of the osteochondral SSC (ocSSC) that gives rise to bone, cartilage, and stromal populations. Bottom: the lineage tree of the perivascular SSC (pvSSC) able to give rise to bone, cartilage, adipose tissue, and stromal populations. BCSP: bone cartilage stroma progenitor; CP: cartilage progenitor; APC: adipogenic progenitor cell; Pre-Ad.: pre-adipocyte; OPC: osteochondrogenic progenitor cell. (B) Representative flow cytometric gating strategy for the isolation of ocSSCs (top) and pvSSCs (bottom). (C) Representative confocal microscopy images of in vivo derived single-color clonal colonies of renal capsule-transplanted purified ocSSCs (left) and pvSSCs (right) derived from Actin-CreERt Rainbow mice. Three independent transplants per cell type under renal capsules were performed. (D) Renal capsule transplant-derived ossicles of purified GFP-labeled ocSSCs (top) and pvSSCs (bottom). Images show the photograph of the kidney with transplant (top left) and GFP signal of graft tissue (bottom left) as well as Movat pentachrome cross-section staining (right). (E) Quantification of ocSSC (top) and pvSSC (bottom) graft composition. Results of three separate experiments with n = 3 per SSC type. All data are shown as mean ± SEM. (F) Representative images of staining of clonally derived cultures that underwent tri-lineage differentiation assays in vitro. Alcian blue (chondrogenesis), Alizarin red S (osteogenesis), and oil red O (adipogenesis) stainings are shown along with the number of clones that stained positive for each differentiation type (ocSSC n = 7; pvSSC n = 8 clones). (G) Representative immunohistochemistry images for GFP (green) and perilipin (red) of tissue derived from intratibially transplanted purified GFP-labeled ocSSCs (top) and pvSSCs (bottom) 2 weeks after injection. White arrowheads: GFP+Perilipin+ cells. TB: trabecular bone. Three separate experiments with ocSSC n = 3 and pvSSC n = 4. Scale bars, 30 µm.
Figure 1—figure supplement 1
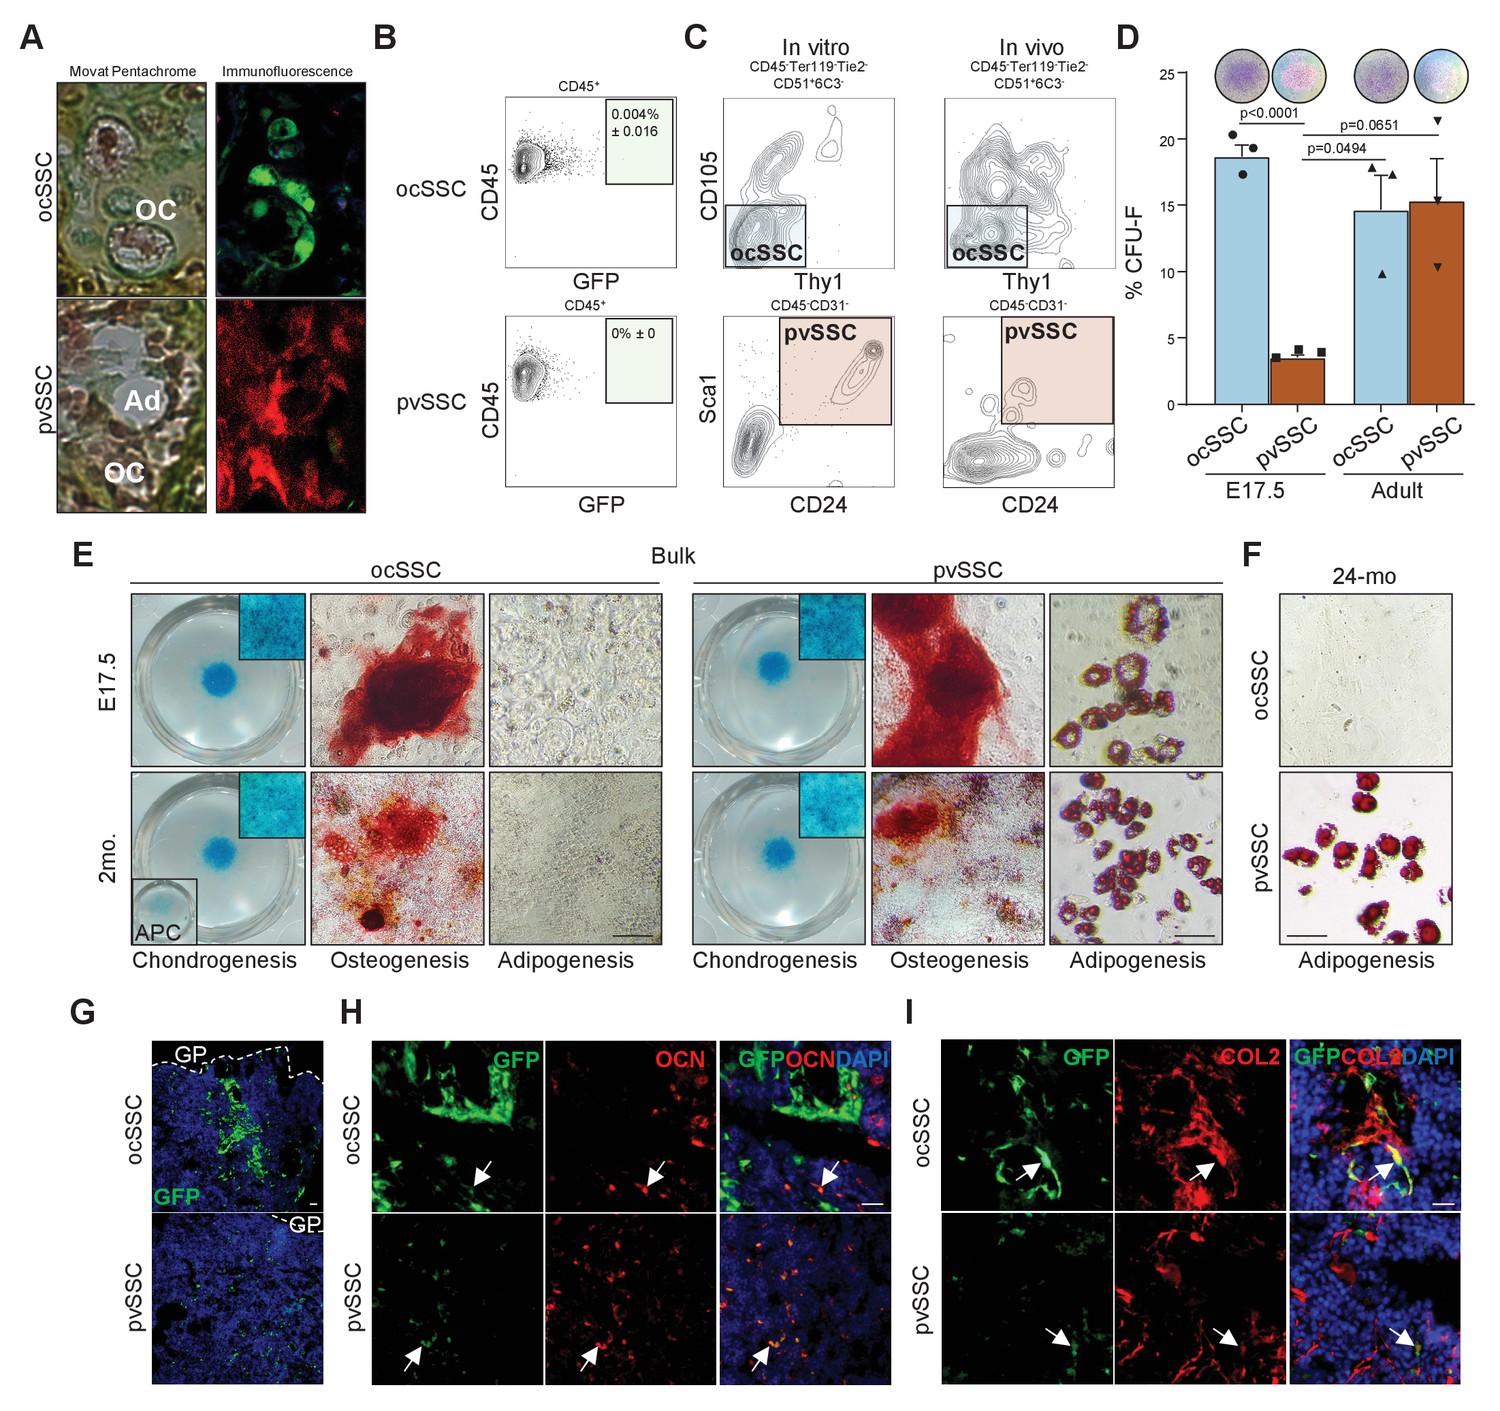
Perivascular SSCs, but not ocSSCs, are a source of bone marrow adipose tissue.
(A) Clonally derived osteochondrogenic (OC) and adipogenic (Ad) cell types of transplanted purified osteochondrogenic skeletal stem cells (ocSSCs) (top) and perivascular SSCs (pvSSCs) (bottom) isolated from ‘Rainbow’ mice detected in derived renal grafts. Left, Movat pentachrome staining of graft tissue and right, adjacent section with immunofluorescence of a green and a red clone. (B) Flow cytometric profile of GFP-labeled ocSSC (top) or pvSSC (bottom)-derived graft tissue of renal transplants for expression of CD45 and GFP. (C) Representative flow cytometric profiles of in vitro (left) derived primary cultures of purified ocSSCs (top) and pvSSCs (bottom) as well as in vivo generated grafts (right). (D) Fibroblast colony-forming unit (CFU-F) assay results of purified ocSSCs and pvSSCs from long bones of E17.5 embryos and 8-week-old mice (n = 3 per age group). Representative colonies derived from ocSSCs and pvSSCs stained for crystal violet are shown above respective data columns. (E) Tri-lineage differentiation outcome of bulk-sorted ocSSCs (left) and pvSSCs (right) from E17.5- or 8-week-old-mouse-derived long bones. Alcian blue (chondrogenesis), Alizarin red S (osteogenesis), and oil red O (adipogenesis) stainings are shown. APCs (adipogenic progenitor cells) that underwent chondrogenesis are shown as control. (F) Oil red O stainings of ocSSC and pvSSC derived from long bones of 24-month-old mice (24-mo) that underwent adipogenic differentiation are shown. (G) Immunohistochemistry fluorescence image of GFP-labeled ocSSC (top)- and pvSSC (bottom)-derived cells 2 weeks after intratibial injection. GP = growth plate. (H) Co-staining of ocSSC (top)- and pvSSC (bottom)-derived cells (green) with the osteogenic label osteocalcin (OCN) and (I) the chondrogenic label COL2. Scale bars, 30 µm. All data are shown as mean + SEM. Significance between groups assessed by unpaired, two-tailed Student’s t-test and corrected with Welch’s test for unequal distribution if needed.
-
Figure 1—figure supplement 1—source data 1
Functional characterization of ocSSCs and pvSSCs.
- https://cdn.elifesciences.org/articles/66063/elife-66063-fig1-figsupp1-data1-v1.xlsx
Figure 2 with 1 supplement
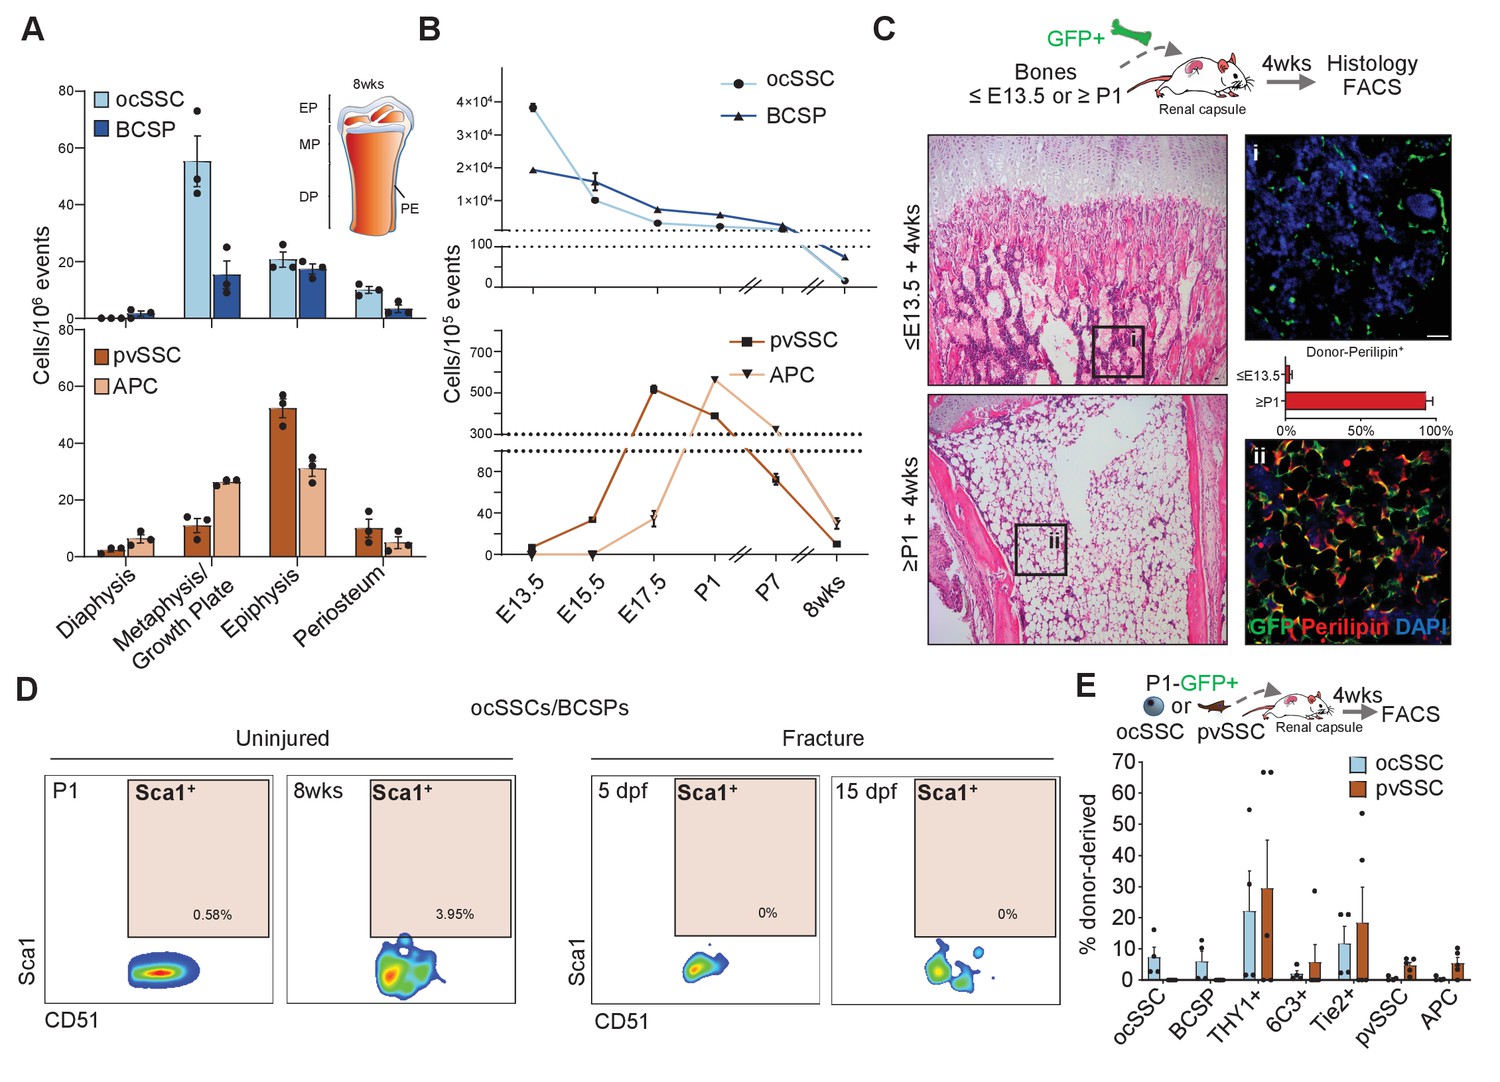
Osteochondral and perivascular SSCs are anatomically and developmentally distinct.
(A) Flow cytometric quantification of micro-dissected long bone regions of 8-week-old mice for the prevalence of osteochondrogenic skeletal stem cells (ocSSCs), bone cartilage and stromal progenitors (BCSPs), perivascular SSCs (pvSSCs), and adipogenic progenitor cells (APCs). EP: epiphysis, MP: metaphysis, DP: diaphysis, PE: periosteum (n = 3 mice). (B) Frequency of ocSSCs, BCSPs (top) and pvSSCs, APCs (bottom) in the long bones of mouse embryos developing into postnatal life assessed by flow cytometry (n = 3 mice per age group). (C) Dissected limb bones of GFP-expressing embryos between E12-E13.5 (≤E13.5) and postnatal day 1–10 (≥P1) were transplanted under the renal capsule of NSG mice. 4 weeks after transplantation, bones were dissected out and sectioned for hematoxylin and eosin staining (left) and immunohistological staining for GFP (green) and perilipin (red) quantified as the percentage of GFP+Perilipin+ (right) cells (n = 4 bones per age group) below the distal growth plate. (D) Representative flow cytometric plots showing Sca1 expression in cells gated for CD45-Ter119-Tie2-CD51+6C3-Thy1- (ocSSC/BCSP) in long bones at postnatal day 1 and at 8 weeks of age (uninjured) as well as during regeneration at days post fracture (dpf) 5 and 15. (E) Flow cytometric analysis of lineage output in ocSSC (n = 4)- and pvSSC (n = 5)-derived renal grafts displayed as the percentage of all donor-derived cells from at least two independent experiments. All data are shown as mean + SEM. Scale bars, 30 µm.
-
Figure 2—source data 1
Anatomical and developmental assessment of ocSSCs and pvSSCs.
- https://cdn.elifesciences.org/articles/66063/elife-66063-fig2-data1-v1.xlsx
Figure 2—figure supplement 1

No overlap between bone-resident SSC subtypes.
(A) Representative flow cytometric plots of single-cell suspensions from 8-week-old long bones dissected into metaphysis/GP (growth plate) and flushed bone marrow stained for osteochondrogenic skeletal stem cells (ocSSCs) (top) and perivascular SSCs (pvSSCs) (bottom). (B) Image of GFP-labeled tibia and thoracic spine transplanted under the renal capsule (left). Image of GFP-labeled postnatal day 1 (P1) and E13.5 tibia bones dissected from the renal capsule of NSG mice 4 weeks after transplantation (right). (C) Flow cytometric analysis of transplanted and dissected out tibia bones for GFP+ocSSCs and bone cartilage and stromal progenitors (BCSPs). (D) Flow cytometric analysis of transplanted and dissected out tibia bones for GFP+Sca1+ cells. (E) Representative flow cytometric plot showing gating for ocSSC lineage tree from CD45-Ter119-Sca1+ cells. (F) Quantification of flow cytometric data of ocSSC lineage tree cell populations as percentage of CD45-Ter119-Sca1+ cells (n = 3 mice). (G) Renal transplants of GFP-labeled E13.5 long bone-derived ocSSCs showing flow cytometric plot (left) and quantification of derived phenotypic pvSSC/APC (right) (n = 3). All data shown as mean + SEM.
-
Figure 2—figure supplement 1—source data 1
Non-overlapping SSC subtypes.
- https://cdn.elifesciences.org/articles/66063/elife-66063-fig2-figsupp1-data1-v1.xlsx
Figure 3 with 1 supplement
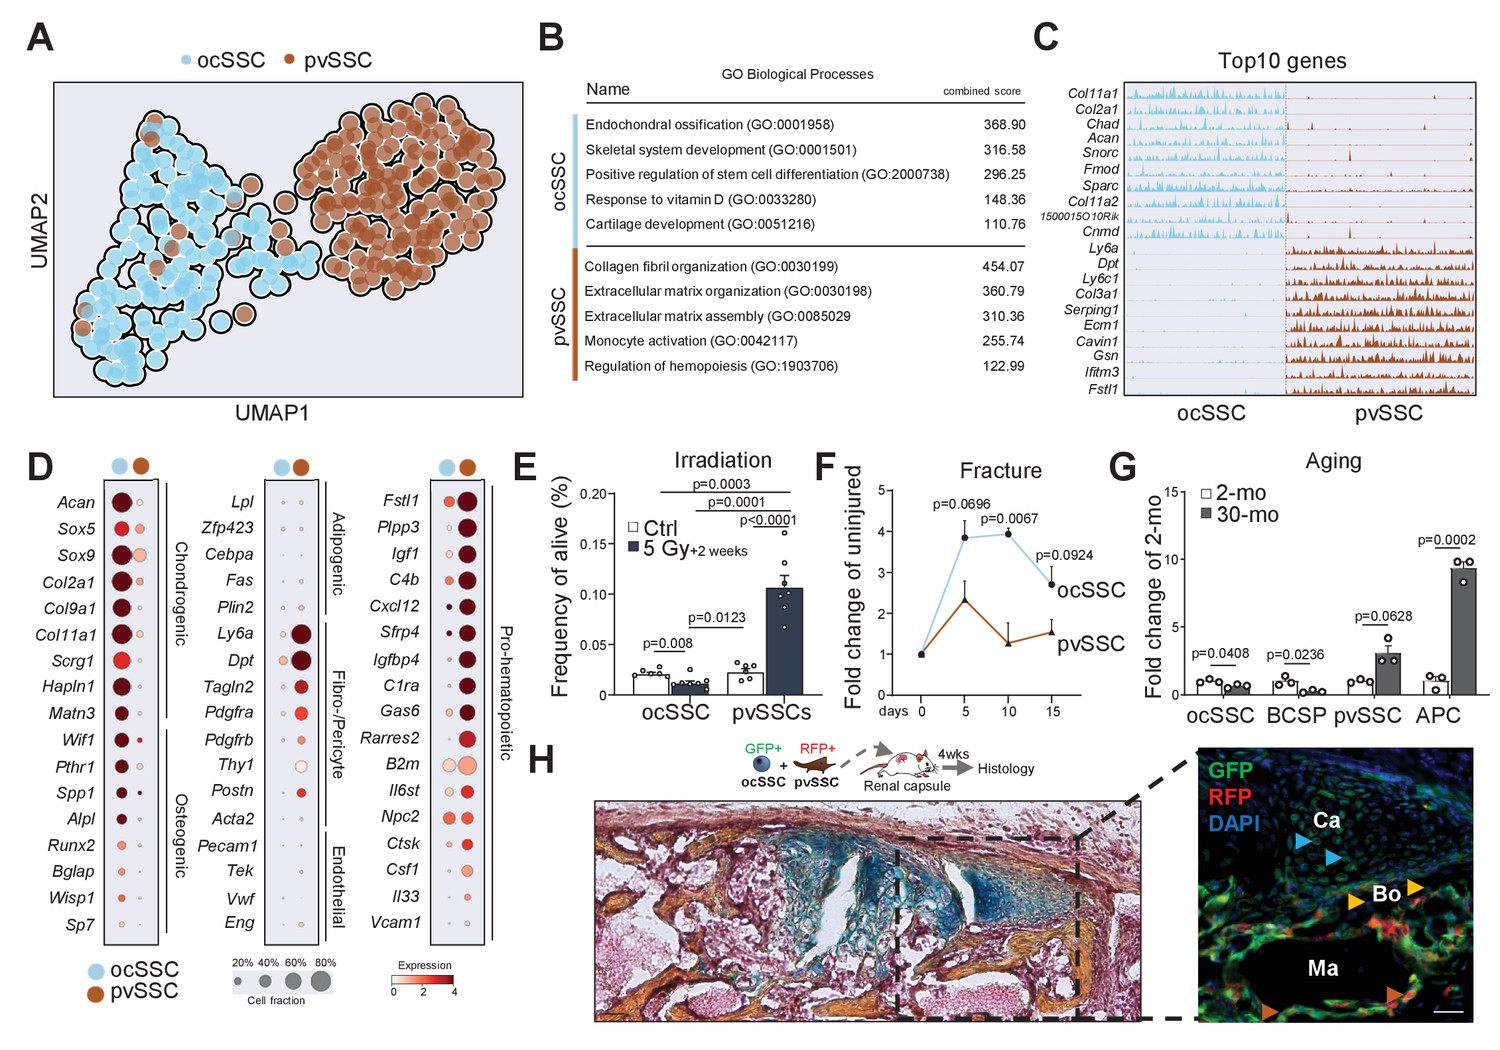
Molecular differences of SSC types infer specific niche functions.
(A) Single-cell RNA-sequencing analysis results of 143 osteochondrogenic skeletal stem cells (ocSSCs) and 169 perivascular SSCs (pvSSCs) shown as clustering by Uniform Manifold Approximation and Projection (UMAP). (B) Top Gene Ontology (GO) Biological Processes by all differentially expressed genes between ocSSCs and pvSSCs as determined through EnrichR. (C) Track plots of top 10 differentially expressed genes in ocSSCs and pvSSCs showing individual peaks per cell as the degree of their expression. (D) Dot plots showing expression of selected genes in ocSSCs and pvSSCs previously reported to characterize specific cell types. (E) Flow cytometric quantification of ocSSCs and pvSSCs 2 weeks after whole-body sublethal irradiation of 8-week-old mice (n = 6 control; n = 7 5Gy, from two independent experiments). (F) Flow cytometric quantification of ocSSCs and pvSSCs at various days after stabilized bi-cortical femoral fractures of 8-week-old mice shown as fold change of uninjured (n = 3 per timepoint from two independent experiments). (G) Flow cytometric quantification of ocSSCs, bone cartilage and stromal progenitors (BCSPs), pvSSCs, and adipogenic progenitor cells (APCs) in long bones of young (8 weeks; n = 3) and aged (30 months; n = 3) mice shown as fold change of young. (H) Renal capsule-derived grafts of co-transplants of equal numbers of ocSSCs and pvSSCs showing Movat pentachrome-stained cross-section (left) and the corresponding immunohistological staining (right) for GFP (ocSSC-derived cells) and red fluorescent protein (RFP) (pvSSC-derived cells). Light blue arrowhead: cartilage (Ca); yellow arrowhead: bone (Bo); brown arrowhead: marrow (Ma) lining cells. All data are shown as mean + SEM. Significance between groups was assessed by unpaired, two-tailed Student’s t-test and corrected with Welch’s test for unequal distribution if needed. Scale bars, 30 µm.
-
Figure 3—source data 1
Changes in SSC abundance in response to injury and aging.
- https://cdn.elifesciences.org/articles/66063/elife-66063-fig3-data1-v1.xlsx
Figure 3—figure supplement 1
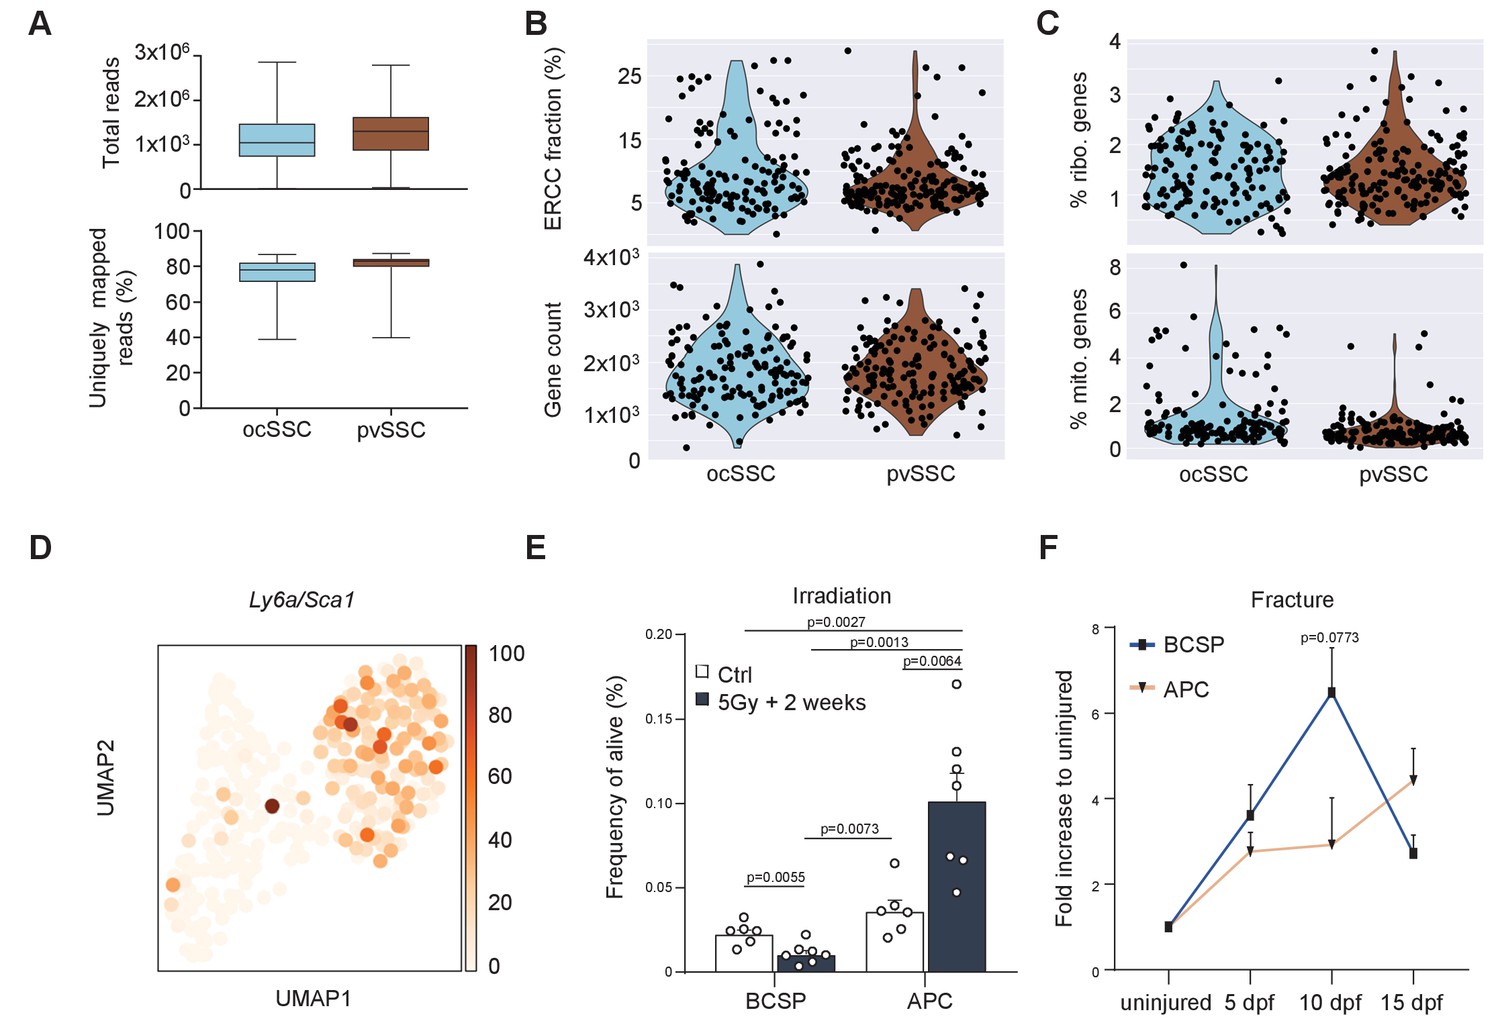
Two genetically and functionally distinct SSC lineages of long bones.
(A) Total read counts (top) and uniquely mapped reads (bottom) of quality-filtered osteochondrogenic skeletal stem cells (ocSSCs) (143 cells) and perivascular SSCs (pvSSCs) (169 cells). (B) ERCC (External RNA Controls Consortium) fraction of all read counts (top) and gene count (bottom) of quality-filtered ocSSCs (143 cells) and pvSSCs (169 cells). (C) Plots showing ribosomal (top) and mitochondrial (bottom) genes as percentage of total gene expression in filtered datasets. (D) Expression of Ly6a/Sca1 in single-cell RNA-sequencing data from ocSSCs and pvSSCs. (E) Flow cytometric quantification of bone cartilage and stromal progenitors (BCSPs) and adipogenic progenitor cells (APCs) 2 weeks after whole-body sublethal irradiation of 8-week-old mice (n = 6 control; n = 7 5Gy, from two independent experiments). (F) Flow cytometric quantification of BCSPs and APCs at various days after stabilized bi-cortical femoral fractures of 8-week-old mice shown as fold change of uninjured (n = 3 per timepoint from two independent experiments). Statistical testing was performed by unpaired, two-tailed Student’s t-test between groups. All data are shown as mean + SEM.
-
Figure 3—figure supplement 1—source data 1
Quality control of single cell RNA-sequencing data.
- https://cdn.elifesciences.org/articles/66063/elife-66063-fig3-figsupp1-data1-v1.xlsx
Figure 4
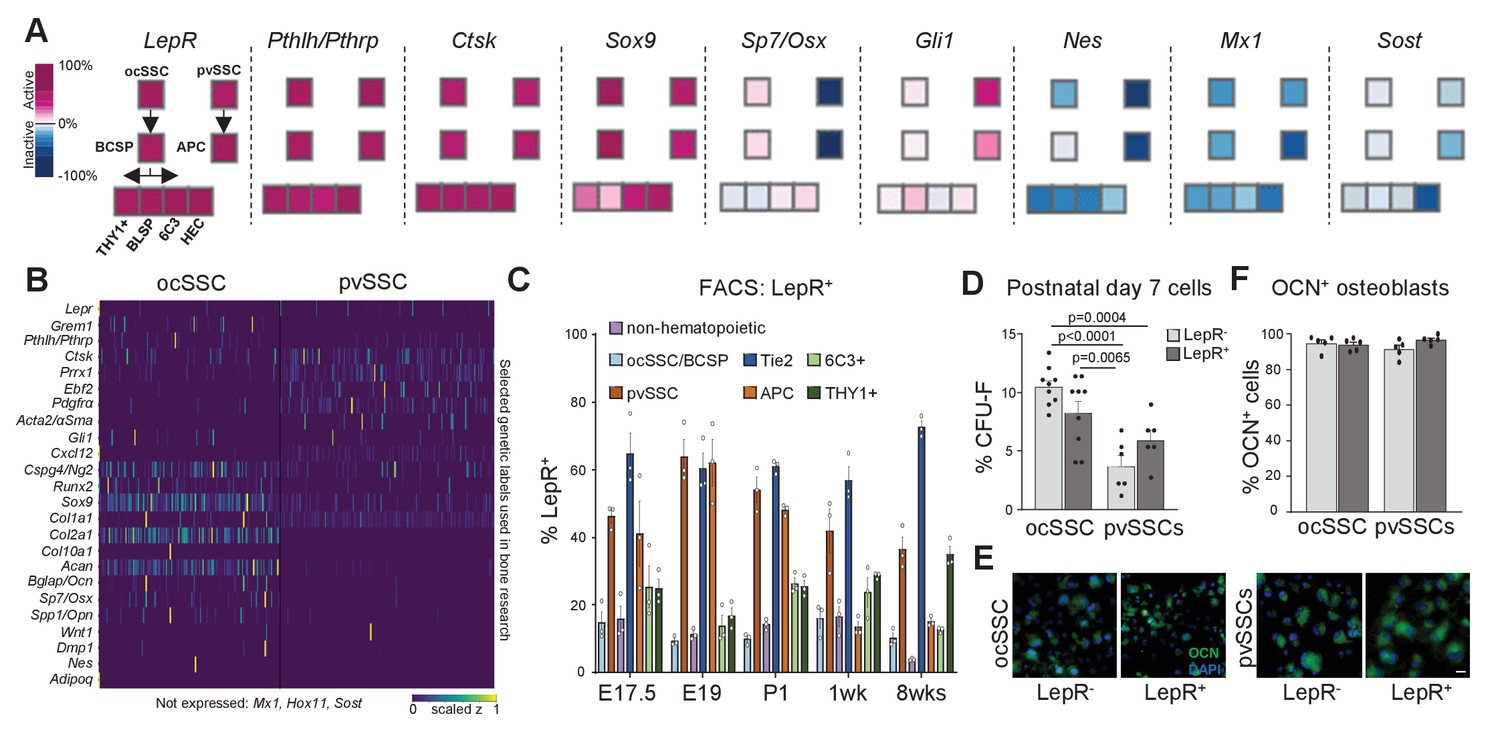
Variable expression of commonly used reporter genes in skeletal stem cell types.
(A) Microarray data of freshly purified bulk cell populations of the previously defined osteochondrogenic skeletal stem cell (ocSSC) and perivascular SSC (pvSSC) lineage trees from 8-week-old mice showing gene expression of markers commonly known to trace and/or label cell populations enriched for SSCs. Expression is shown as normalized activity as processed by GEXC (Gene Expression Commons). Each cell-type represents a pool of cells derived from three to four mice. (B) Single-cell heatmaps of gene expression of markers commonly used to trace and/or label cell populations enriched for SSCs as observed in single-cell RNA-sequencing (scRNAseq) results of ocSSCs and pvSSCs. (C) Flow cytometric analysis of antibody labeling for leptin receptor (LepR) in different populations of the ocSSC and pvSSC lineage trees in differently aged mice (n = 3). (D) Fibroblast colony-forming unit (CFU-F) assay of freshly isolated ocSSCs and pvSSCs separated by their expression of LepR (ocSSC n = 9; pvSSC n = 6, from two independent experiments). (E) Expression of osteocalcin (OCN, green) in in vitro osteogenically differentiated ocSSCs and pvSSCs in LepR-positive and -negative fractions. (F) Quantification of percentage of cells expressing OCN as determined by antibody labeling at 2 weeks of osteogenic differentiation (n = 5). Significance between groups was assessed by unpaired, two-tailed Student’s t-test. All data are shown as mean + SEM. Scale bars, 30 µm.
-
Figure 4—source data 1
Differences of LepR expression in SSC subtypes.
- https://cdn.elifesciences.org/articles/66063/elife-66063-fig4-data1-v1.xlsx
Figure 5 with 1 supplement

Stem cell crosstalk by distinct SSC subpopulations facilitates niche interactions.
(A) Single-cell RNA-sequencing analysis results of osteochondrogenic skeletal stem cells (ocSSCs) and perivascular SSCs (pvSSCs) shown as Leiden clustering to reveal heterogeneity within cell populations (top). Composition of clusters by SSC type (bottom). Cluster 1: 155 cells; cluster 2: 57 cells; cluster 3: 70 cells; cluster 4: 30 cells. (B) Heatmap of top 40 differentially expressed genes for each of the four Leiden clusters. (C) Violin plots of selected marker genes for each of the four Leiden clusters. (D) Expression of selected ligands and their receptors in Leiden clusters of SSC populations. Connected ligand-receptor genes in pairs have scaled z-score expression >0.5. (E) Expression of cluster 2-specific marker Wif1 in UMAP plot. (F) Expression of cluster 1-specific marker Cdh13 in UMAP plot. (G) Representative in situ RNAscope images showing detection of the Wif1 RNA transcripts in the growth plate (left) and their absence in diaphyseal bone marrow (right). (H) Representative in situ RNAscope images showing detection of the Cdh13 RNA transcripts in diaphyseal bone marrow (right) and their absence in the growth plate (left). Red arrowheads: RNA transcript-expressing cells. RZ: resting zone; PZ: proliferative zone; HZ: hypertrophic zone. Scale bars, 10 µm.
Figure 5—figure supplement 1
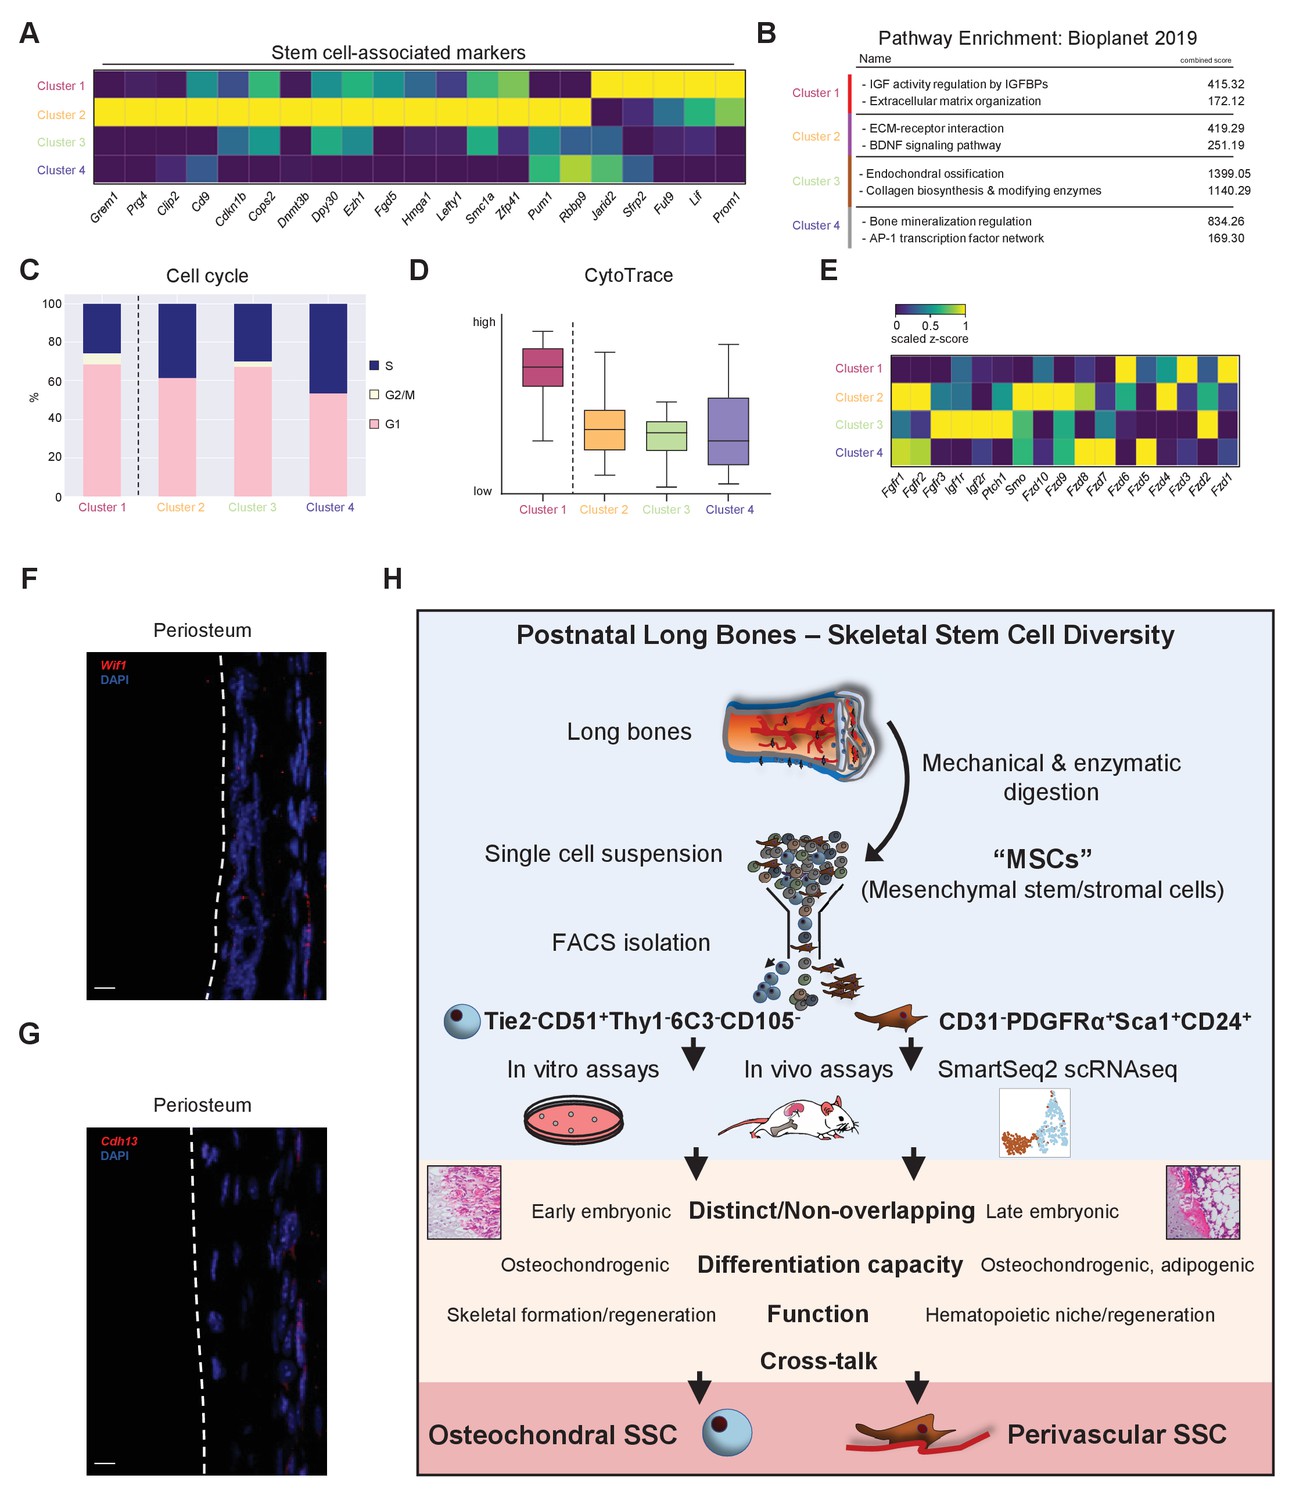
Single-cell heterogeneity and crosstalk of SSC subtypes.
(A) Expression of genes previously associated with stem cell-like populations and their expression in the four Leiden clusters. (B) Pathway enrichment analysis of top 100 genes expressed in Leiden clusters as determined by BioPlanet 2019 through EnrichR. (C) Cell cycle analysis of single-cell RNA-sequencing (scRNAseq) data with cell cycle status distribution in different Leiden clusters. (D) CytoTrace scores for cells of each cluster. Data are shown as box plots with min to max distribution (cluster 1: 155 cells; cluster 2: 57 cells; cluster 3: 70 cells; cluster 4: 30 cells). (E) Gene expression of receptors reported to be involved in skeletal regulation in the four Leiden clusters. (F) Representative in situ RNAscope images showing detection of the Wif1 (top) and Cdh13 (bottom) RNA transcripts in periosteal cells. (G) Schematic summary of the presented work. Single-cell suspension of mechanically and enzymatically digested bone tissue with subsequent selection by plastic adherence has long been used as a gold standard to enrich for skeletal stem and progenitor cells. Going beyond single-gene label selection for skeletal stem cell (SSC) populations, this work prospectively isolated SSC subtypes using a combination of surface markers. Functional in vitro and in vivo studies combined with SmartSeq2 scRNAseq revealed the existence of two distinct bona fide SSC types, an osteochondral and a perivascular SSC, with differences with respect to their anatomical localization, developmental appearance, differentiation capacity, and function. Scale bars, 10 µm.
-
Figure 5—figure supplement 1—source data 1
Cytotrace analysis of leiden clusters.
- https://cdn.elifesciences.org/articles/66063/elife-66063-fig5-figsupp1-data1-v1.xlsx
Tables
Key resources table
| Reagent type (species) or resource | Designation | Source or reference | Identifiers | Additional information |
|---|---|---|---|---|
| Strain | Mouse: B6 (C57BL/Ka-Thy1.1-CD45.1) | The Jackson Laboratory | JAX: 000406 | RRID:IMSR_JAX:000406 |
| Strain | Mouse: NSG (NOD.Cg-Prkdcscid Il2rgtm1Wjl/SzJ) | The Jackson Laboratory | JAX: 005557 | RRID:IMSR_JAX:005557 |
| Strain | Mouse: GFP (C57BL/6-Tg(CAG-EGFP)1Osb/J) | The Jackson Laboratory | JAX: 003291 | RRID:IMSR_JAX:003291 |
| Strain | Mouse: Actin-CreERt Rosa26-Rainbow (homozygous) | In-house | N/A | |
| Antibody | Anti-Mouse Ly-6A/E (Sca-1) APC (clone: D7) | ThermoFisher | Cat#: 17–5981 | FACS 1:200 (RRID:AB_469487) |
| Antibody | Anti-Mouse Ly-6A/E (Sca-1) Alexa Fluor 700 (clone: D7) | ThermoFisher | Cat#: 56–5981 | FACS 1:200 (RRID:AB_657837) |
| Antibody | Anti-Mouse Ly-6A/E (Sca-1) PE/Cy7 (clone: D7) | ThermoFisher | Cat#: 25–5981 | FACS 1:200 (RRID:AB_469669) |
| Antibody | Anti-Mouse CD45 FITC (clone: 30-F11) | ThermoFisher | Cat#: 11–0451 | FACS 1:200 (RRID:AB_465050) |
| Antibody | Anti-Mouse CD45 APC (clone: 30-F11) | ThermoFisher | Cat#: 17–0451 | FACS 1:200 (RRID:AB_469393) |
| Antibody | Anti-Mouse CD45 PE/Cy5 (clone: 30-F11) | ThermoFisher | Cat#: 15–0451 | FACS 1:200 (RRID:AB_468751) |
| Antibody | Anti-Mouse CD31 (PECAM-1) FITC (clone: 390) | ThermoFisher | Cat#: 11–0311 | FACS 1:200 (RRID:AB_465011) |
| Antibody | Anti-Mouse CD31 (PECAM-1) APC (clone: 390) | ThermoFisher | Cat#: 17–0311 | FACS 1:200 (RRID:AB_657735) |
| Antibody | Anti-Mouse TER-119 PE/Cy5 (clone: TER-119) | ThermoFisher | Cat#: 15–5921 | FACS 1:200 (RRID:AB_468811) |
| Antibody | Anti-Mouse CD140a (PDGFRA) APC (clone: APA5) | ThermoFisher | Cat#: 17–1401 | FACS 1:100 (RRID:AB_529482) |
| Antibody | Anti-Mouse CD24 APC-eFluor 780 (clone: M1/69) | ThermoFisher | Cat#: 47–0242 | FACS 1:200 (RRID:AB_10853172) |
| Antibody | Anti-Mouse CD51 PE (clone: RMV7) | ThermoFisher | Cat#: 12–0512 | FACS 1:100 (RRID:AB_465703) |
| Antibody | Anti-Mouse CD90.1 APC-eFluor 780 (clone: HIS51) | ThermoFisher | Cat#: 47–0900 | FACS 1:100 (RRID:AB_1272256) |
| Antibody | Anti-Mouse CD90.2 APC-eFluor 780 (clone: 53–2.1) | ThermoFisher | Cat#: 47–0902 | FACS 1:100 (RRID:AB_1272187) |
| Antibody | Anti-Mouse BP1 APC (clone: 6C3) | ThermoFisher | Cat#: 17–5891 | FACS 1:100 (RRID:AB_2762697) |
| Antibody | Anti-Mouse CD105 (Endoglin) Biotin (clone: MJ7/18) | ThermoFisher | Cat#: 13–1051 | FACS 1:100 (RRID:AB_466555) |
| Antibody | Anti-Mouse Tie2 (clone: Tek4) | ThermoFisher | Cat#: 14–5987 | FACS 1:20 (RRID:AB_467792) |
| Antibody | Anti-Mouse Leptin R Biotinylated Antibody (goat polyclonal) | R and D Systems | Cat#: BAF497 | FACS 1:50 (RRID:AB_2296953) |
| Antibody | Goat anti-GFP (polyclonal) | NovusBiologicals | Cat#: NB100-1770 | IF 1:200 (RRID:AB_10128178) |
| Antibody | Rabbit anti-Perilipin (polyclonal) | ThermoFisher | Cat#: PA5-72921 | IF 1:200 (RRID:AB_2718775) |
| Antibody | Rabbit anti-Osteocalcin (polyclonal) | Abcam | Cat#: ab93876 | IF 1:200 (RRID:AB_10675660) |
| Antibody | Rabbit anti-Collagen II (polyclonal) | Abcam | Cat#: ab34712 | IF 1:200 (RRID:AB_731688) |
| Antibody | Rat anti-Endomucin (Clone: V.7C7) | ThermoFisher | Car#: 14-5851-82 | IF 1:400 (RRID:AB_891527) |
| Antibody | Alexa Fluor 488 donkey anti-goat (polyclonal) | ThermoFisher | Cat#: A32814 | IF 1:500 (RRID:AB_2762838) |
| Antibody | Alexa Fluor 594 donkey anti-rabbit (polyclonal) | ThermoFisher | Cat#: A21207 | IF 1:500 (RRID:AB_141637) |
| Antibody | Alexa Fluor 700 goat anti-rabbit (polyclonal) | ThermoFisher | Cat#: A21038 | IF 1:500 (RRID:AB_2535709) |
| Antibody | Alexa Flour 488 goat anti-rat (polyclonal) | Abcam | Cat#: ab150157 | IF 1:500 (RRID:AB_2722511) |
| Sequence-based reagent | Oligo-dT30VN | IDT | N/A | (5’-AAGCAGTGGTATCAACGCA GAGTACT30VN-3’) |
| Sequence-based reagent | Template-switching oligonucleotide (TSO) | Exiqon | N/A | (5’-AAGCAGTGGTATCAACGCAGAGTACATrGrG+G-3’) |
| Sequence-based reagent | ISPCR primers | IDT | N/A | (5’-AAGCAGTGGTATCAACGCAGAGT-3’) |
| Sequence-based reagent | dNTP Set (100 mM) | ThermoFisher | Cat#: 10297-018A | |
| Sequence-based reagent | ERCC (External RNA Controls Consortium) ExFold RNA Spike-In Mixes | ThermoFisher | Cat#: 4456740 | |
| Peptide, recombinant protein | SMARTScribe reverse transcriptase | Clontech | Cat#: 639538 | |
| Peptide, recombinant protein | Streptavidin PE-Cyanine7 Conjugate | ThermoFisher | Cat#: 25-4317-82 | |
| Peptide, recombinant protein | Epidermal growth factor | PeproTech | Cat#: 315–09 | |
| Peptide, recombinant protein | Platelet-derived growth factor BB | PeproTech | Cat#: 315–18 | |
| Peptide, recombinant protein | Basic fibroblast growth factor | Sigma-Aldrich | Cat#: F0291 | |
| Peptide, recombinant protein | Transforming growth factor β1 | PeproTech | Cat#: 100–21 | |
| Commercial assay or kit | KAPA HiFi HotStart ReadyMix | Kapa Biosystems | Cat#: KK2602 | |
| Commercial assay or kit | HS NGS Fragment Kit (1–6000 bp), 1000 | Agilent | Cat#: DNF-474–1000 | |
| Commercial assay or kit | Nextera XT DNA Library Preparation kit | Illumina | Cat#: FC-131–1096 | |
| Commercial assay or kit | RNeasy Micro Kit | Qiagen | Cat#: 74004 | |
| Commercial assay or kit | RNAScope Multiplex Fluorescent V2 Assay | Acdbio | Cat#: 323100 | |
| Chemical compound | EDTA | ThermoFisher | Cat#: 15573–038 | |
| Chemical compound | Fluoromount-G | ThermoFisher | Cat#: 00-4958-02 | |
| Chemical compound | Paraformaldehyde (PFA) | Electron Microscopy Sciences | Cat#: 15710 | |
| Chemical compound | Matrigel | Corning | Cat#: CB40234A | |
| Chemical compound | Bovine serumalbumine (BSA) | Sigma-Aldrich | Cat#: A9647 | |
| Chemical compound | Triton X-100 (10%) | ThermoFisher | Cat#: 85111 | |
| Chemical compound | Recombinant RNase inhibitor | Clontech | Cat#: 2313B | |
| Chemical compound | Saffron | Sigma-Aldrich | Cat#: S8381-5G | |
| Chemical compound | Acid Fuchsin | Sigma-Aldrich | Cat#: F8129-25G | |
| Chemical compound | Acid Red 73 | Sigma-Aldrich | Cat#: 49823–25 MG | |
| Chemical compound | Phosphotungstic Acid | Sigma-Aldrich | Cat#: P4006 | |
| Chemical compound | Hematoxylin | Sigma-Aldrich | Cat#: MHS32-1L | |
| Chemical compound | Shandon Eosin Y | ThermoFisher | Cat#: 6766009 | |
| Chemical compound | Type II collagenase | Sigma-Aldrich | Cat#: C6885 | |
| Chemical compound | 100 U/ml DNase I | Worthington | Cat#: NC9199796 | |
| Chemical compound | Fetal bovine serum (FBS) | ThermoFisher | Cat#: 16000–069 | |
| Chemical compound | Optimal Cutting Temperature compound (OCT) | ThermoFisher | Cat#: 23-730-571 | |
| Chemical compound | Penicillin-Streptomycin Solution | ThermoFisher | Cat#: 15140–122 | |
| Chemical compound | Media 199 (M199) | Sigma-Aldrich | Cat#: C6885 | |
| Chemical compound | Agencourt AMPure XP beads | Beckman Coulter | Cat#: A63882 | |
| Chemical compound | UltraPure DNase/RNase-Free Distilled Water | ThermoFisher | Cat#: 10977023 | |
| Chemical compound | TRIzol LS | ThermoFisher | Cat#: 10296028 | |
| Chemical compound | Oil Red O | Sigma-Aldrich | Cat#: O0625 | |
| Chemical compound | Alizarin Red S | Carl Roth | Cat#: A5533-25G | |
| Chemical compound | Alcian Blue 8GX | Sigma-Aldrich | Cat#: A3157 | |
| Chemical compound | Crystal Violet | Sigma-Aldrich | Cat#: C0775 | |
| Chemical compound | MCDB201 Media | Sigma-Aldrich | Cat#: M6770 | |
| Chemical compound | Dexamethasone | Sigma-Aldrich | Cat#: D-4902 | |
| Chemical compound | L-Ascorbic acid 2-phosphate | Sigma-Aldrich | Cat#: A8960 | |
| Chemical compound | Insulin-transferrin-selenium (ITS) mix | Sigma-Aldrich | Cat#: I3146 | |
| Chemical compound | Linoleic acid-Albumin | Sigma-Aldrich | Cat#: L9530 | |
| Chemical compound | Indomethacin | Sigma-Aldrich | Cat#: I7378 | |
| Peptide, recombinant protein | Recombinant Human Insulin | Roche | Cat#: 11376497001 | |
| Chemical compound | Isobutylmethylxanthine | Sigma-Aldrich | Cat#: I5879 | |
| Chemical compound | 3,3′,5-triiodo-L-thyronine (T3) | Sigma-Aldrich | Cat#: T6397 | |
| Chemical compound | β-glycerophosphate | Sigma-Aldrich | Cat#: G9891 | |
| Chemical compound | L-thyroxine | Sigma-Aldrich | Cat#: T0397 | |
| Chemical compound | Betaine | Sigma-Aldrich | Cat#: B0300 | |
| Chemical compound | DTT (DL-dithiothreitol) 100 mM | Promega | Cat#: P1171 | |
| Software | ImageJ | NIH | http://wsr.imagej.net/distros/osx/ij152-osx-java8.zip | RRID:SCR_003070 |
| Software | FlowJo | FLOWJ LLC | https://www.flowjo.com/ | RRID:SCR_008520 |
| Software | BD FACSAria II | BD Biosciences | http://www.bdbiosciences.com/cn/home | |
| Software | Gene Expression Commons (GEXC) database | Seita et al., 2012 | https://gexc.riken.jp | |
| Software | bcl2fastq2 2.18 | Illumina | https://support.illumina.com/sequencing/sequencing_software/bcl2fastq-conversion-software.html | RRID:SCR_015058 |
| Software | Skewer | Jiang et al., 2014 | https://sourceforge.net/projects/skewer | RRID:SCR_001151 |
| Software | STAR 2.4 | Dobin et al., 2013 | https://github.com/alexdobin/STAR | |
| Software | RSEM 1.2.21 | Li and Dewey, 2011 | https://deweylab.github.io/RSEM/ | RRID:SCR_013027 |
| Software | Scanpy 1.8. | Wolf et al., 2018 | https://github.com/theislab/scanpy | RRID:SCR_018139 |
| Software | GraphPad Prism 9.02 | GraphPad Software | http://www.graphpad.com/scientificsoftware/prism | RRID:SCR_002798 |
| Other | RNAscope Probe-Mm-Cdh13-C3 | Acdbio | Cat#: 443251 | RNAscope 1:1500 |
| Other | RNAscope Probe-Mm-Wif1-C3 | Acdbio | Cat#: 412361-C3 | RNAscope 1:1500 |
| Other | 4′ , 6-diamidino-2-phenylindole (DAPI) | Biolegend | Cat#: 422801 | 1 ug/ml |
| Other | Propidium iodide (PI) | Biolegend | Cat#: 421301 | 1 ug/ml |
Additional files
Download links
A two-part list of links to download the article, or parts of the article, in various formats.
Downloads (link to download the article as PDF)
Open citations (links to open the citations from this article in various online reference manager services)
Cite this article (links to download the citations from this article in formats compatible with various reference manager tools)
Distinct skeletal stem cell types orchestrate long bone skeletogenesis
eLife 10:e66063.
https://doi.org/10.7554/eLife.66063


