Single-cell RNA analysis identifies pre-migratory neural crest cells expressing markers of differentiated derivatives
- Department of Craniofacial Biology, University of Colorado, United States
- Department of Cell and Developmental Biology, University of Colorado, United States
Figures
Figure 1 with 4 supplements

Single-cell RNA analysis identifies transcriptionally heterogeneous sox10:eGFP population.
(A) Schematic of zebrafish trunk neural crest cell (tNCC) migration. Medial route migrating tNCCs produce peripheral nervous system and pigment cells, while tNCCs migrating along the dorsal-lateral path produce pigment cells. (B) Schematic of experimental design. NCCs were sampled by dissecting the trunks of 80 sox10:eGFP+ zebrafish at 24 hr post fertilization. GFP+ NCCs were FAC sorted and sequenced using 10X Genomics. Representative image shows sox10:eGFP transgene in a dissected trunk used for cell dissociation. YE: yolk extension. (C) Uniform Manifold Approximation and Projection (UMAP) and clustering of cells reveals multiple transcriptionally unique sox10:eGFP+ cell clusters. Numbers and labels correspond to main text. (D) Expression of select genes in UMAP space shows variable expression across different clusters. (E) RNA velocity connects cells in developmental pseudotime. Direction and length of arrows represent predicted direction of differentiation as calculated by Velocyto (see Materials and methods). Note cells predicted to be differentiating from tNCC progenitor cluster one into xanthoblast cluster 3. (F) Heatmap shows expression of top 10 most differentially expressed genes (log2Fold) for each cluster.
-
Figure 1—source code 1
Annotated text file of R code used to generate analyses presented in Figures 1 and 2.
Data deposited in NCBI GEO GSE112294.
- https://cdn.elifesciences.org/articles/66078/elife-66078-fig1-code1-v1.zip
Figure 1—figure supplement 1
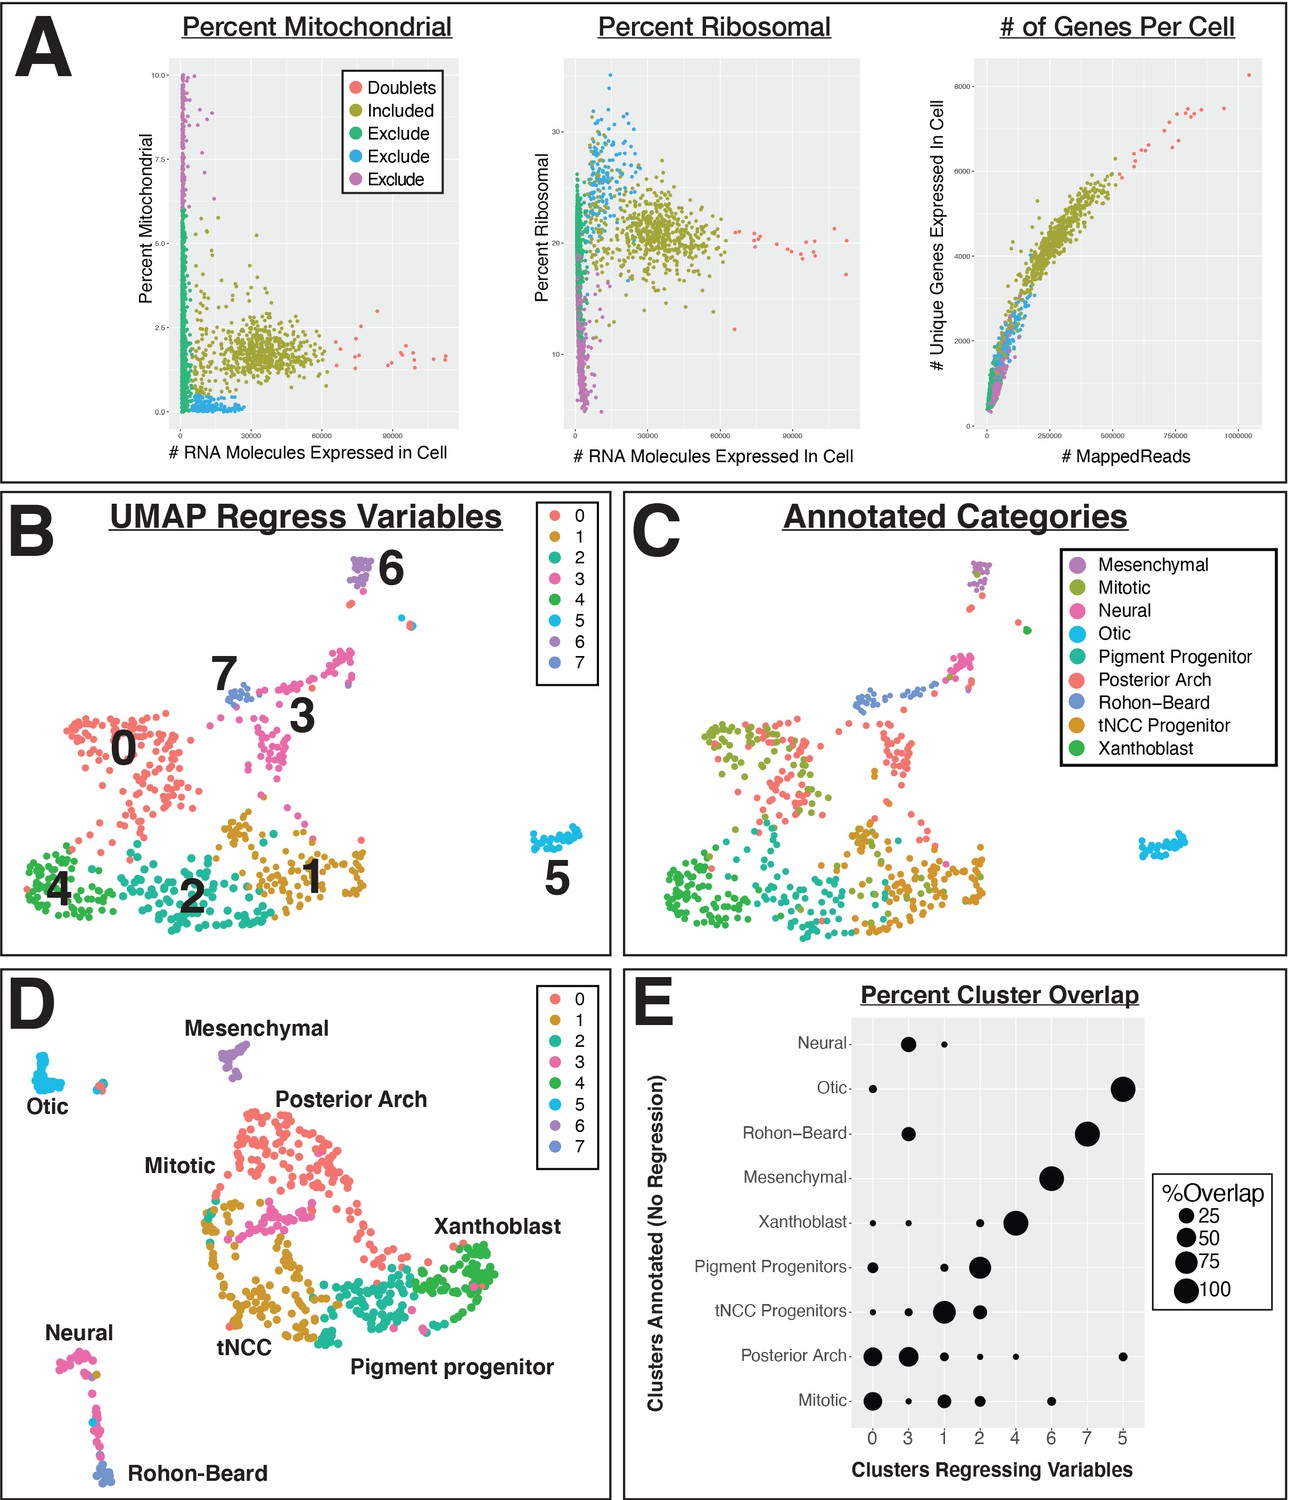
Analysis of single-cell RNA sequencing (scRNA-seq) is robust to different analysis parameters.
(A) Scatterplots show quality filtering of scRNA-seq data. Cells were filtered based on percent mitochondrial expression and number of RNA molecules (UMI) expressed by each cell. Cells labeled ‘included’ were used for analyses. Colors visualize groups of cells across different scatterplots. (B–E) The same biologically relevant groups of cells are identified using different analysis parameters. (B) Uniform Manifold Approximation and Projection (UMAP) and clustering of cells after regressing out effects of cell cycle, mitochondrial contribution, and ribosomal contribution in the data. (C) Same UMAP as in panel (B) with cells labeled by cluster identity as in Figure 1C. (D) UMAP from Figure 1C with cells colored as in panel (B). Names correspond to annotated clusters in Figure 1C. Note concordance across different analysis parameters. The mitotic cluster cells from Figure 1C are assigned to posterior arch and trunk neural crest cell clusters after regressing out effects of cell cycle. (E) The same clusters are obtained using different analysis parameters. Dot size represents percent of cells assigned to each cluster from Figure 1C that contribute to each cluster in panel (B). Note that different analysis parameters identify the same cell populations.
Figure 1—figure supplement 2
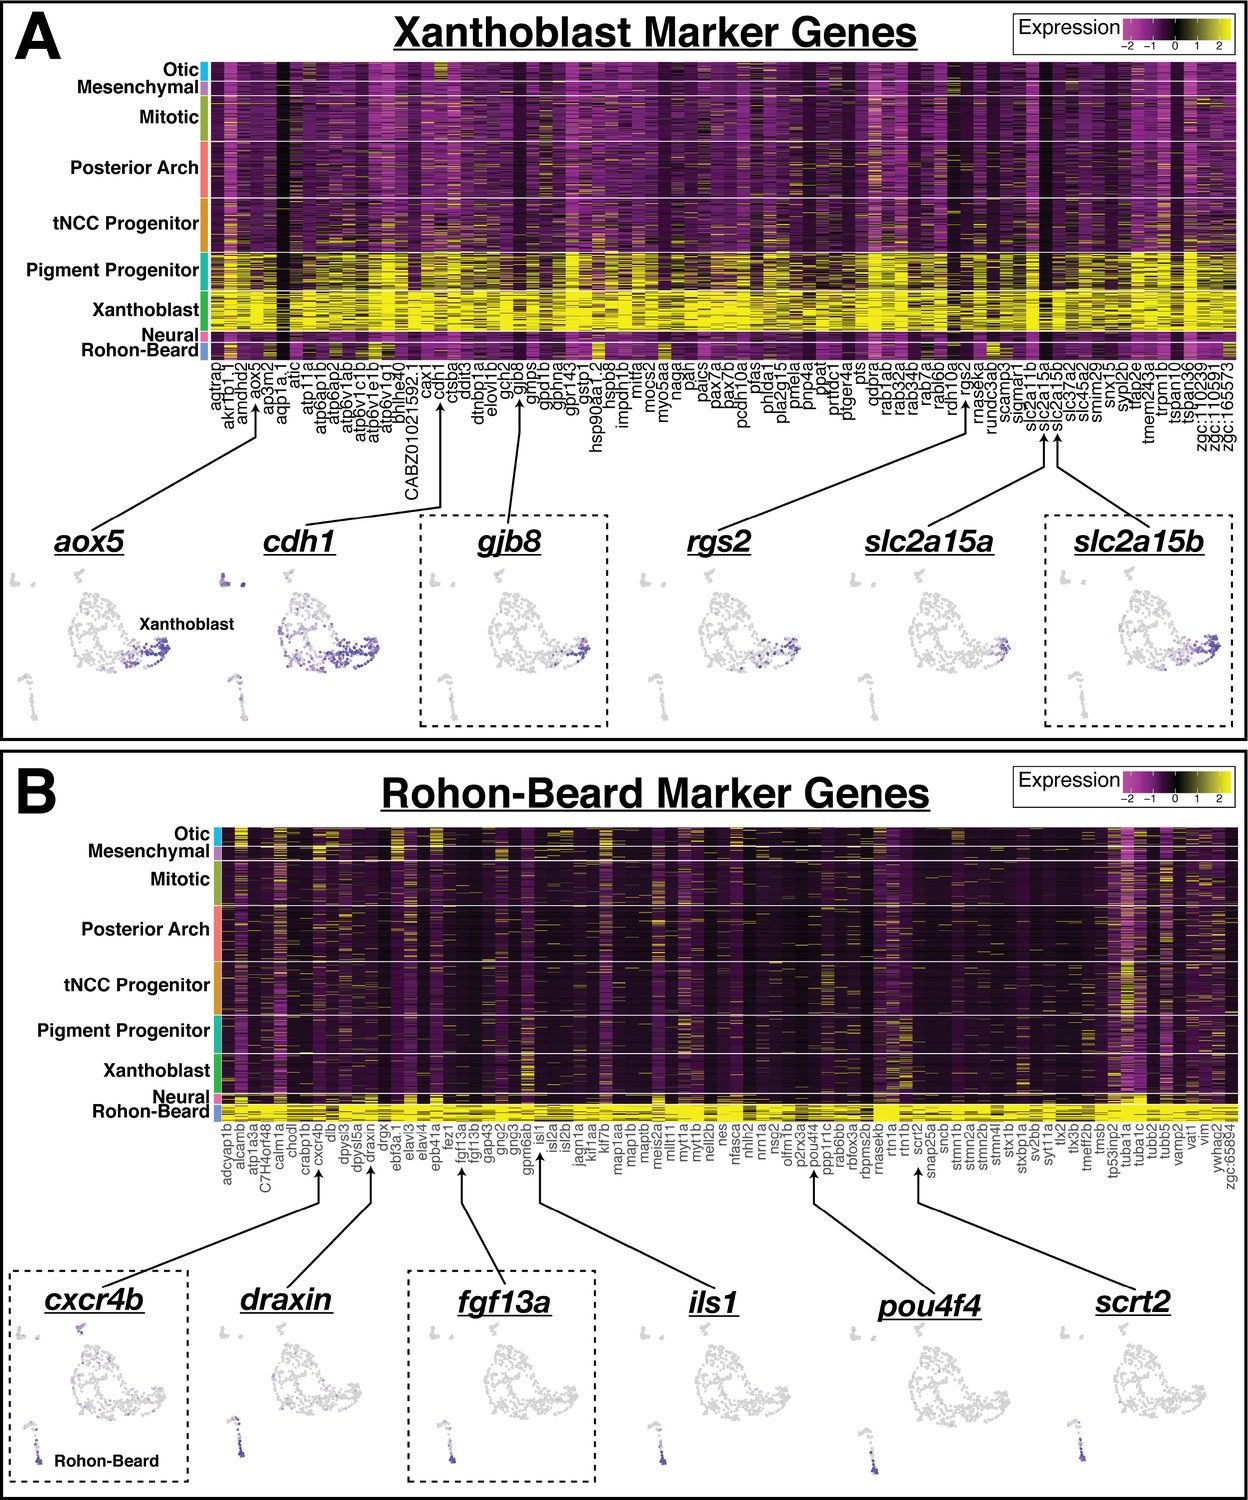
Expression of genes that label xanthoblast and Rohon–Beard clusters.
Heatmap shows the top differentially expressed genes (log2Fold) that label the xanthoblast (A) and Rohon–Beard (B) clusters. Expression of select genes in Uniform Manifold Approximation and Projection space is shown below. Dotted lines box genes shown in Figure 3. For plots, the top 80 most differentially expressed (log2Fold) genes were selected excluding genes without names.
Figure 1—figure supplement 3
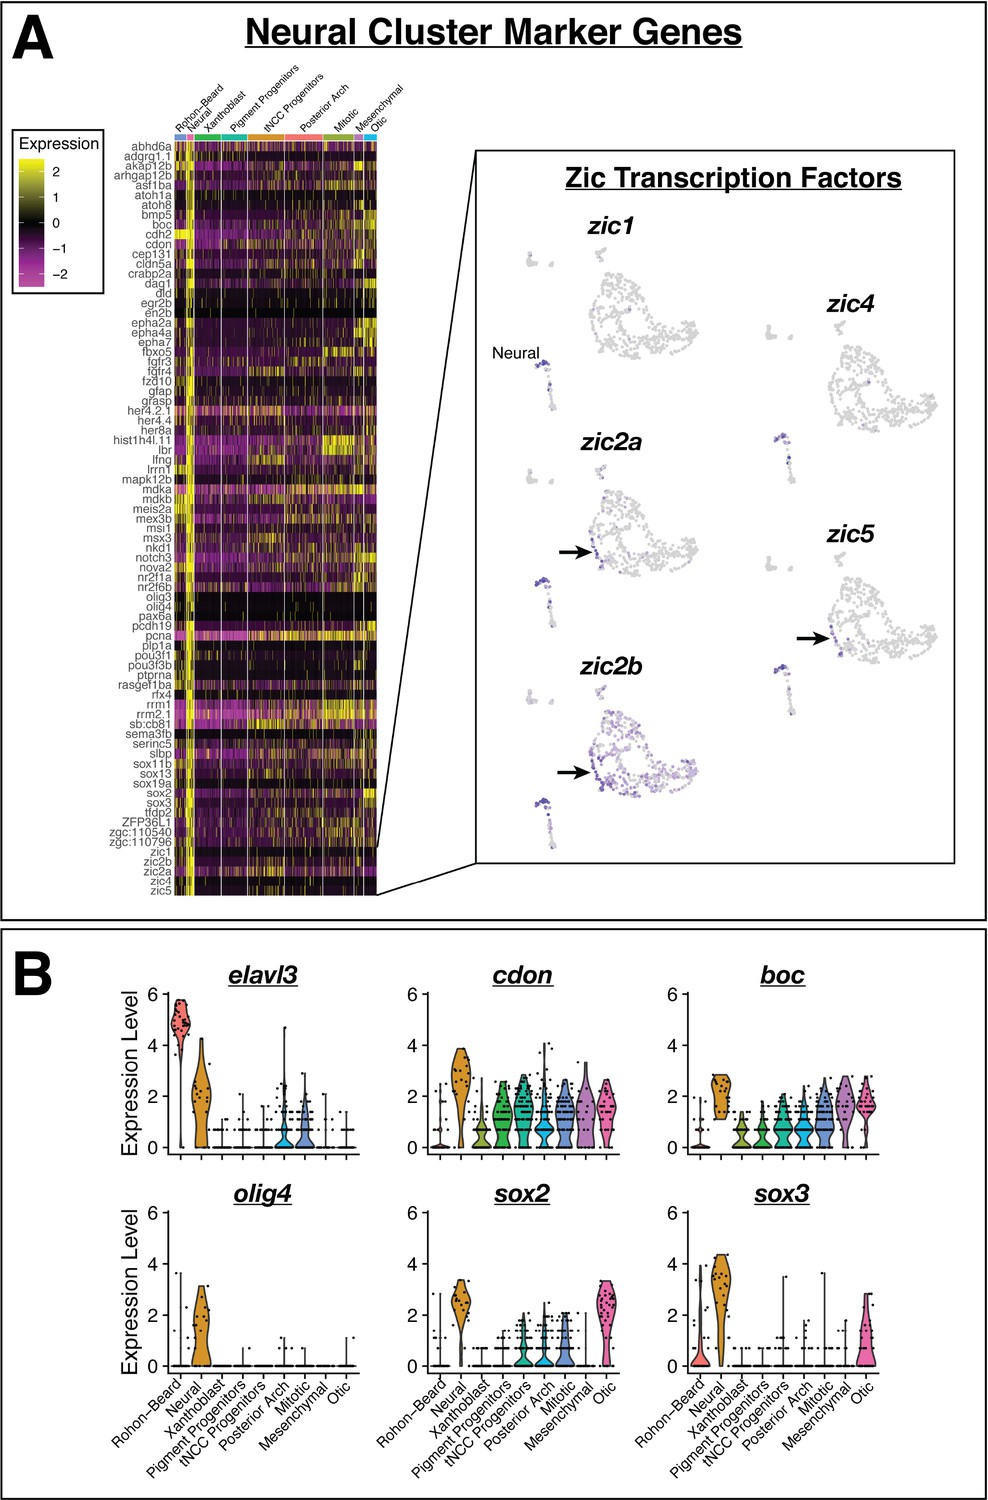
Expression of genes that label neural cluster 8 cells.
(A) Heatmap of top most differentially expressed genes (log2Fold) expressed by cluster 8 neural cells. Inset shows expression of multiple zic transcription factors that label the neural cell cluster in Uniform Manifold Approximation and Projection space. Note that zic2a/b and zic5 are also expressed by a subset of trunk neural crest cell progenitor cells (arrows). (B) Violin plots for select genes in cluster 8 identify these cells as possible neural/neural plate cells.
Figure 1—figure supplement 4
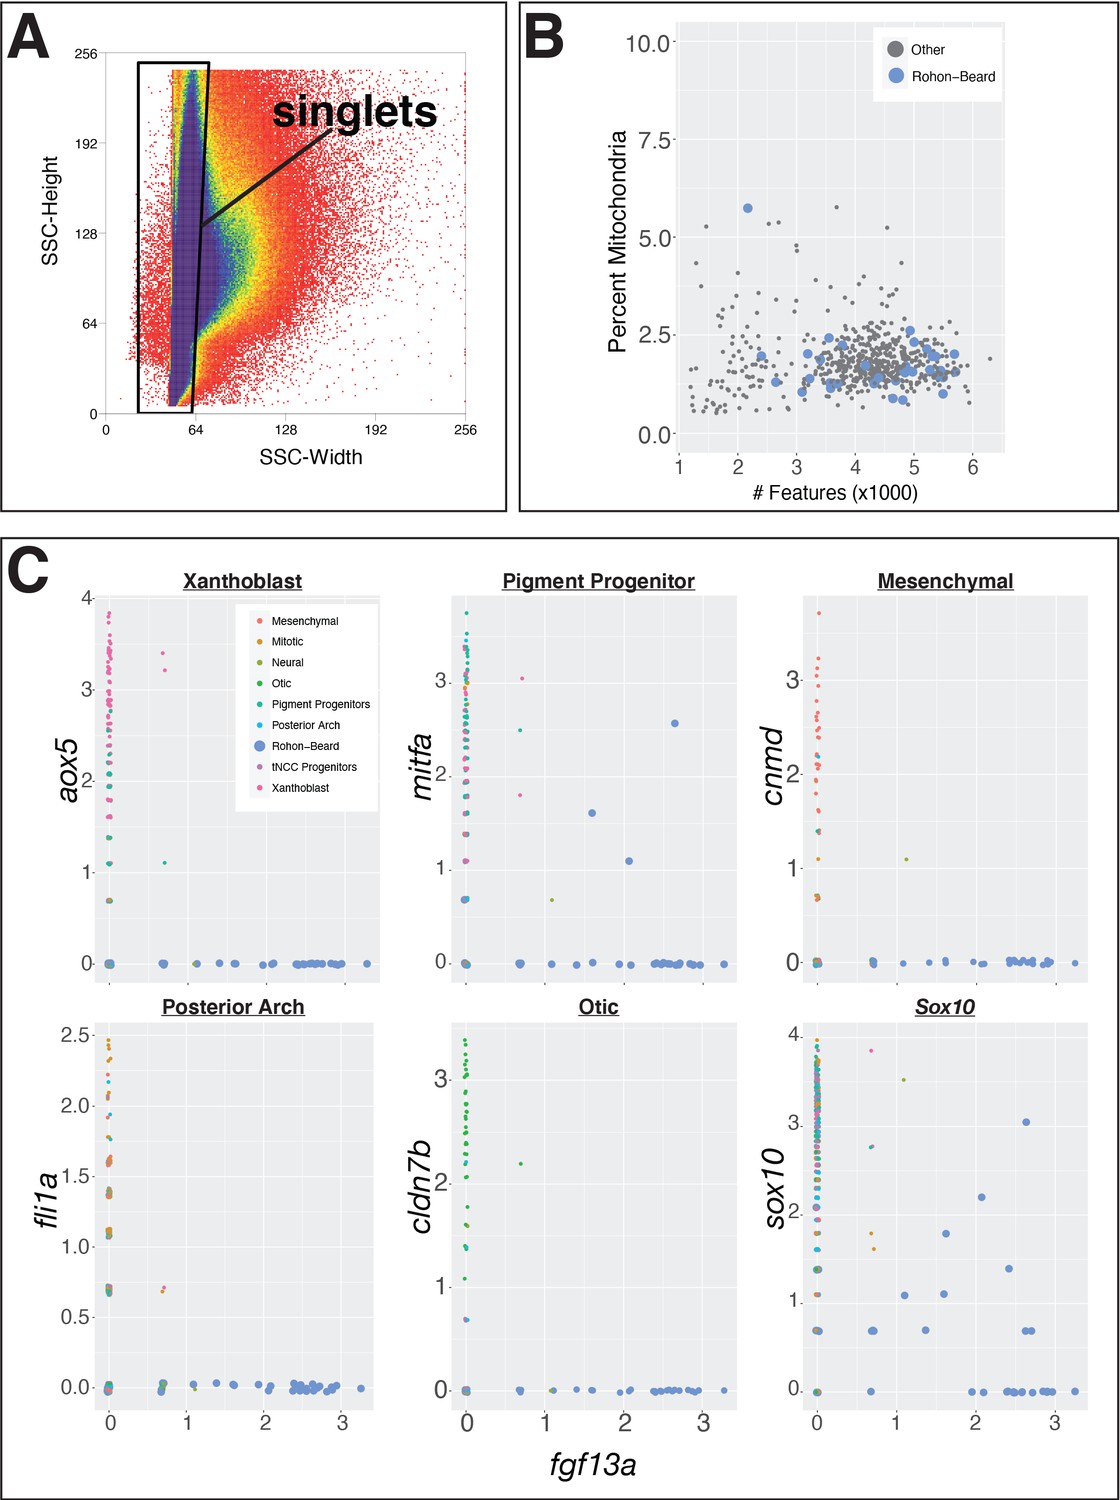
Rohon–Beard cells are unlikely to be doublets from incomplete cell dissociation.
(A) FAC sorting gated for singlet cells (black box). (B) Possible doublets were quality filtered prior to analysis by excluding cells with large UMI counts. Rohon–Beard neurons (RBs; red points) passed quality filtering and are mixed with other neural crest cells (NCCs) in quality check plots. (C) RBs do not express markers of other NCC clusters, with the exception of three mitfa expressing RBs. RBs do express sox10 at a low level.
Figure 2 with 2 supplements

Integrated analysis of sox10:eGFP+ cells from 24, 48, and 68 hr post fertilization (hpf) zebrafish embryos shows pre-migratory trunk neural crest cells (tNCCs) expressing markers of derivative cell types.
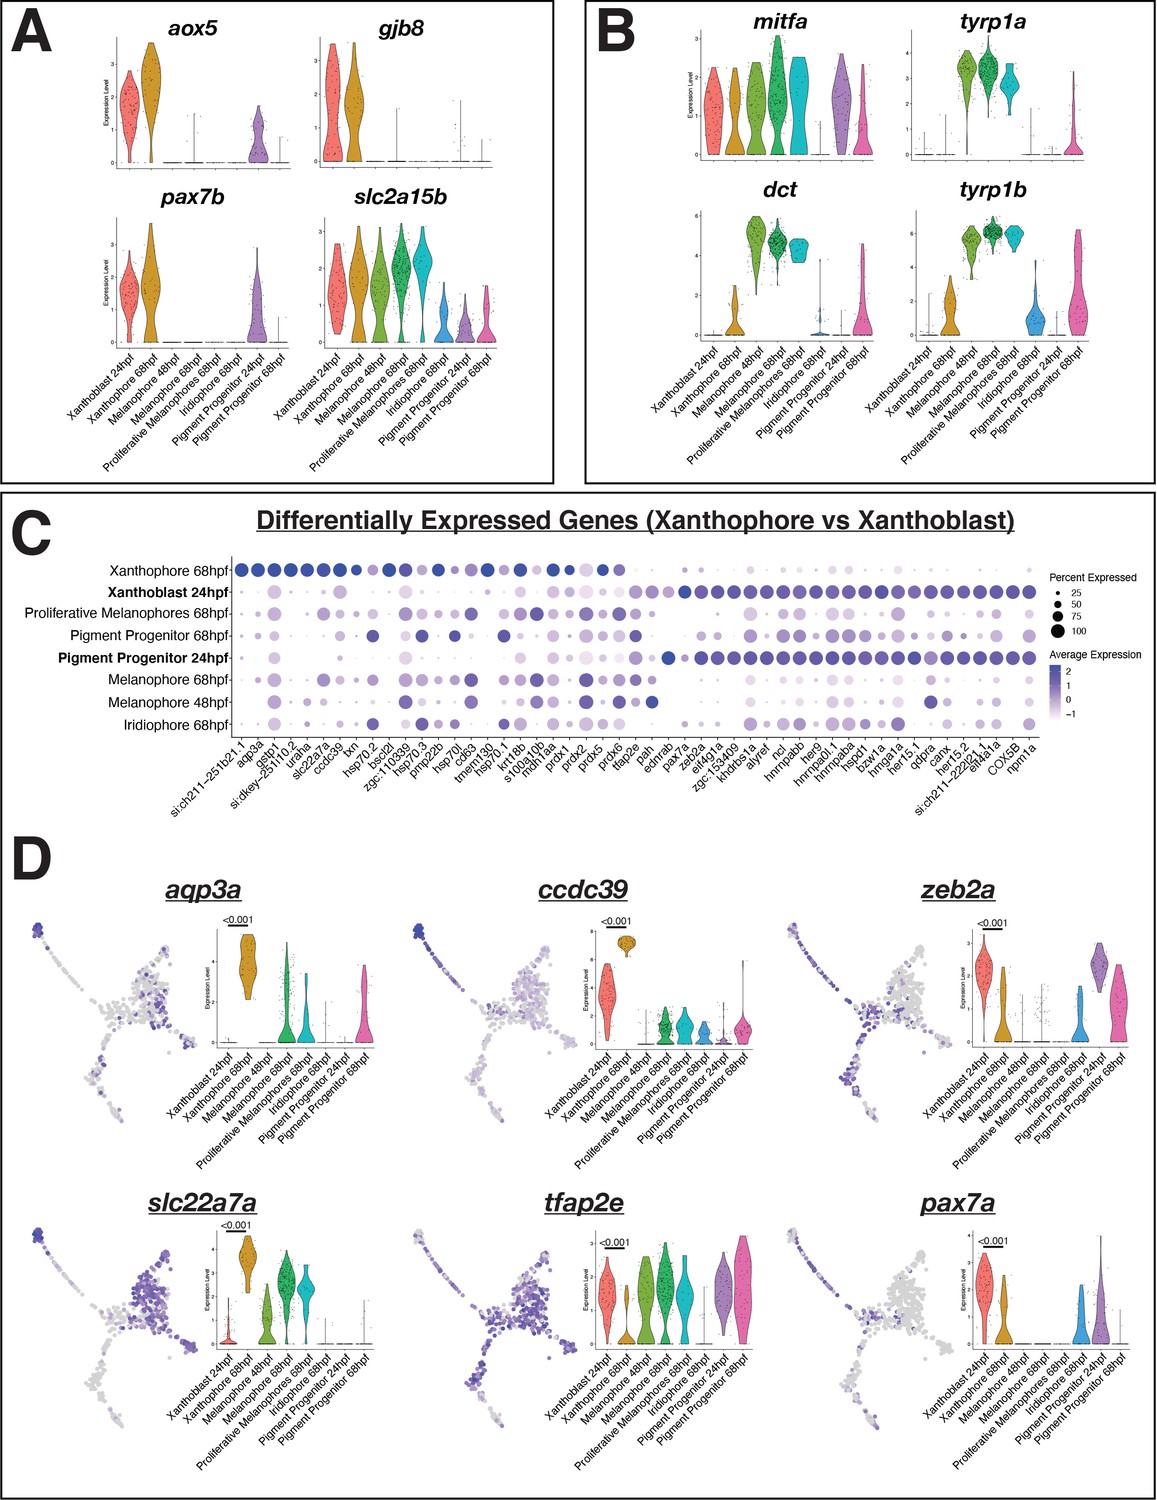
(A) Uniform Manifold Approximation and Projection (UMAP) of integrated datasets showing cells colored by age. (B) UMAP of integrated datasets with cells colored and labeled by annotated category. Annotations of 48 and 68 hpf cells from Howard et al., 2021 are indicated with regular text. Annotations for 24 hpf cells from the current study are boxed and bolded. Points representing cells from 24hpf embryos are larger and outlined in black for visualization. Note that cells group by cell identity across developmental time. (C) Same UMAP as in panel (B) with cells split by age. (D) Representative genes expressed at higher levels in mature xanthophores from 68 hpf embryos than xanthoblasts from 24 hpf embryos. Expression is shown in UMAP space and as violin plots for the 24 hpf xanthoblast and 68 hpf xanthophore cluster cells. p values are from Wilcoxon rank-sum tests. (E) Dotplot of select genes that mark NCCs, pigment progenitors, xanthophores, and Rohon–Beard neurons. Clusters from 24 hpf sox10:eGFP+ cells are bolded. Note that xanthoblasts and xanthophores express the same marker genes. Rohon–Beard neurons express a unique set of genes unlike other neural derivatives from older embryos.
Figure 2—figure supplement 1
Expression of genes associated with pigment cells over developmental time.
(A) Violin plots show expression of genes that mark both differentiated xanthophores and pre-migratory xanthoblasts. Note restricted of expression of novel xanthoblast marker gene gjb8 to the xanthophore lineage, and broader expression of slc2a15b to differentiated pigment cells. (B) Violin plots show expression of genes associated with melanophore maturation. While cells at all stages express mitfa, other genes involved in melanin biosynthesis are expressed at higher levels in 48 and 68 hr post fertilization (hpf) embryos. (C) Dotplot of top differentially expressed genes (log2Fold) between 24 hpf xanthoblasts and 68 hpf xanthophores. Note that genes overexpressed in xanthoblasts (right portion of plot) are also expressed by pigment progenitor populations. Cells sampled at 24 hpf are bolded. (D) Representative genes differentially expressed between 24 hpf xanthoblasts and 68 hpf xanthophores. For each gene, expression in Uniform Manifold Approximation and Projection space and violin plots shows predicted change in expression over developmental time. p values from Wilcoxon rank-sum tests.
Figure 2—figure supplement 2
sox10:eGFP+ cells from 24 hr post fertilization (hpf) embryos cluster by cell type on whole embryo zebrafish atlases.
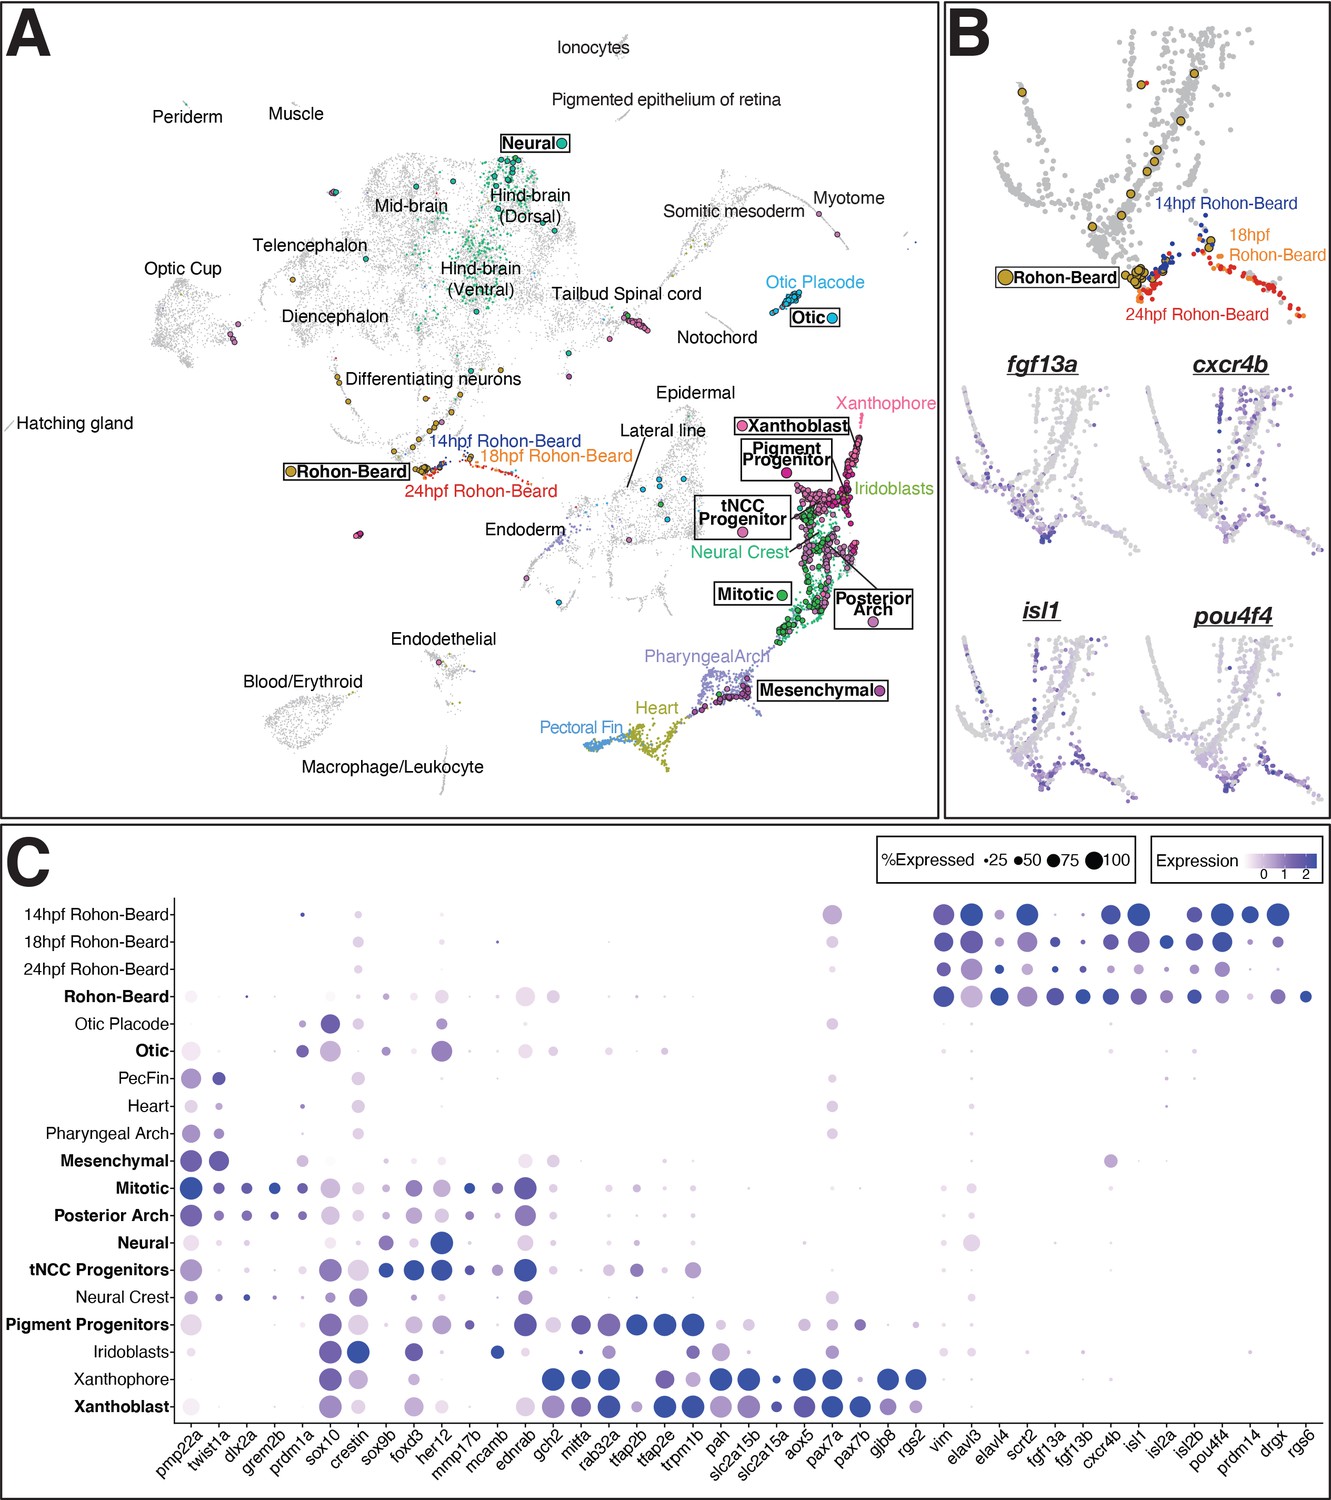
(A) Uniform Manifold Approximation and Projection of integrated data from 24 hpf sox10:eGFP+ cells, and cells from whole zebrafish embryos sampled at 14, 18, and 24 hpf (Wagner et al., 2018). Note that cells group by annotated category across different datasets. Annotations from Wagner et al., 2018 are in regular text. Cells annotated to relevant cell categories for the current study (e.g., neural crest cells [NCCs] and Rohon–Beard neurons [RBs]) are colored. Points representing cells from the current study are larger and outlined in black. Annotations for these sox10:eGFP+ cells are bolded and boxed. Note that cells annotated as NCCs in each dataset group together, as do xanthophore lineage cells. Some NCCs from Wagner et al., 2018 group with hind brain cells (small green points) along with sox10:eGFP+ cells annotated to the neural cluster. RBs from all three datasets group together. (B) Blowup of RB cell clusters from panel (A) and expression of select RB marker genes. (C) Dotplot of select genes that label NCCs, pigment cells, and RBs in relevant clusters from panel (A). Pigment cells from all datasets express the same genes including novel xanthoblast markers. Similarly, RBs annotated in each dataset express the same genes concordant with identification of an RB gene regulatory networks.
Figure 3 with 2 supplements
Expression of novel marker gene expression in the pre-migratory xanthoblast and Rohon–Beard cell populations.
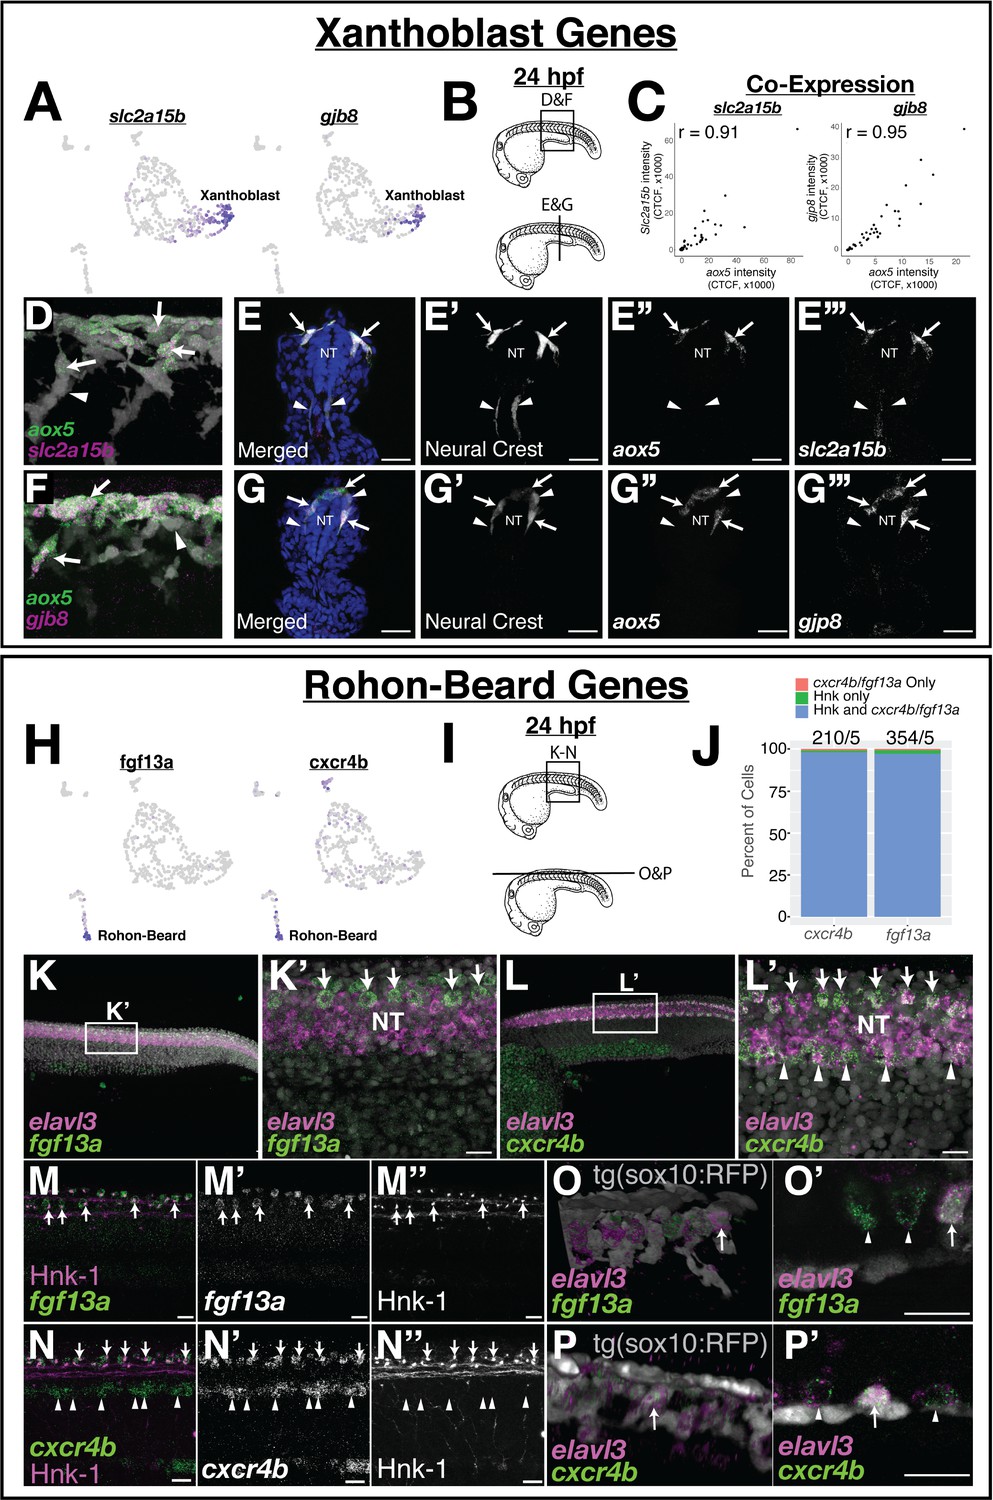
(A) Both slc2a15b and gjb8 are predicted to be expressed in pre-migratory xanthoblast cells. (B–G) Quantitative single-molecule in situ hybridization (hybridization chain reaction [HCR]) confirms expression of these genes to aox5 expressing xanthoblasts. (B) Schematic of 24 hr post fertilization (hpf) embryos labeling region of embryos shown in subsequent panels. (C) Quantification of RNA expression (corrected total cell fluorescence [CTCF]) in neural crest cells (NCCs) from sections shows novel marker genes slc2a15b and gjb8 are strongly co-expressed with aox5. Sections were taken every 15 µM and analyses were limited to sections over the yolk extension. Each dot represents a cell (slc2a15b = 3 embryos, 9 slides, 49 cells; gjb8 = 3 embryos, 9 slides, 58 cells). (D–G) Representative whole mount (D, F) and sections (E, G) show expression of slc2a15b (D, E) and gjb8 (F, G) in 24 hpf embryos. DAPI (blue, E, G) labels nuclei. Arrows point to NCCs co-expressing xanthoblast marker genes, while arrowheads point to NCCs that lack expression of these same genes. Note that a number of aox5/slc2a15b/gjb8 NCCs are pre-migratory in the dorsal neural tube (NT). (H) Both fgf13a and cxcr4b are predicted to be expressed in Rohon–Beard neurons (RBs). (I–P) HCR confirms expression of these genes to RBs. (I) Schematic labeling region of trunk shown in subsequent panels. (J) Percent of HNK-1-positive RBs also expressing cxcr4b and fgf13a indicates that these genes are co-expressed in RB cells. The number of HNK-1, cxcr4b, and fgf13a-positive cells in the dorsal NT was counted. Note almost all fgf13a/cxcr4b expressing cells co-localize to HNK-1-positive RB cells. Sample size reported above bars (#cells/#embryos). (K, L) Representative confocal images of whole-mount in situ hybridization for elavl3, fgf13a, and cxcr4b show expression of fgf13a and cxcr4b as two rows of cells in the dorsal NT (arrows). Elavl3 marks the NT, and DAPI (gray) labels nuclei. Note ventral NT expression of cxcr4b (arrowheads in L’). (M, N) Dual immunolabeling for HNK-1 and in situ hybridization for fgf13a (M) or cxcr4b (N) shows gene expression overlaps with HNK-1 labeling in RBs in the dorsal NT (arrows). Arrowheads mark ventral expression of cxcr4b in panel (N). (O, P) While fgf13a and cxcr4b expression was never observed in NCCs, a subset of putative RB cells express the tg(sox10:tagRFP) transgene (gray in panels O and P). Shown are whole-mount 3D projections (O, P) and single slice through z-stack (O’, P’) showing fgf13a/cxcr4b/elavl3-positive cells co-labeled with the sox10 transgene. Note that sox10-positive cells are positioned topologically similar to sox10-negative RB cells. Scale bars for all panels are 20 µM.
-
Figure 3—source data 1
_Excel file of quantified hybridization chain reaction intensity of aox5/slc2a15b/gjb8 cells used to generate plots shown in Figure 3C.
- https://cdn.elifesciences.org/articles/66078/elife-66078-fig3-data1-v1.xlsx
-
Figure 3—source data 2
_Excel file of quantified HNK-1/cxcr4b/fgf13a co-localization used to generate plot in Figure 3J.
- https://cdn.elifesciences.org/articles/66078/elife-66078-fig3-data2-v1.xlsx
Figure 3—figure supplement 1
Novel pre-migratory xanthoblast genes and Rohon–Beard (RB) genes are expressed in respective populations as cells differentiate during segmentation stages.
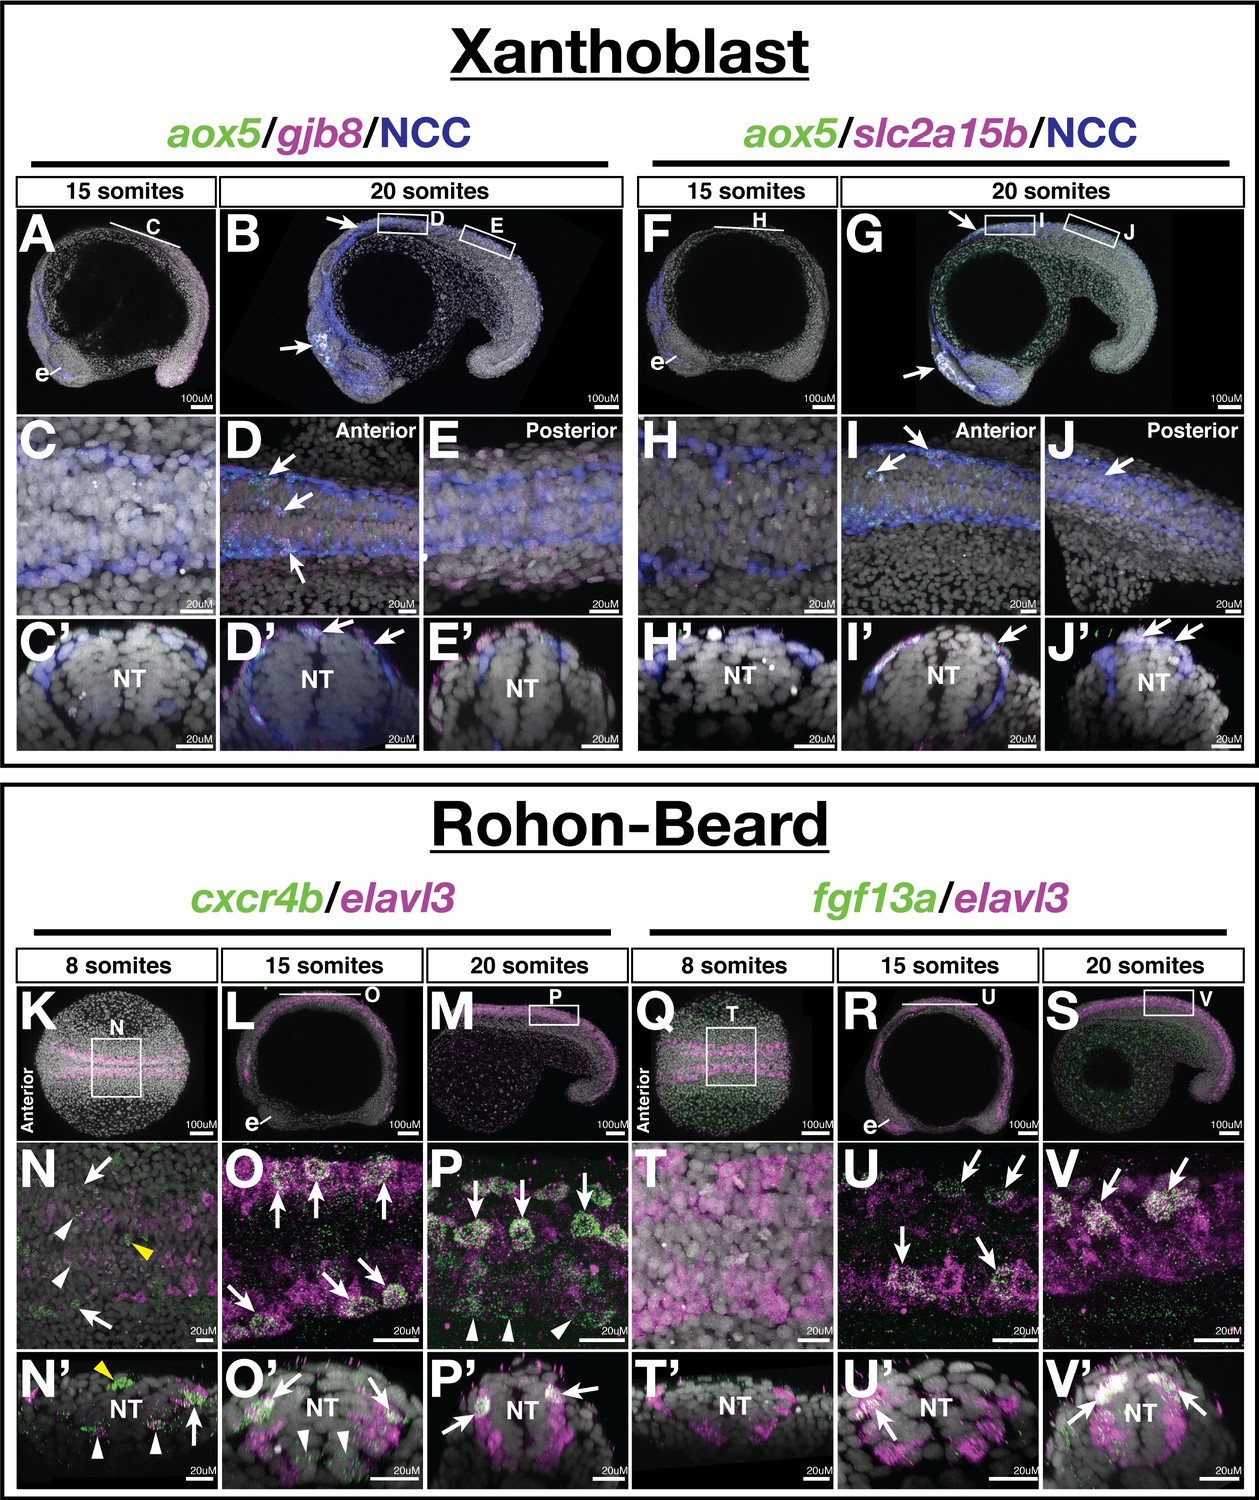
Expression of pre-migratory xanthoblast marker genes gjb8/aox5 (A–E) and slc2a15b/aox5 (F–J) in 15 somite and 20 somite embryos. Shown are low-magnification whole-mount images (A, B, F, G), higher-magnification dorsal views of the neural tube (NT) (C, D, E, H, I, J), and associated optical sections of the NT from the same location in the embryo (C’, D’, E’, H’, I’, J’). Neural crest cells (NCCs) are labeled with the tg(sox10:TagRFP) transgene (blue), and DAPI (white) marks nuclei. Note that xanthoblast marker genes are weakly expressed in the epithelium of 15 somite embryos and do not co-localize with the sox10 transgene. At 20 somites, xanthoblast marker genes are expressed in a subset of NCCs in both the head and anterior trunk (arrows). NCCs in the posterior trunk express these same genes at lower levels. (K–V) Expression of novel RB marker genes cxcr4b (K–P) and fgf13a (Q–V) in 8, 15, and 20 somite embryos. Shown are low-magnification whole-mount images (K, L, M, Q, R, S), high-magnification views of the NT (N, O, P, T, U, V), and associated optical sections (N’, O’, P’, T’, U’, V’). Elavl3 expression labels NT, and DAPI (white) labels nuclei in all images. Note that cxcr4b is expressed in early differentiating RBs in 8 somite embryos, and differentiated RBs in 15 and 20 somite embryos (arrows). cxcr4b expression is also seen in the ventral NT at all stages (white arrowheads), and scattered cells in the dorsal NT of eight somite embryos (yellow arrowheads). In contrast, fgf13a is weakly expressed in the epithelium of 8 somite embryos, but strongly expressed in differentiated RBs by 15 and 20 somite stages (arrows). All images are 3D projections, except for optical sections which are max projections of 30–40 slices selected to show expression in relevant tissues. e: eye.
Figure 3—figure supplement 2
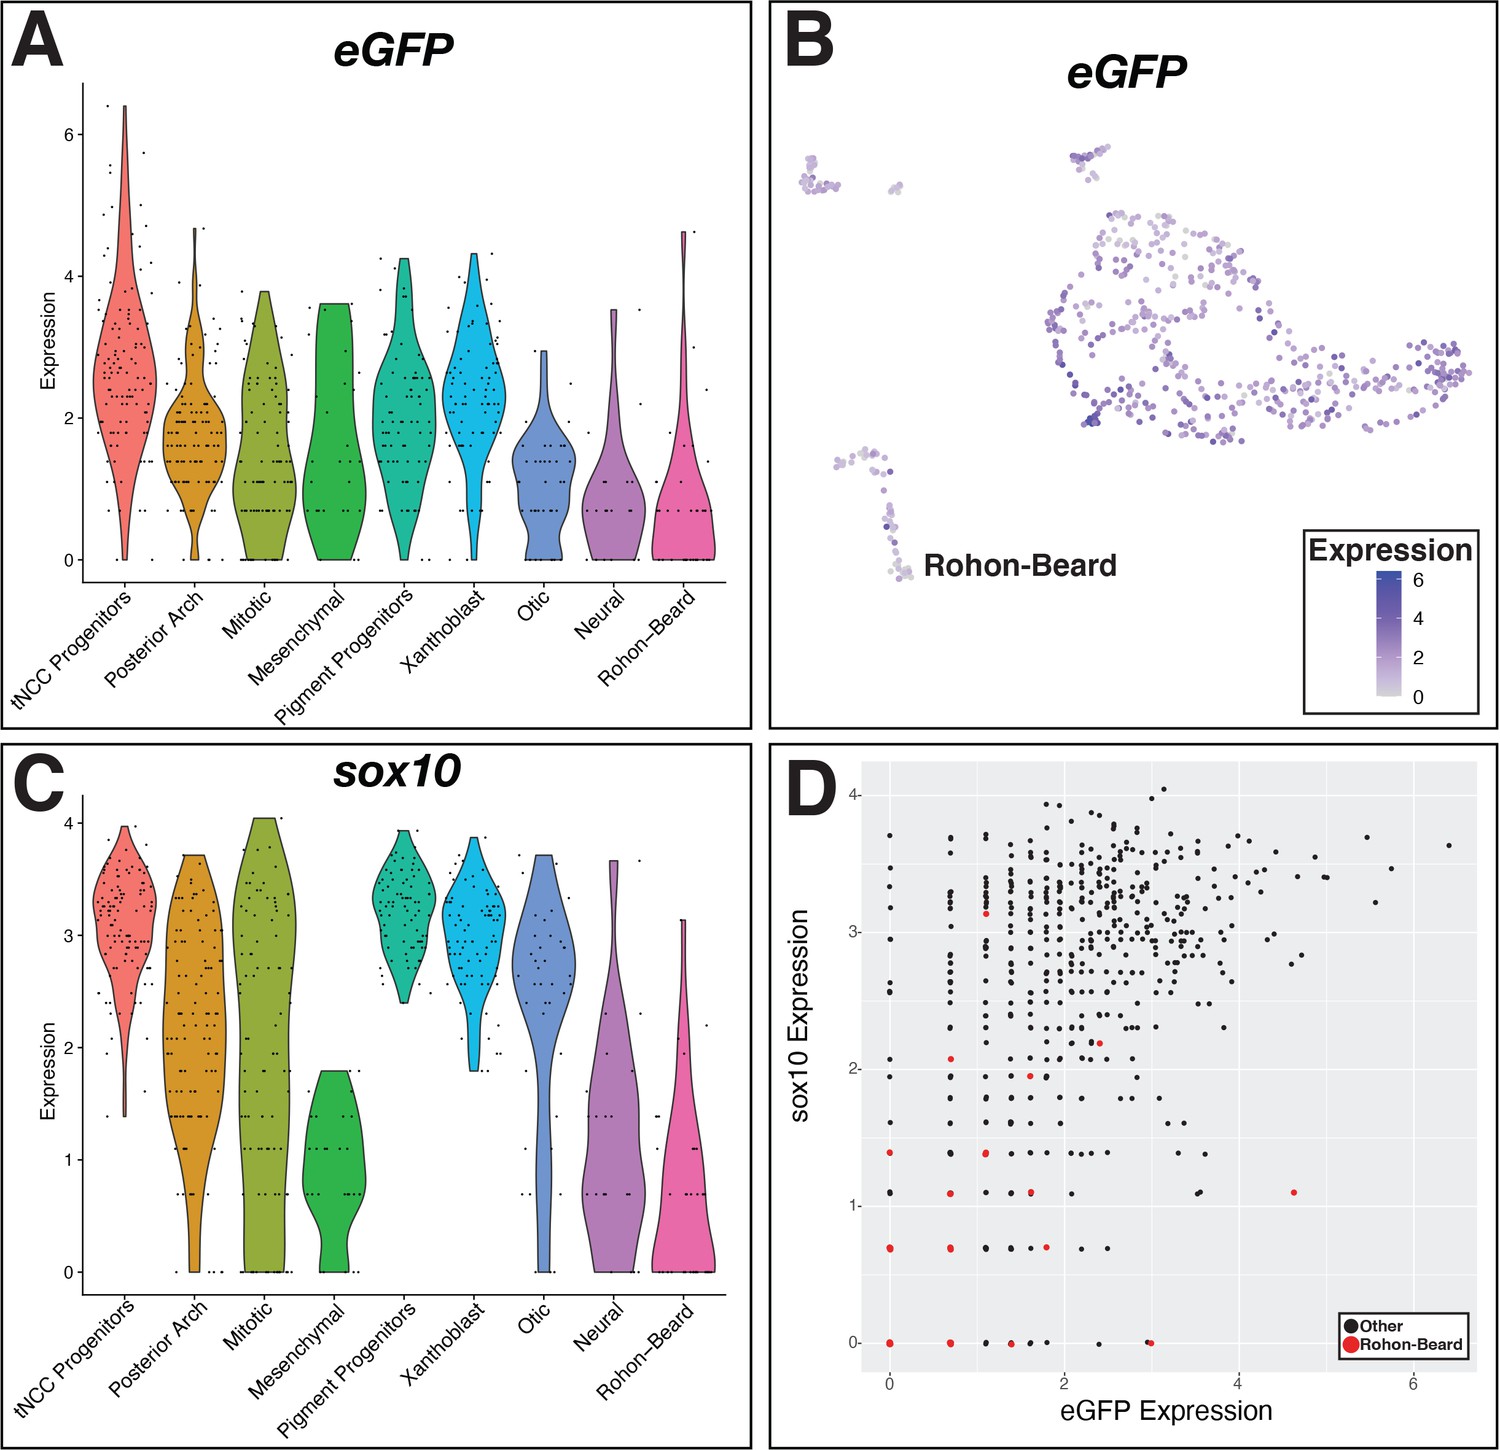
Rohon–Beard (RB) cells express low levels of the tg(sox10:eGFP) transgene.
Shown are Uniform Manifold Approximation and Projection and violin plots for the predicted expression level of eGFP (A, B) and sox10 (C) transcripts in cells of each cluster. Note the low level of eGFP and sox10 transcripts predicted to be expressed by RBs. (D) Scatterplot shows high eGFP expression correlated with sox10 expression. RBs (red points) express both genes at low levels.
Figure 4

Expression of novel xanthoblast and Rohon–Beard neuron (RB) marker genes is lost in the Prdm1a mutant.
(A) Schematic of neural crest cell (NCC) and RB specification. Both NCCs and RBs are specified in the neural plate border (NPB) of gastrulating embryos. NCC and RB specification share a similar gene regulatory network (GRN) that includes notch/delta and prdm1a expression in the NPB. RBs may transiently express sox10 at low levels (gray). (B–H) Whole-mount confocal images of hybridization chain reaction (HCR) shows expression of xanthoblast (aox5, slc2a15b, gjp8) and RB marker genes (fgf13a, cxcr4b) in wild type (B, D, F, H) and Prdm1a-/- (C, E, G, I) embryos at 24 hr post fertilization (hpf). Hnk-1 staining marks RB cells in all images (note loss of HNK-1 in Prdm1a-/- embryos). Expression of all marker genes is lost from the dorsal neural tube (NT) in Prdm1a-/- embryos that show NCC and RB specification defects. Arrows point to expression of marker genes in dorsal neural tube NCCs (B, D) and RBs (F, H). Expression of genes in regions of the embryo other than the NC and RB is still present. For example, expression of cxcr4b in the ventral neural tube is not altered in the Prdm1a mutant (arrowheads). All images are 3D projections of lateral views of the neural tube taken over the yolk extension of 24 hpf embryos.
Tables
Key resources table
| Reagent type (species) or resource | Designation | Source or reference | Identifiers | Additional information |
|---|---|---|---|---|
| Gene (Danio rerio) | Prdm1a | GenBank | ZFIN:ZDB-GENE-030131-2193, Gene ID: 323473 | |
| Strain, strain background (D. rerio) | AB | ZIRC | ZDB-GENO-960809-7, RRID:ZIRC_ZL1 | |
| Genetic reagent (D. rerio) | tg(–4.9sox10:eGFP)ba2 | Carney et al., 2006 | RRID:ZFIN_ZDB-ALT-050913-4 | |
| Genetic reagent (D. rerio) | Tg(sox10:TagRFP)co26 | Blasky et al., 2014 | RRID:ZFIN_ZDB-GENO-150316-2 | |
| Genetic reagent (D. rerio) | Prdm1am805 | Artinger et al., 1999 | RRID:ZFIN_ZDB-ALT-980621-8 | |
| Antibody | Anti HNK-1/N-CAM(mouse, monoclonal) | Sigma-Aldrich | Cat#: C0678, RRID:AB_1078473 | IF:(1:20) |
| Sequence-based reagent | Aox5 RNA Probe | Molecular Instruments | Custom | WM ISH(2 µL/500 µL) |
| Sequence-based reagent | Slc2a15b RNA Probe | Molecular Instruments | Custom | WM ISH(2 µL/500 µL) |
| Sequence-based reagent | Gjb8 RNA Probe | Molecular Instruments | Custom | WM ISH(2 µL/500 µL) |
| Sequence-based reagent | Elavl3 RNA Probe | Molecular Instruments | Custom | WM ISH(2 µL/500 µL) |
| Sequence-based reagent | Fgf13a RNA Probe | Molecular Instruments | Custom | WM ISH(2 µL/500 µL) |
| Sequence-based reagent | Cxcr4b RNA Probe | Molecular Instruments | Custom | WM ISH(2 µL/500 µL) |
| Chemical compound, drug | Accumax | Innovative Cell Technologies | Cat# AM105-500 | |
| Software, algorithm | Velocyto.R (v0.6) | Bergen et al., 2020 | RRID:SCR_018167 | R implementation |
| Software, algorithm | Velocyto.py (v0.17.17) | Bergen et al., 2020 | RRID:SCR_018167 | Python implementation |
| Software, algorithm | Seurat (v4.0.1) | Butler et al., 2018 | RRID:SCR_007322 | R implementation |
| Software, algorithm | Code for analyses | Current study | Source data file: Figure 1&2_RCode.txt | |
| Software, algorithm | R (v4.0.3) | CRAN | RRID:SCR_003005 | |
| Software, algorithm | RStudio | http://www.rstudio.com/ | RRID:SCR_000432 | |
| Software, algorithm | CellRanger (v3.2 & v5.0.1) | 10X Genomics | RRID:SCR_017344 | |
| Software, algorithm | Fiji | http://fiji.sc | RRID:SCR_002285 | |
| Software, algorithm | Napari | https://napari.org/ |
Additional files
Download links
A two-part list of links to download the article, or parts of the article, in various formats.
Downloads (link to download the article as PDF)
Open citations (links to open the citations from this article in various online reference manager services)
Cite this article (links to download the citations from this article in formats compatible with various reference manager tools)
Single-cell RNA analysis identifies pre-migratory neural crest cells expressing markers of differentiated derivatives
eLife 10:e66078.
https://doi.org/10.7554/eLife.66078


