Pre-complexation of talin and vinculin without tension is required for efficient nascent adhesion maturation
- Lyda Hill Department of Bioinformatics, University of Texas Southwestern Medical Center, United States
- Department of Biomedical Engineering, Michigan Technological University, United States
- Department of Cell Biology, University of Texas Southwestern Medical Center, United States
- School of Biosciences, University of Kent, United Kingdom
- Department of Cell Biology, University of Virginia, United States
- Department of Physics, University of California San Diego, United States
Figures
Figure 1 with 7 supplements
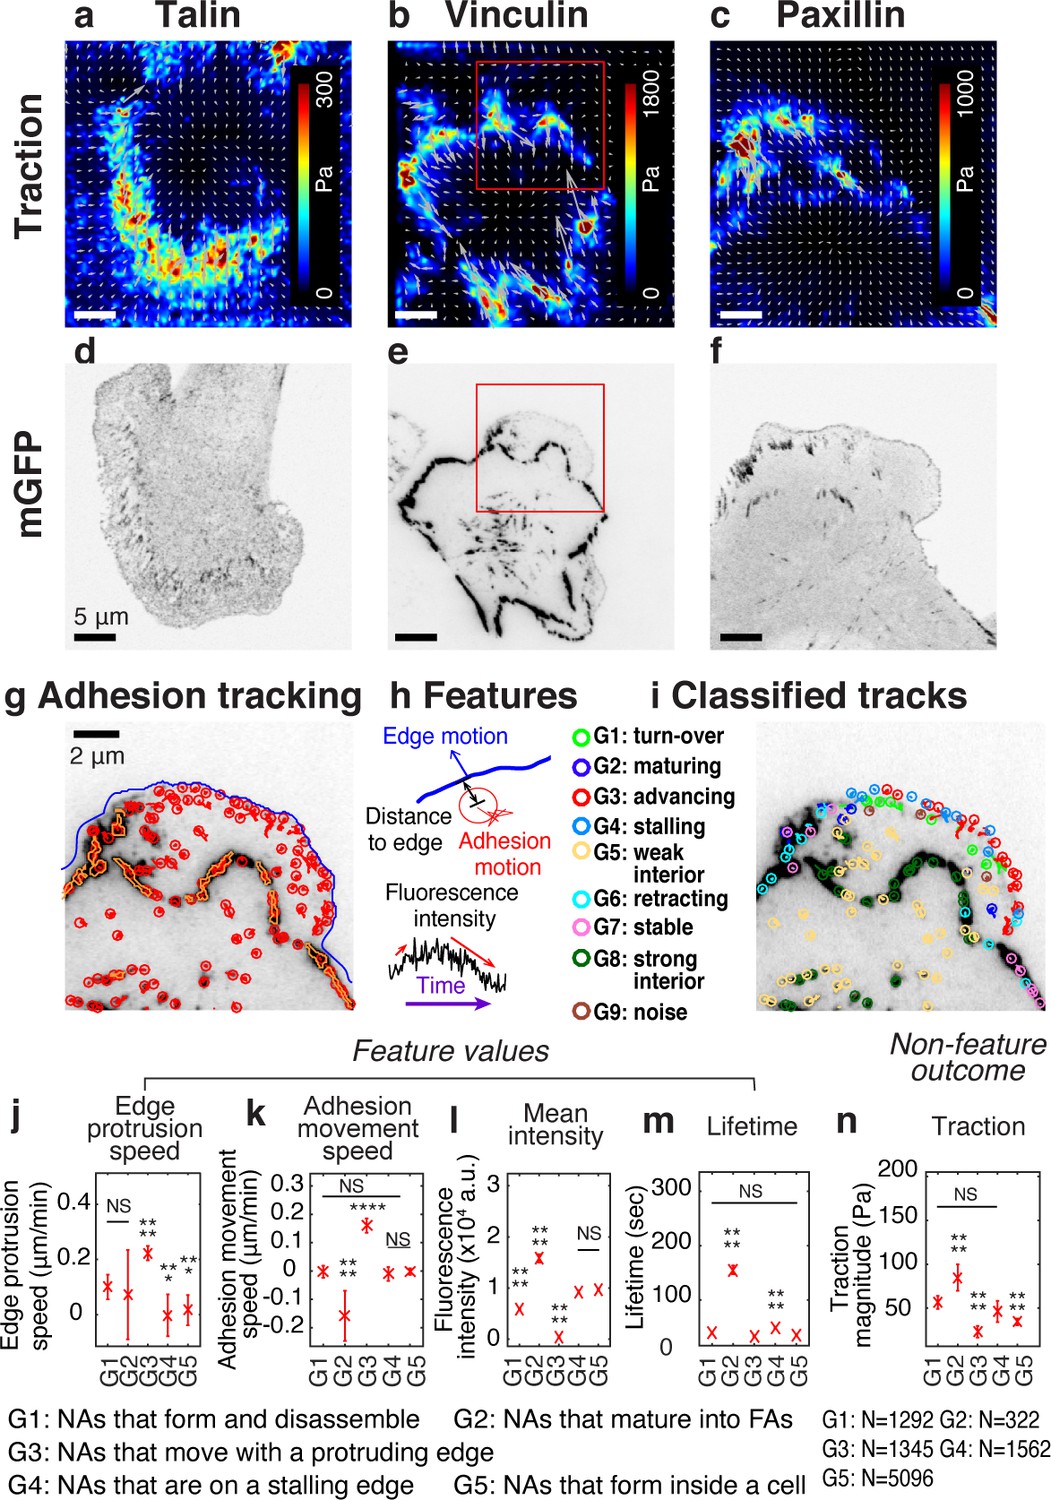
Experimental/computational pipeline to analyze heterogeneous adhesion dynamics in ChoK1 cells.
(a–c) High-resolution traction maps co-imaged with mGFP-tagged adhesion protein, talin (d), vinculin (e), and paxillin (f). 5 kPa silicone gel coated with high density beads was used as a TFM substrate. (g) Trajectories of individual nascent and focal adhesions overlaid on a region of interest cropped from (e). Tracking is based on all detected point sources, (red circles). Big segmented focal contacts/adhesions (orange, closed freeform overlays) were used as additional information for feature selection. (h) Some of the key features used for supervised classification, tabulated in Supplementary file 1A. (i) Classification of adhesion trajectories into nine different groups, overlaid on the adhesion image. Five different NA groups, three FA groups and one noise group were distinguished by the support vector machine classifier. (j–m) Comparison of feature values among the five NA groups, G1, G2, G3, G4, and G5: edge protrusion speed (j), adhesion movement speed, positive when sliding toward protruding edge (k), mean intensity (l), and lifetime (m), extracted from six vinculin-tagged cells. All features show a significant shift in value for at least one subgroup. (n) Average traction magnitude, read from traction map, at individual NA trajectories per each group. The number of samples per each group is shown in the lower right corner of the figure.
-
Figure 1—source data 1
Source data for Figure 1j.
- https://cdn.elifesciences.org/articles/66151/elife-66151-fig1-data1-v1.xlsx
-
Figure 1—source data 2
Source data for Figure 1k.
- https://cdn.elifesciences.org/articles/66151/elife-66151-fig1-data2-v1.xlsx
-
Figure 1—source data 3
Source data for Figure 1l.
- https://cdn.elifesciences.org/articles/66151/elife-66151-fig1-data3-v1.xlsx
-
Figure 1—source data 4
Source data for Figure 1m.
- https://cdn.elifesciences.org/articles/66151/elife-66151-fig1-data4-v1.xlsx
-
Figure 1—source data 5
Source data for Figure 1n.
- https://cdn.elifesciences.org/articles/66151/elife-66151-fig1-data5-v1.xlsx
Figure 1—figure supplement 1
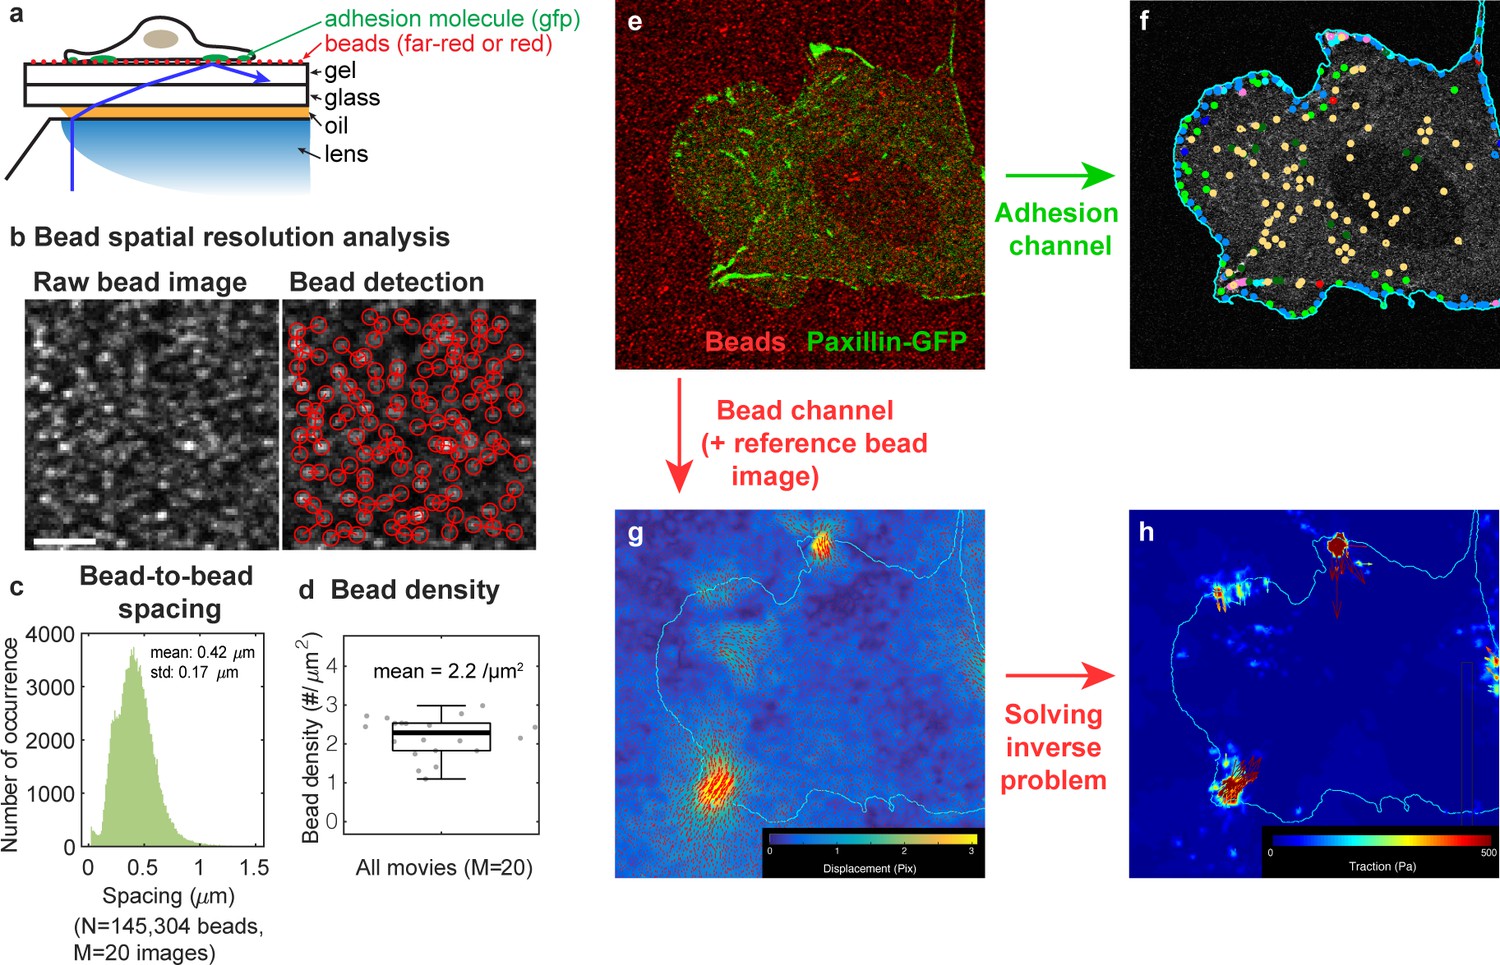
Simultaneous TFM-adhesion experimental approach.
(a) A schematic of the TFM-adhesion imaging using TIRF. Here, cells adhere to a fibronectin-coated, high-refractive index, mechanically defined substrate that is compatible with TIRF. 40 nm beads on top of the substrate allow cell-mediated traction forces to be visualized. (b) Bead spatial resolution analysis. (c) Beads on the silicone gel surface were detected using Gaussian-mixture model, and the inter-bead distance was calculated using KD-Tree algorithm (0.42 ± 0.17 μm, mean ± standard deviation). (d) The bead density calculated from 20 bead images was 1.54 beads/μm on average. (e–h) Analysis procedure for simultaneous TFM-adhesion imaging. (e) Overlay of adhesion channel (green) and bead channel (red). (f) Adhesions are analyzed for detection, tracking, and classification as described in the main manuscript and in Figure 1. (g) Bead displacement fields are calculated by comparing the substrate state before and after removing the cells from the substrate. Bead channel with a reference image taken after the cells were removed from the substrate is analyzed for bead displacement. (h) Traction fields are obtained from the displacements solving the inverse problem as in Han et al., 2015.
Figure 1—figure supplement 2
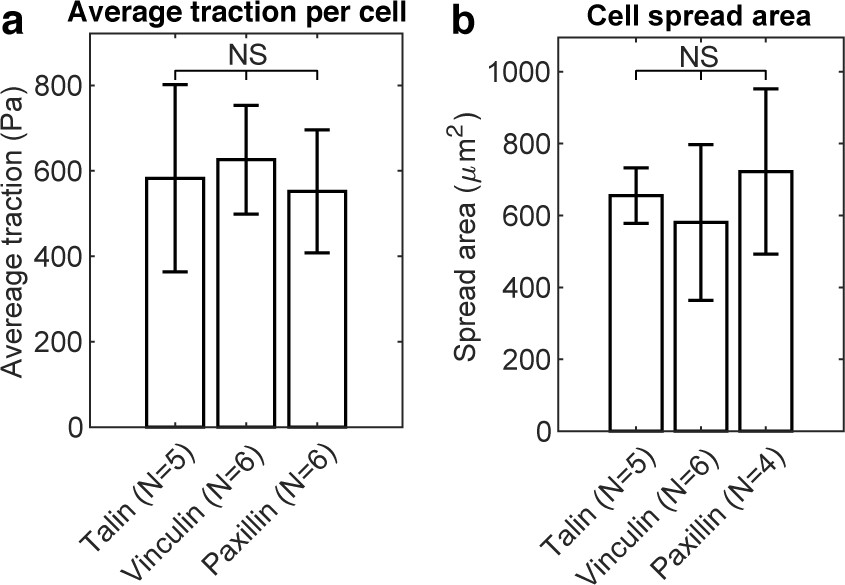
Overall average traction per cell and cell spreading area did not change with expression of talin-GFP, vinculin-GFP, or paxillin-GFP.
(a) Bar plot of average traction quantified per cell. (b) Bar plot of cell spread area.
Figure 1—figure supplement 3
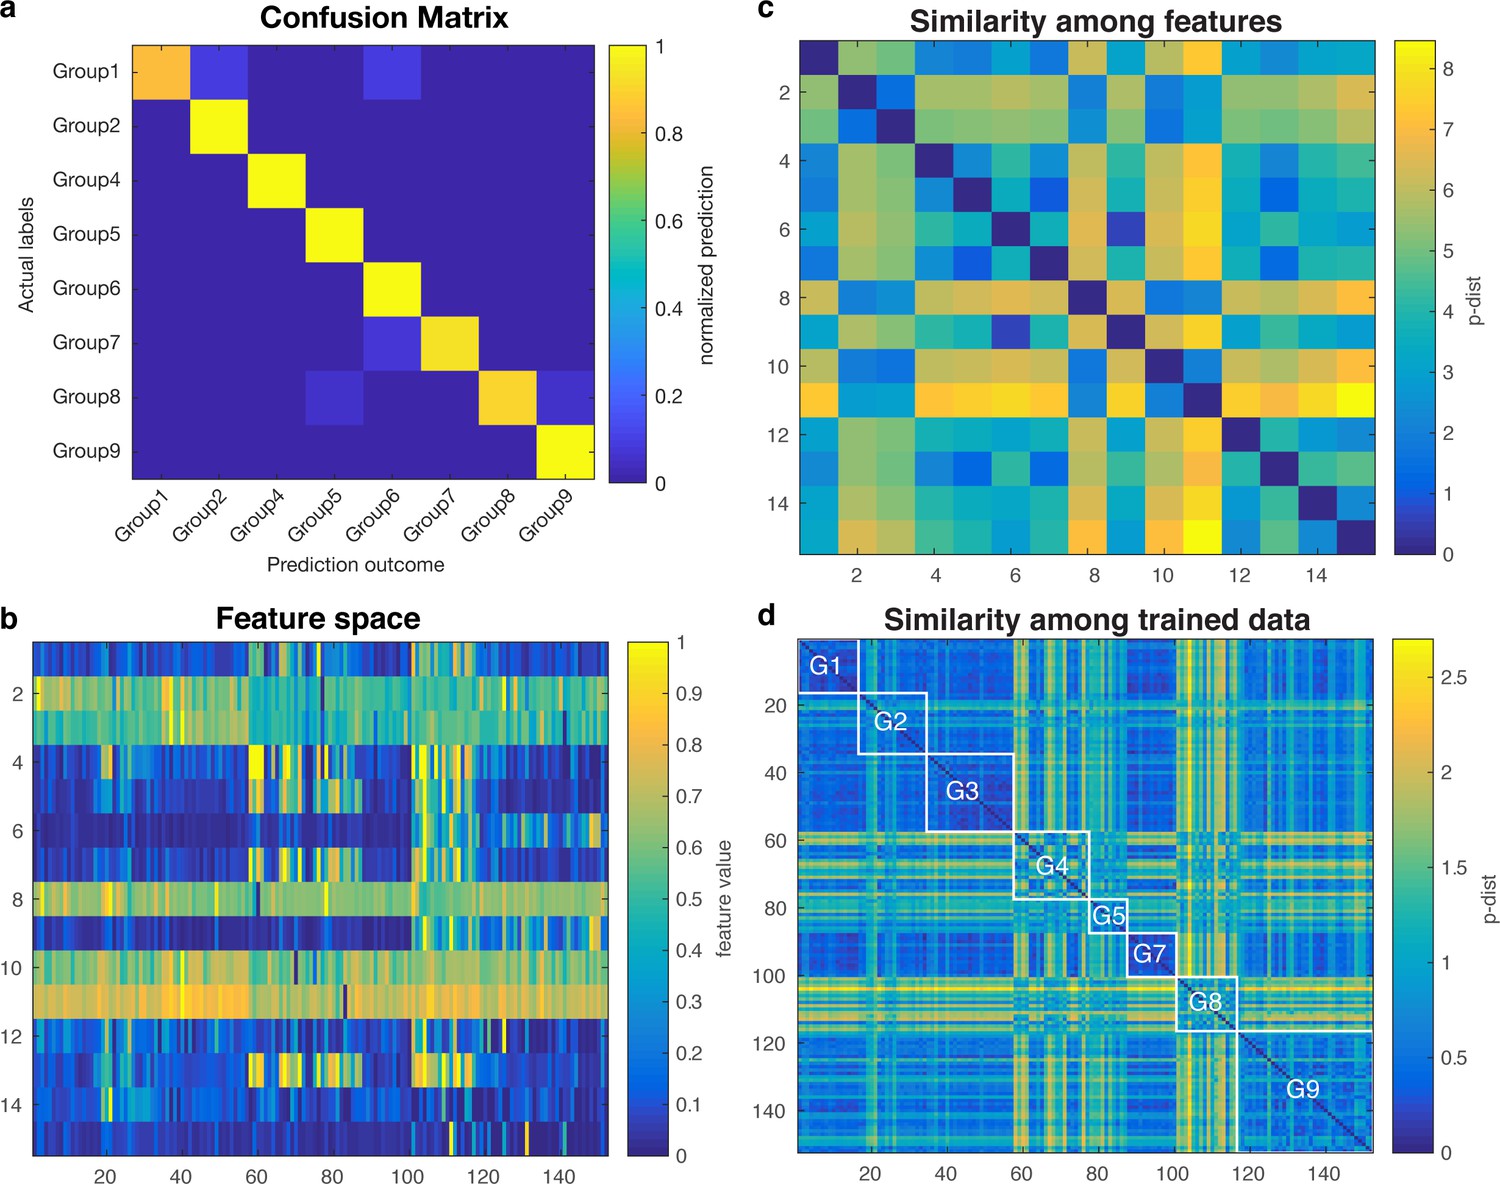
Validation of SVM-based machine learning.
(a) confusion matrix among nine different adhesion groups. (b) Feature space. (c) Similarity among features. (d) Similarity among trained data. White lined boxes represent similarity within each group.
Figure 1—figure supplement 4
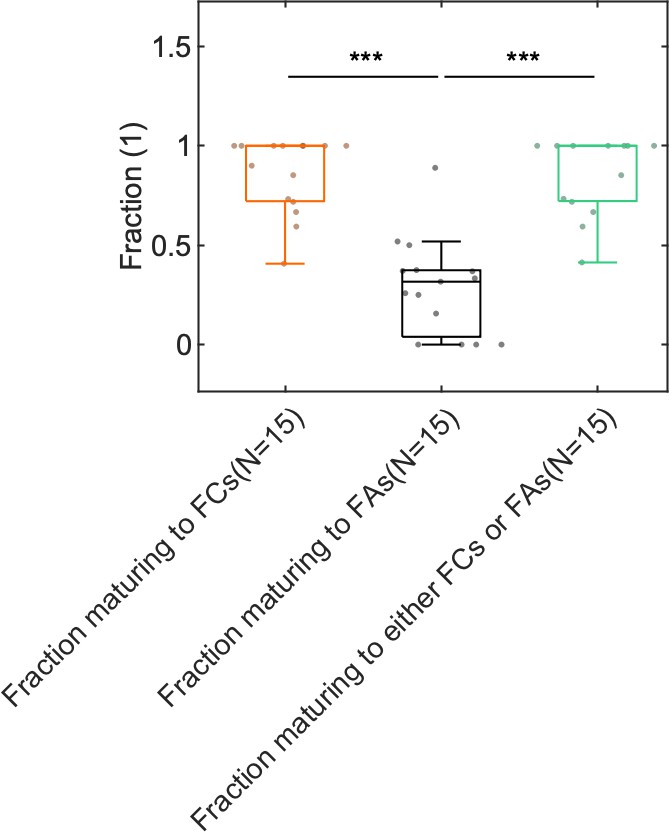
Boxplot of the fraction of G2 NAs that mature into FCs, FAs, or either FCs and FAs.
N is the number of movies, which includes data obtained from cells expressing tagged variants of talin, vinculin, or paxillin. In total 10,028 G2 NAs were analyzed. Importantly, owing to the limited duration of imaging (10 min), this quantification is an underestimation since e.g. some G2 NAs do not progress to FC or FA because the movie concludes before this can occur.
Figure 1—figure supplement 5
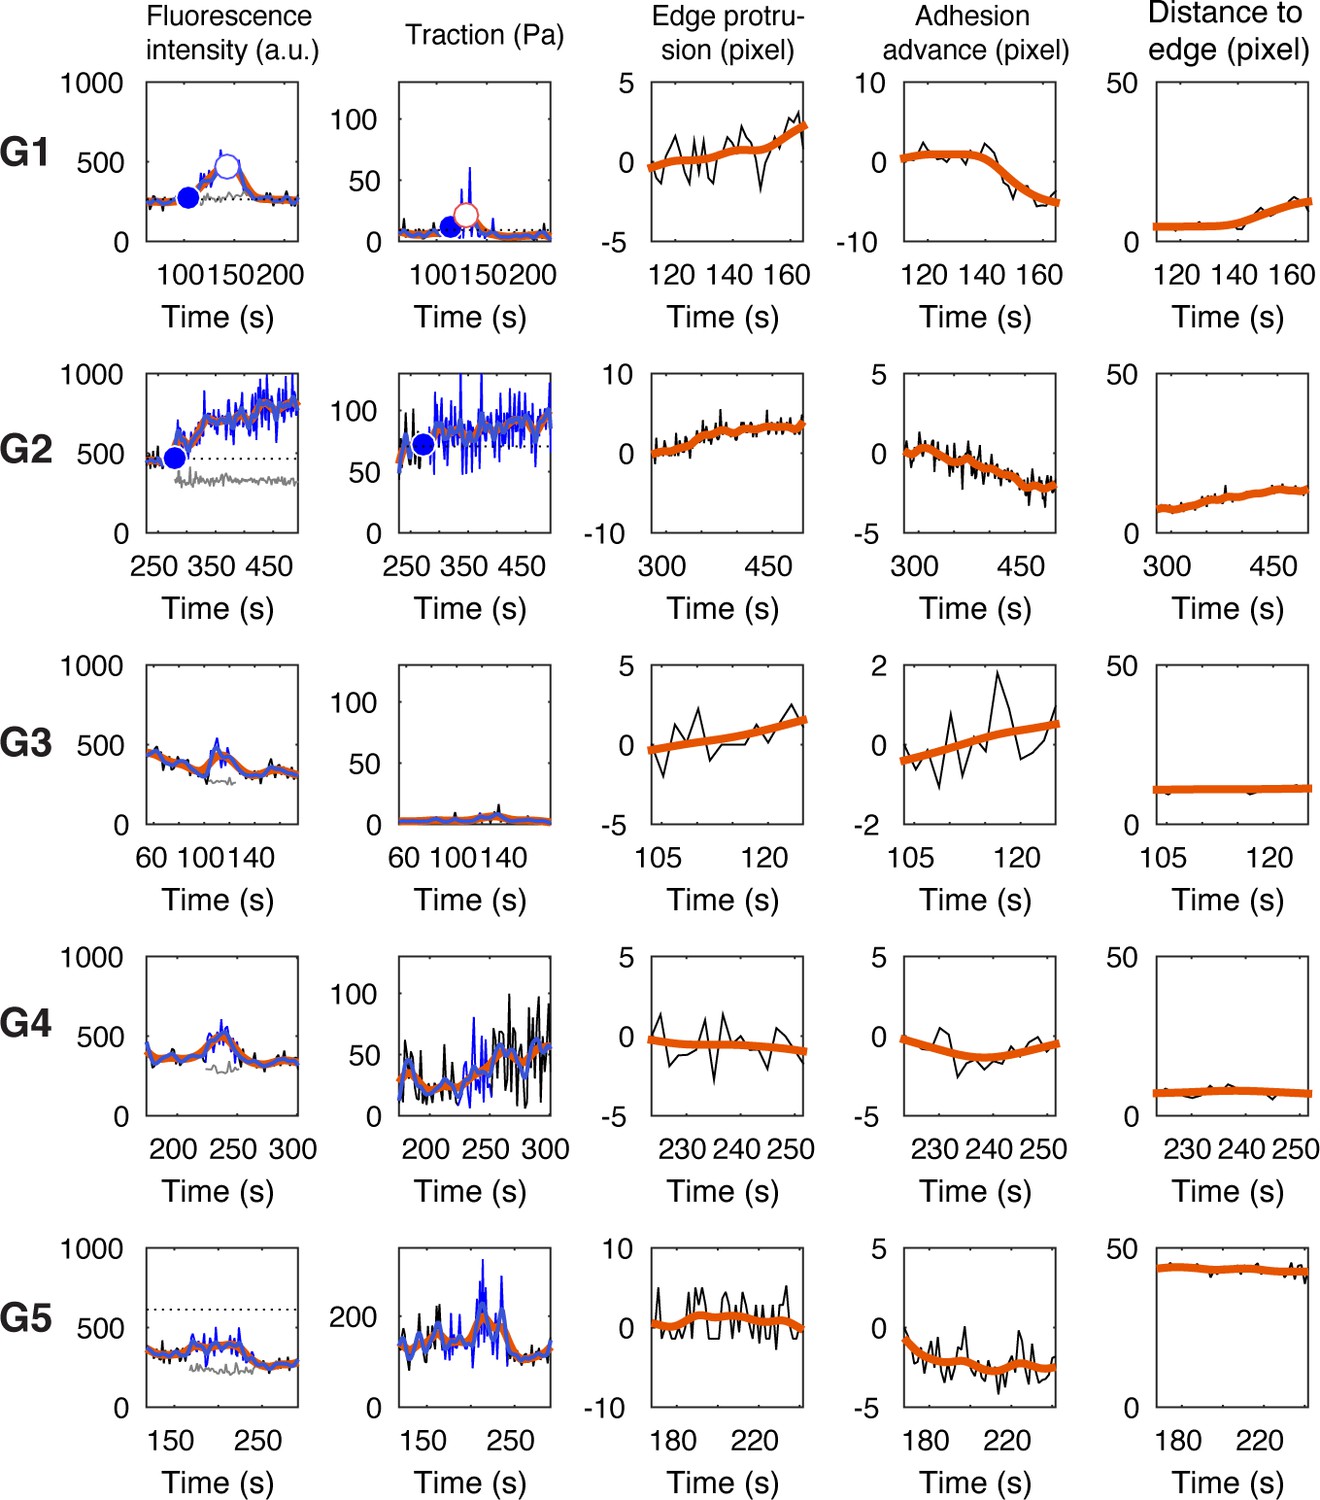
Representative time series of fluorescence intensity, traction magnitude, edge protrusion speed, adhesion sliding speed, and distance to closest edge, for the five NA groups (G1–G5).
The names for all of the features are listed in Supplementary file 1A.
Figure 1—figure supplement 6
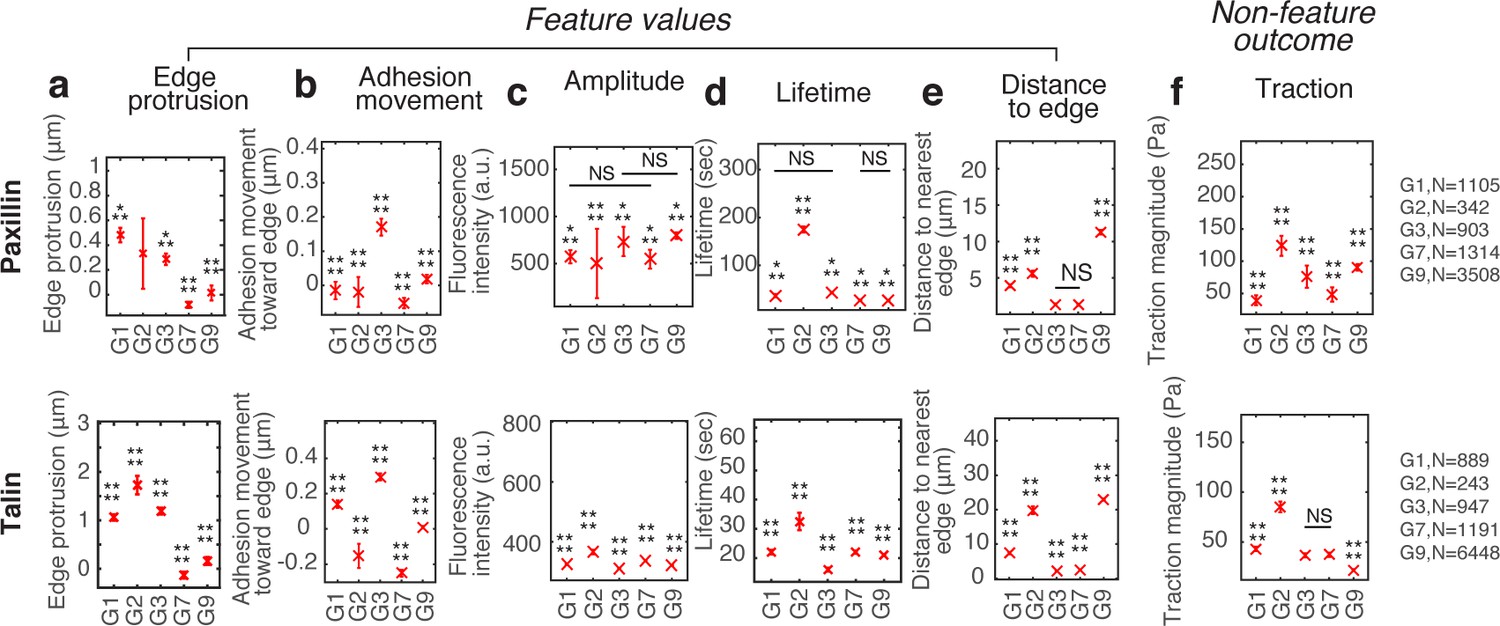
Differences in the feature values for NA subgroups in paxillin and talin time-lapse images.
NAs groups G1, G2, G3, G4, and G5, were classified with paxillin-mGFP and talin-mGFP, from which feature values were collected. The traction magnitude, which is a non-feature outcome (e.g. is not part of the SVM training set), shows significant differences among classifications groups, similar to differences found from vinculin-mGFP experiments in Figure 1j–n. The sample number per each group is summarized at the right side of each row. Adhesion numbers are extracted from four cells for paxillin and six cells for talin.
Figure 1—figure supplement 7
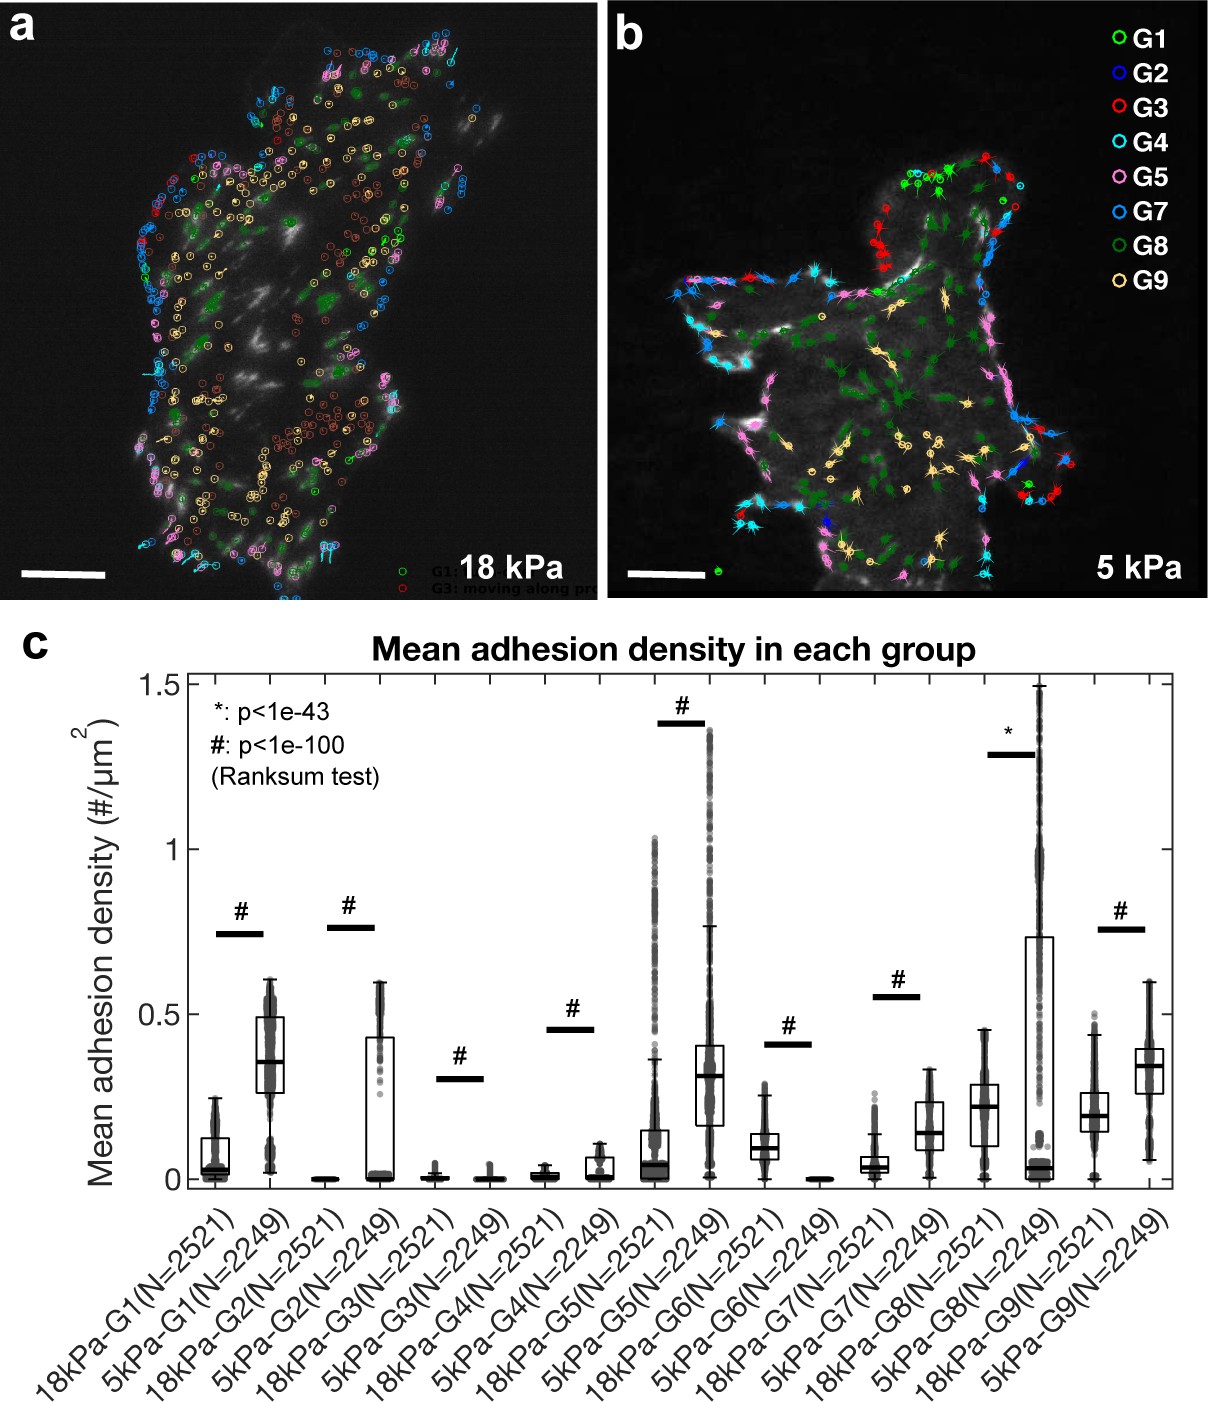
Classification shifts due to substrate stiffness.
ChoK1 cells, transfected with vinculin-GFP, were cultured and imaged on 18 kPa and 5 kPa silicone gel substrates with TIRF. (a) Color-coded classes of kinematically and kinetically different adhesions, tracked and classified using a filter-based classifier (Supplementary file 1C) for a cell on an 18 kPa and (b) a 5 kPa gel. (c) Mean adhesion density for each adhesion class (G1–G9) as a function of substrate stiffness. N represents the number of frames during an active cell protrusion. Total nine movies for 18 kPa gel and six movies for 6 kPa gel were captured. Note that all classes exhibit significant differences between the two stiffness conditions, particularly in newly assembling NAs, G1 and G2 and large FAs in G8.
Figure 2 with 2 supplements
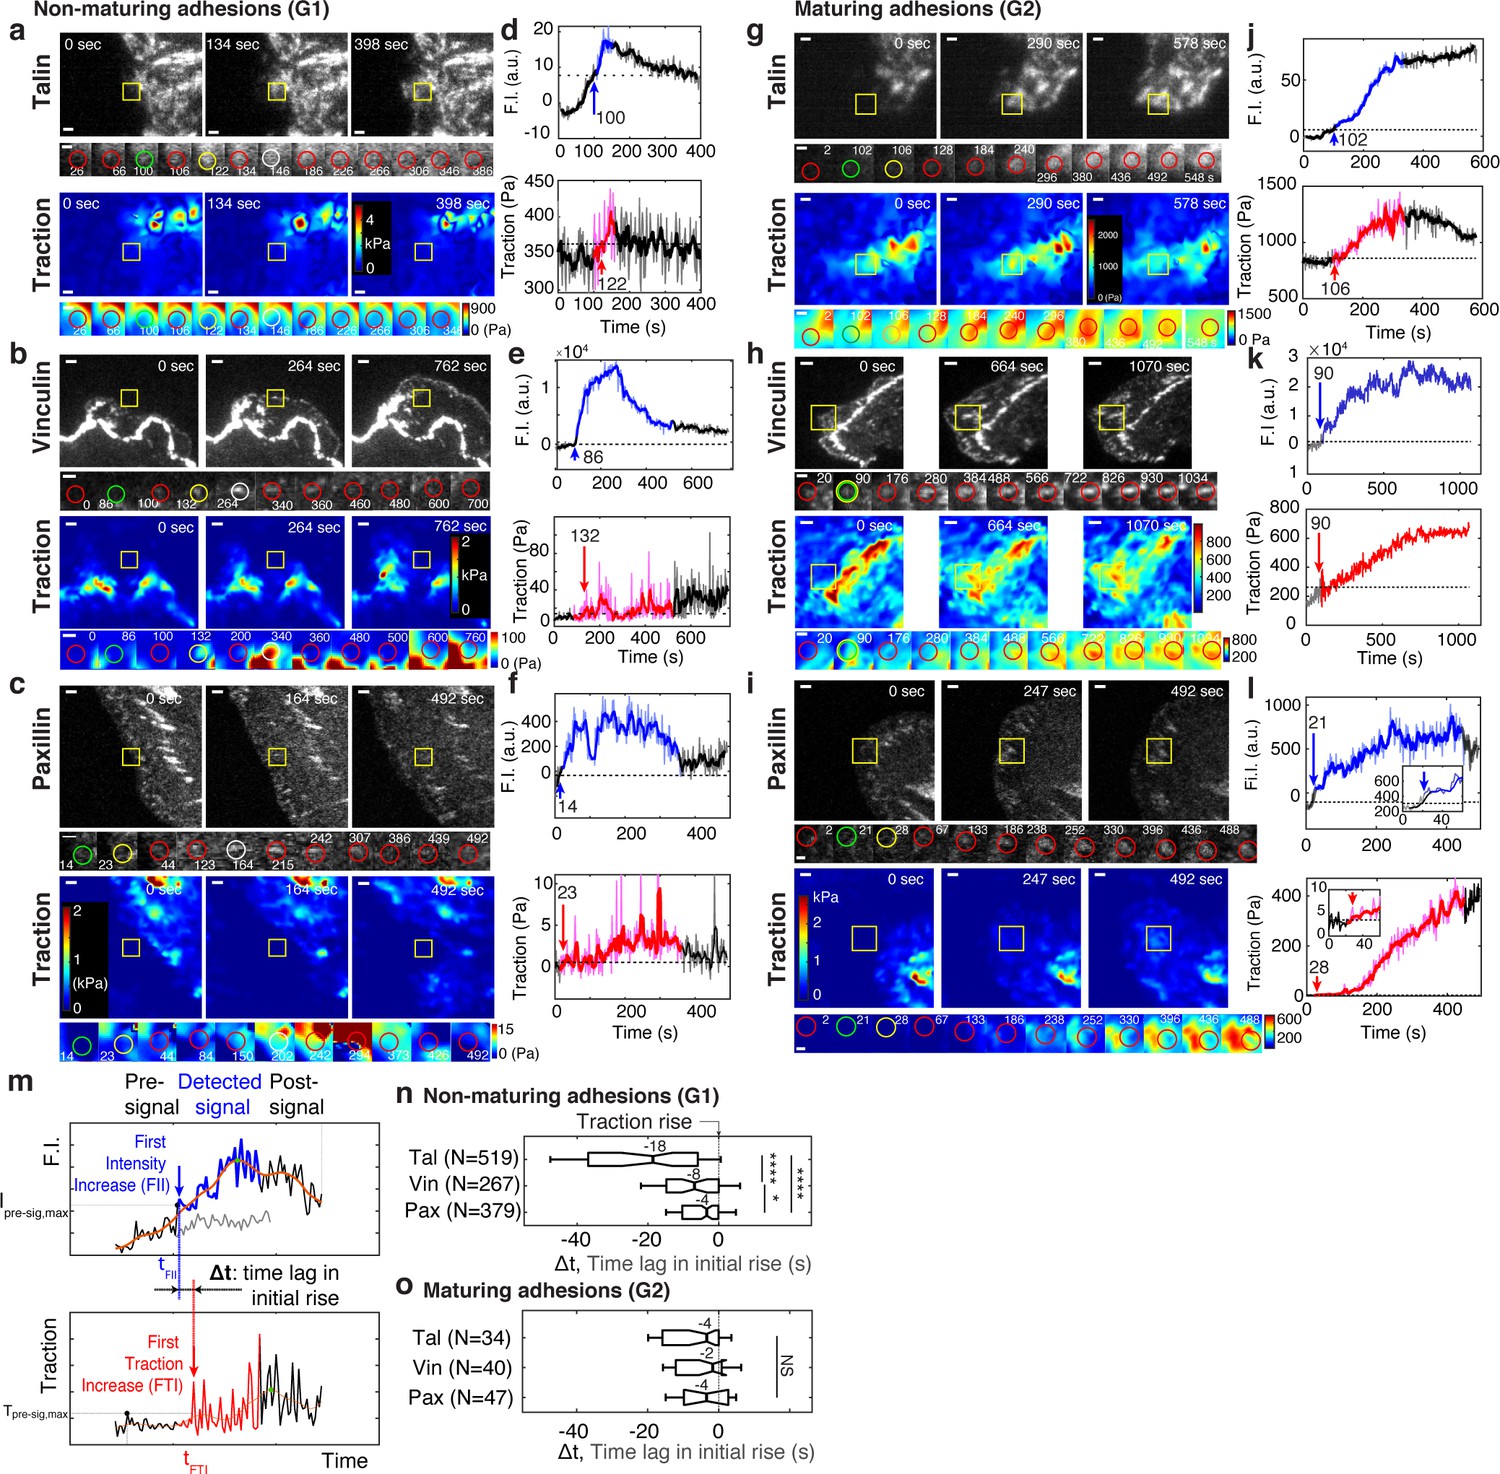
Talin and vinculin in non-maturing NAs are recruited in a sequential manner before traction development whereas in maturing NAs they are recruited concurrently, along with paxillin, briefly before the initial traction rise.
(a–l) Representative traces of protein recruitment and traction generation at non-maturing (a,b,c), or maturing (g,h,i) NAs. Each panel contains three views at different time points of mGFP-tagged talin (a,g, top), vinculin (b,h, top), and paxillin (c,i, top) and associated traction maps (bottom). Yellow boxes indicate positions of example adhesions whose fluorescent signals and traction levels are shown in time lapse montages with finer resolution underneath. Scale bar: 1 μm. Green circle represents the time point of initial talin/vinculin/paxillin signal rise, yellow circles show the time point of initial traction rise, and white circles shows the time of the peak amplitude, while red circles show regular detections in between these events. Scale bar: 1 µm. (d–l) Traces of fluorescence intensity amplitude (top) and traction (bottom). Blue and red segments indicate periods of significant fluorescence intensity amplitude and of traction, respectively, illustrated as ‘detected signal’ in (m). The black segments indicate the remaining background-subtracted fluorescence intensity and traction levels outside the detected signal period, that is, pre-signal and post-signal illustrated in (m). Whereas colored segments are read at positions moving with the adhesion center, pre- and post-signal traces are read at the first and last position of detected signal. An inset in (l) indicates that also in this trace the traction is gradually increasing. Blue and red arrows with the numbers on top mark the time points in seconds of the first intensity increase (FII) and the first traction increase (FTI), respectively, which are defined in (m). (m–o) Analysis of time-shifts between protein recruitment and FTI. (m) Traces of fluorescence intensity (top) and traction (bottom). Illustrated is the detection of the first significant value in both series. The gray signal represents the local background around the detected NA. Distinct distributions of time lags between FII and FTI in non-maturing (n) and maturing (o) NAs. Sample numbers, extracted from six cells for talin, five cells for vinculin and four cells for paxillin, are shown with each y-axis label. *p<1×10⁻², ****p<1×10⁻³⁰ by Mann-Whitney U test.
-
Figure 2—source data 1
Source data for Figure 2n.
- https://cdn.elifesciences.org/articles/66151/elife-66151-fig2-data1-v1.xlsx
-
Figure 2—source data 2
Source data for Figure 2o.
- https://cdn.elifesciences.org/articles/66151/elife-66151-fig2-data2-v1.xlsx
Figure 2—figure supplement 1
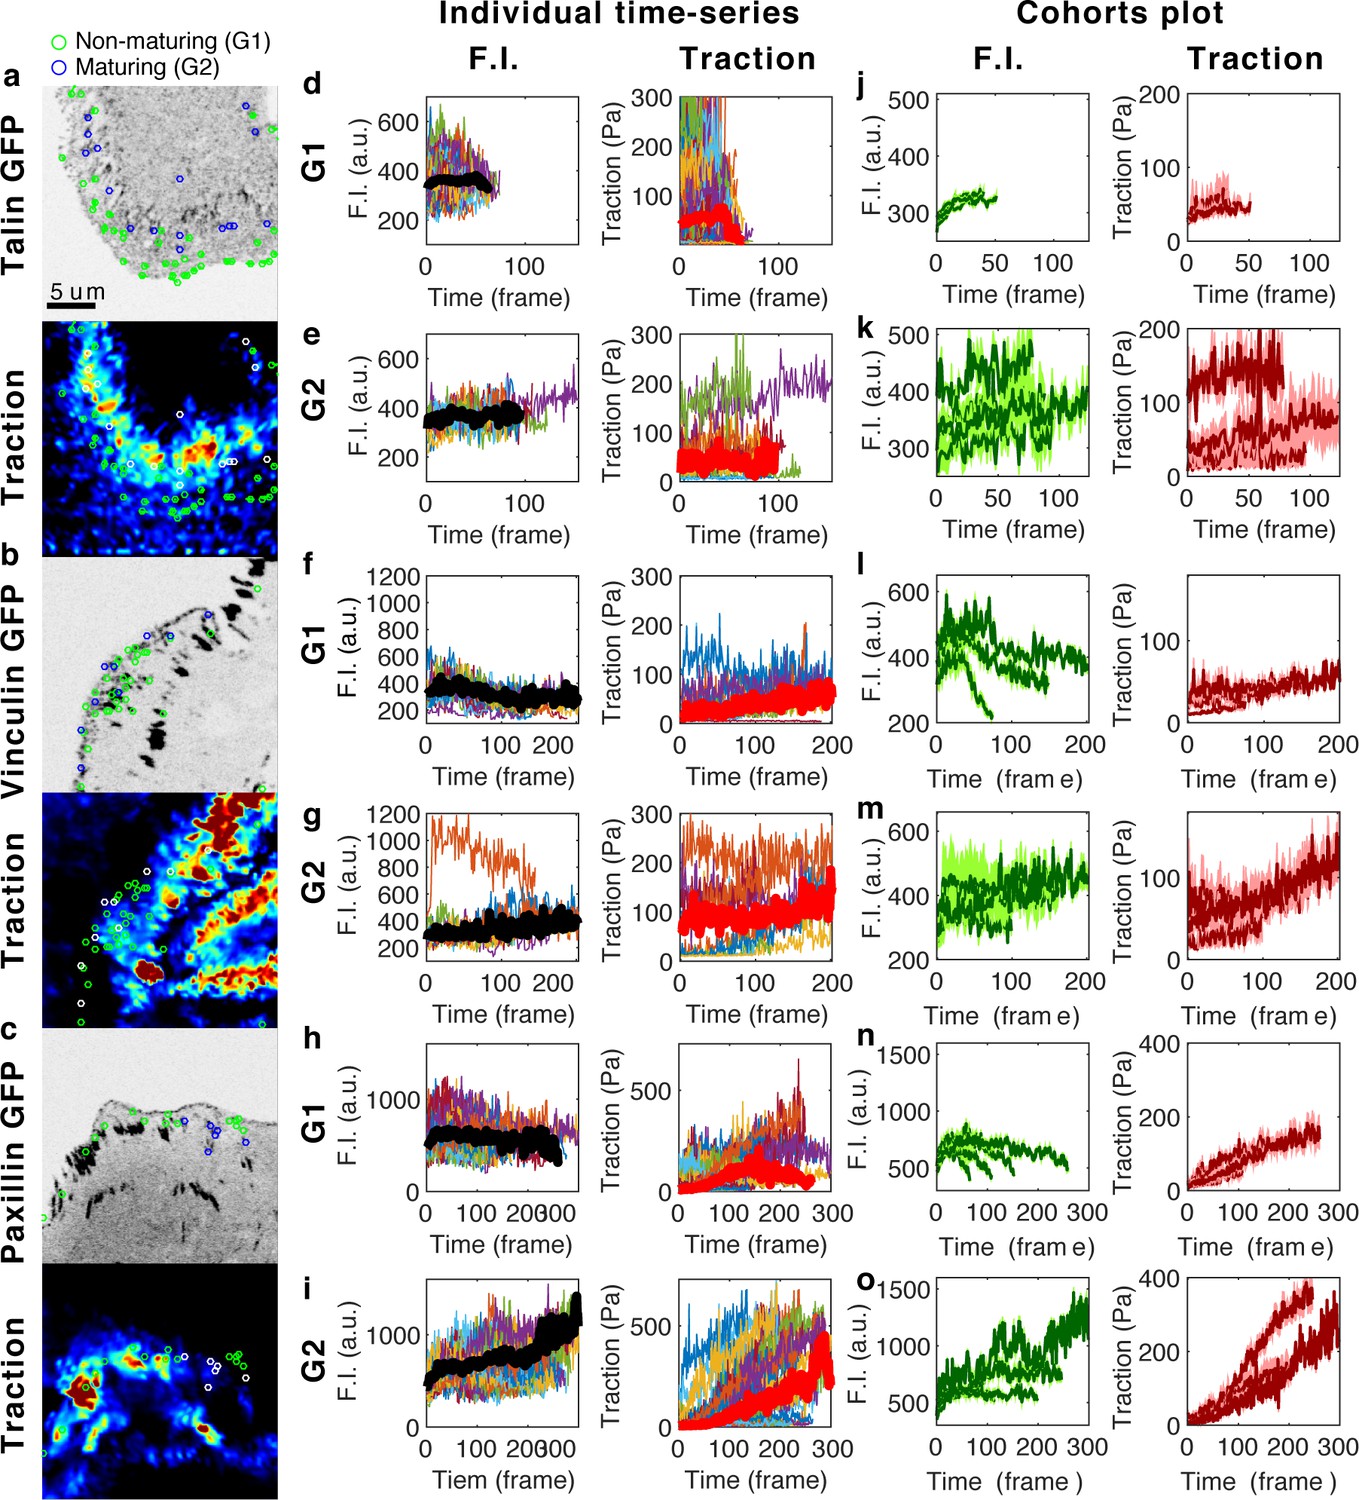
The time-series of fluorescence intensity and traction force within non-maturing (G1) and maturing (G2) NAs for talin, vinculin and paxillin show heterogeneity but ‘increasing’ trend within their lifetimes.
Images of GFP-tagged (a) talin, (b) vinculin, and (c) paxillin. Their corresponding traction maps are shown immediately below each image. (d–i) Individual time-series of fluorescence intensity (left column) and traction magnitude (right column) of all non-maturing (d,f,h) and maturing (e,g,i) NAs from the time-lapse images of talin (d–e), vinculin (f–g), and paxillin (h–i). (j–o) Cohorts plots, in which time-series with similar lifetime are grouped and the average time-series per group is plotted with 95% confidence interval, of fluorescence intensity (left column) and traction magnitude (right column) of non-maturing (j,l,n) and maturing (k,m,o) NAs from talin (j–k), vinculin (l–m), and paxillin (n–o).
Figure 2—figure supplement 2
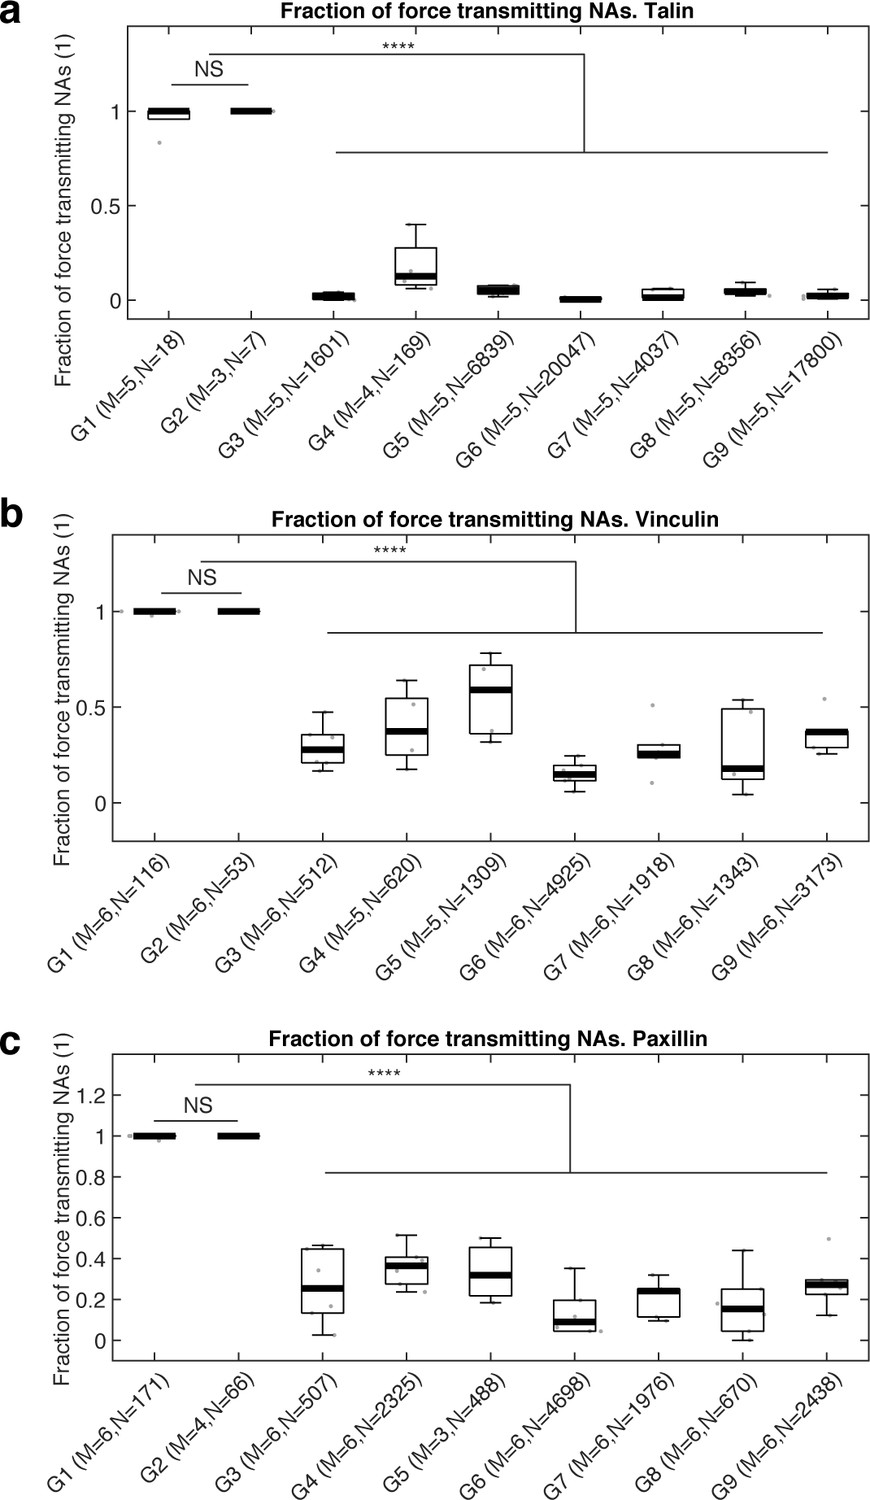
Box plots of fractions of force-transmitting NAs for each classification group for (a) talin, (b) vinculin, and (c) paxillin.
Note that nearly 100% of non-maturing (G1) and maturing (G2) NAs generate force, which is much higher than other adhesion classes (G3–G9). Statistical differences among G3-G9 are purposefully not shown.
Figure 3
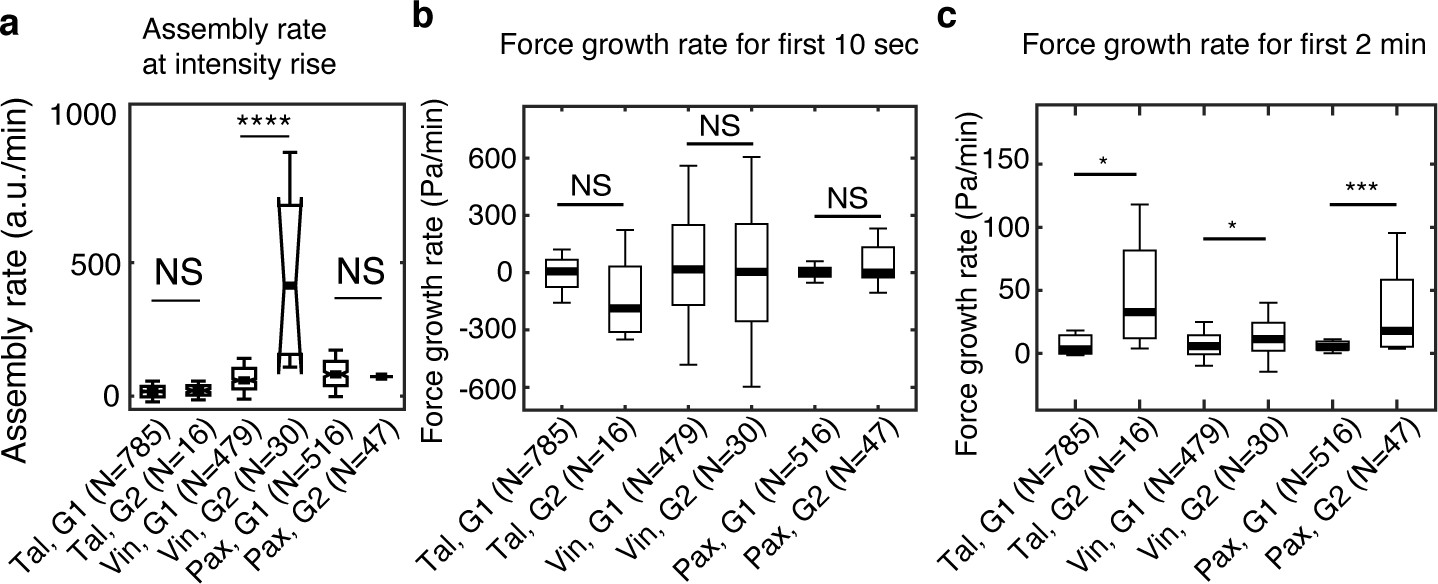
Vinculin, but not talin and paxillin, is recruited significantly faster in maturing NAs than in non-maturing NAs.
(a) Assembly rate of talin, vinculin, and paxillin, to G1 (non-maturing) or to G2 (maturing) NAs, quantified by the slope of fluorescence intensity over the initial 10 s after detection. (b) Traction growth rate at the NAs in (a) for the initial 10 s after detection. (c) Traction growth rate quantified over the first 2 min after detection. *p<1×10⁻², ***p<1×10⁻¹⁰, ****p<1×10⁻³⁰ by Mann-Whitney U test.
-
Figure 3—source data 1
Source data for Figure 3a.
- https://cdn.elifesciences.org/articles/66151/elife-66151-fig3-data1-v1.xlsx
-
Figure 3—source data 2
Source data for Figure 3b.
- https://cdn.elifesciences.org/articles/66151/elife-66151-fig3-data2-v1.xlsx
-
Figure 3—source data 3
Source data for Figure 3c.
- https://cdn.elifesciences.org/articles/66151/elife-66151-fig3-data3-v1.xlsx
Figure 4 with 1 supplement

Stabilizing the ‘threonine belt’ in the R8 domain of talin inhibits talin-vinculin interactions under tension-free conditions.
(a) Cartoon representation of talin R7R8 (pdb id 2X0C) showing the ‘threonine belt’, comprised of residues T1502, T1542, and T1562, labeled and shown as sticks (cyan), the VBS helix is colored red. (a.i) side on view (N.B. helix 31 transparent), (a.ii) top down view. (b) Denaturation profiles for WT R7R8wt (red) and R7R8vvv (black) measured by monitoring the change in circular dichroism at 208 nm with increasing temperature. R7R8wt has a melting temperature of 55°C, whereas R7R8vvv unfolds in two steps, one (R7) with a melting temperature of 56°C and R8 unfolding at 82°C. (c) Chromatograms showing binding of talin R7R8 to the vinculin head (Vd1). R7R8wt (red) and R7R8vvv (black) binding to Vd1. Complex peaks and unbound peaks are indicated.
Figure 4—figure supplement 1
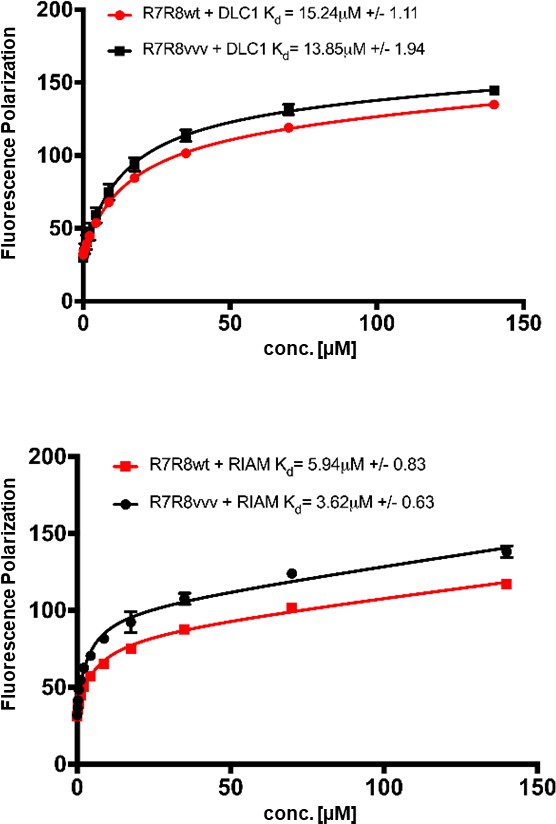
Fluorescence polarization assay showing the binding affinities for R8 ligand peptides from (top) RIAM TBS1 and (bottom) DLC1 with WT and R7R8vvv.
Figure 5 with 4 supplements
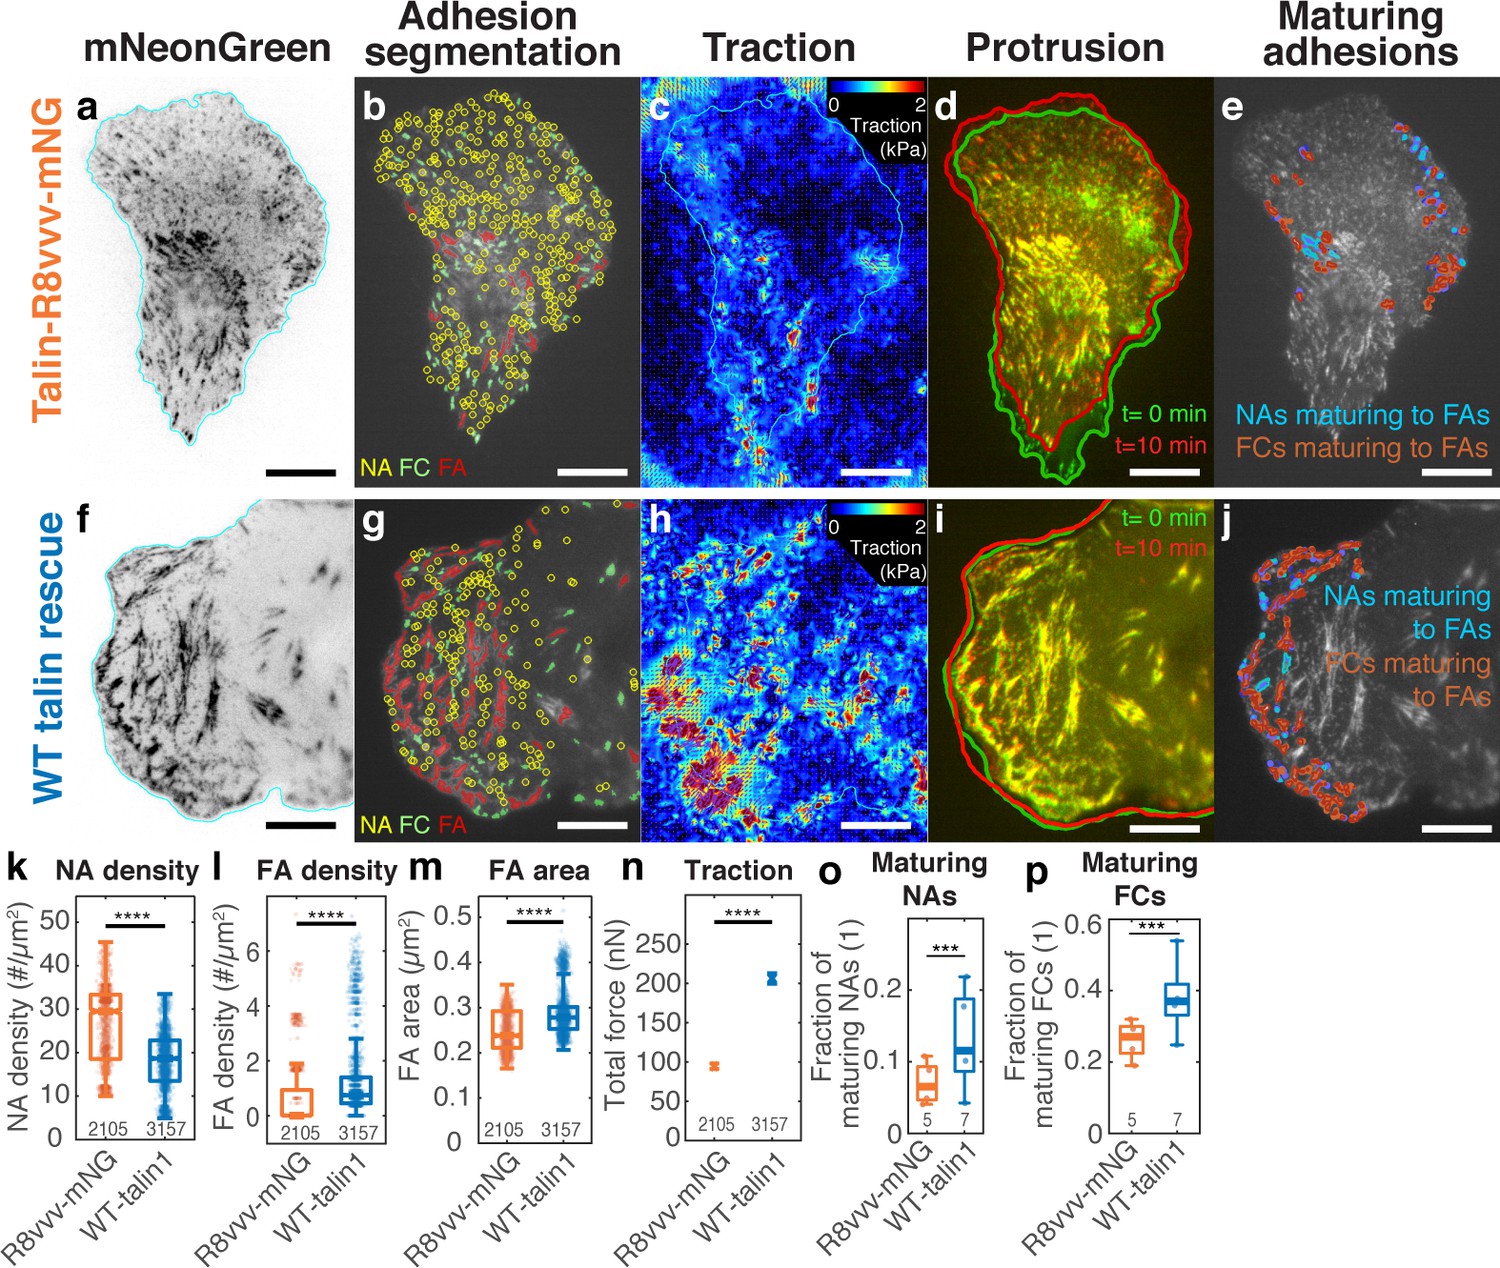
Expression of the talin1 R8vvv mutant in ChoK1 cells with endogenous talin1 knocked down results in the formation of denser NAs, but lesser and smaller FAs, lower traction, more active protrusions, and less maturing adhesions compared to WT talin.
(a–j) Adhesion, traction, and protrusion phenotype of a representative ChoK1 cell on 5 kPa substrate expressing (a–e) talin R8vvv mutant or (f–j) WT talin. (a and f) inverted talin-mNeonGreen images. (b and g) detection of NAs, FCs and FAs. (c and h) traction force maps. (d and i) snapshots of computer vision-extracted cell boundaries at 0 and 10 min of a movie. (e and j) overlay of NAs and FCs that mature to FAs. (k–p) Box plots of (k) NA density, (l) FA density, (m) FA area, (n) total traction integrated over cell area, (o) fraction of NAs maturing to FAs relative to all NAs, (p) and of the fraction of FCs maturing to FAs (relative to all FCs). Number of adhesions imaged are listed under each box plot. Number of independently imaged cells for talin1 R8vvv-mNG and WT talin1-mNG rescue were 5 and 7, respectively. Scale bar: 10 µm. ****: p<1×10-30 by Mann-Whitney U test.
-
Figure 5—source data 1
Source data for Figure 5k.
- https://cdn.elifesciences.org/articles/66151/elife-66151-fig5-data1-v1.xlsx
-
Figure 5—source data 2
Source data for Figure 5l.
- https://cdn.elifesciences.org/articles/66151/elife-66151-fig5-data2-v1.xlsx
-
Figure 5—source data 3
Source data for Figure 5m.
- https://cdn.elifesciences.org/articles/66151/elife-66151-fig5-data3-v1.xlsx
-
Figure 5—source data 4
Source data for Figure 5n.
- https://cdn.elifesciences.org/articles/66151/elife-66151-fig5-data4-v1.xlsx
-
Figure 5—source data 5
Source data for Figure 5o.
- https://cdn.elifesciences.org/articles/66151/elife-66151-fig5-data5-v1.xlsx
-
Figure 5—source data 6
Source data for Figure 5p.
- https://cdn.elifesciences.org/articles/66151/elife-66151-fig5-data6-v1.xlsx
Figure 5—figure supplement 1
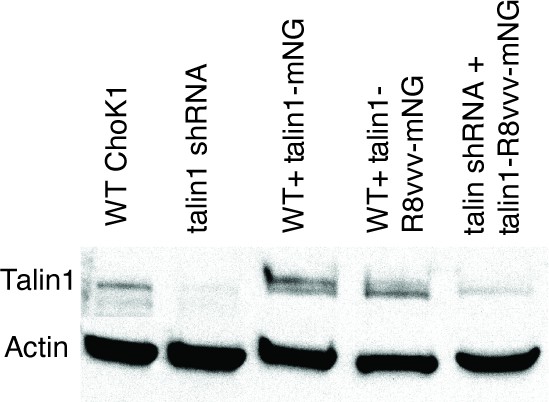
Western blot for talin in WT ChoK1 cells, ChoK1 with shRNA-mediated knockdown of talin, WT cells with ectopic expression of talin1-mNG, WT cells with ectopic expression of talin1-R8vvv-mNG, and ChoK1 cells with shRNA-mediated knockdown of talin and ectopic expression of talin1-R8vvv-mNG.
Actin is shown as a loading control. Note that the double bands in the third and fourth lanes is likely due to the presence of both endogenous and ectopic talin. The presence of a fluorescent protein tag results in a slight shift relative to the endogenously expressed talin. Also note the near-complete shRNA-mediated knockdown of talin expression.
Figure 5—figure supplement 2
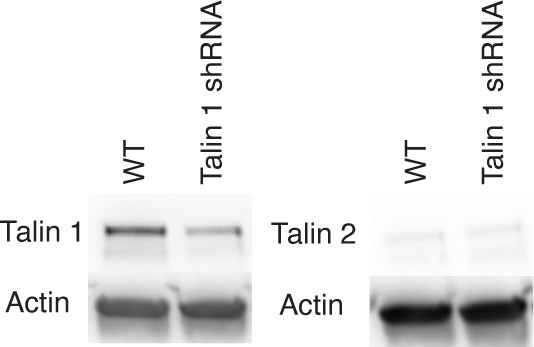
Western blot of talin1 and talin 2 in WT and knockdown (shRNA) cells.
A blot of actin is shown as a control.
Figure 5—figure supplement 3
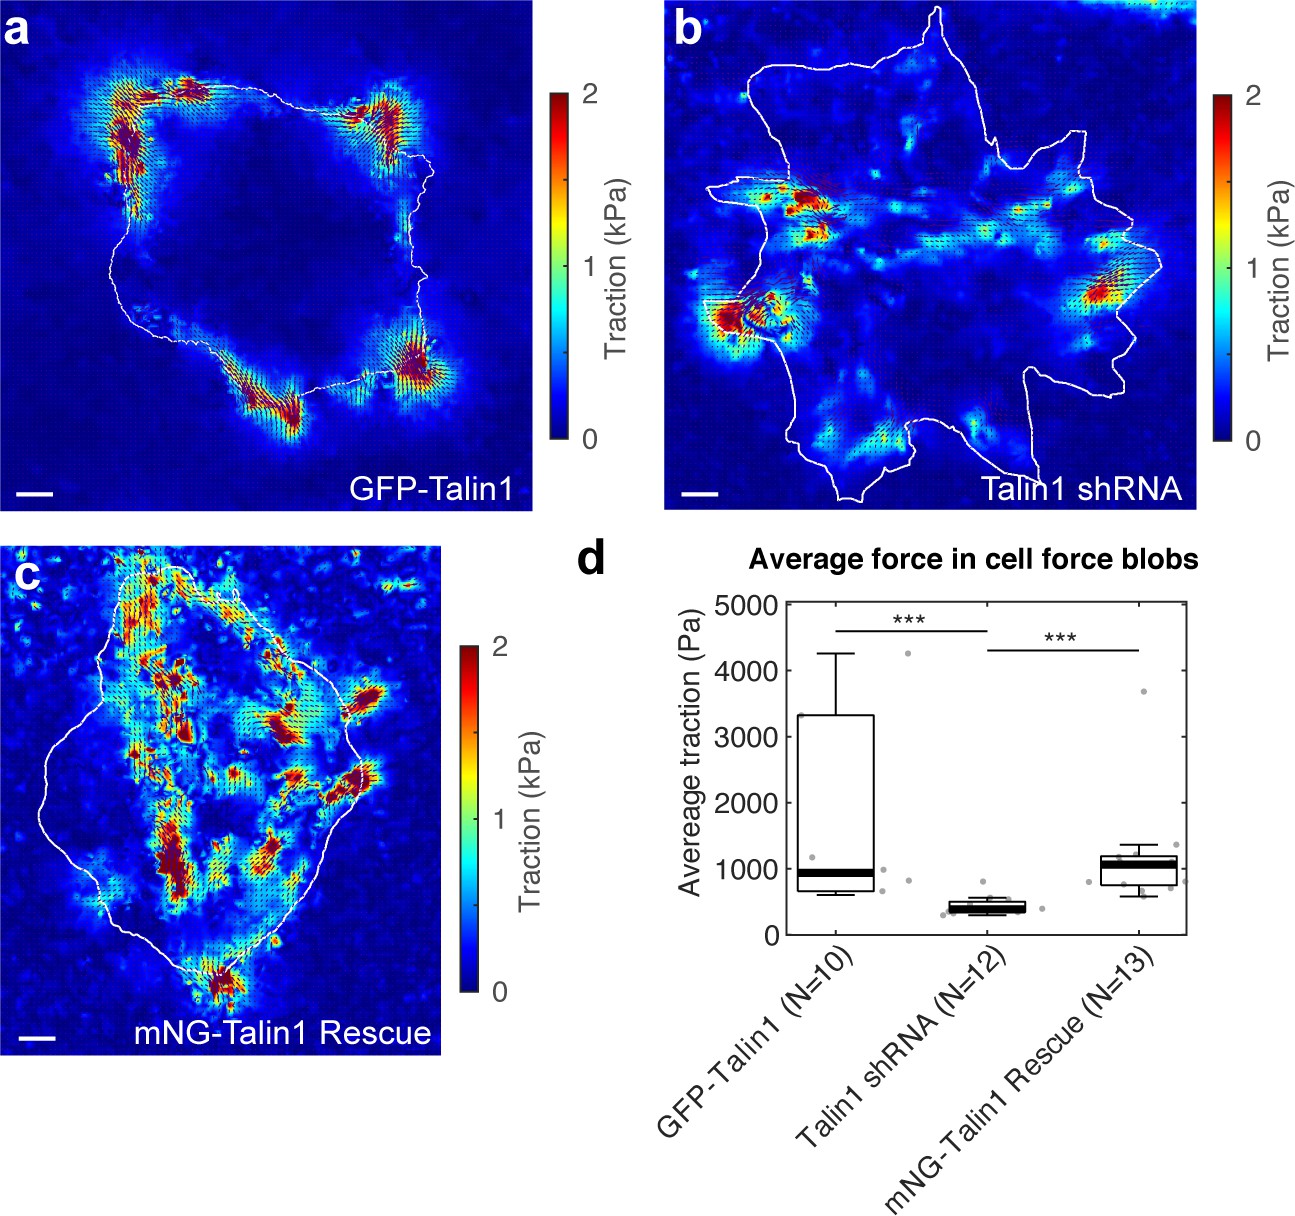
Traction forces generated by ChoK1 cells expressing the talin1 shRNA are smaller than GFP-talin1 and mNG-talin1 rescue cells.
(a–c) Traction map with force vectors for ChoK1 celsl with (a) GFP-talin1 overexpression, (b) talin1 shRNA, and (c) mNG-talin1 rescue. (d) The average traction at force blobs, that is, local forces showing significant force magnitude, for each of the three conditions. Note that average traction is much lower in talin1 shRNA than the two control conditions. ***p<1×10⁻³ by Mann-Whitney’s U-test.
Figure 5—figure supplement 4
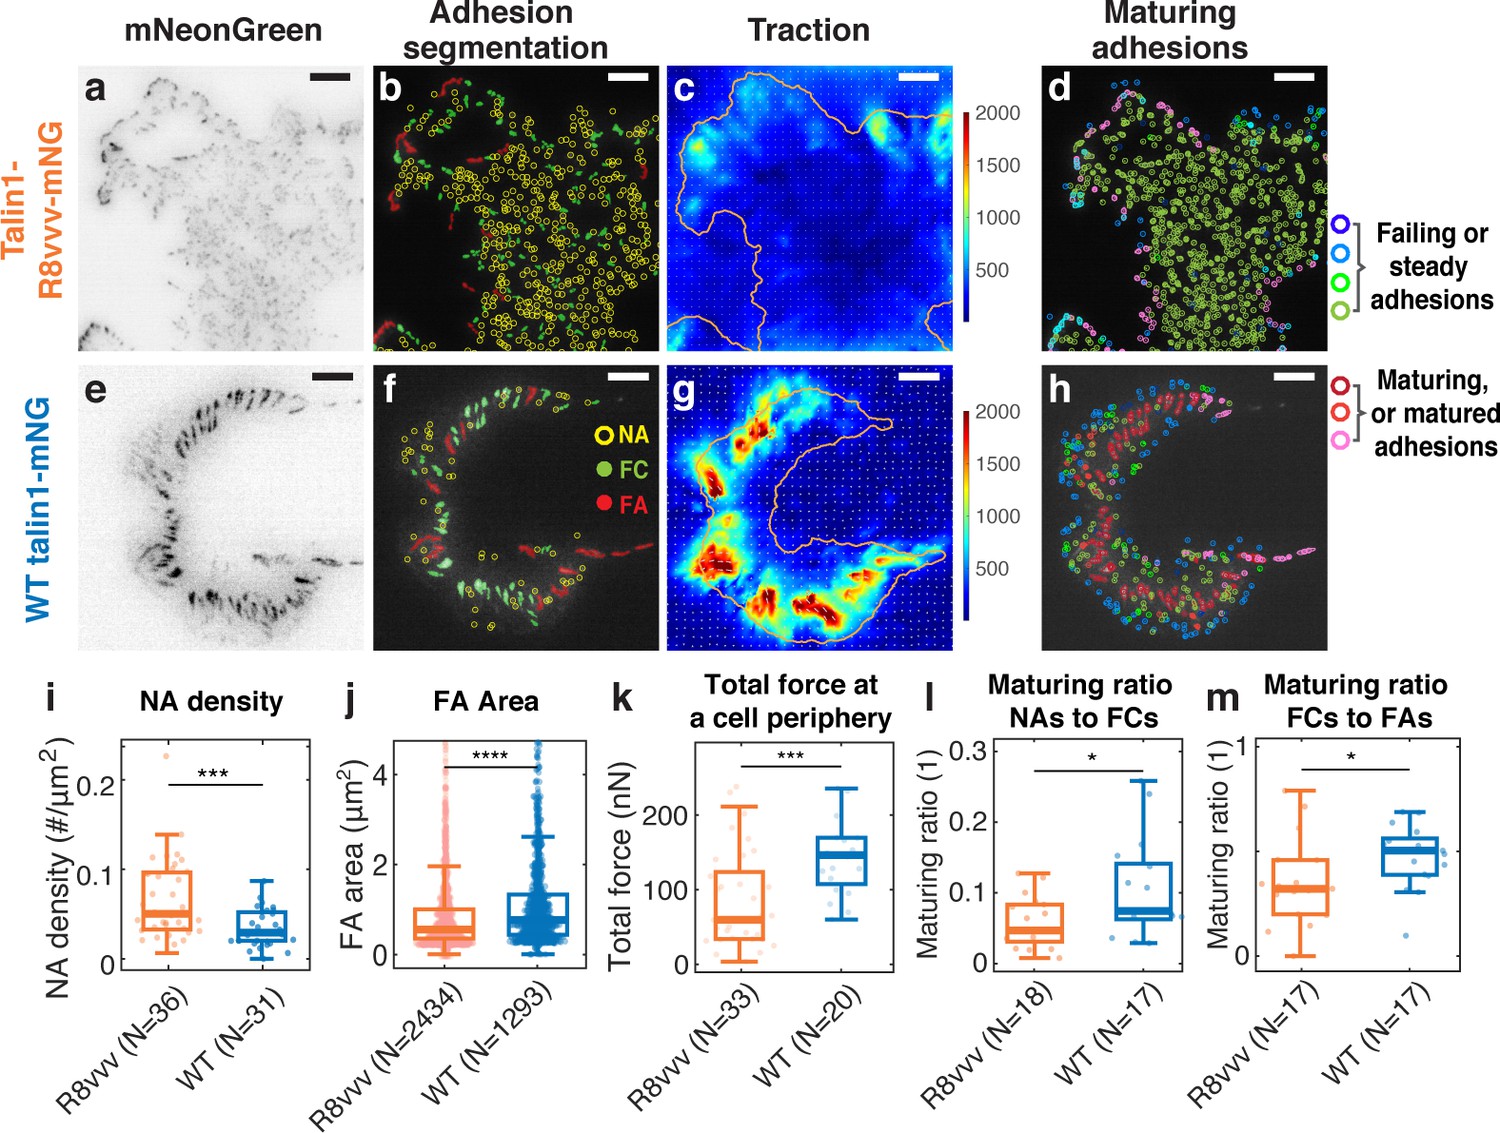
Expression of the talin1 R8vvv mutant results in formation of denser NAs, smaller FAs, lower traction, and less maturing adhesions compared to expression of the talin WT.
(a–h) Adhesion and traction phenotype of a representative IMCD cell on 5 kPa gel substrates expressing talin R8vvv mutant (a–d) vs WT talin1 (e–h). (a,e) Inverted talin-mNeonGreen images. (b,f) Detection of NAs, FCs, and FAs, color-code of them shown in f. (c,g) traction maps, and (d,h) trajectories of NAs, FCs, and FAs classified via the trained classifier. (i–m) Box plots of NA density (i), FA area (j), total traction integrated over cell’s perimeter area (k), the fraction of NAs maturing to FAs relative to all NAs (l) and of the fraction of FCs maturing to FAs (relative to all FCs) (m) for talin1 R8vvv-mNG and WT talin1-mNG rescue, respectively. N in i, k, l, m represents the number of independently imaged cells, while N in panel j represents the number of FAs in M = 36 and M = 31 cells for R8vvv and WT talin1 conditions. Scale bars in panels a-h: 5 µm. *p<0.05, ***p<1 × 10⁻³, and ****p<1 × 10⁻¹⁰ by Mann-Whitney U test.
Figure 6 with 1 supplement
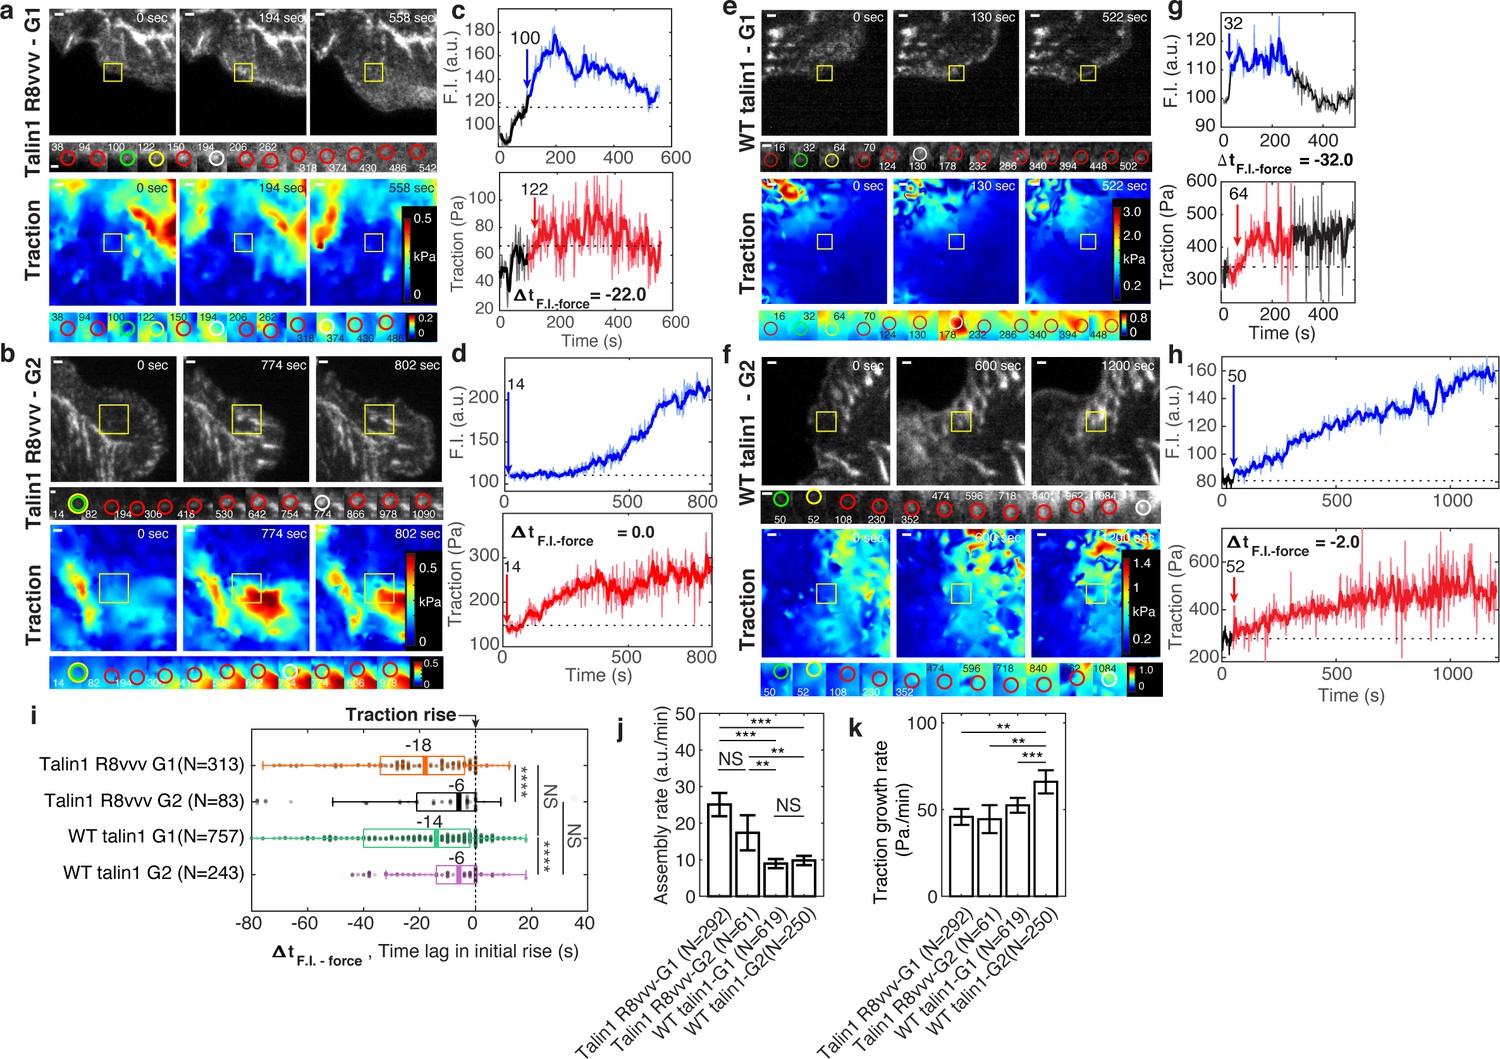
Expression of talin1 R8vvv-mNG mutant does not change the recruitment timing of talin to NAs, but reduces the force growth rate in NAs.
(a–h) Representative talin (top) and traction force (bottom) images of talin1 R8vvv-mNG expressing cells (a–d) and WT talin-mNG rescue cells (e–h) within non-maturing (a,c,e,g) and maturing (b,d,f,h) NAs. (a,b,e,f) talin-mNG images (top) and traction images (bottom) of three different time points, that is at initial nucleation, at maximum fluorescence intensity, and at the end of the NA portion of the track. Yellow boxes indicate positions of example adhesions whose fluorescent signals and traction levels are shown in time lapse montages with finer resolution underneath. Green circles indicate the time points of initial talin signal rise, yellow circles show the time points of initial traction rise, and white circles show the time of the peak amplitude. Red circles show normal default detections without special events. Scale bar: 1 µm. (c–d, g–h) Traces of talin-mNeonGreen fluorescence intensity (top) and traction (bottom). Phases of the traces with significant fluorescence above background are indicated in blue and red, respectively. The black time series outside the colored signal are the background-subtracted intensities read at the first or last position detected by the particle tracker. Blue and red arrows mark the time points of the first intensity increase and the first traction increase, respectively (i–k) Distributions of time lags of fluorescence intensity onset relative to traction onset (i), talin assembly rates (j), and traction growth rates (k) of non-maturing (G1) and maturing (G2) NAs in talin1 R8vvv-mNG mutant and WT talin1-mNG rescue cells. Time integration time for calculating slopes in j and k was 20 and 60 s, respectively. *p<1×10⁻², **p<1×10⁻³, ***p<1×10⁻¹⁰, ****p<1×10⁻³⁰ by Mann-Whitney U test.
-
Figure 6—source data 1
Source data for Figure 6i.
- https://cdn.elifesciences.org/articles/66151/elife-66151-fig6-data1-v1.xlsx
-
Figure 6—source data 2
Source data for Figure 6j.
- https://cdn.elifesciences.org/articles/66151/elife-66151-fig6-data2-v1.xlsx
-
Figure 6—source data 3
Source data for Figure 6k.
- https://cdn.elifesciences.org/articles/66151/elife-66151-fig6-data3-v1.xlsx
Figure 6—figure supplement 1
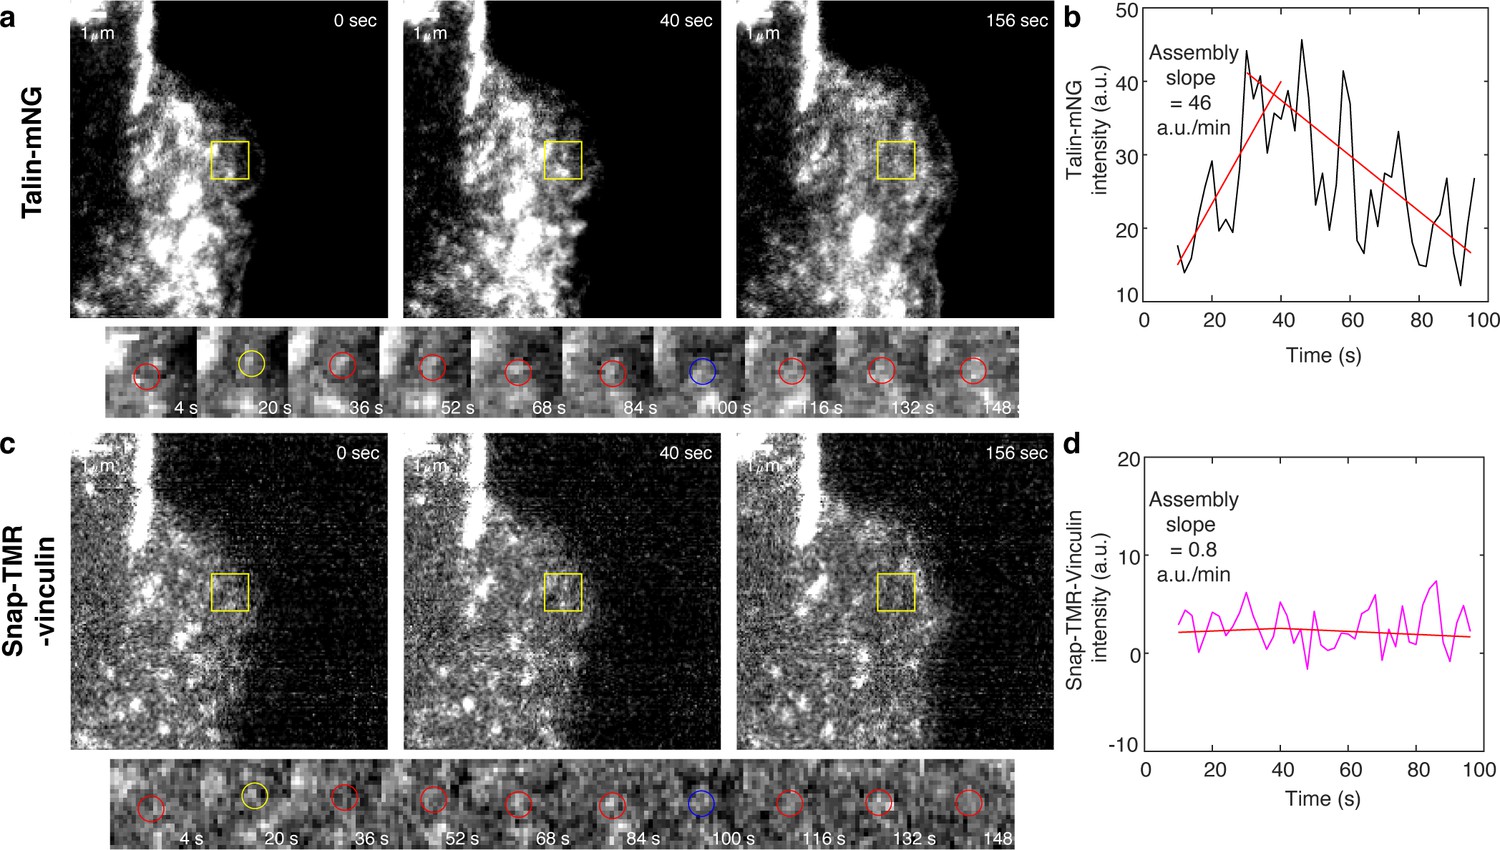
An example of a nascent adhesion in an R8vvv-expressing ChoK1 cell exhibiting high assembly rate.
(a) Representative talin images within a non-maturing NA of three different time points, that is, at initial nucleation, at maximum fluorescence intensity, and at the end of the NA portion of the track (top) and time lapse montages with finer resolution (bottom). Yellow boxes indicate positions of the example adhesion. Yellow circles show the time points of initial traction rise, and blue circles show the time of the trajectory termination. Scale bar: 1 µm. (b,d) Traces of talin-mNeonGreen fluorescence intensity (b) and Snap-TMR-vinculin fluorescence intensity (d). Note that only talin signal goes up fast (with 46 a.u./min) within 30 s then goes down while vinculin signal nearly stays constant (~0.8 a.u./min).
Figure 7
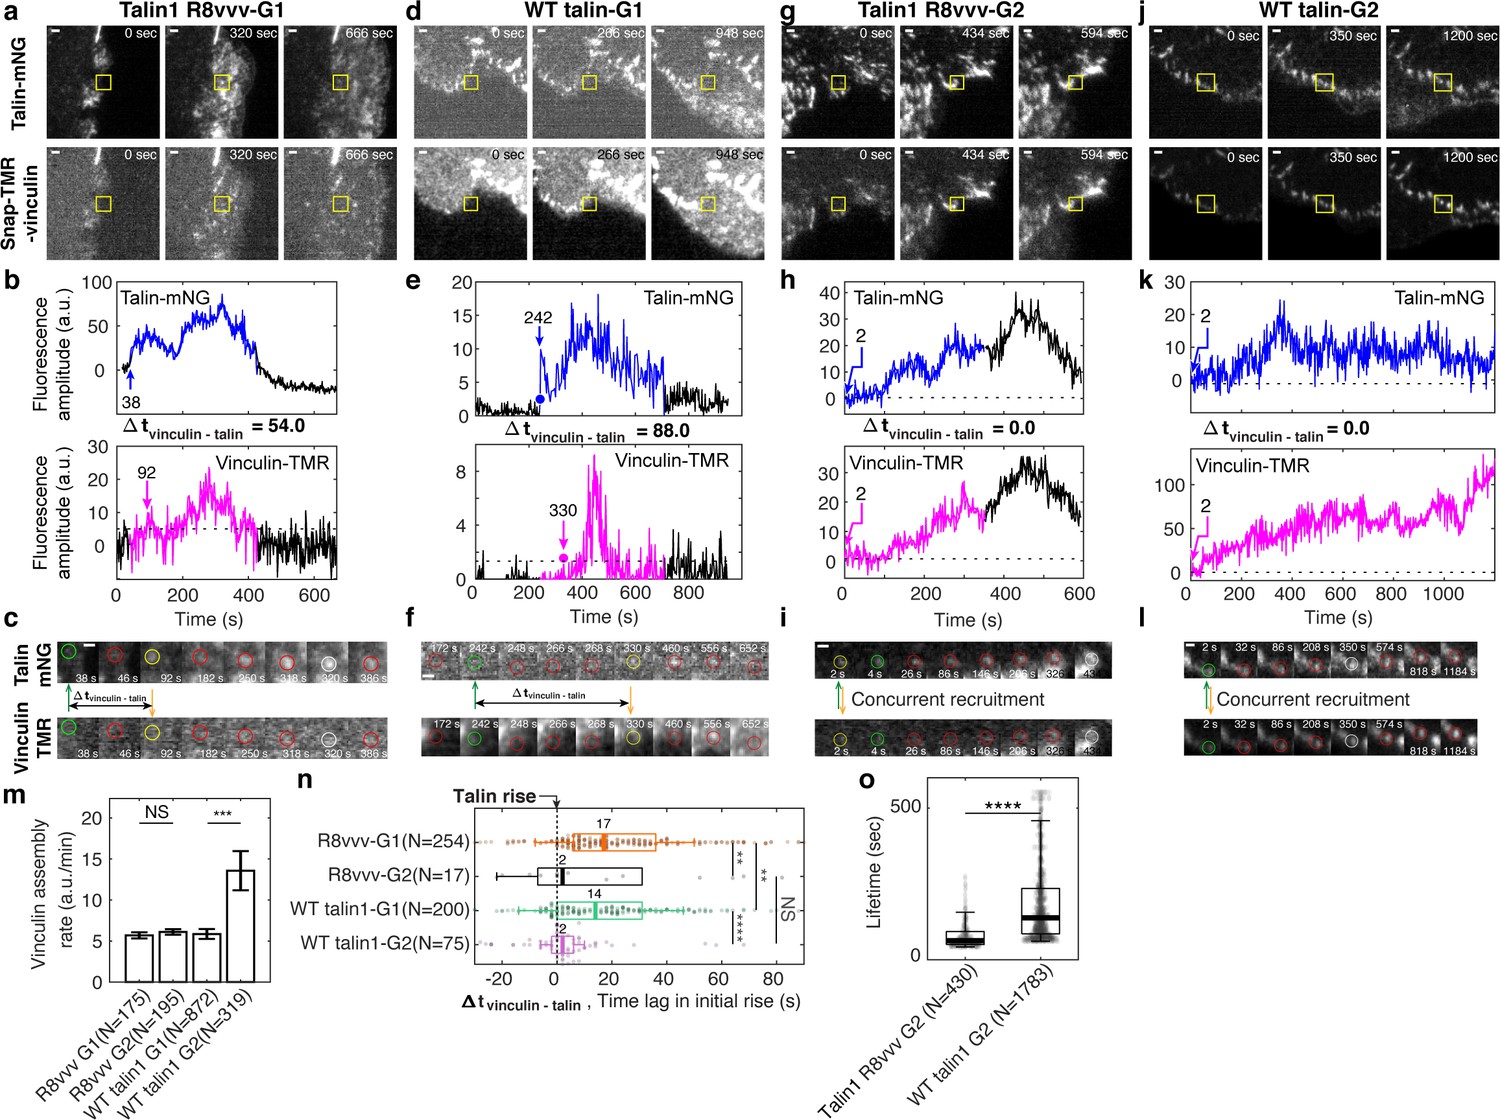
Vinculin recruitment is reduced in talin1 R8vvv mutant cells.
(a,d,g,j) Representative two-channel time-lapse images of talin-mNeonGreen (top) and vinculin-SnapTag-TMR-Star (bottom) of G1 NA in a Talin1 R8vvv mutant cell (a), G1 NA in WT talin1 rescue cell (d), G2 adhesion in a Talin1 R8vvv mutant cell (g), and G2 adhesion in WT talin1 rescue cell (j). NAs of interest are indicated with a yellow box. Scale bar: 1 μm. (b–k) Time series of talin-mNeonGreen amplitude (top) and vinculin-SnapTag-TMR-Star amplitude (bottom) of G1 non-maturing (b,e) and G2 maturing (h,k) NAs in cells expressing the talin1 R8vvv mutant (b,h) and WT talin (e,k) constructs. Colored time periods (blue for talin, magenta for vinculin) indicate the phases where the adhesion is detected as a significant particle of robust trackability. The black time series outside the colored signal are the background-subtracted intensities read at the first or last position detected by the particle tracker. Blue and magenta arrows and the text around them indicate the time of talin and vinculin recruitment onset, respectively. (c,f,k,l) Time lapse montages of individual NAs shown in a, d, g, and j, respectively, overlaid with colored circles as detected centers of NAs of interest. Green circle represents the time point of initial talin signal rise, yellow the time point of initial vinculin signal onset, white the time of the peak amplitude, while red circles show normal default detections without special events. Talin and vinculin’s initial recruitments are indicated with green and yellow arrows to highlight the time delay occurring between talin and vinculin in G1 adhesions and the concurrent recruitment in G2 adhesions, regardless of R8vvv mutations. (m) Vinculin assembly rates at non-maturing and maturing NAs in R8vvv mutant and WT talin rescue cells, quantified by the slope of vinculin-SnapTag-TMR-Star fluorescence intensity over the initial 20 s after the first detection in the talin-mNeonGreen channel. (n) Time delays of vinculin recruitment onset relative to talin recruitment onset of non-maturing vs. maturing NAs in talin1 R8vvv-mNG mutant and WT talin1 mNG cells. Vinculin recruitment onsets in non-maturing NAs are positive, that is, vinculin recruitment starts after talin. In contrast, vinculin recruitment onsets in maturing NAs are nearly coincidental with talin. See the text for further description. (o) Lifetimes of maturing NAs classified in talin1 R8vvv mutant and WT talin1 mNG rescue cells. ****p<1×10⁻¹⁵, **p<0.05 by Mann-Whitney U test. The numbers of adhesions (N), extracted from seven cells each for cells with talin1 R8vvv-mNG and WT talin1-mNG, are shown per each condition name at each panel.
-
Figure 7—source data 1
Source data for Figure 7m.
- https://cdn.elifesciences.org/articles/66151/elife-66151-fig7-data1-v1.xlsx
-
Figure 7—source data 2
Source data for Figure 7n.
- https://cdn.elifesciences.org/articles/66151/elife-66151-fig7-data2-v1.xlsx
-
Figure 7—source data 3
Source data for Figure 7o.
- https://cdn.elifesciences.org/articles/66151/elife-66151-fig7-data3-v1.xlsx
Figure 8
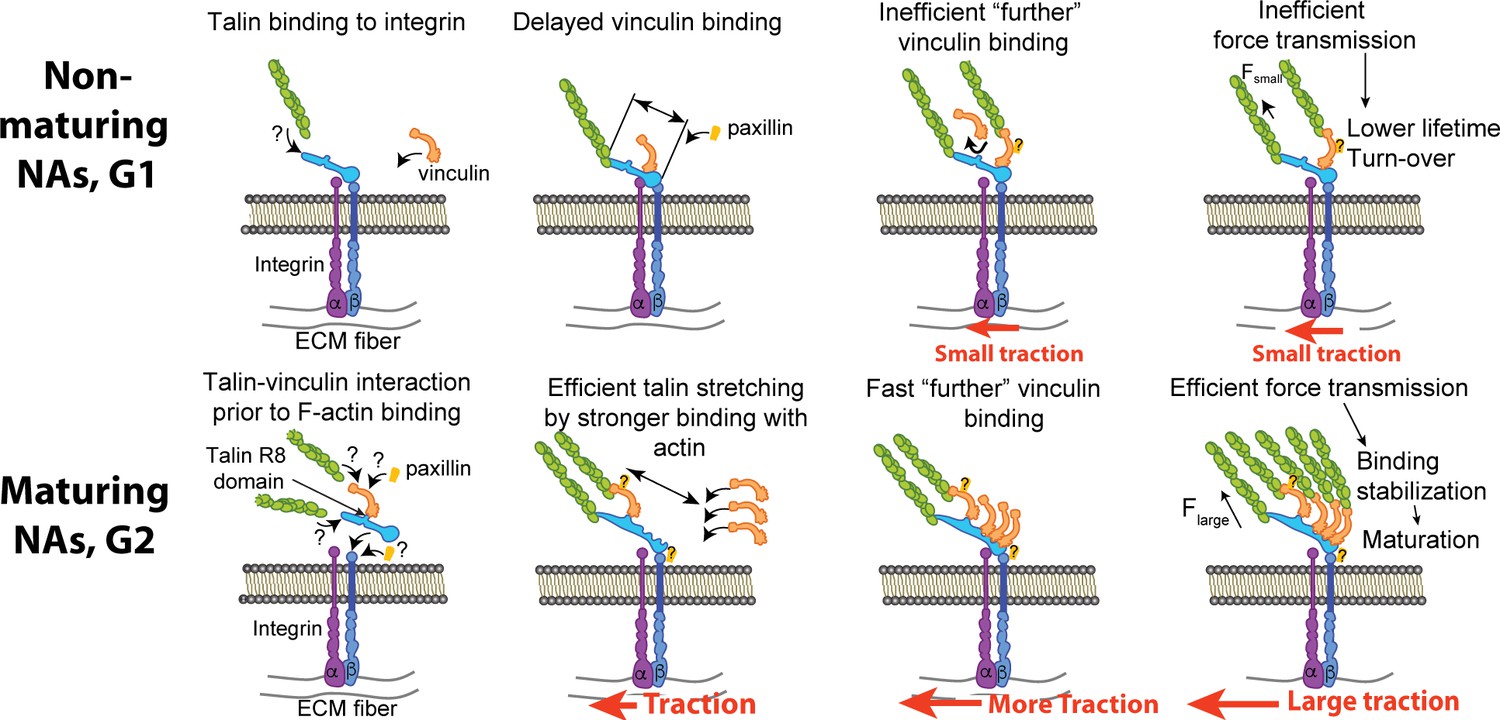
A suggested mechanism of differential recruitment of talin and vinculin determining maturation of nascent adhesions.
(Top) For non-maturing NAs, talin binds to integrin before vinculin recruitment. Talin stretching might be limited to a shorter level, which limits the exposure of vinculin-binding-sites. Inefficient vinculin binding, in turn, limits the number of F-actin that can connect to the adhesion complex, allowing for only a low amount of tension across the complex. Insufficient loading level reduces the lifetime of catch-bond like associations between molecules, resulting in turnover of the NA complex. (Bottom) For maturing NAs, talin and vinculin interact before engagement with integrin. Upon concurrent recruitment to the NA traction force builds immediately. Talin might be stretched in a faster manner by pre-associated vinculin and talin’s own binding to F-actin accommodate faster, efficient recruitment of additional vinculin. High loading levels across the complex stabilizes molecular bonds, which facilitates the maturation of the NA. The sites for paxillin binding, for example, to vinculin or β-integrin via FAK, are inferred from the literature (Humphries et al., 2007; Turner et al., 1990; Hu et al., 2014; Lawson et al., 2012).
Author response image 1
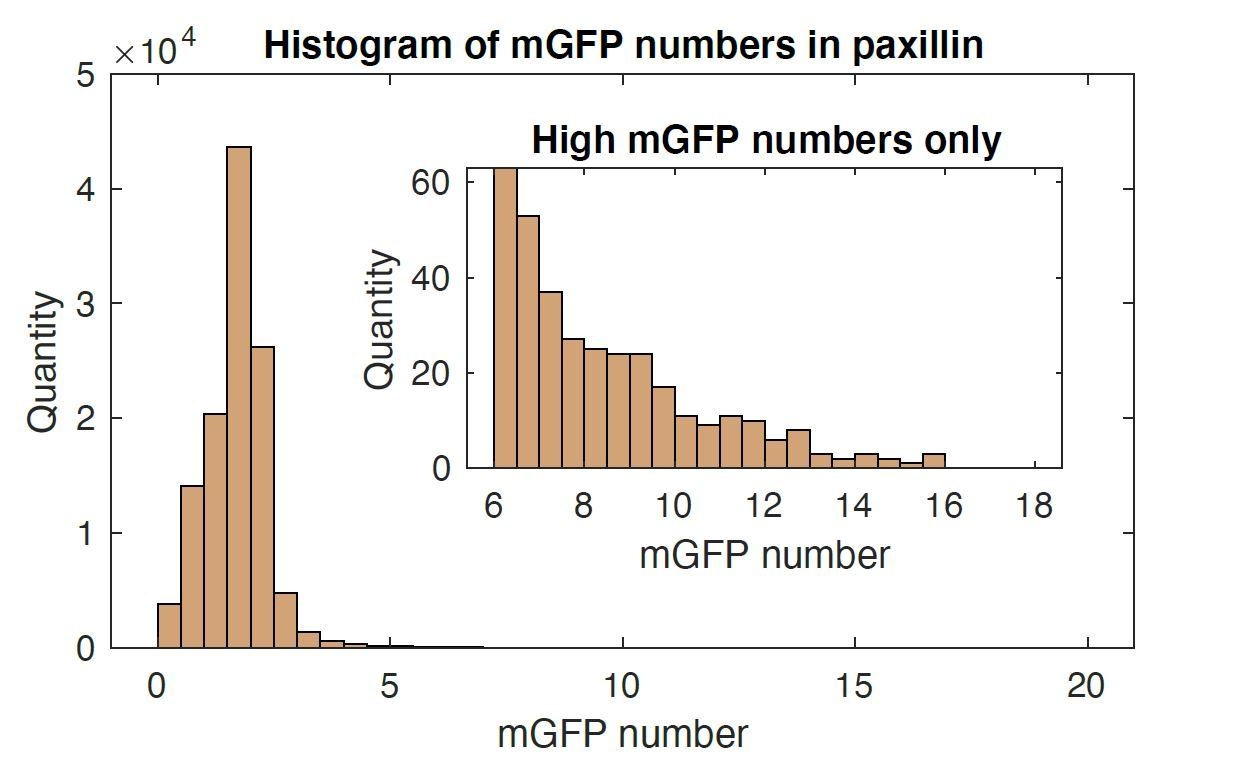
Histogram of mGFP molecules in one paxillin-mGFP time lapse images.
Mean value was 1.7 with 1.08 standard deviation. Up to 16 mGFP molecules were able to be resolved.
Videos
Video 1
Time-lapse images of GFP-tagged vinculin in a ChoK1 cell, overlaid with adhesion trajectories and classification state from the support vector machine (SVM)-based machine-learning.
Different colors represent different classes: G1 (light green), G2 (dark blue), G3 (red), G4 (light blue), G5 (yellow), G6 (cyan), G7 (pink), G8 (dark green), and G9 (brown). The time interval per frame: 2 s. Playing speed: 25 frames/s. Duration of the movie: 12 min. Scale bar: 5 μm.
Video 2
Time-lapse images of GFP-tagged talin in a ChoK1 cell.
The time interval per frame: 1.644 s. Playing speed: 25 frames/s. Duration of the movie: 8 min 13 s. Scale bar: 5 μm.
Video 3
Time-lapse images of traction force magnitude for a ChoK1 cell expressing GFP-talin.
Traction forces are reconstructed from the bead images using high-resolution, L1-regularized, TFM software (Han et al., 2015). The color scale is the same as one at Figure 1a, that is, 0 (blue) – 300 Pa (red). The time interval per frame: 1.644 s. Playing speed: 25 frames/s. Duration of the movie: 8 min 13 s. Scale bar: 5 μm.
Video 4
Time-lapse images of GFP-tagged talin in a ChoK1 cell, overlaid with adhesion trajectories and classification state from the support vector machine (SVM)-based machine-learning.
The color coding is the same as in the legend of Video 1. The time interval per frame: 1.644 s. Playing speed: 25 frames/s. Duration of the movie: 8 min 13 s. Scale bar: 5 μm.
Video 5
Time-lapse images of GFP-tagged vinculin in a ChoK1 cell.
The time interval per frame: 2 s. Playing speed: 25 frames/s. Duration of the movie: 12 min. Scale bar: 5 μm.
Video 6
Time-lapse images of traction force magnitude for a ChoK1 cell expressing GFP-vinculin.
Traction forces are reconstructed from the bead images using high-resolution, L1-regularized, TFM software (Han et al., 2015). The color scale is the same as one at Figure 1b, that is, 0 (blue) – 1800 Pa (red). The time interval per frame: 2 s. Playing speed: 25 frames/s. Duration of the movie: 12 min. Scale bar: 5 μm.
Video 7
Time-lapse images of GFP-tagged paxillin in a ChoK1 cell.
The time interval per frame: 1.644 s. Playing speed: 25 frames/s. Duration of the movie: 8 min 13 s. Scale bar: 5 μm.
Video 8
Time-lapse images of traction force magnitudes generated by a ChoK1 cell expressing GFP-paxillin.
Traction forces are reconstructed from the bead images using high-resolution, L1-regularized, TFM software (Han et al., 2015). The color scale is the same as one at Figure 1c, that is, 0 (blue) – 1000 Pa (red). The time interval per frame: 1.644 s. Playing speed: 25 frames/s. Duration of the movie: 8 min 13 s. Scale bar: 5 μm.
Video 9
Time-lapse images of GFP-tagged paxillin in a ChoK1 cell, overlaid with adhesion trajectories and classification state from the support vector machine (SVM)-based machine-learning.
The color coding is the same as in the legend of Video 1. The time interval per frame: 1.644 s. Playing speed: 25 frames/s. Duration of the movie: 8 min 13 s. Scale bar: 5 μm.
Tables
Key resources table
| Reagent type (species) or resource | Designation | Source or reference | Identifiers | Additional information |
|---|---|---|---|---|
| E. coli | BL21(DE3) | Sigma-Aldrich | CMC0016 | Electrocompetent cells |
| Cell line (Cricetulus griseus) | CHO-K1 | ATCC | CCL-61 | Courtesy of Dr.Horwitz, Allen Institute |
| Cell line Mus musculus | IMCD Talin1/2 KO | This paper | Courtesy of Dr. Zent, Vanderbilt University | |
| Lentiviral expression vector | pLVX-shRNA1 | Clontech | Lentiviral construct for stable expression of shRNA. | |
| Lentiviral expression vector | pLVX-CMV-100 | Addgene | Catalog # 110718 | Lentiviral construct for stable expression of ectopic proteins. |
| Transient expression vector | pCDNA3.1(+) | ThermoFisher Scientific | Catalog # V79020 | DNA construct for transient expression of ectopic proteins. |
| Primary antibody | Anti-talin 1 | Abcam | Catalog # 71333 | WB 1:1000 |
| Primary antibody | Anti-talin 2 | Abcam | Catalog # 105458 | WB 1:1000 |
| Secondary antibody | Goat anti-Mouse IgG (H+L) Cross-Adsorbed- Perosidaxe Antibody | ThermoFisher Scientific | Catalog # G-21040 | WB 1:1000 |
| Secondary antibody | Goat anti-Rabbig IgG (H+L) Cross-Adsorbed-Peroxidase Antibody | ThermoFisher Scientific | Catalog # G-21234 | WB 1:1000 |
| Transient expression vector | pCDNA-mNG-Talin-shRNA-R8 | R8 mutant of Talin1 resistant to shRNA. | ||
| Transient expression vector | pCDNA-mNG-shRNA-Talin | WT Talin1 resistant to shRNA | ||
| Transient expression vector | pCDNA-mNG-Talin | WT Talin1 | ||
| Lentiviral expression vector | pLVXCMV100-mNG-Talin-shRNA-R8 | R8 mutant of Talin1 resistant to shRNA. | ||
| Lentiviral expression vector | pLVXCMV100-mNG-Talin-shRNA | WT Talin1 resistant to shRNA | ||
| Lentiviral expression vector | pLVXCMV100-mNG-Talin | WT Talin1 | ||
| Transient expression vector | Paxillin-GFP | Original construct from Horwitz Lab | ||
| Transient expression vector | Vinculin-GFP | Original construct from Horwitz Lab | ||
| Transient expression vector | Talin-GFP | Original construct from Horwitz Lab | ||
| Recombinant expression vector | pet151-Talin1-R7R8-WT (murine) | GeneArt | Original construct from Goult Lab | |
| Recombinant expression vector | pet151-Talin1-R7R8-VVV (murine) | GeneArt | Original construct from Goult Lab | |
| Recombinant expression vector | pet151-Vinculin-Vd1 (murine) | Original construct from Goult Lab | ||
| Synthetic peptide | RIAM-TBS1 peptide (RIAM_6_30-C) DIDQMFSTLLGEMDLLTQSLGVDT-C | GLBiochem | ||
| Synthetic peptide | DLC1 peptide (DLC1_465_489-C) IFPELDDILYHVKGMQRIVNQWSEK-C | GLBiochem |
Additional files
-
Supplementary file 1
Tables for information used in machine learning of adhesions.
(A) Features used for classification of adhesions. (B) Nine adhesion groups defined heuristically. (C) Automatic labeling criteria.
- https://cdn.elifesciences.org/articles/66151/elife-66151-supp1-v1.docx
-
Transparent reporting form
- https://cdn.elifesciences.org/articles/66151/elife-66151-transrepform-v1.pdf
Download links
A two-part list of links to download the article, or parts of the article, in various formats.
Downloads (link to download the article as PDF)
Open citations (links to open the citations from this article in various online reference manager services)
Cite this article (links to download the citations from this article in formats compatible with various reference manager tools)
Pre-complexation of talin and vinculin without tension is required for efficient nascent adhesion maturation
eLife 10:e66151.
https://doi.org/10.7554/eLife.66151


