Unmasking coupling between channel gating and ion permeation in the muscle nicotinic receptor
- Receptor Biology Laboratory, Department of Physiology and Biomedical Engineering, United States
- Department of Molecular Pharmacology and Experimental Therapeutics, United States
- Department of Neurology, Mayo Clinic College of Medicine, United States
Figures
Figure 1

A conserved intra-subunit salt bridge links pore-lining and peripheral α-helices.
(A) Sequence alignment human of pLGIC subunit M2 and M4 domains. (B) Structure of the Torpedo receptor (PDB: 6UWZ) viewed perpendicular (upper) and parallel (lower) to the cell membrane. Close up views show the salt bridge between the M2 and M4 α-helices rendered as sticks with surface mesh overlaid.
Figure 2 with 1 supplement
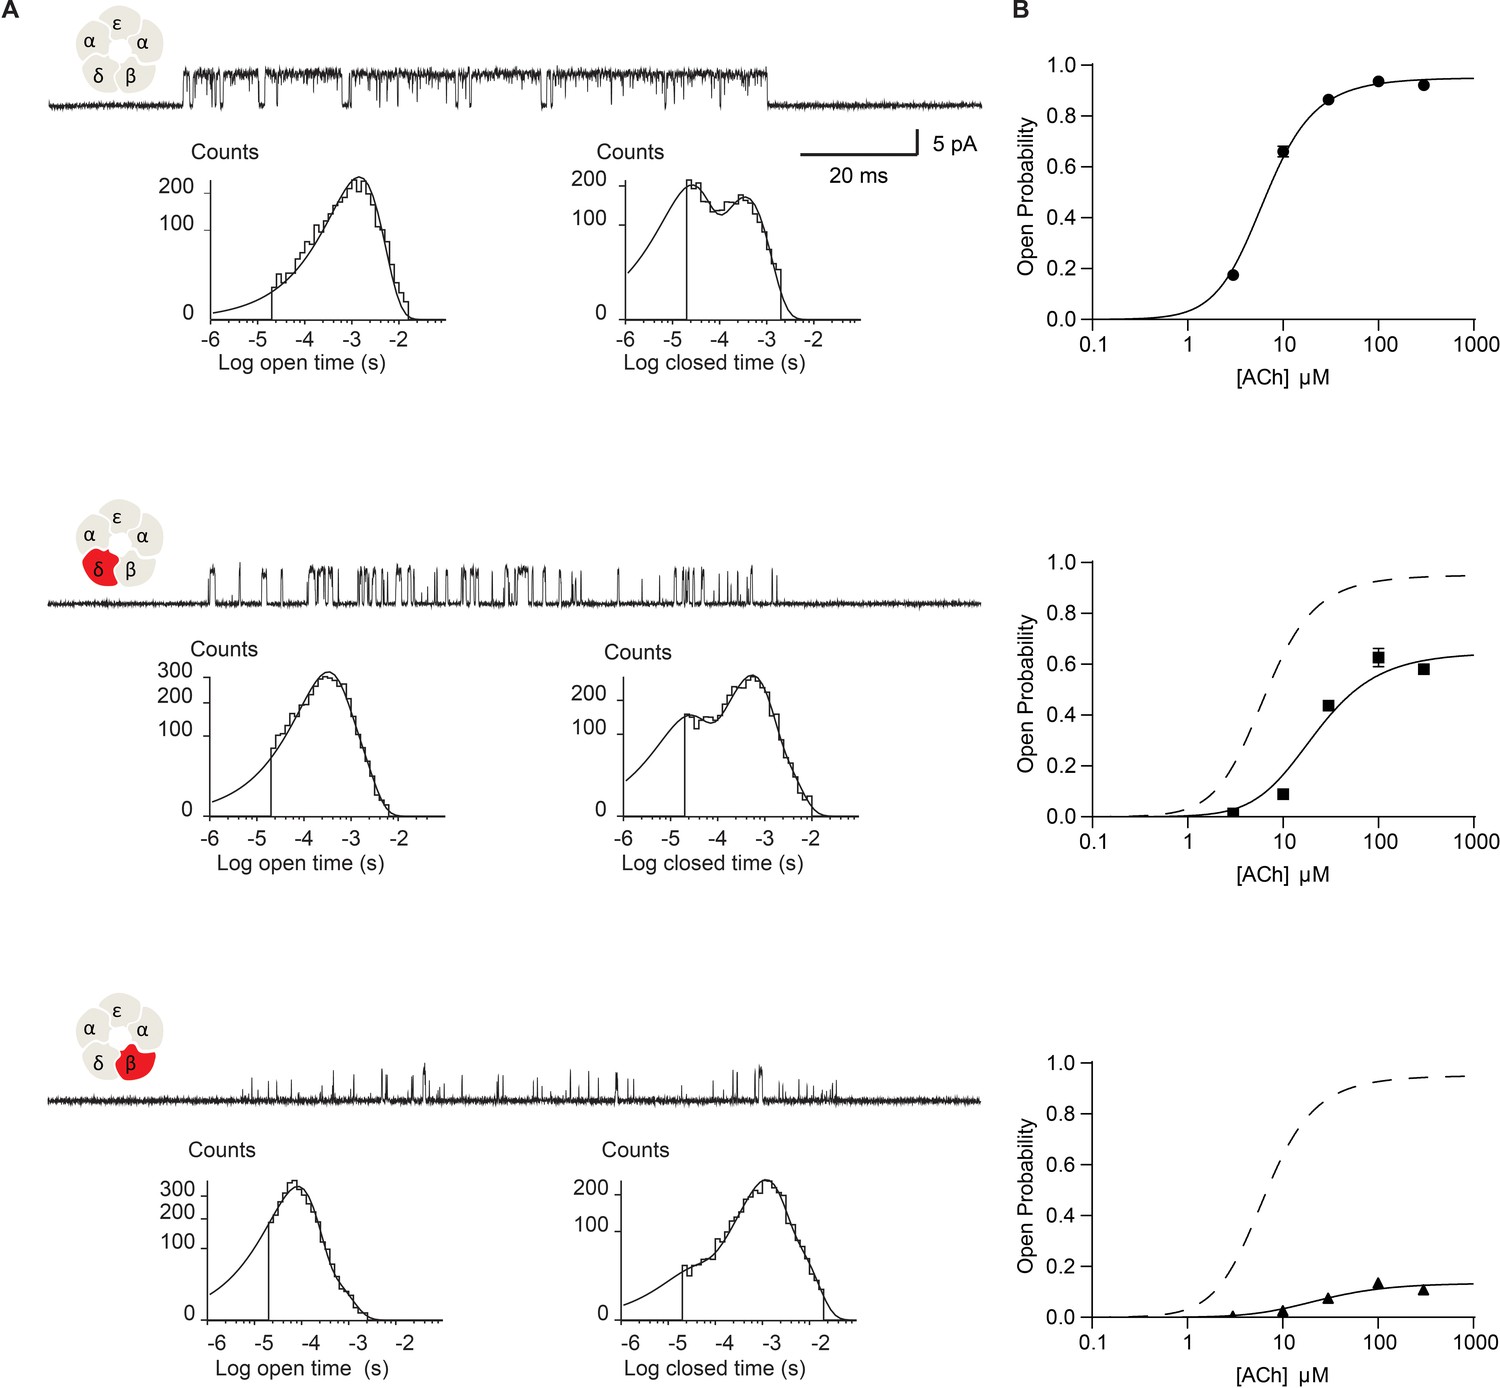
Disrupting the salt bridge impairs channel gating efficiency.
(A) Single channel currents and dwell time histograms from wild-type, β-DN, and δ-DN receptors recorded in the presence of 30 µM ACh and with an applied membrane potential of −70 mV. Channel openings are upward deflections from baseline. For each type of receptor, a cluster of openings from a single receptor channel is shown at a bandwidth of 10 kHz, along with dwell time histograms fitted by the sum of exponentials. Histograms are from a representative patch. Mean fits are given in Supplementary file 1c-e. (B) Corresponding plots of channel probability versus ACh concentration fitted by a simple sequential bind-bind-gate model with response function . Points represent the average open probability within clusters from three independent patches displayed with 95% confidence intervals.
-
Figure 2—source data 1
Open probability data for plots in Figure 2B.
- https://cdn.elifesciences.org/articles/66225/elife-66225-fig2-data1-v1.xlsx
Figure 2—figure supplement 1

Single channel dwell times and open probabilities of the α-DN and ε-DN receptor remain similar to wild type.
(A) Single channel currents and dwell time histograms from wild type, and single mutant DN receptors recorded in the presence of 30 µM ACh and with an applied membrane potential of −70 mV. Channel openings are upward deflections from baseline. For each type of receptor, a cluster of openings from a single receptor channel is shown at a bandwidth of 10 kHz, along with dwell time histograms fitted by the sum of exponentials. Histograms are from a representative patch. (B) Calculated open probabilities for the conditions in (A). Average value with 95% CI interval shown with individual points overlaid.
Figure 3
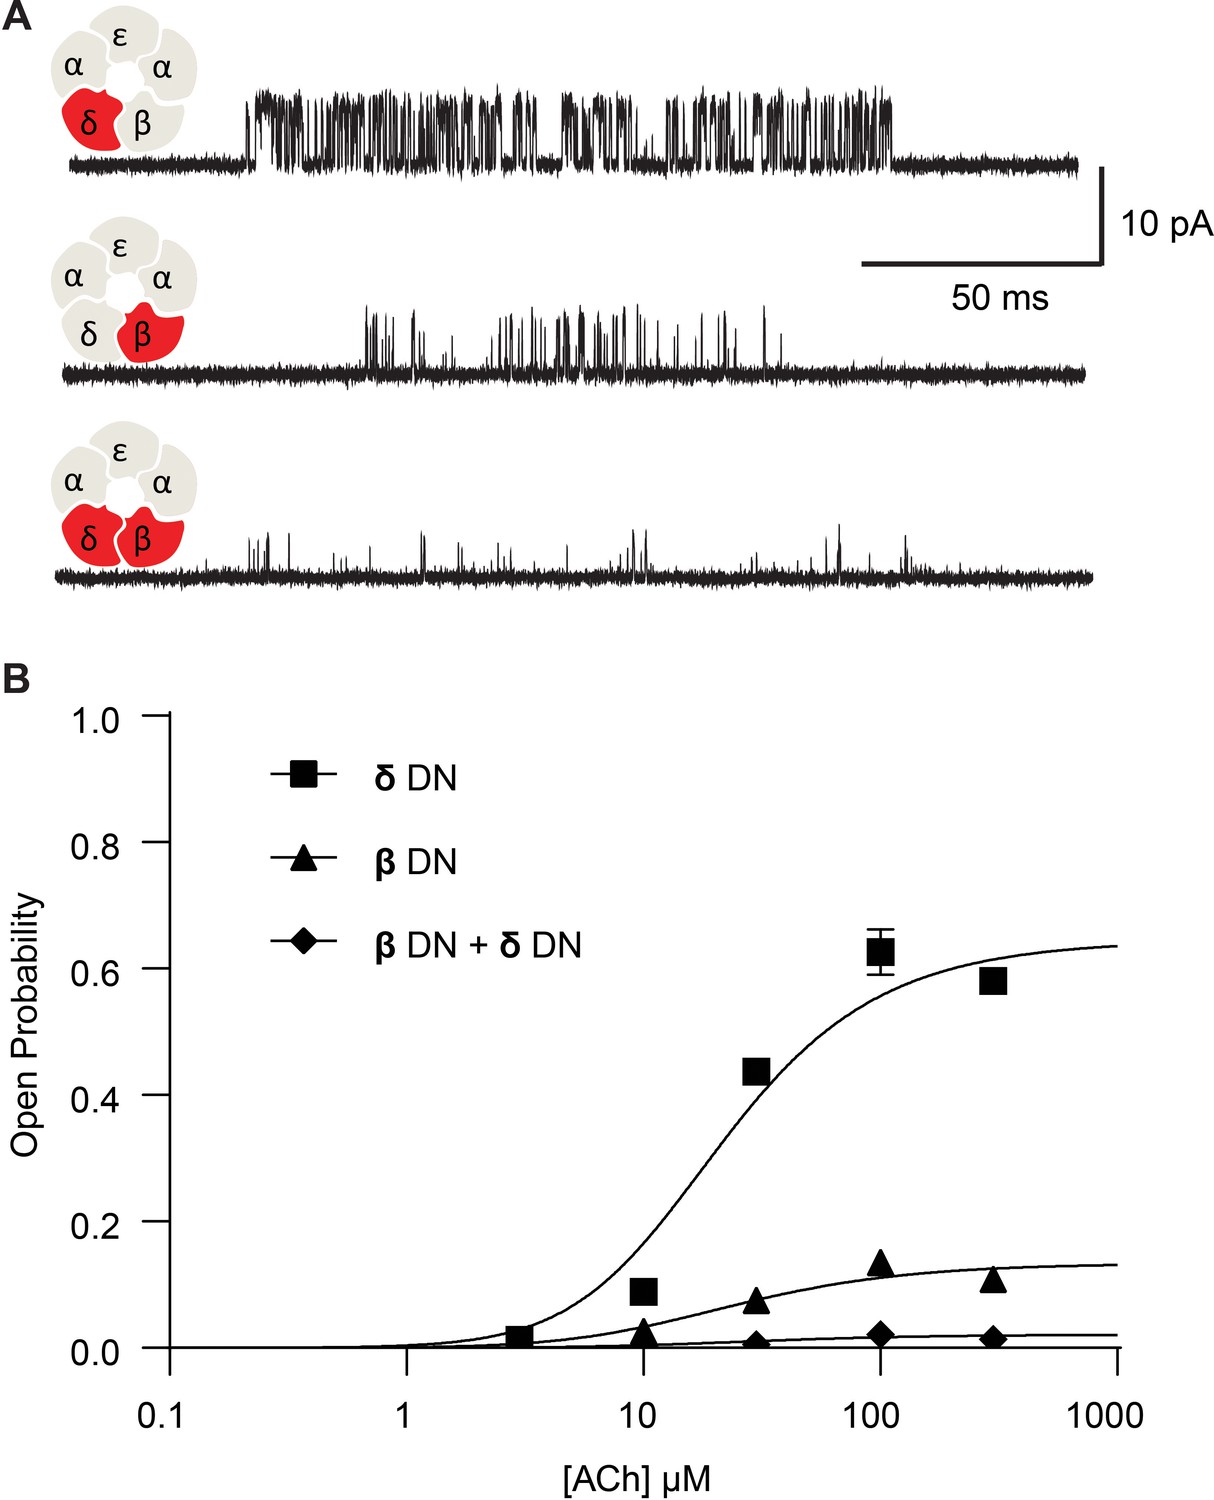
Channel gating efficiency depends on the number of mutant subunits.
(A) Single channel currents recorded from single and double DN mutant receptors in the presence of 300 µM ACh with applied membrane potential of −70 mV and bandwidth of 10 kHz. (B) Corresponding plots of channel open probability versus ACh concentration fitted by a simple sequential bind-bind-gate model with response function . Points represent the average open probability within clusters from three independent patches displayed with 95% confidence intervals.
-
Figure 3—source data 1
Open probability data for plots in Figure 3B.
- https://cdn.elifesciences.org/articles/66225/elife-66225-fig3-data1-v1.xlsx
Figure 4
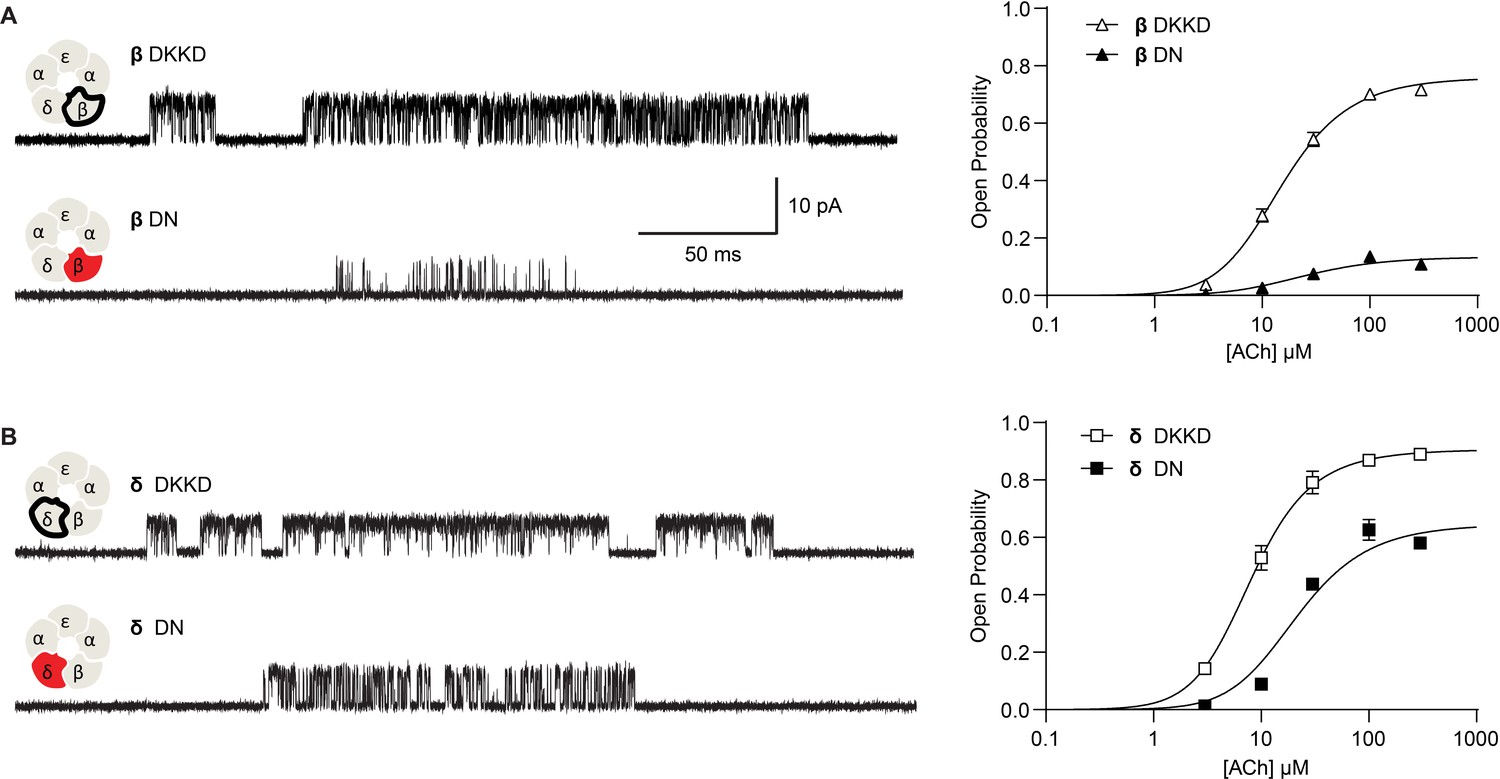
Reversing the charged residues of the salt bridge recovers wild-type-like channel gating.
(A) Single channel currents recorded from charge neutralized (DN) and charge reversed (DKKD) receptors in the presence of 300 µM ACh with an applied membrane potential of −70 mV and bandwidth of 10 kHz. (B) Corresponding plots of channel open probability versus ACh concentration fitted by a simple sequential bind-bind-gate model with response function . Points represent the average open probability within clusters from three independent patches displayed with 95% confidence intervals.
-
Figure 4—source data 1
Open probability data for plots in Figure 3A.
- https://cdn.elifesciences.org/articles/66225/elife-66225-fig4-data1-v1.xlsx
-
Figure 4—source data 2
Open probability data for plots in Figure 4B.
- https://cdn.elifesciences.org/articles/66225/elife-66225-fig4-data2-v1.xlsx
Figure 5

Disrupting the salt bridge diminishes the unitary current amplitude and increases open channel fluctuations.
Single channel currents and histograms of the digitized points from wild-type (A) and β-DN + δ-DN (B) receptors recorded in the presence of 30 µM ACh with an applied membrane potential of −70 mV and bandwidth of 10 kHz. Dashed line corresponds to the wild-type unitary current amplitude.
Figure 6 with 1 supplement
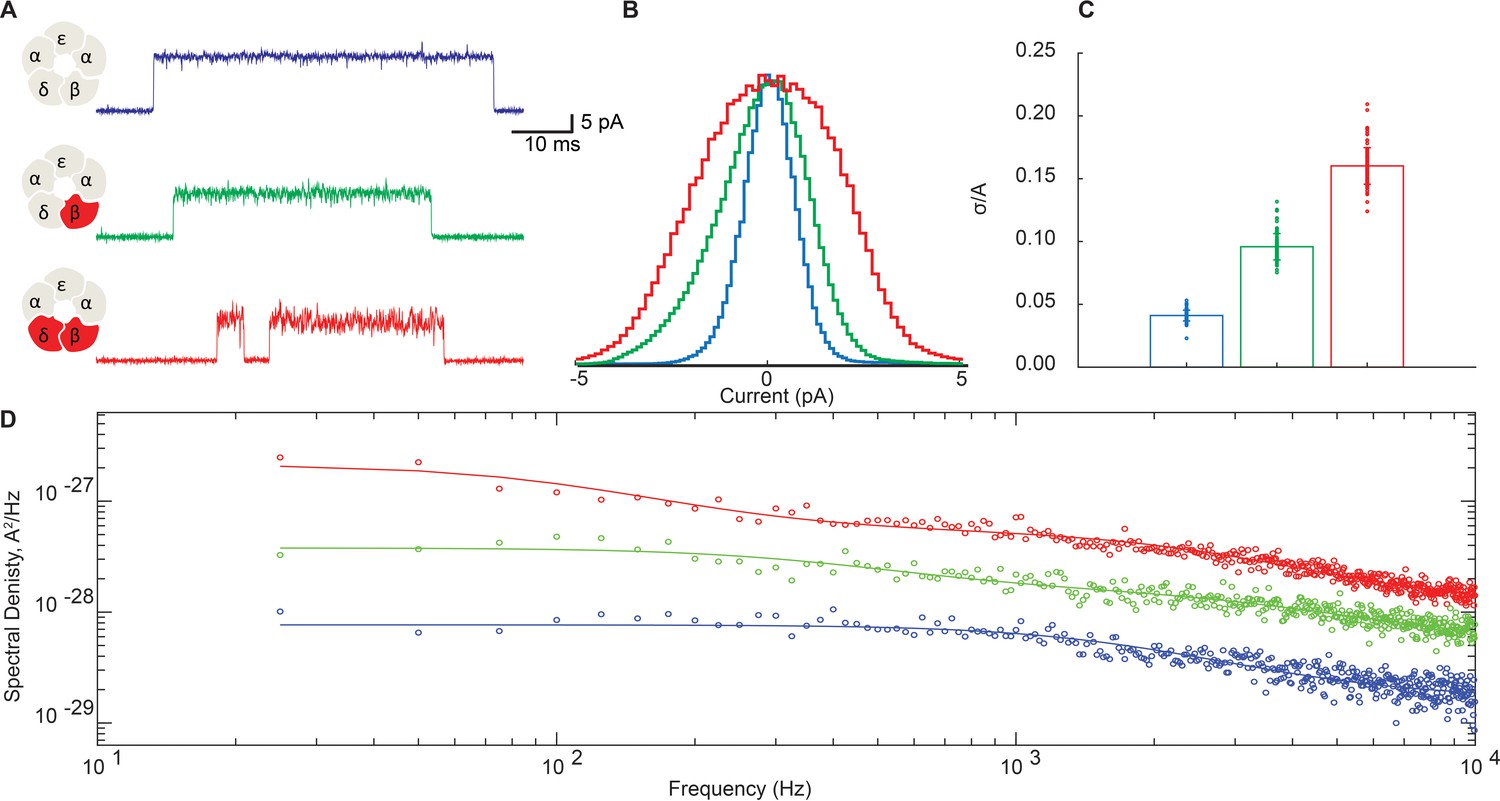
Disrupting the salt bridge increases both low- and high-frequency open channel current fluctuations.
(A) Representative channel openings from salt bridge intact and salt bridge disrupted DN receptors harboring the open time prolonging ε-T264P mutation in the presence of 100 nM ACh with a membrane potential of −120 mV and bandwidth of 10 kHz. (B) Corresponding histograms of open channel current constructed from digitized points from at least 50 open channel current stretches, displayed centered on the mode value. (C) Standard deviation of the open channel current relative to the open channel current amplitude. (D) Open channel power spectra computed as the average difference between open channel spectra and flanking baseline spectra calibrated according to the frequency response of the recording system (Figure 6—figure supplement 1). Each spectrum is fit by either a one or two component Lorentzian function plus a frequency-independent component.
-
Figure 6—source data 1
Open channel current values for histograms plotted in Figure 6B.
- https://cdn.elifesciences.org/articles/66225/elife-66225-fig6-data1-v1.xlsx
-
Figure 6—source data 2
Open channel standard deviation relative to channel amplitude plotted in Figure 6C.
- https://cdn.elifesciences.org/articles/66225/elife-66225-fig6-data2-v1.xlsx
Figure 6—figure supplement 1
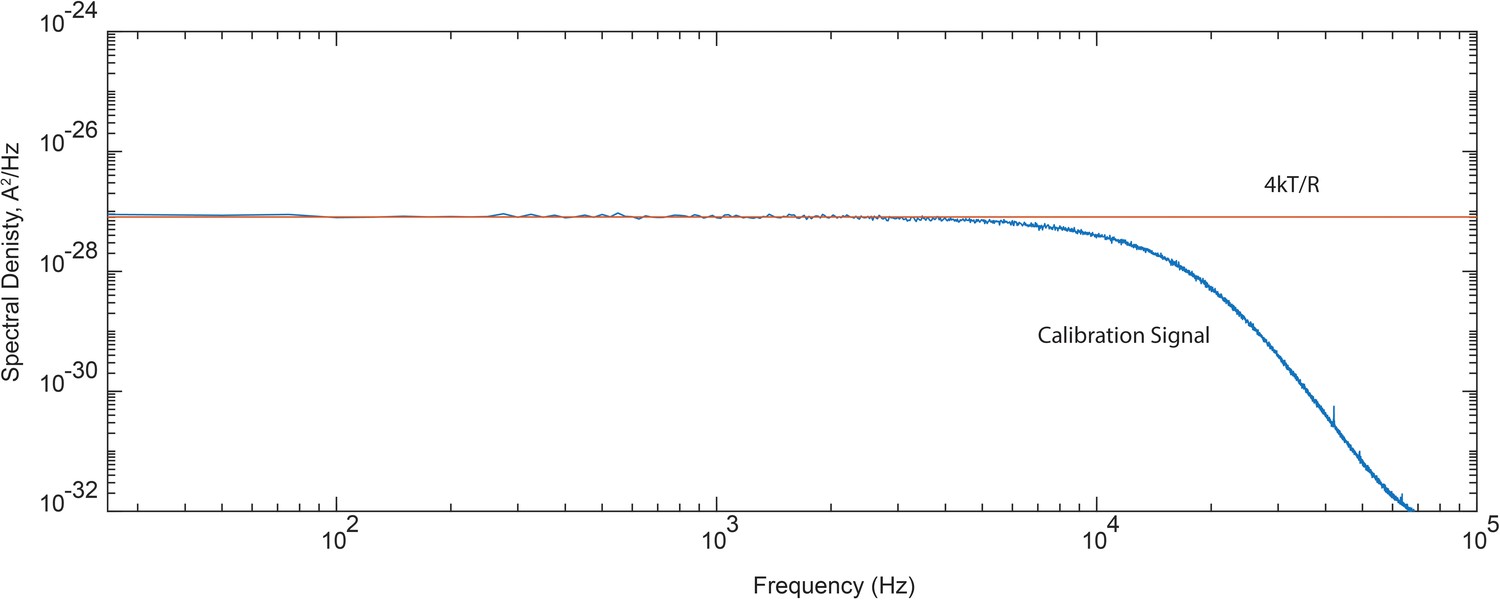
Frequency response of the recording system.
Spectral density of current recorded through a simple calibration circuit consisting of a series connection of capacitor (0.01 µF) and resistor (20 MΩ) relative to the predicted 4kT/R value. For calibration of the open channel current spectra, experimental power spectra were divided point-by-point to the normalized calibration signal displayed here.
Figure 7
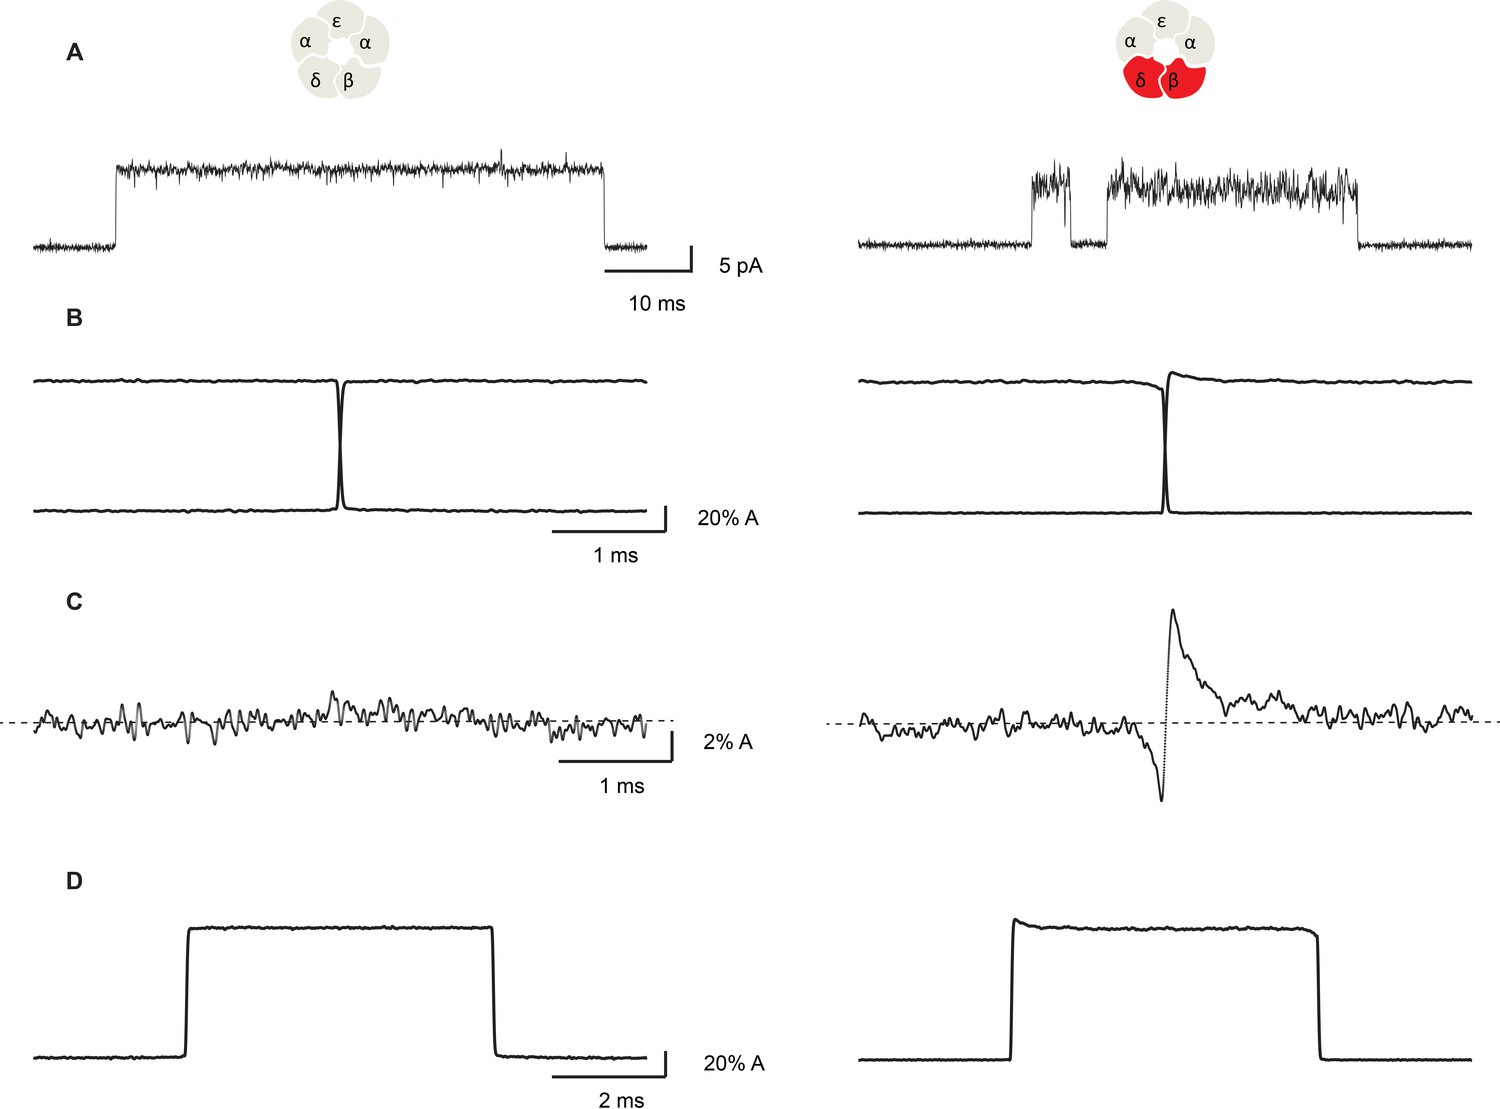
Open channel current fluctuations are coupled to channel gating in a salt bridge disrupted mutant receptor.
Representative single channel openings (A), average channel opening and closing transitions aligned at their midpoints (B), the sum of the averaged openings and closings (C), and the average unitary current pulse (D). For the salt bridge intact receptor, 695 opening and 722 closing transitions were analyzed. For the DN mutant, 1000 opening and 1004 closing transitions were analyzed. Recordings were obtained in the presence of 100 nM ACh with a membrane potential of −120 mV and a bandwidth of 10 kHz.
Figure 8 with 3 supplements
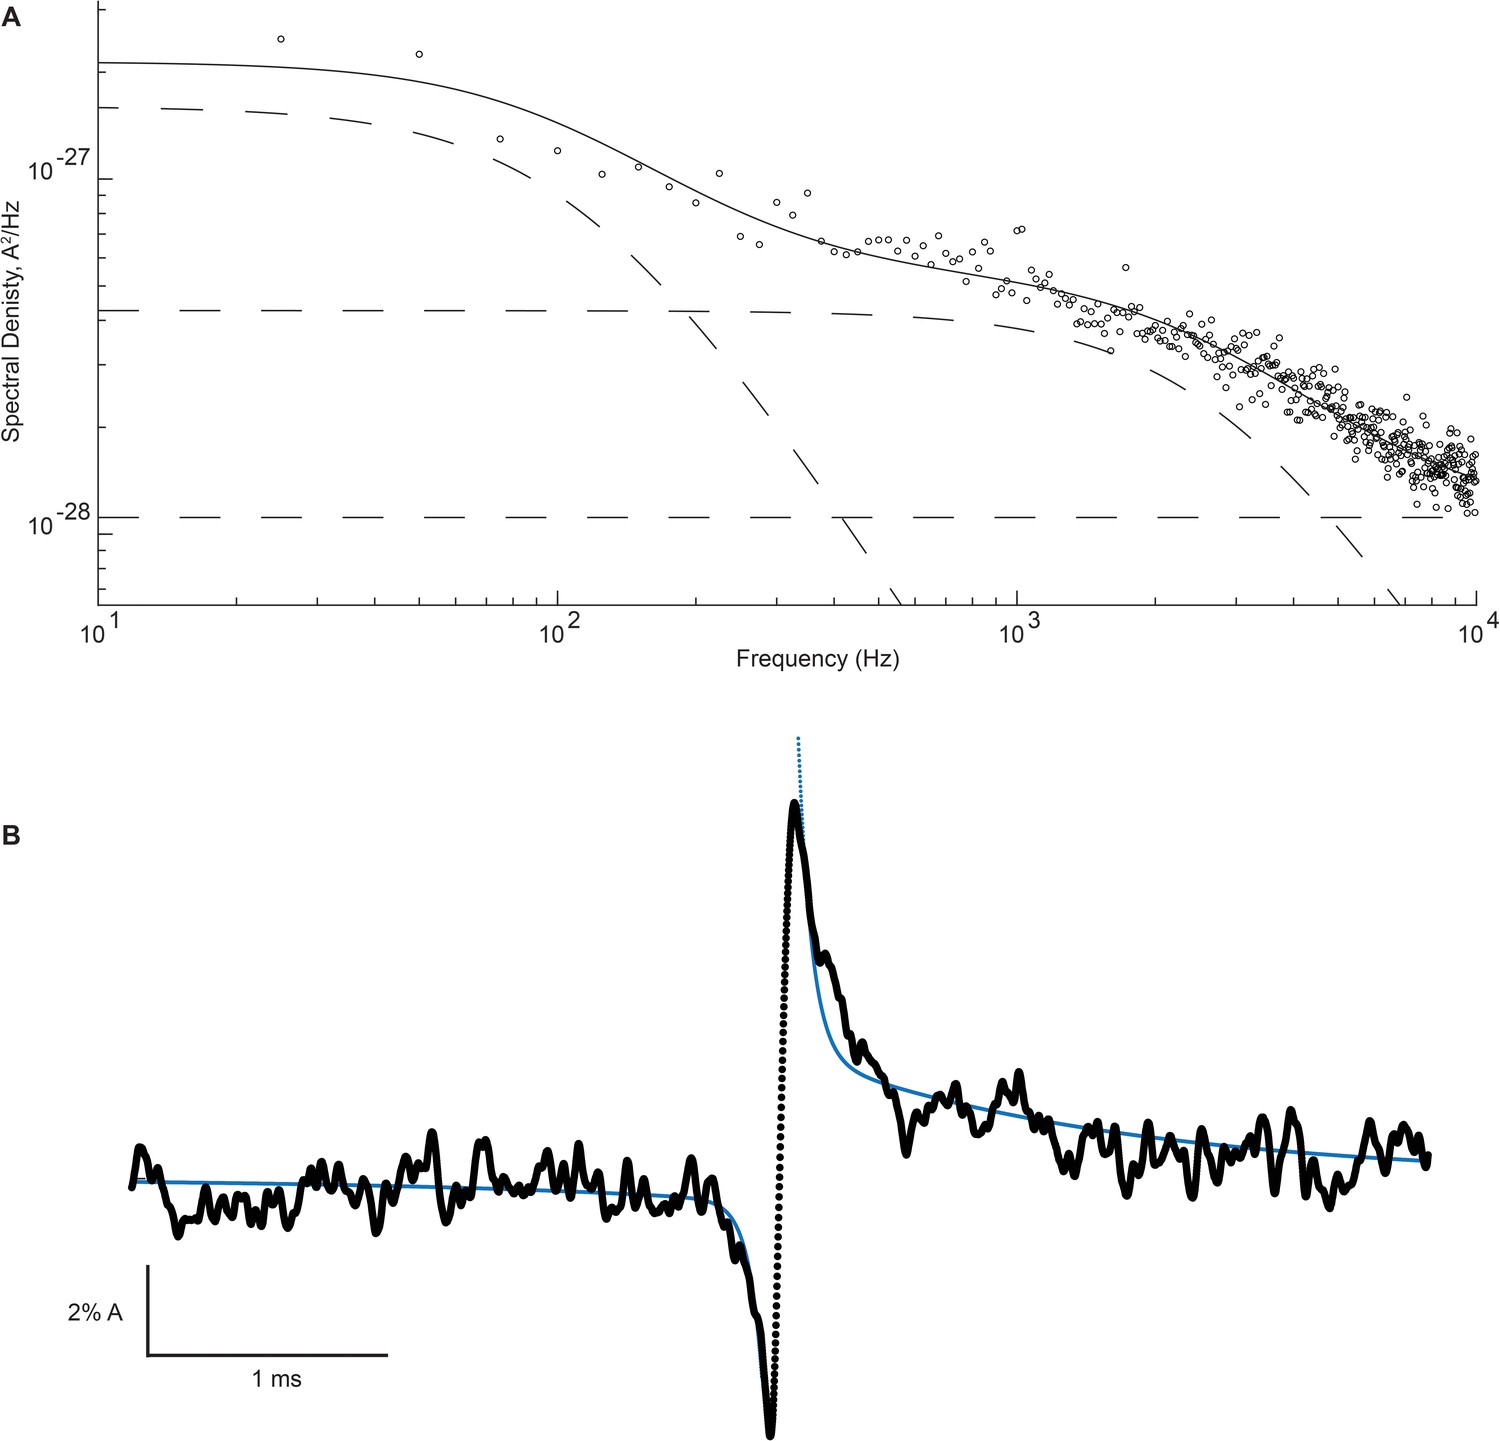
High- and low-frequency open channel current fluctuations are coupled to channel gating.
(A) Open channel power spectrum computed for the β-DN + δ-DN receptor. Individual components of the spectrum are shown as dashed lines. (B) Corresponding sum of averaged opening and closing transitions, as in Figure 7c. Smooth curves overlaid on the power spectra and the on and off gating relaxations are results from a simultaneous fit of Equations 1, A7, A8 to the respective data.
Figure 8—figure supplement 1
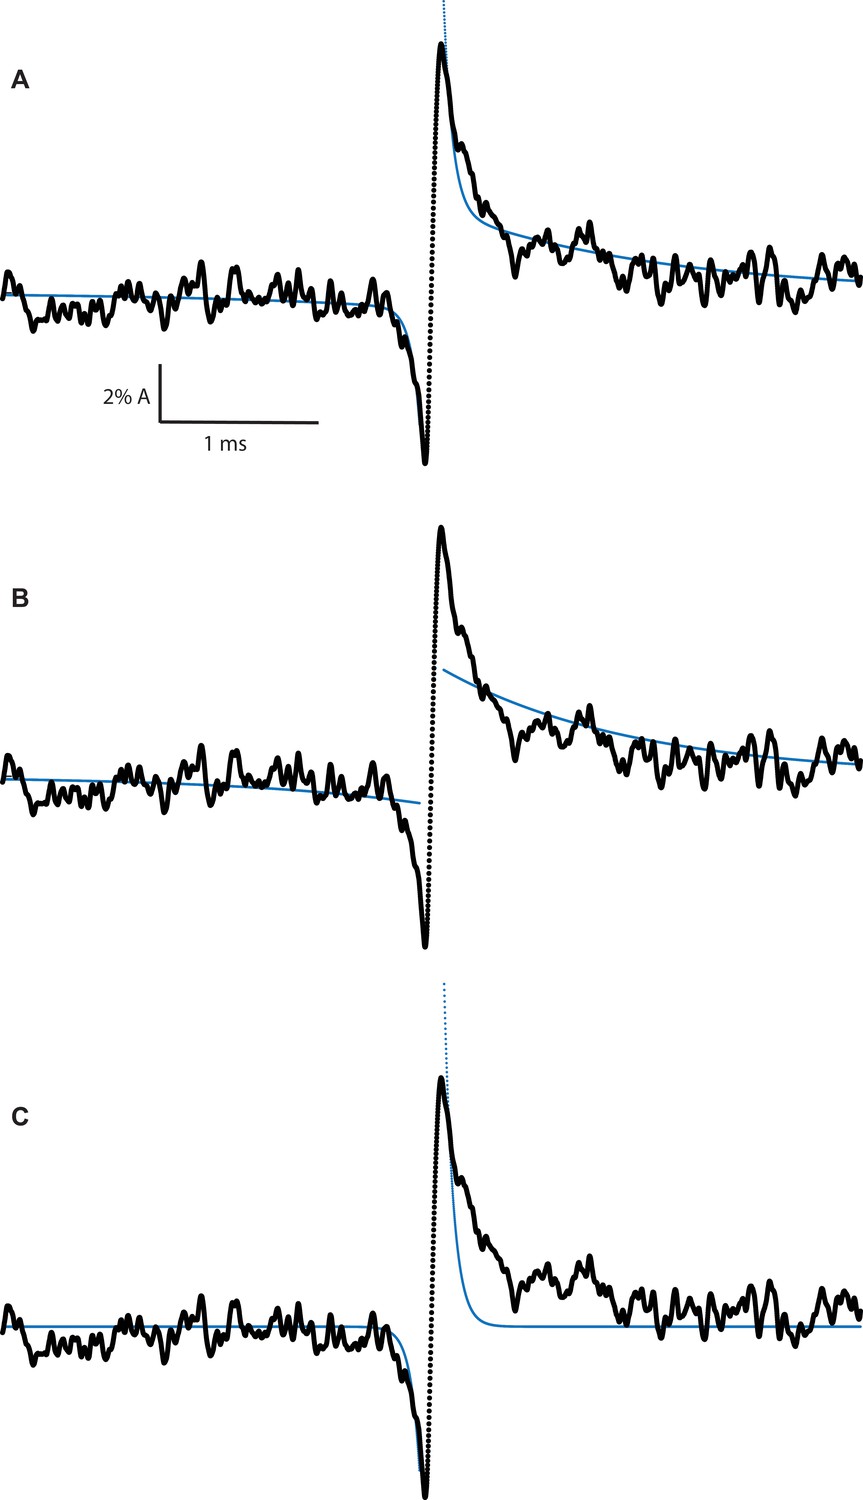
Correlation of slow and fast Lorentzian fluctuations required to fit experimental average transition profiles.
(A) β + δ DN average transition profile fit with both slow and fast Lorentzian fluctuations correlating with gating transition. (B) β + δ DN average transition profile fit with only slow Lorentzian fluctuations correlating with gating transition. (C) β + δ DN average transition profile fit with only fast Lorentzian fluctuations correlating with gating transition.
Figure 8—figure supplement 2

Coupling of ion permeation and gating replicated in three independent recordings.
Average on and off relaxations for three independent recordings of the β-DN + δ-DN receptor shown separately (A) and overlaid (B). Fitted relaxation amplitudes are provided in (C) and displayed in table below. The number of transitions averaged per recording were 1004, 512, 544, respectively.
Figure 8—figure supplement 3
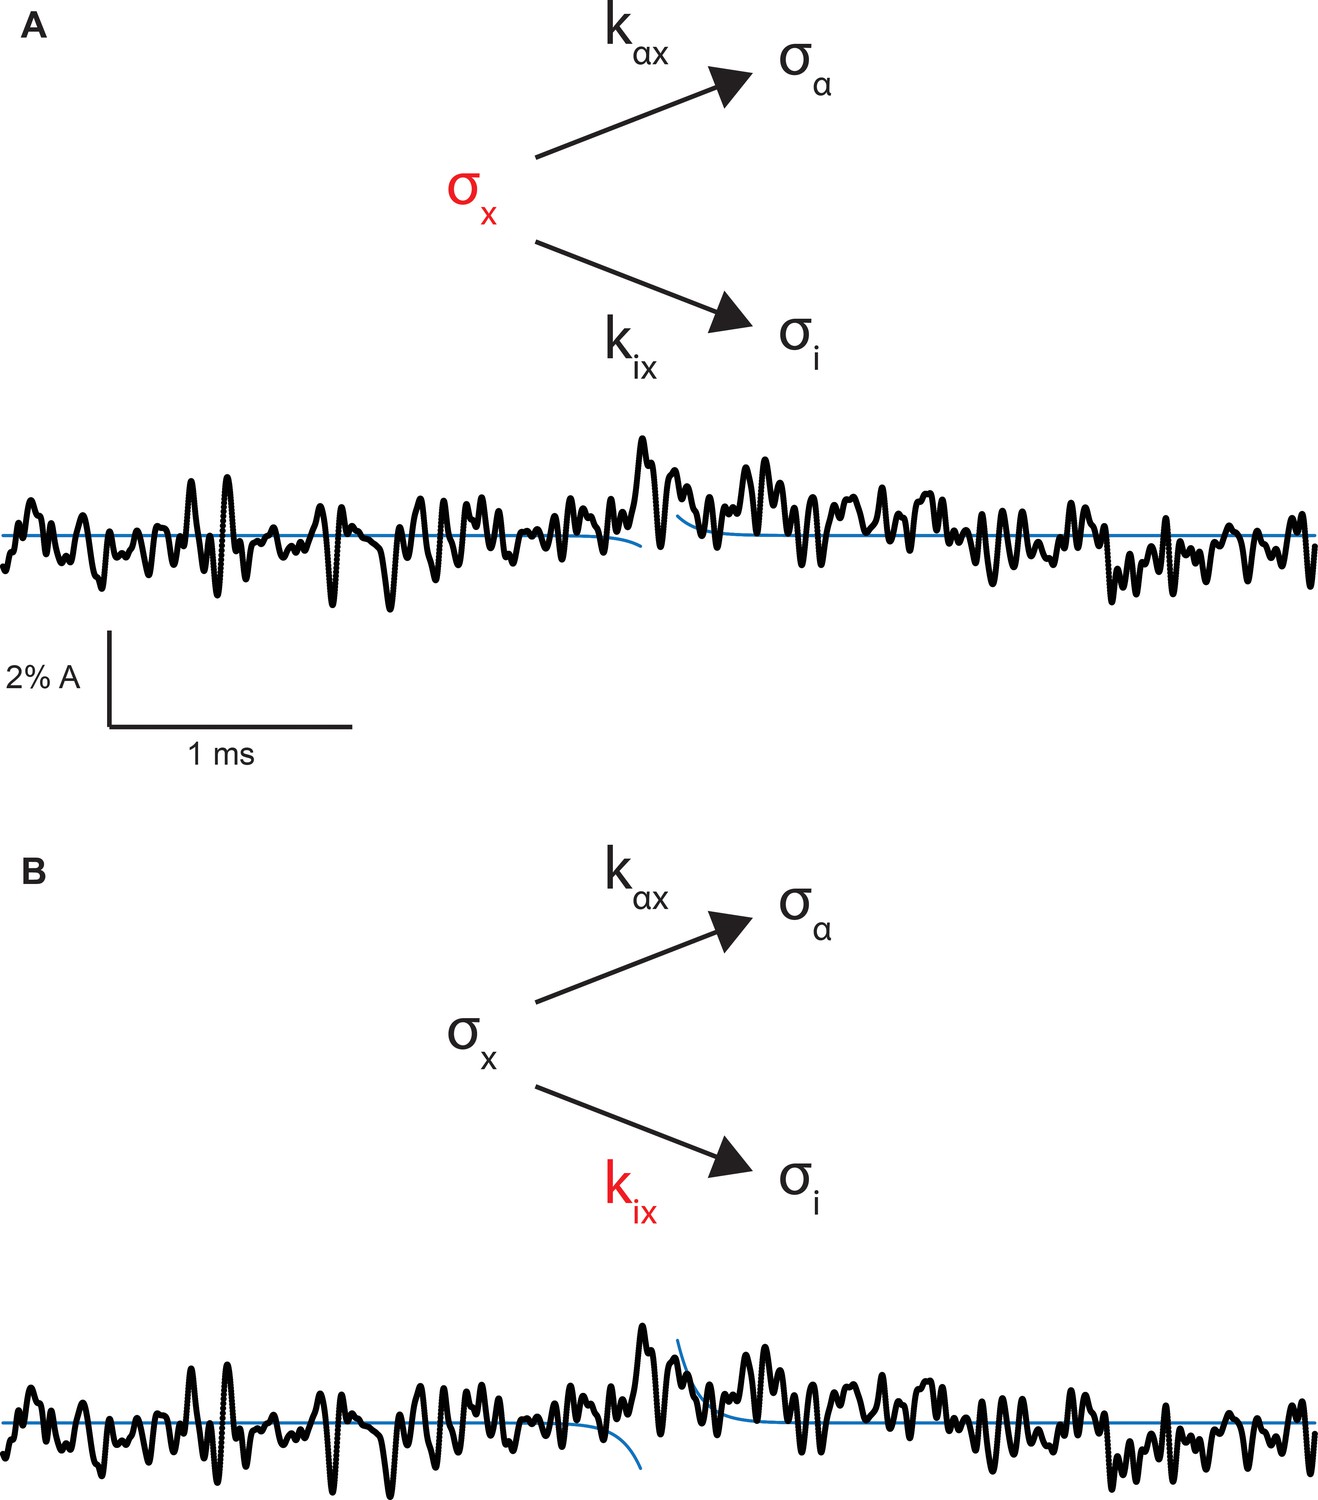
Hypothetical on and off gating relaxations for the salt bridge intact receptor.
(A) Wild-type on and off relaxations for the case in which the mutation affects σx, determined according to Equation 4 from main text, overlaid on the experimental average open profile from Figure 7c. (B) Wild-type on and off relaxations for the case in which the mutation affects kix, determined according to Equation 5 from main text, overlaid on the experimental average open profile from Figure 7c.
Figure 9
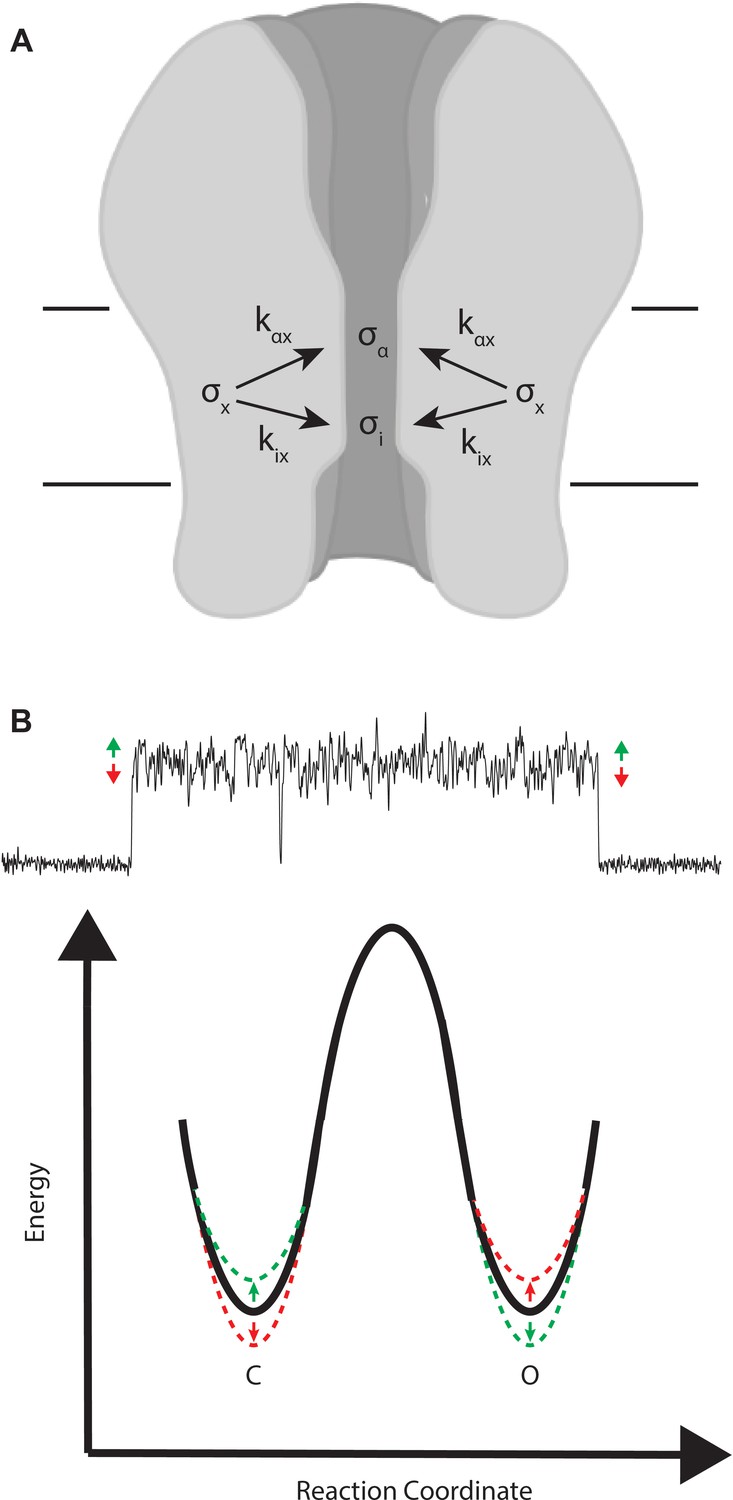
Mechanistic interpretation of coupling between ion flow and channel gating.
(A) Schematic showing the impact of motion x on ion flow and channel gating. (B) Motions correlated with increased ion flow increase the rate of channel opening and slow the rate of channel closing (green). Motions correlated with reduced ion flow, slow the rate of channel opening, and increase the rate of channel closing (red).
Additional files
-
Supplementary file 1
Fitted binding and gating parameters and event lifetime summaries for wild-type and DN receptors.
(A) Binding and gating equilibrium constants for the wild-type and salt bridge mutated (DN) receptors. Constants determined by fitting of the open probability data to a sequential bind-bind-gate mechanism. Open probability data and fits shown in Figure 2 in main text. (B) Binding and gating equilibrium constants for β-DN + δ-DN and charge exchanged DKKD receptors. Constants determined by fitting of the open probability data to a sequential bind-bind-gate mechanism. Open probability data and fits shown in Figures 3 and 4 in main text. (C) Average dwell time component weights (W) and time constants (T) of the wild-type muscle receptor at 3, 10, 30, 100, 300 µM [ACh]. Values are averages of three independent recordings with the corresponding standard deviation (SD). (D) Average dwell time component weights (W) and time constants (T) of the β-DN receptor at 3, 10, 30, 100, 300 µM [ACh]. Values are averages of three independent recordings with the corresponding standard deviation (SD). (E) Average dwell time component weights (W) and time constants (T) of the δ-DN receptor at 3, 10, 30, 100, 300 µM [ACh]. Values are averages of three independent recordings with the corresponding standard deviation (SD). (F) Average dwell time component weights (W) and time constants (T) of the beta- + delta- DN receptor at 3, 10, 30, 100, 300 µM [ACh]. Values are averages of three independent recordings with the corresponding standard deviation (SD). (G) Average dwell time component weights (W) and time constants (T) for the δ-DKKD receptor at 3, 10, 30, 100, 300 µM [ACh]. Values are averages of three independent recordings with the corresponding standard deviation (SD). (H) Average dwell time component weights (W) and time constants (T) of the β-DKKD receptor at 3, 10, 30, 100, 300 µM [ACh]. Values are averages of three independent recordings with the corresponding standard deviation (SD).
- https://cdn.elifesciences.org/articles/66225/elife-66225-supp1-v1.docx
-
Supplementary file 2
Power spectra and gating relaxation fits for salt bridge intact and DN receptors.
(A) Frequency and magnitude of open channel current fluctuations in wild type and DN receptors. , , , , determined from least squares fit of Equation 1 in main text to open channel current power spectra. SD/A indicates open channel current standard deviation relative to channel amplitude. Spread is shown as 95% confidence or standard deviation as indicated in table. Fits obtained from the average spectrum of at least 50 open channel segments with baseline spectra subtracted. (B) Power spectra and open channel current relaxations of the β-DN + δ-DN receptor. Best fit parameters obtained from simultaneous least squares fit of Equation 1 from main text, Equations A7 and A8 to the power spectrum and open channel current relaxations for the β-DN + δ-DN receptor.
- https://cdn.elifesciences.org/articles/66225/elife-66225-supp2-v1.docx
-
Transparent reporting form
- https://cdn.elifesciences.org/articles/66225/elife-66225-transrepform-v1.docx
Download links
A two-part list of links to download the article, or parts of the article, in various formats.
Downloads (link to download the article as PDF)
Open citations (links to open the citations from this article in various online reference manager services)
Cite this article (links to download the citations from this article in formats compatible with various reference manager tools)
Unmasking coupling between channel gating and ion permeation in the muscle nicotinic receptor
eLife 10:e66225.
https://doi.org/10.7554/eLife.66225


