Structural basis for allosteric control of the SERCA-Phospholamban membrane complex by Ca2+ and phosphorylation
- Department of Biochemistry, Molecular Biology and Biophysics, University of Minnesota, United States
- Department of Chemistry, University of Minnesota, United States
- Department of Life Sciences, Imperial College London, South Kensington, United Kingdom
- Department of Pharmacy, University of Naples 'Federico II', Italy
Figures
Figure 1 with 4 supplements
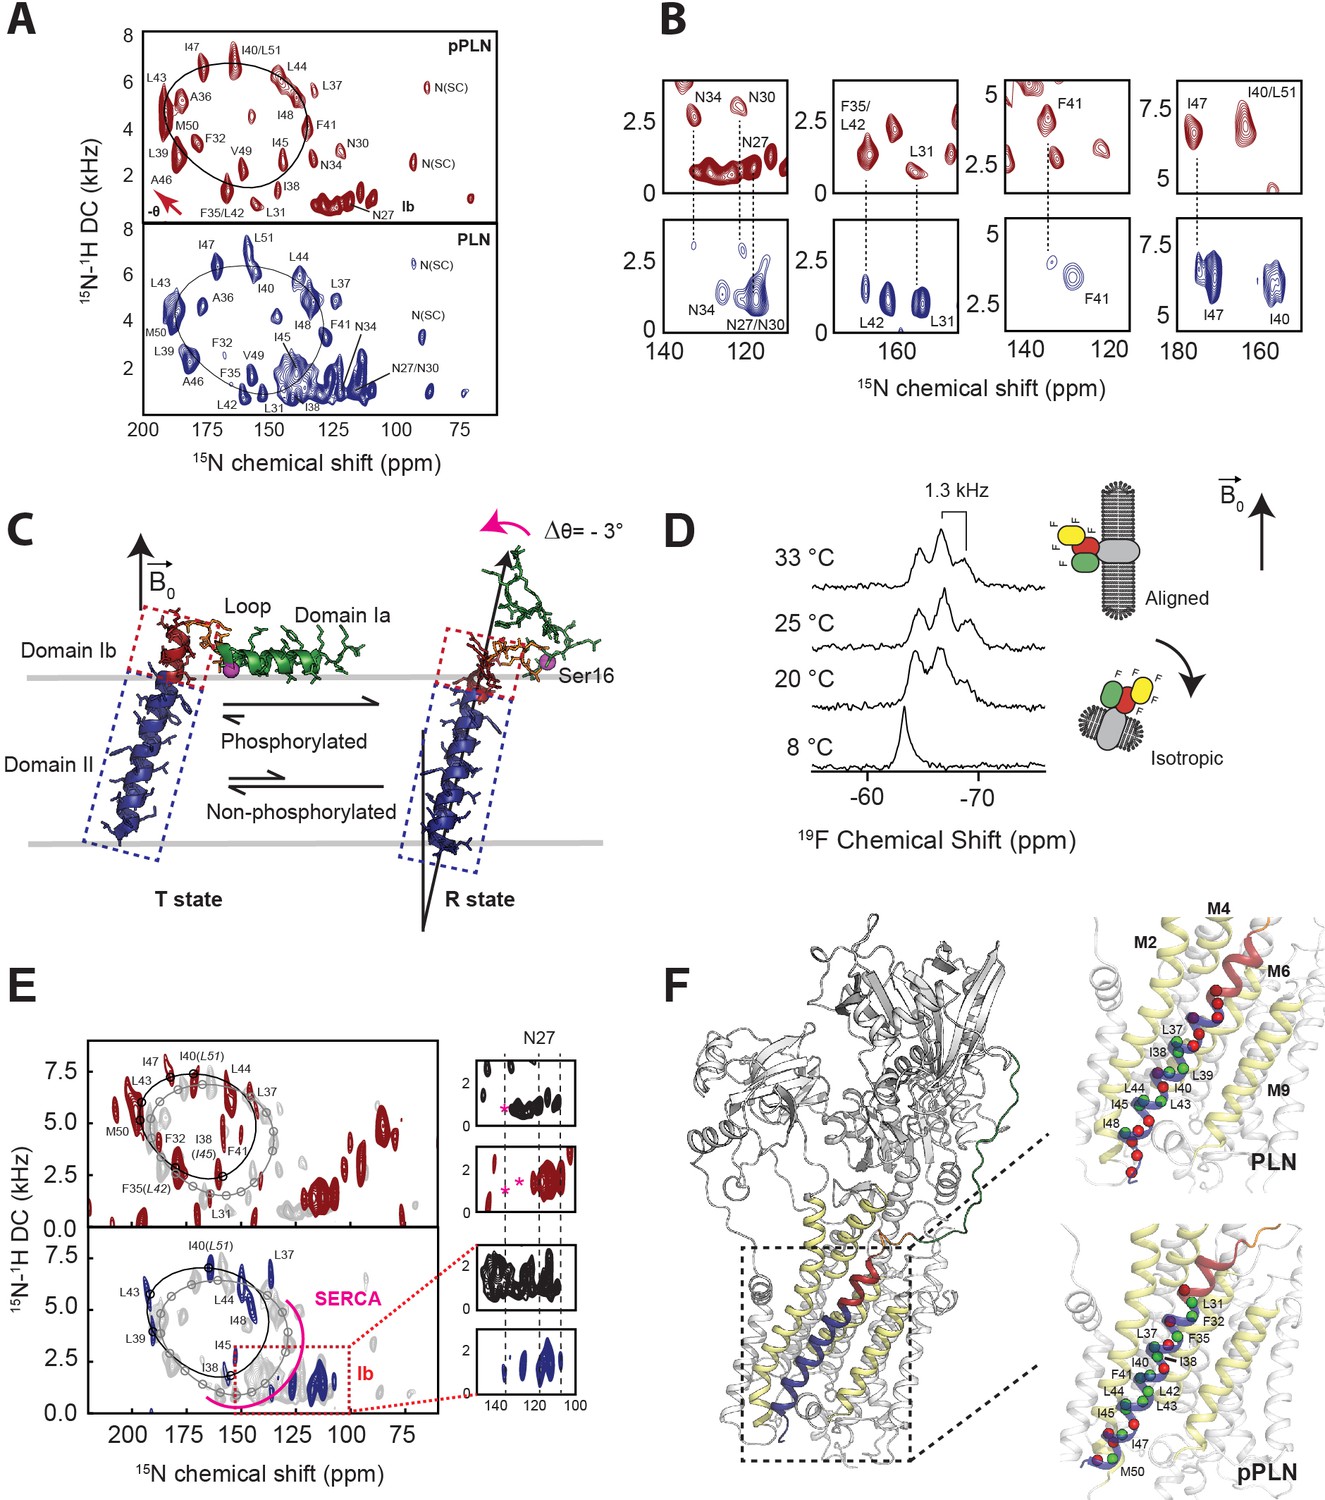
Topological equilibrium of PLN and pPLN free and bound to SERCA in lipid bilayers detected by OS-ssNMR.
(A) 2D [15N-1H] SE-SAMPI4 spectra of PLN and pPLN reconstituted into aligned lipid bicelles. The fitting of resonance patterns with PISA wheels for an ideal helix [(ϕ, ψ)=(−63°, −42°)] is superimposed. (B) Expanded regions of PLN 15N-labeled at N, L, F, or I residues (lower panel, blue contours) showing two populations. The upper panels (red) are the corresponding regions for the U-15N labeled pPLN. U-15N labeled spectra were acquired at higher signal-to-noise to observe the second population. (C) Structures of the T (PDB 2KB7 Traaseth et al., 2009) and R (PDB 2LPF De Simone et al., 2013) states for PLN. (D) 19F NMR spectra of TFMB-tagged SERCA reconstituted into anisotropic (q = 4) bicelles at variable temperatures. (E) 2D [15N-1H] SE-SAMPI4 spectra of uniformly 15N labeled PLN (blue, lower panel) and pPLN (red, upper panel) bound to SERCA in the absence of Ca2+ (E2 state). Spectra are overlaid with PLN or pPLN in their free forms (gray). PISA wheels are overlaid, showing assigned residues (black points) used to fit helical tilt and rotation angles. Ambiguous assignments are shown in parentheses. The region corresponding to domain Ib is expanded to show peak broadening (asterisk) following the transition of PLN's cytoplasmic region to the B state. (F) Selected structure of the SERCA/PLN complex. Expanded region shows visible (green spheres, labeled) and broadened (red spheres) residues mapped onto domain II of PLN and pPLN in complex with SERCA.
Figure 1—figure supplement 1
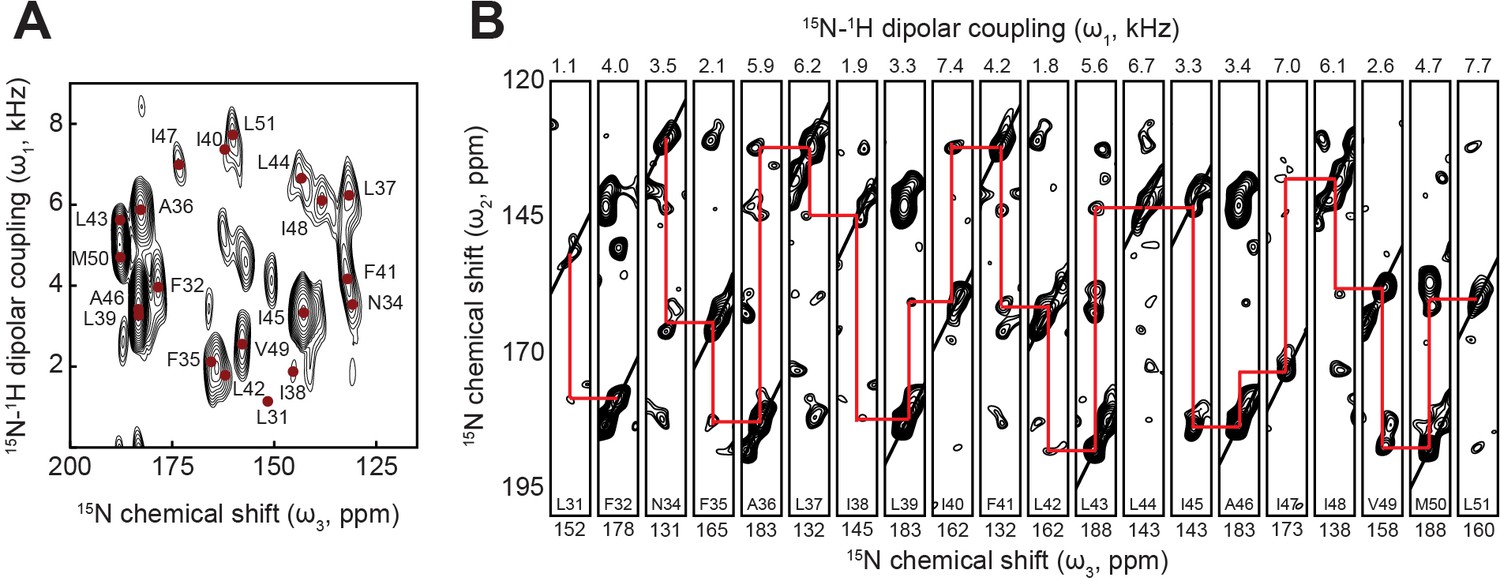
Assignment by 3D OS-ssNMR.
(A) 2D projection and (B) strip plot of [15N-15N-1H] 3D SE-SAMPI4-PDSD spectrum of pPLN in bicelles showing sequential 15N-15N correlations.
Figure 1—figure supplement 2
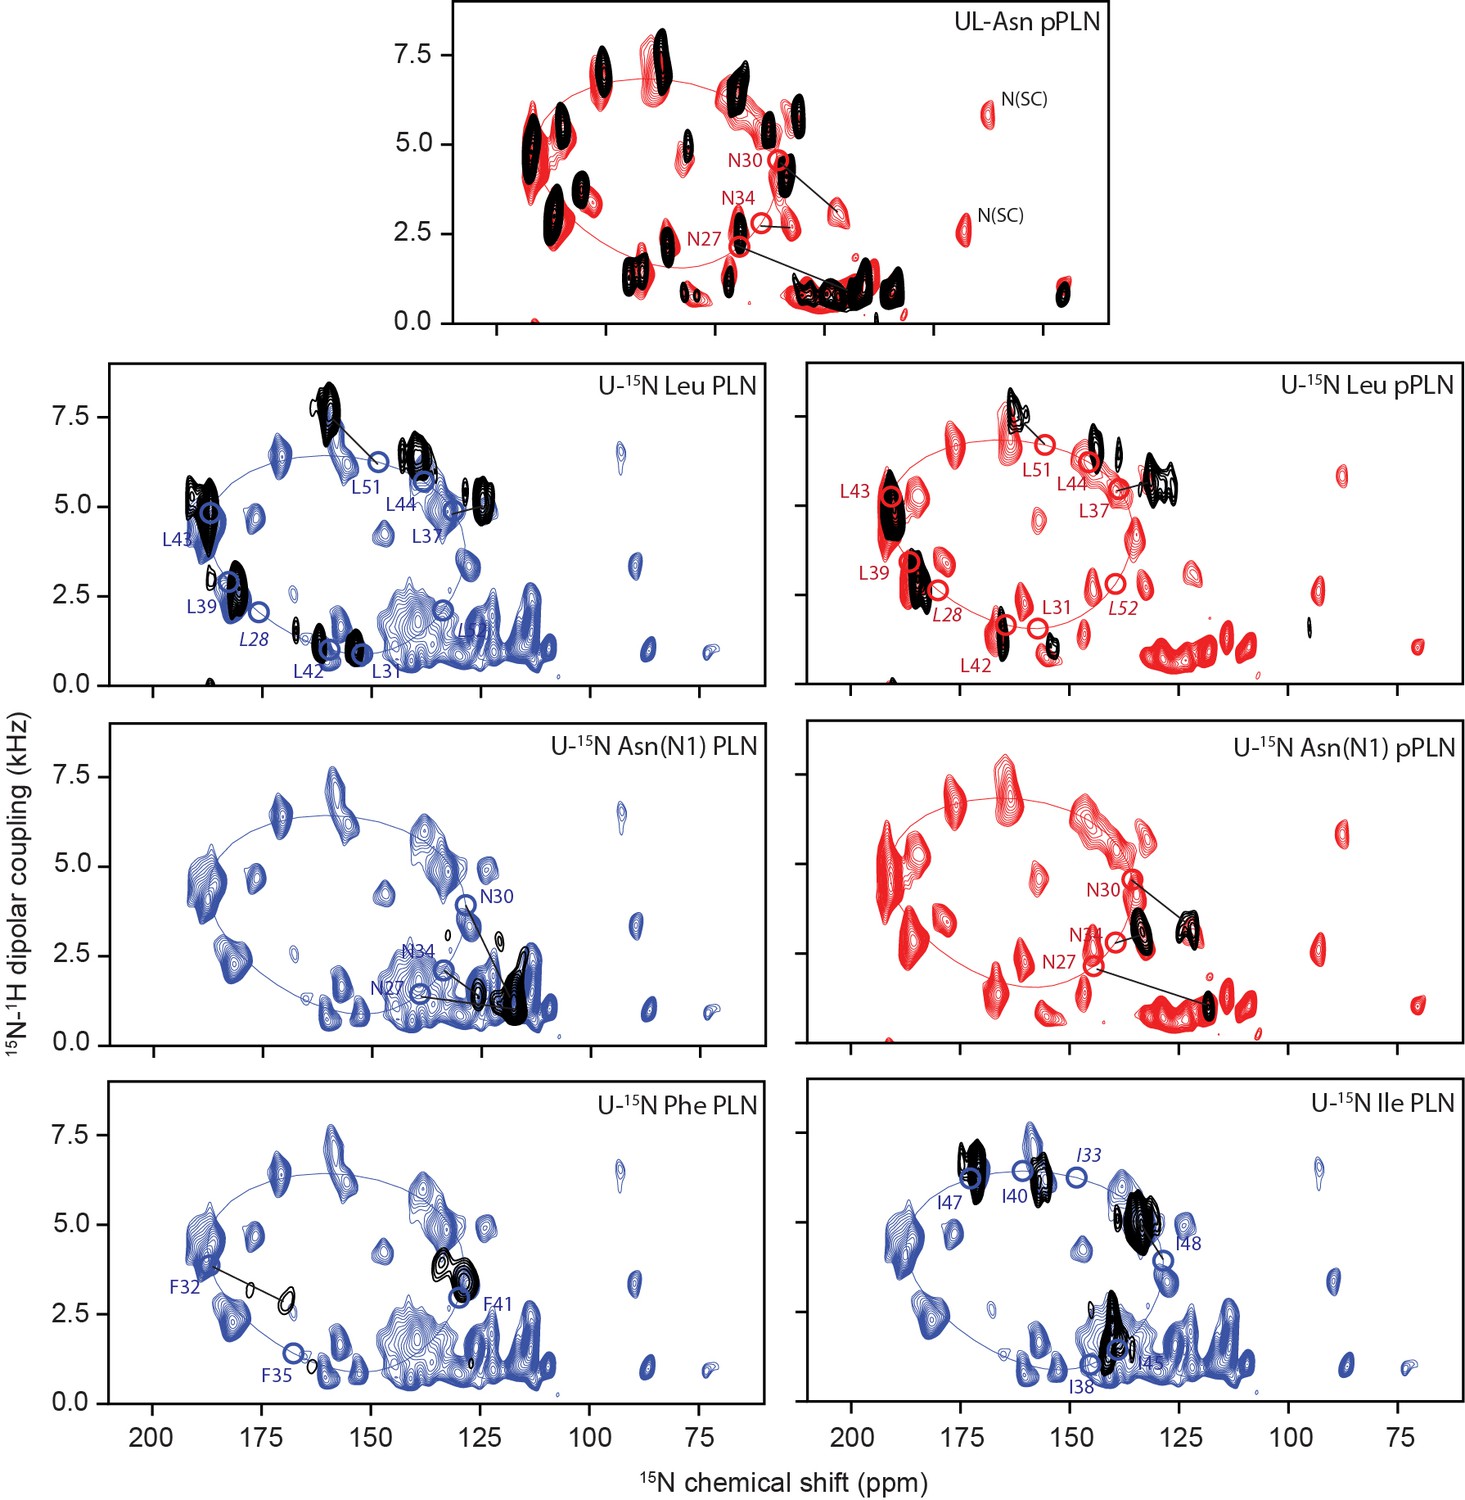
Assignment of OS-ssNMR spectra by selective labeling and un-labeling experiments.
2D [15N-1H] SE-SAMPI4 spectra of uniformly 15N-labeled PLN (blue) and pPLN (red) overlaid with recombinant residue-specific uniformly labeled (U) and uniformly unlabeled (UL) preparations (black). Circles indicate theoretical peak positions based on PISA fitting and labels in italics are residues missing from experimental spectra.
Figure 1—figure supplement 3
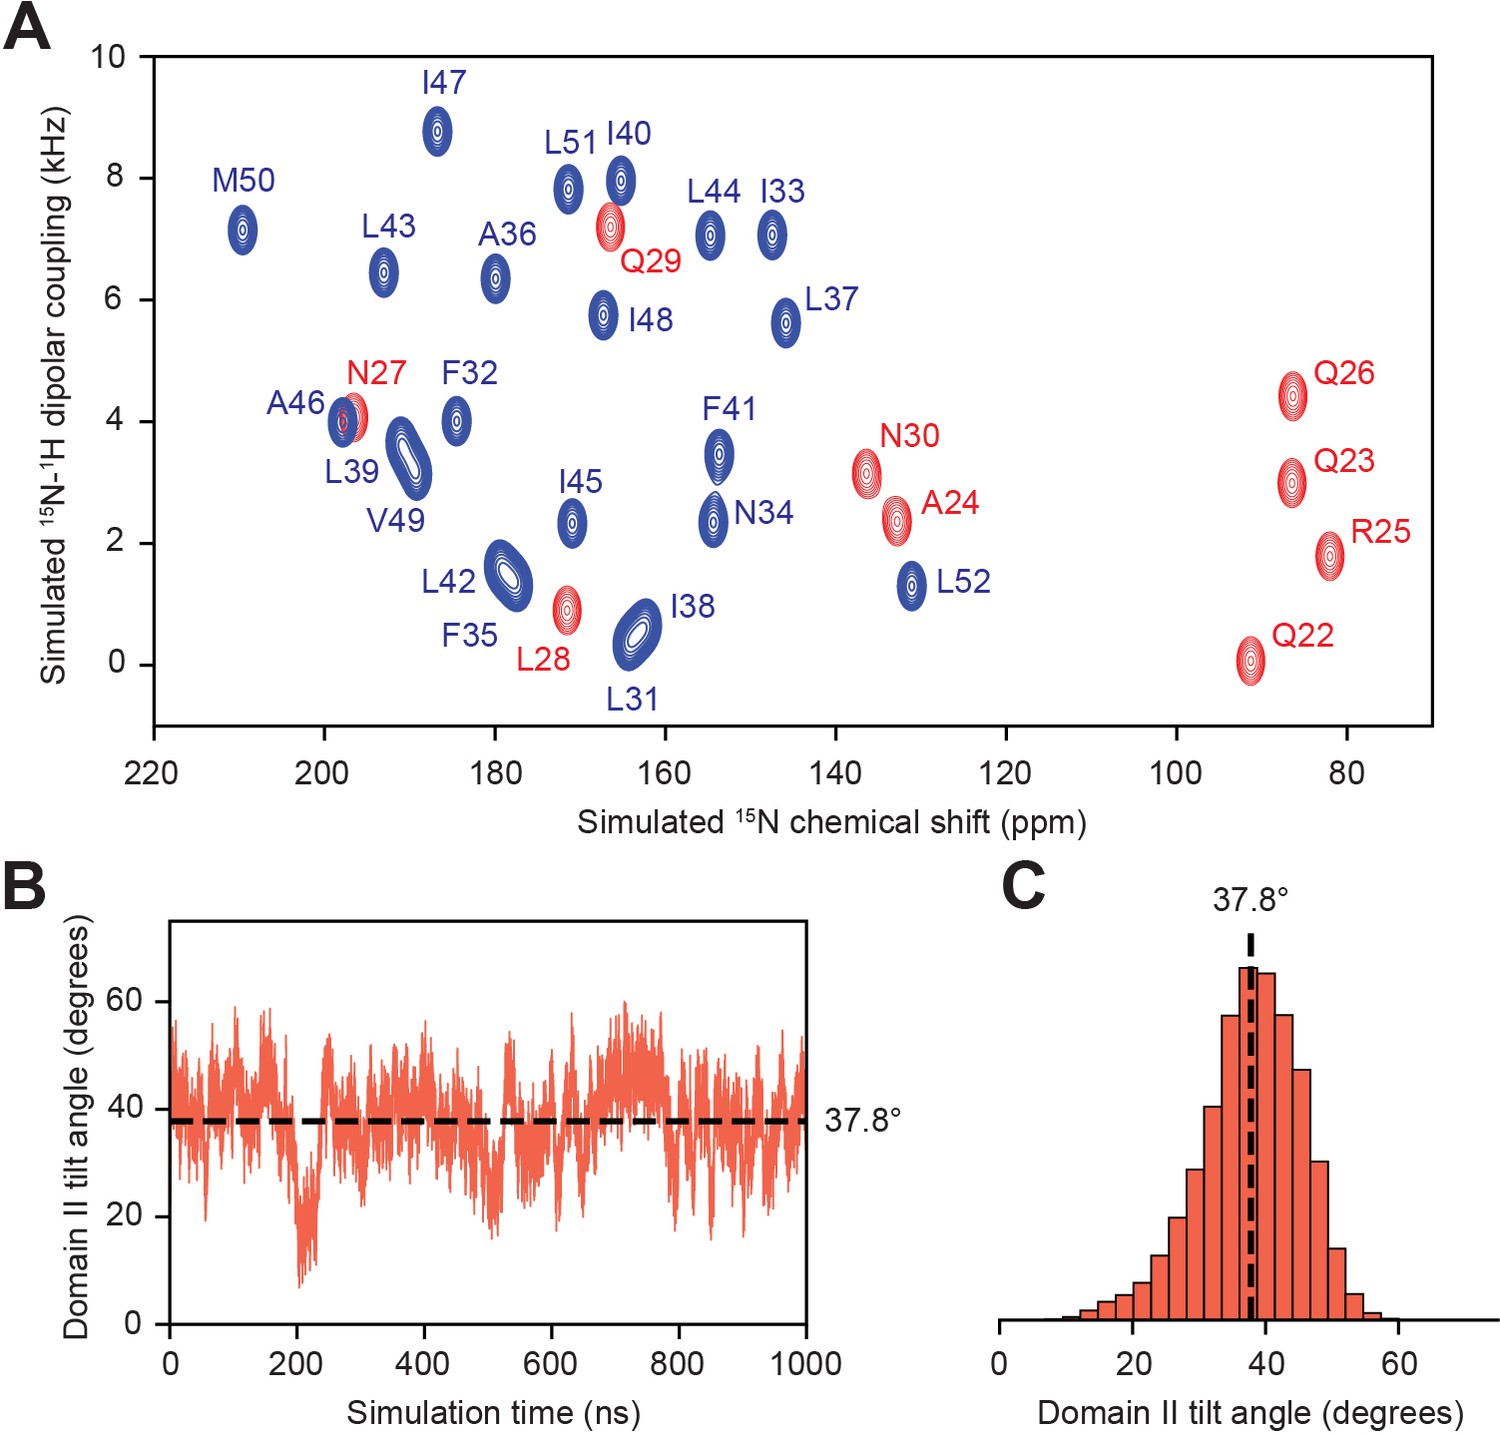
Prediction of assignments from unrestrained MD simulation of truncated PLN.
(A) Back-calculated SLF spectrum of domain Ib (red) and II (blue) residues computed as previously described (Weber and Veglia, 2020). (B) PLN domain II tilt angle throughout the simulation and (C) the corresponding histogram.
Figure 1—figure supplement 4
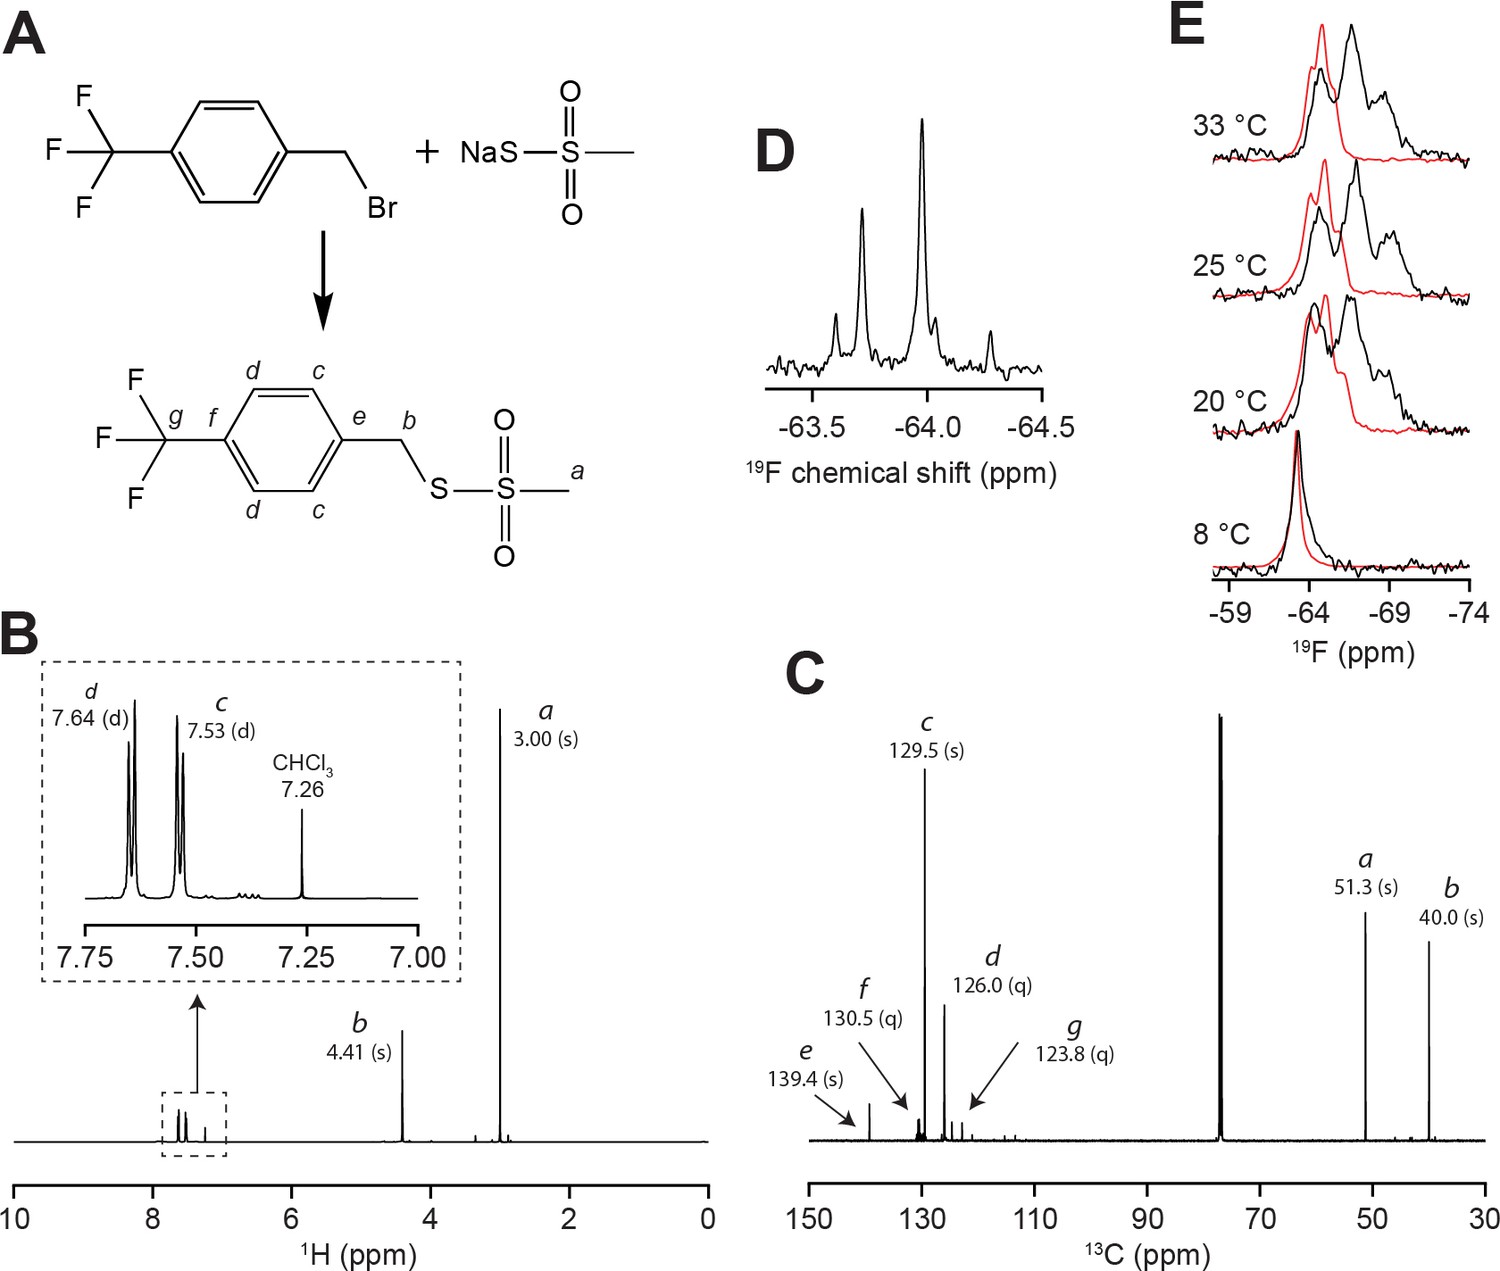
Synthesis and oriented NMR of the trifluoromethylbenzyl (TFMB)-methanethiosulfonate (MTS) tag.
(A) Synthesis of the TFMB-MTS tag. Lettering specifies carbon and proton assignments in (B) 1H and (C) 13C NMR spectra of the tag in CDCl3. Values in parenthesis specify peak multiplicity (s = singlet, d = doublet, q = quartet). (D) 19F NMR of TFMB-tagged SERCA in isotropic bicelles. (E) 19F NMR of TFMB-tagged SERCA (black) and free tag (red) in oriented bicelles. Spectra show that the tag partitions into bicelles, but with considerably reduced dipolar coupling compared to SERCA-reacted tag. This confirms that the dipolar triplet is not from unreacted tag.
Figure 2 with 8 supplements
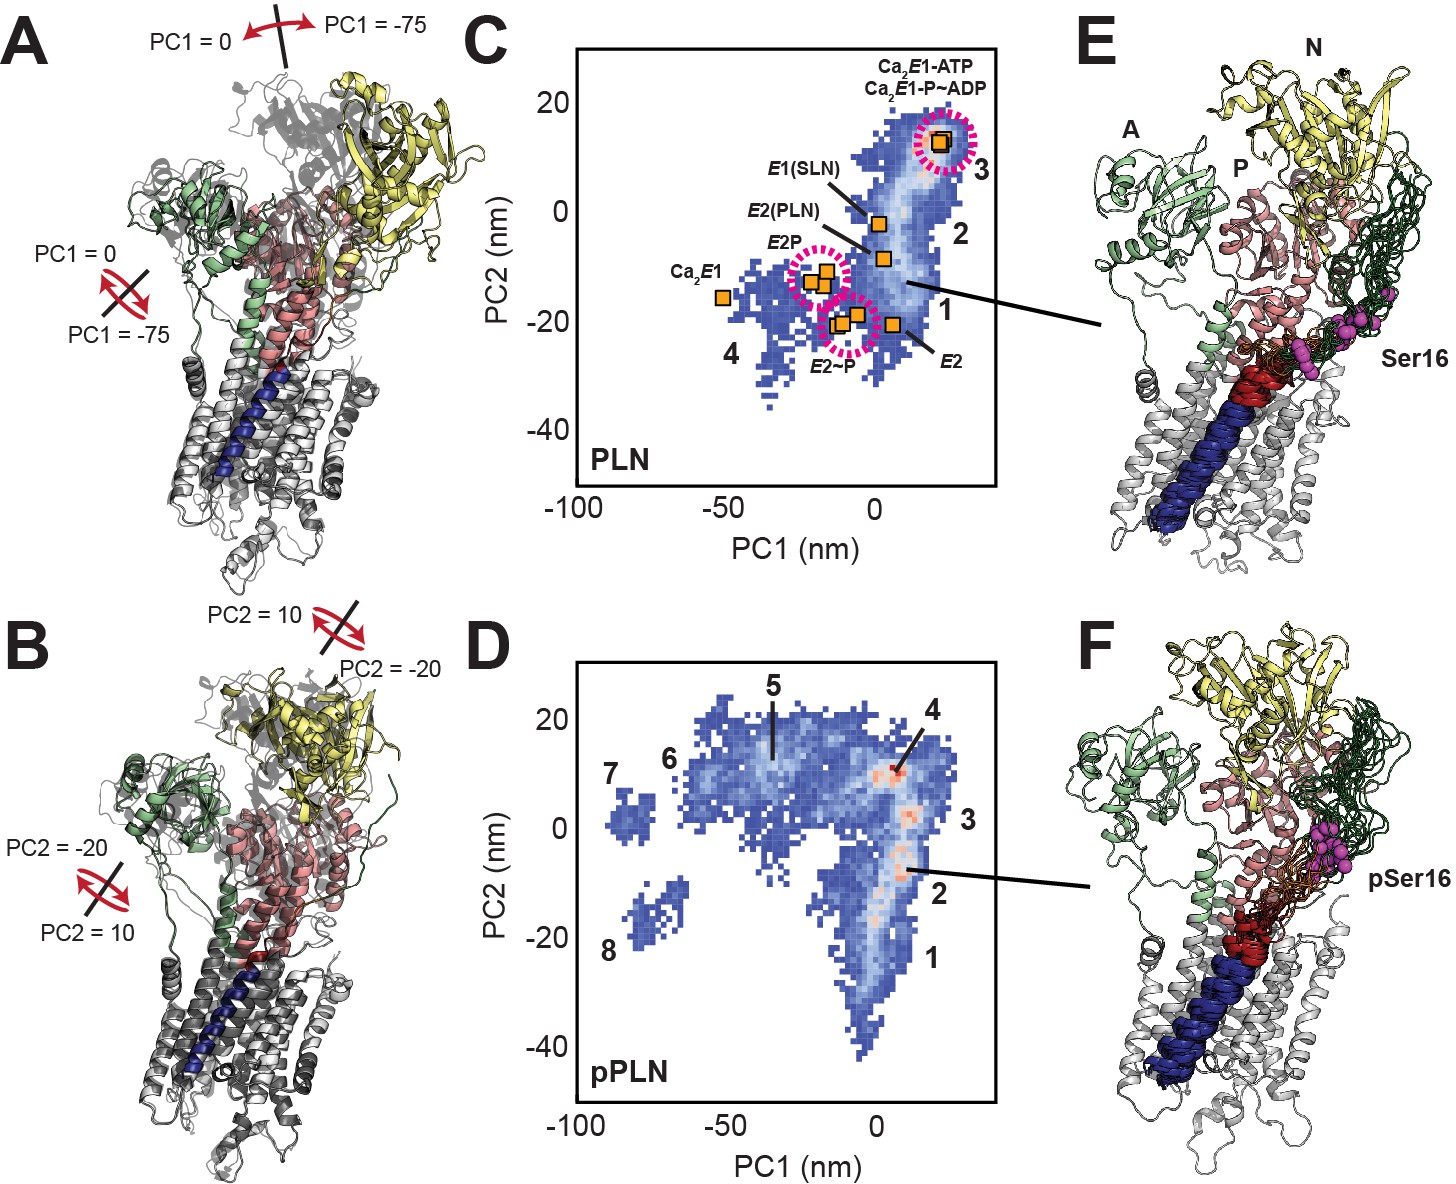
Conformational ensembles and energy landscapes of the SERCA/PLN and SERCA/pPLN complexes.
(A, B) Depiction of headpiece movements associated with the first (A) and second (B) principal components. Structures with the highest PC values are shown as transparent black. (C, D) PCA histograms of SERCA/PLN (C) and SERCA/pPLN (D) structural ensembles with projections of crystal structures in various states: Ca2E1-ATP (Toyoshima and Mizutani, 2004; Sørensen et al., 2004), Ca2E1 ~ P-ADP (Sørensen et al., 2004; Olesen et al., 2007; Toyoshima et al., 2004), Ca2E1 (Toyoshima et al., 2000), E1-SLN (Winther et al., 2013), E2-PLN (Akin et al., 2013), E2P (Olesen et al., 2007; Toyoshima et al., 2007), E2~P (Olesen et al., 2007; Toyoshima et al., 2007; Bublitz et al., 2013), and E2 (Toyoshima and Nomura, 2002). Clusters are numbered. (E, F) Top 20 most representative structures of PLN (E, cluster 1) and pPLN (F, cluster 2) bound to SERCA from the most representative state.
Figure 2—figure supplement 1
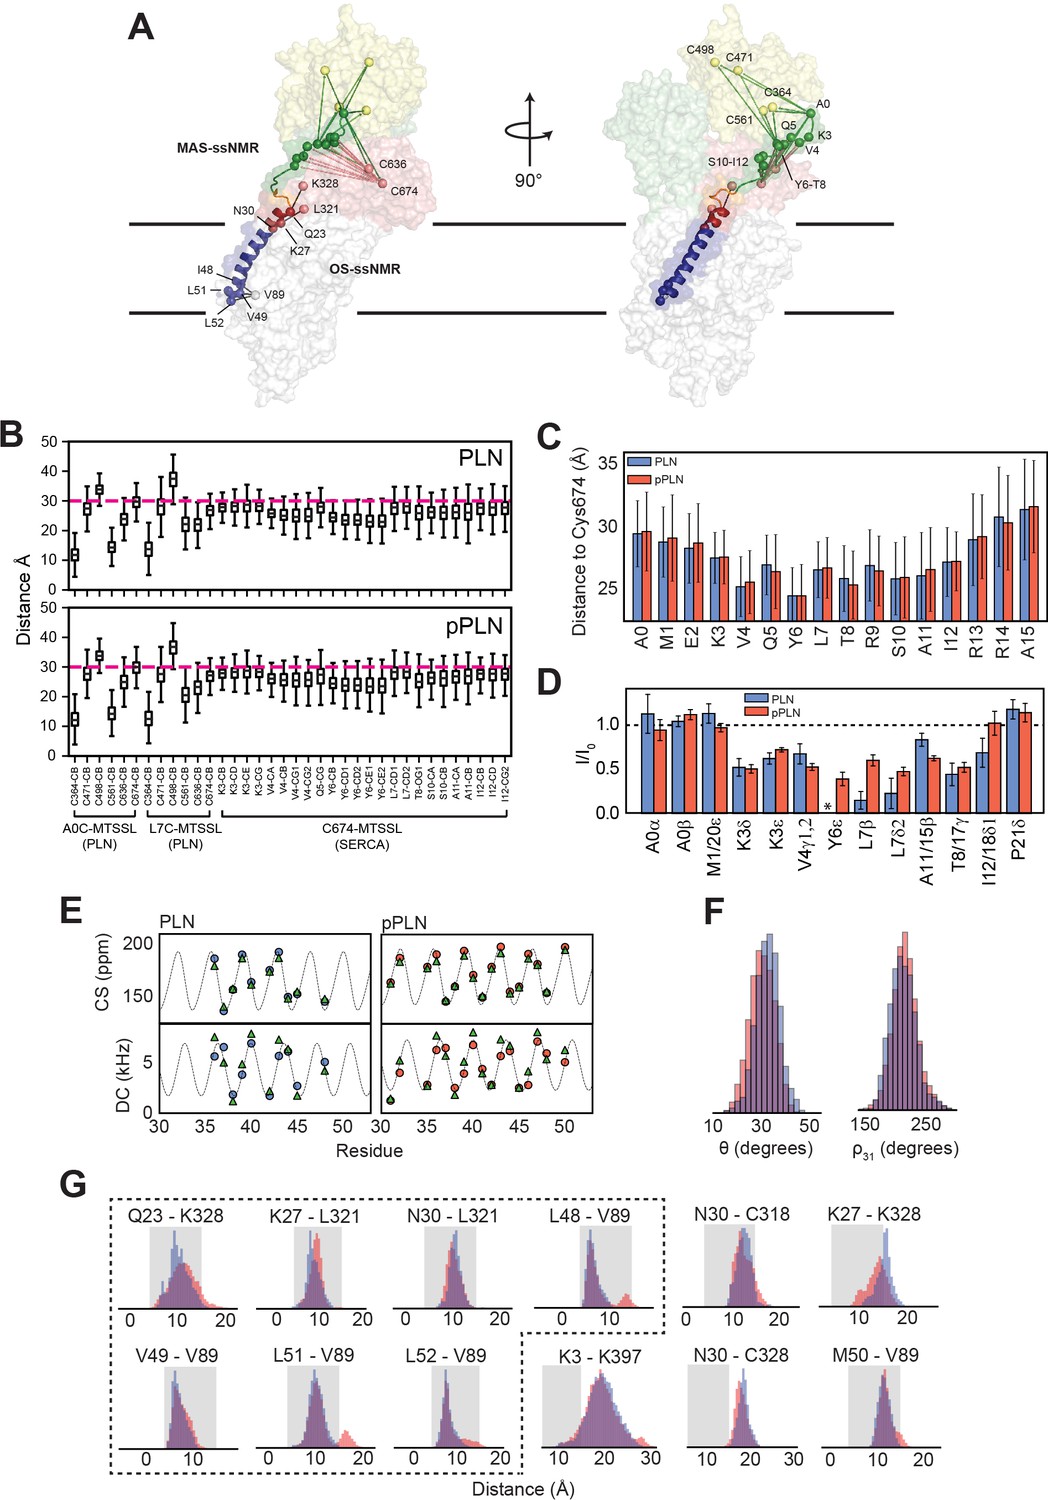
Restraints for RAOR-MD structural refinement.
(A) Schematic of crosslinking restraints (Toyoshima et al., 2003; Chen et al., 2006; Chen et al., 2003) used for initial docking and PRE restraints used to confine PLN domain Ia during the sampling phase. (B) Intermolecular distance distributions for each atom pair confined using PRE-boundary restraints. Distances were computed/constrained from the Sγ atom of the MTSSL-labeled residue. (C) Averaged pairwise distances between cytoplasmic residues (at Cβ) of PLN and Cys674-Sγ show qualitative agreement with (D) prior [13C-13C] DARR MAS-ssNMR PRE measurements (figure adapted from Figure 6B from Gustavsson et al., 2013). (E) Wave plots comparing 15N chemical shifts and 15N-1H dipolar couplings obtained experimentally (blue or red circles) and back-calculated (green triangles) from RAOR-MD ensembles. Wave lines were taken from a PISA fits to the experimental points. (F) Tilt (θ) and azimuthal angles (ρ31) back-calculated from RAOR-MD ensembles of PLN (blue) and pPLN (red). (G) REMD pairwise distance distributions (Cβ-Cβ) of crosslinking residues (Toyoshima et al., 2003; Chen et al., 2006; Chen et al., 2003; Jones et al., 2002; James et al., 1989). Histograms encased in dotted lines relate to residue-pairs restrained during initial docking. Shaded regions show a typical 4–15 Å crosslinking range. The residue pair Asn30 – Cys318, outside of this range, has optimal crosslinking with longer (15 Å) reagents (Jones et al., 2002).
Figure 2—figure supplement 2
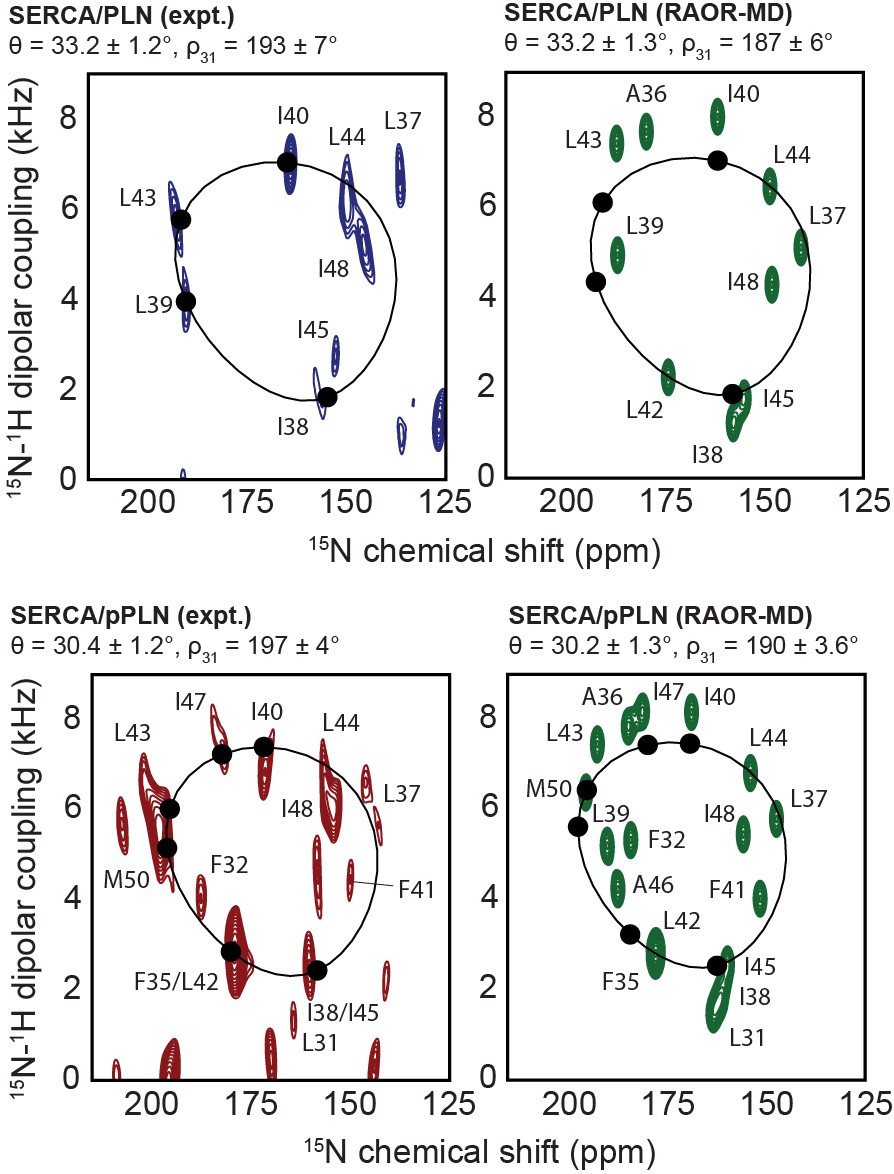
Experimental and back-calculated RAOR-MD SLF spectra of the PLN/SERCA complex.
Comparison of cross-peak positions observed from experimental SE-SAMPI4 spectra (blue or red) and back-calculated from RAOR-MD ensembles (green; assumes 200 Hz and 800 Hz linewidths in CSA and DC dimensions, respectively). PISA fits were performed using only residues (solid circles) conforming closely to ideal helicity in experimental spectra (i.e. Ile38, Leu39, Ile40, and Leu43 for PLN and Phe35, Ile38, Ile40, Leu43, Ile47, and Met50 for pPLN).
Figure 2—figure supplement 3
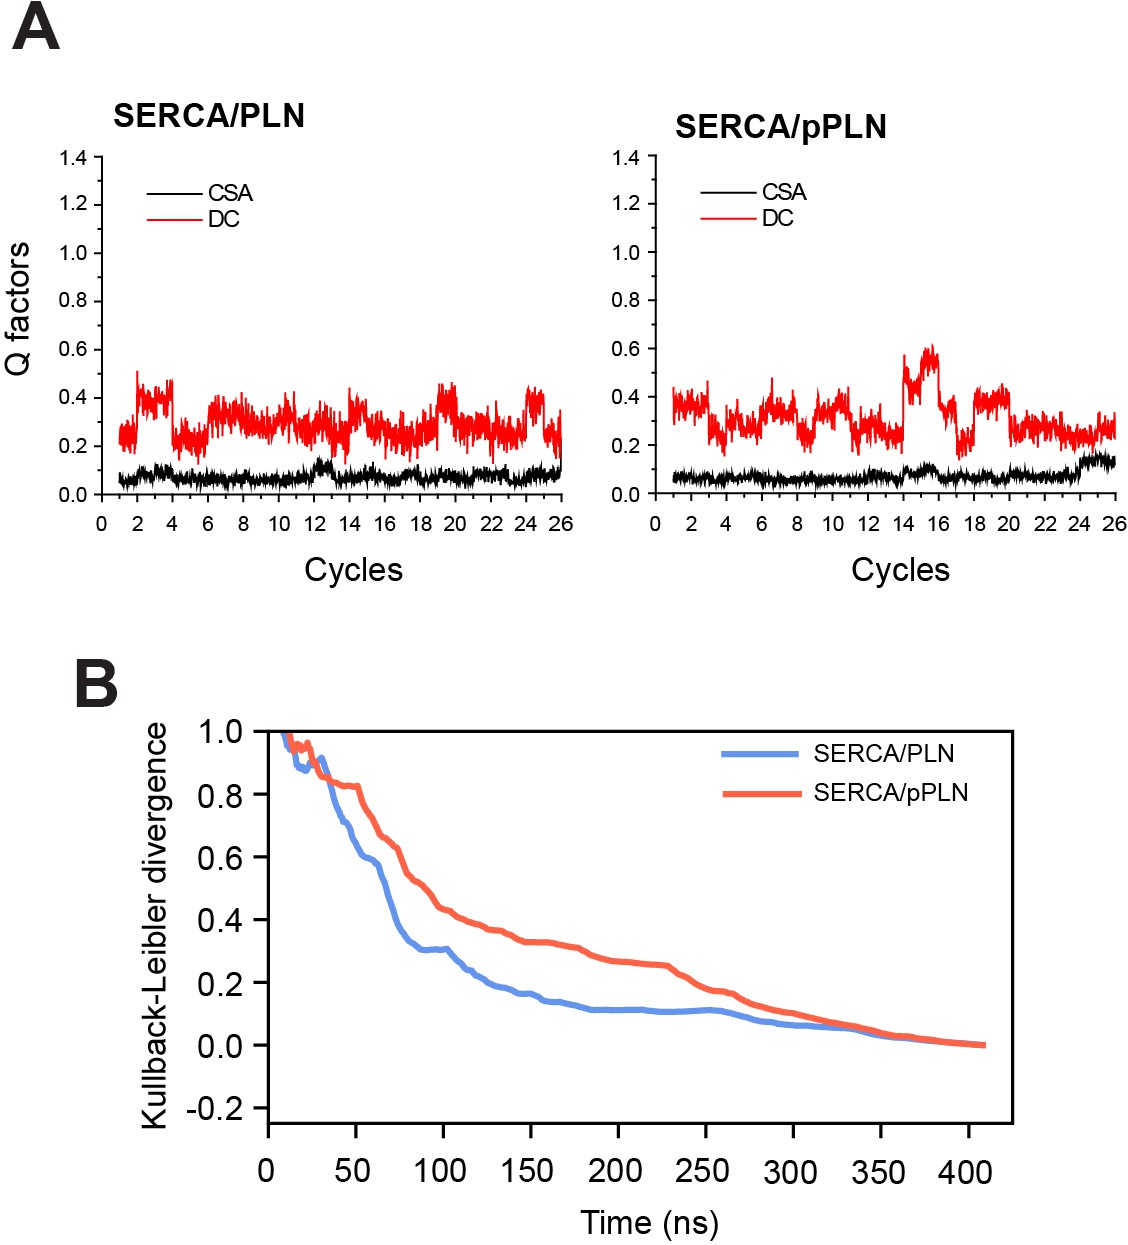
Convergence of OS-ssNMR restraints and the conformational landscape of SERCA.
(A) Convergence of CS and DC restraints throughout annealing cycles. (B) Evolution of Kullback-Leibler divergence of the 2D PCA histogram from the final ensemble.
Figure 2—figure supplement 4
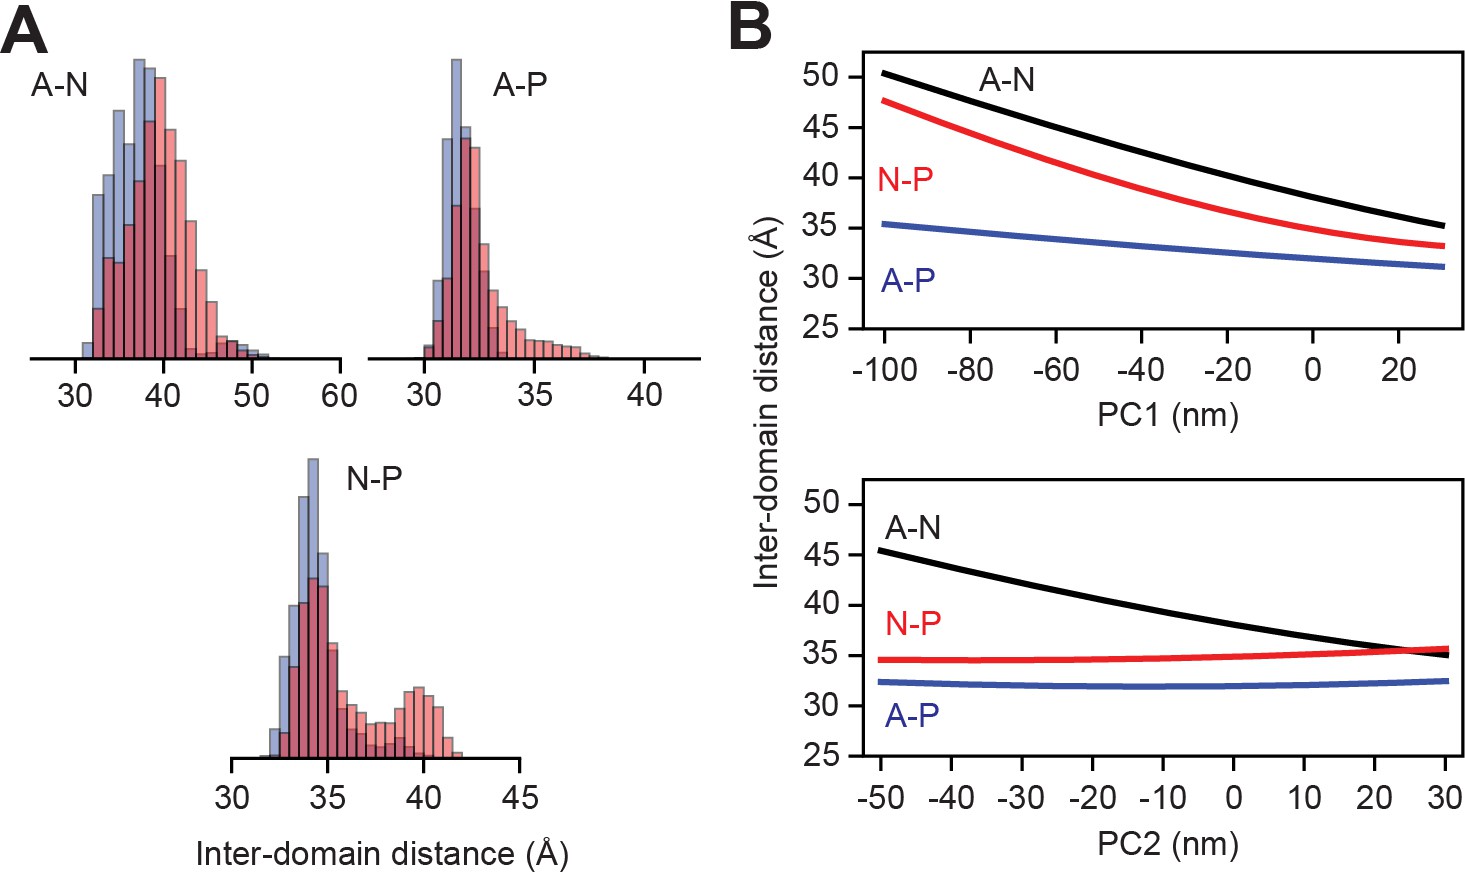
Headpiece dynamics of SERCA in RAOR-MD.
(A) Inter-domain headpiece distances distributions from RAOR-MD of SERCA in complex with PLN (blue) and pPLN (red). (B) SERCA headpiece distance as a function of the two largest components (PC1 and PC2) from Principal Component Analysis (PCA) of the two RAOR-MD calculations. Center of masses were determined using only backbone atoms with the Actuator (A) domain defined by residues 1–48 and 111–253, the Nucleotide-binding (N) domain by 360–602 and the Phosphorylation (P) domain by 314–359 and 602–757.
Figure 2—figure supplement 5
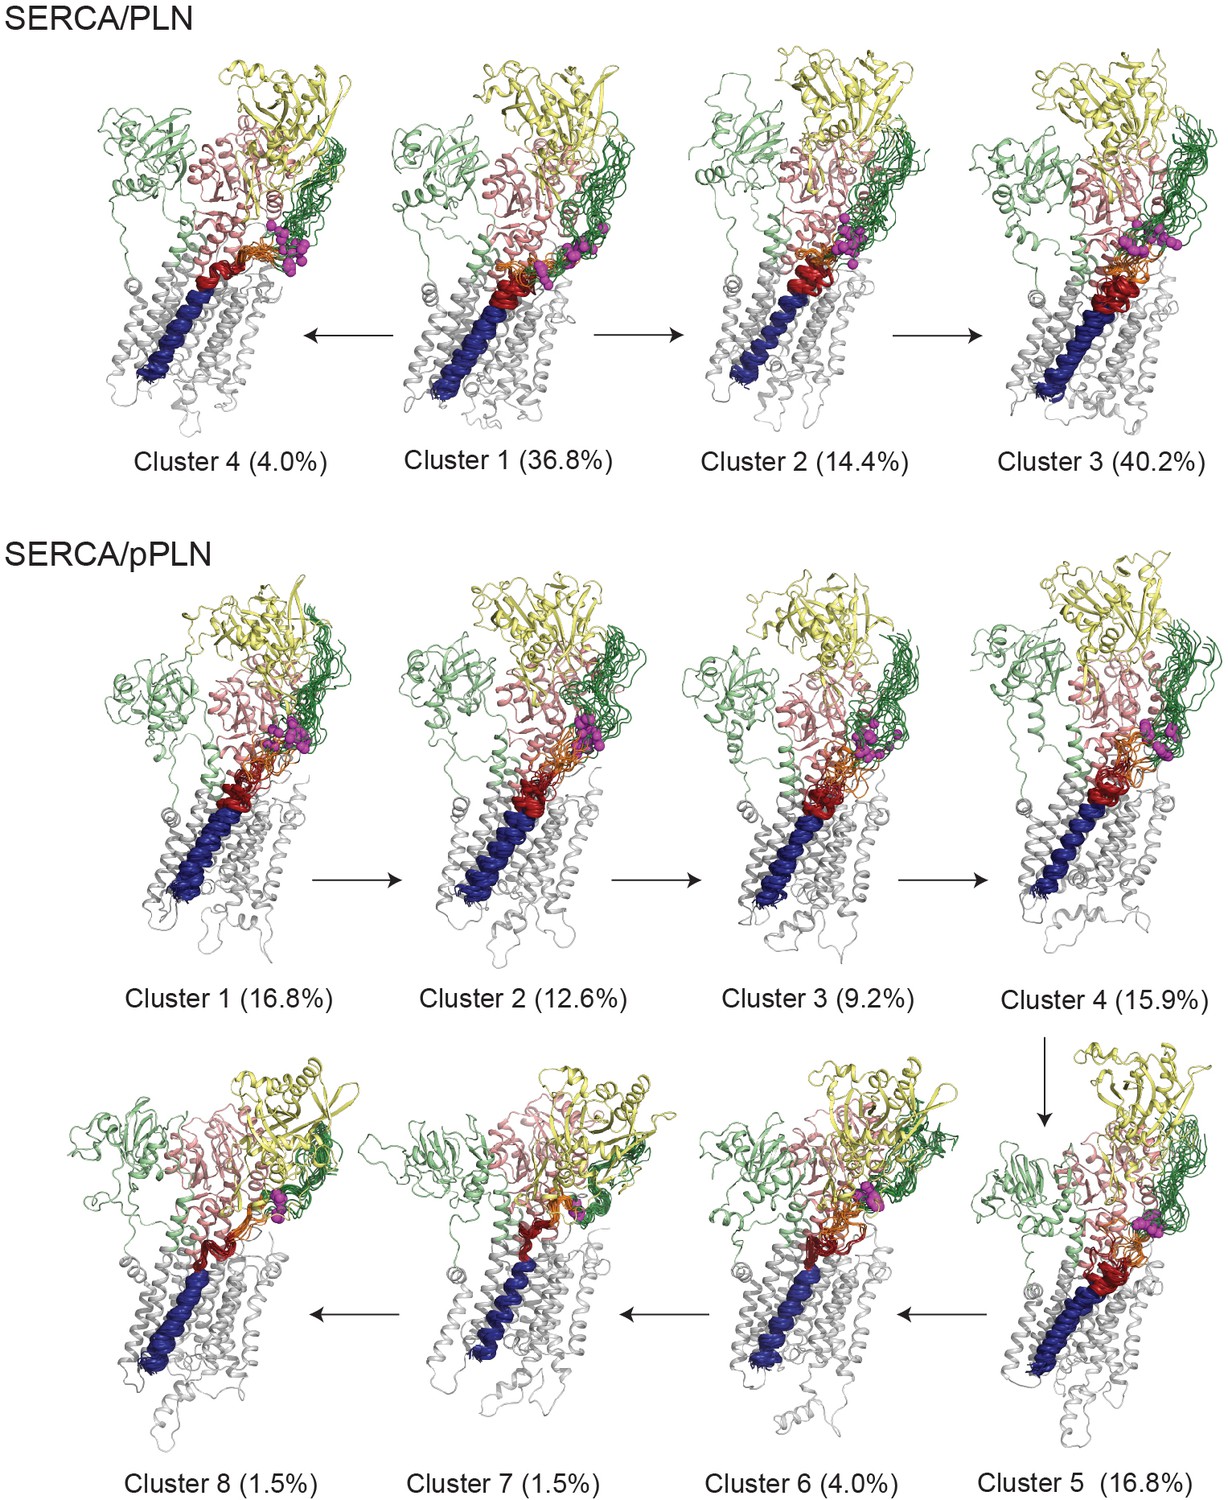
RAOR-MD clustering.
Top 20 most representative structures of each cluster extracted from PCA. Structures were aligned by TM residues of SERCA. Only the most representative structure of SERCA is shown for each cluster.
Figure 2—figure supplement 6
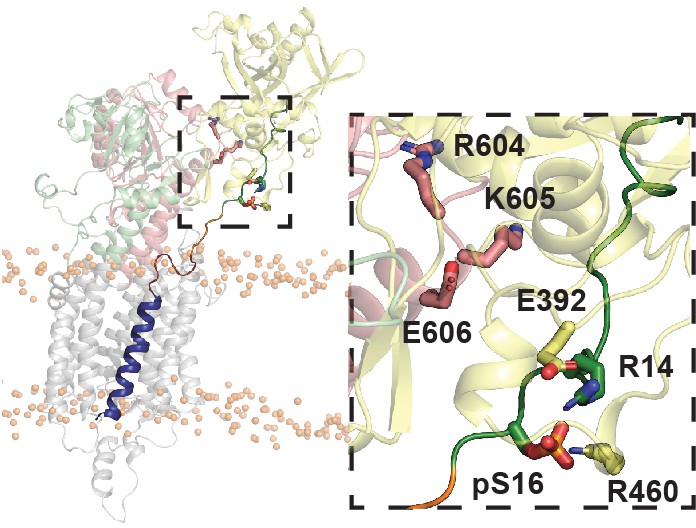
Example open state snapshot (PCA cluster 6) of SERCA stabilized by electrostatic interactions between pSer16 and the N domain.
Figure 2—video 1
Movie of the SERCA/PLN complex motion along PC1.
Figure 2—video 2
Movie of the SERCA/PLN complex motion along PC2.
Figure 3 with 1 supplement
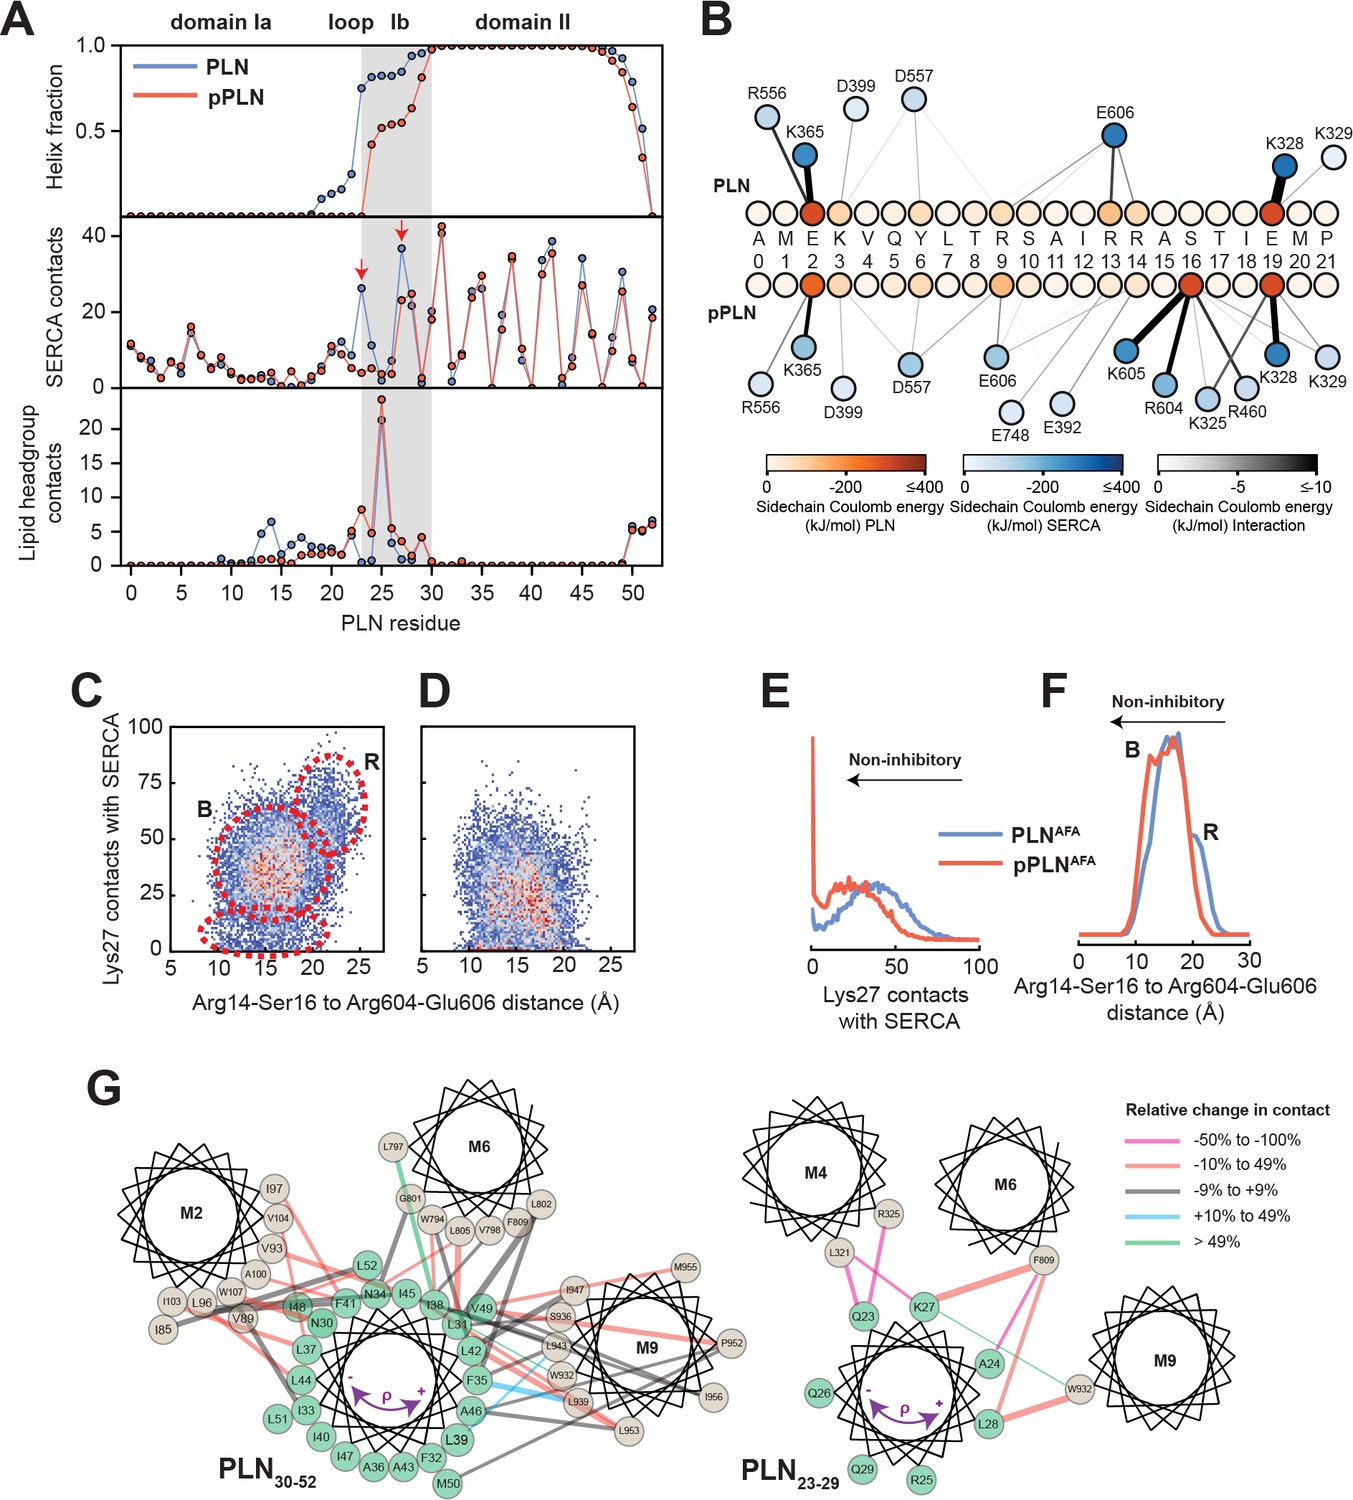
Mechanism for reversal of PLN inhibition by phosphorylation.
(A) Ensemble-averaged per-residue (PLN) structural analysis (upper panel), intermolecular SERCA contacts (middle panel), and intermolecular lipid headgroup contacts (lower panel). A contact is defined when any PLN atom comes within 3.5 Å of any SERCA or lipid headgroup (i.e. part of the phosphate or choline moiety) atom for any given frame. (B) Spider plot of pairwise electrostatic interactions between cytoplasmic residues and SERCA in RAOR-MD conformational ensembles. (C, D) 2D Histograms correlating the distances between the cytoplasmic binding interfaces, defined by the center of masses of Arg14 to Ser16 of PLN and Arg604 to Glu606 of SERCA, to the inhibitory intermolecular contacts of PLN Lys27 for the SERCA/PLN (C) and SERCA/pPLN (D) ensembles. (E, F) Corresponding 1D histograms for Lys27 contacts (E) and binding of the cytoplasmic domain (F). (G) Disruption of the inhibitory TM pairwise interactions detected in the RAOR-MD conformational ensembles. Linewidths of the interhelical contacts are scaled to average contacts per frame for the non-phosphorylated complex and colored by the relative change observed with phosphorylation. Directions of the purple arrows exemplify clockwise or counterclockwise rotations of the TM domain of PLN during the trajectories.
Figure 3—figure supplement 1

Summary of inhibitory TM contacts.
Per-residue ensemble-averaged intermolecular contacts for TM helices of SERCA. A single contact by SERCA to PLN (blue) or pPLN (red) in RAOR-MD simulations is defined when any SERCA atom comes within 3.5 Å of any PLN atom for any given frame. PLN residues responsible for the most contacts are designated at local maxima.
Figure 4
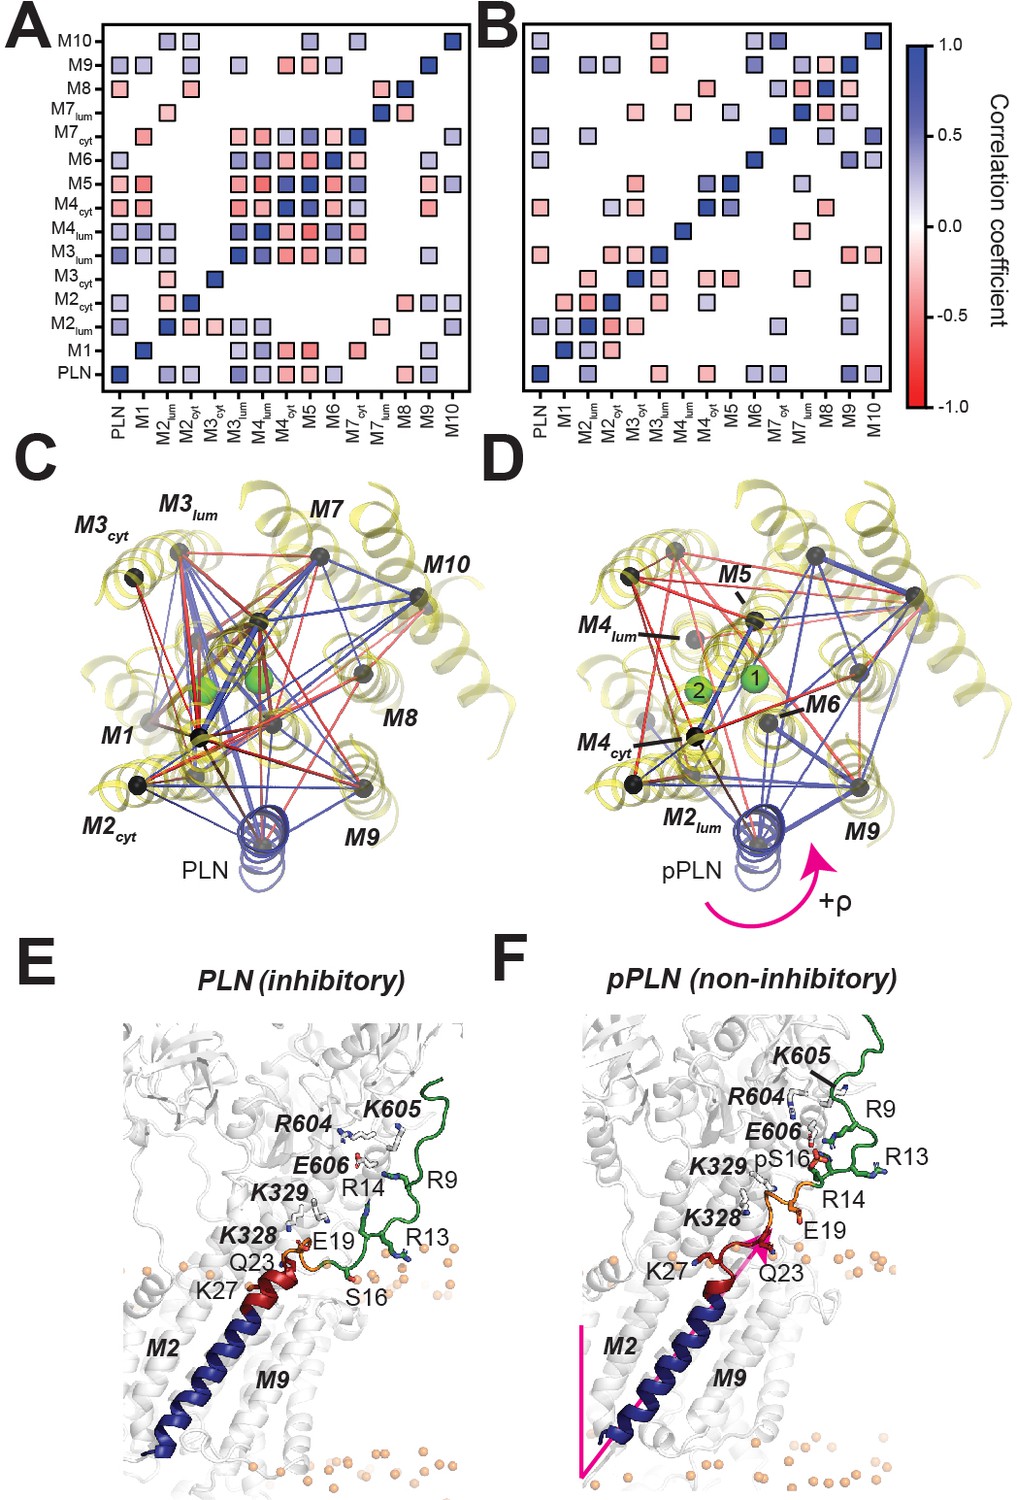
PLN topological transitions are allosterically coupled to SERCA's Ca2+ binding sites.
(A, B) Correlation maps of motions between the TM topology of PLN (A) or pPLN (B) with the topology of the 10 TM domains of SERCA. (C, D) Corresponding spider plots showing the density of correlations are displayed below. Green spheres mark positions of the calcium-binding sites. (E, F) Snapshots of the SERCA/PLN (E) and SERCA/pPLN (F) complexes highlighting the transient interactions with the cytoplasmic region and loosened interactions with the TM region of SERCA.
Figure 5
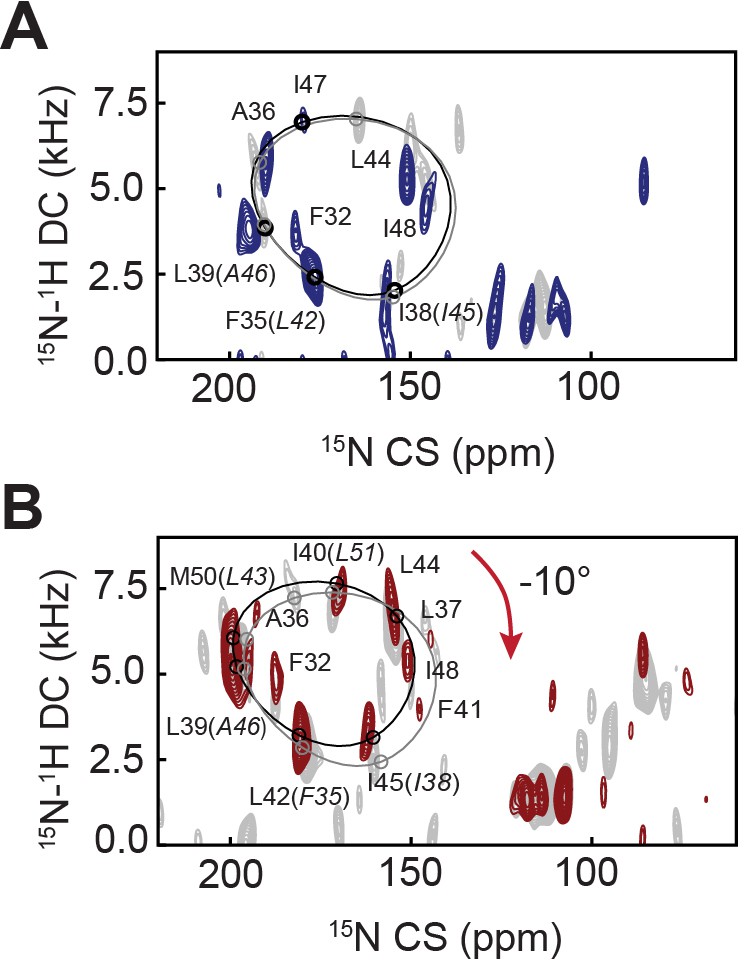
Effects of Ca2+ binding to SERCA on the topology of PLN and pPLN.
(A, B) 2D [15N-1H] SE-SAMPI4 spectrum of PLN (A) and pPLN (B) bound to SERCA in the E1 form reconstituted into aligned lipid bicelles. PISA wheels for an ideal are superimposed. Equivalent spectra of the E2 form complexes are shown in gray.
Figure 6
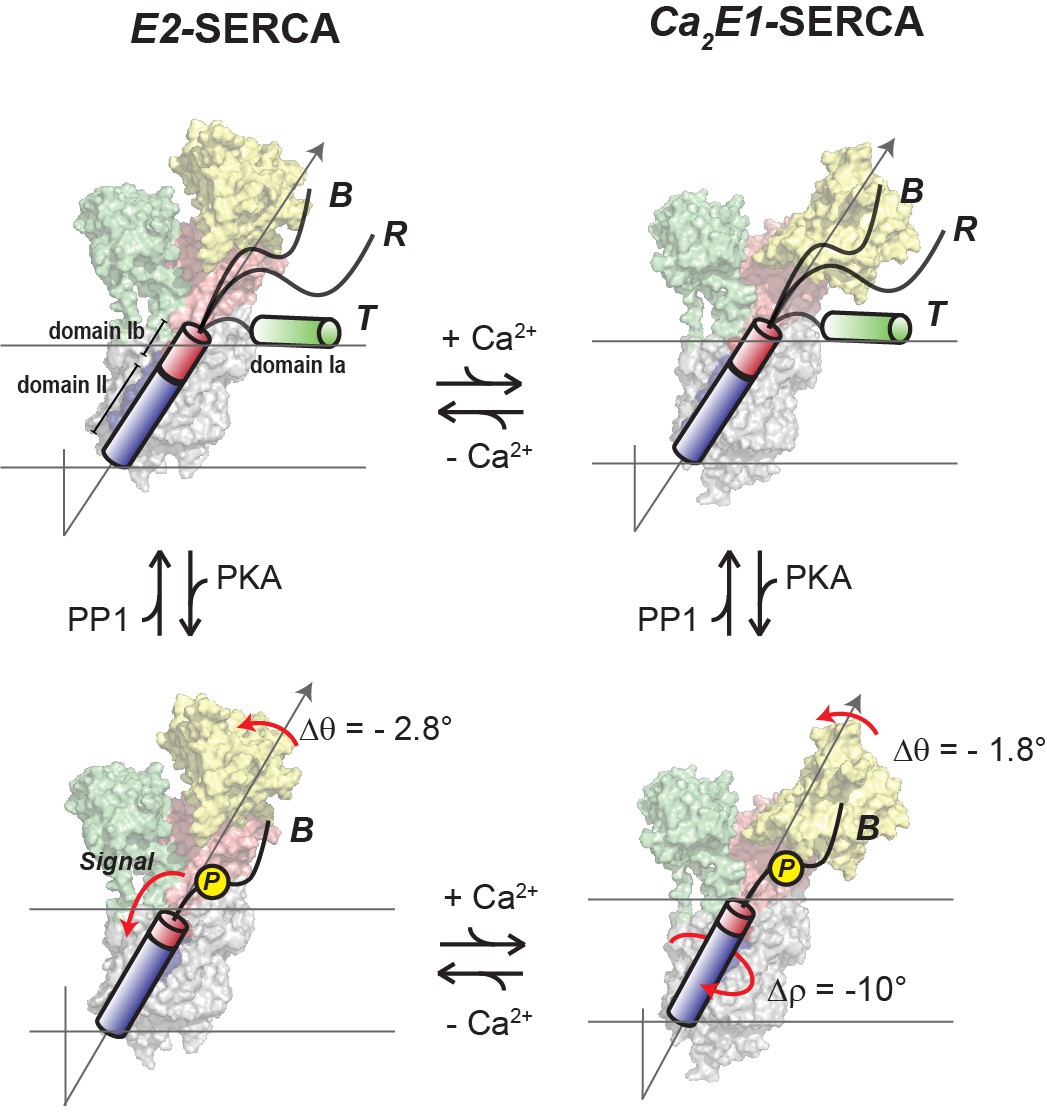
Regulatory model of SERCA by PLN’s phosphorylation and Ca2+.
PLN’s cytoplasmic domain exists in equilibrium between three distinct populations in the presence of SERCA. The increase of Ca2+ ions causes significant shifts in SERCA’s conformation toward the E1 state, while the topology of PLN is only slightly affected (top equilibrium). Phosphorylation of PLN at Ser16 signals more extensive topological changes with a reconfiguration of SERCA/PLN TM interactions both at low and high Ca2+ concentrations (bottom equilibrium), augmenting Ca2+ transport. Note that the T and R populations are not represented for clarity.
Figure 7
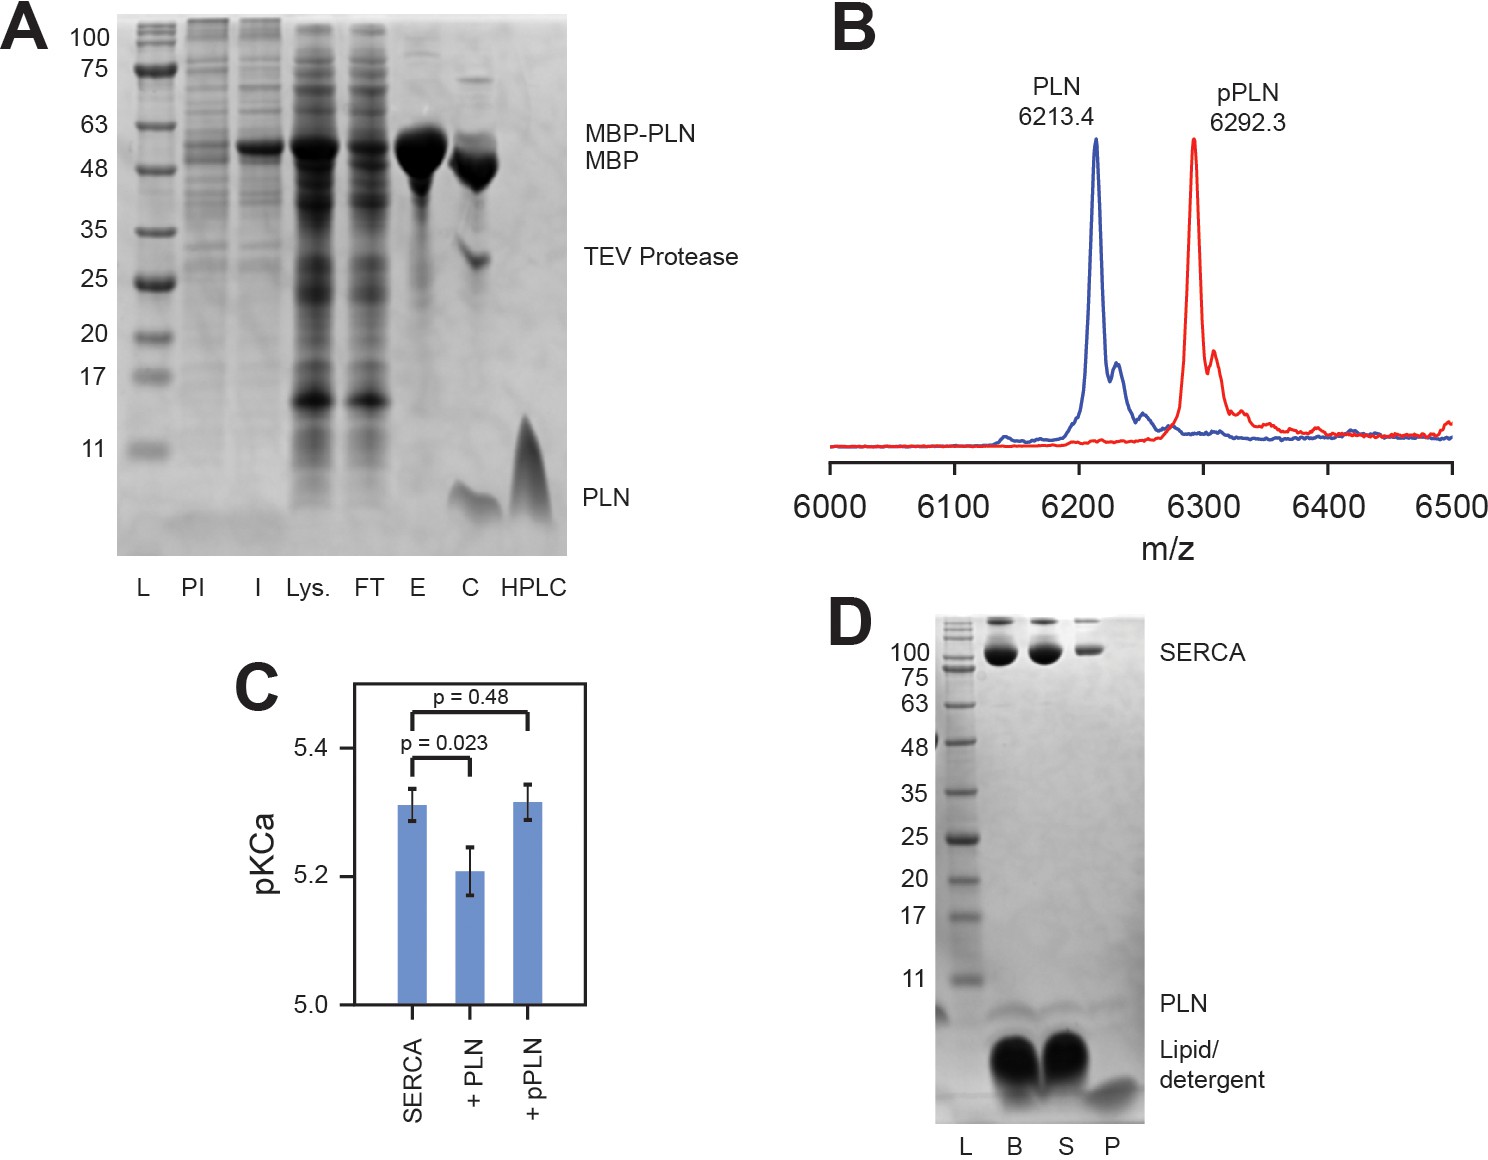
Activity and confirmation of PLN.
(A) SDS-PAGE gel of the expression and purification of PLN as an MBP-fusion: ladder (L), pre-induced (PI) and induced (I) expression, lysate supernatant (Lys.), purified MBP-PLN eluted from amylose resin (E), MBP-PLN after cleavage with TEV protease (C), and HPLC-purified PLN. (B) MALDI-MS spectra of HPLC-purified 15N PLN and pPLN. (C) Coupled-enzyme ATPase activity assays of SERCA reconstituted into DMPC/POPC (4:1; lipid-to-protein ratio of 700:1) liposomes with a fivefold excess of either PLN or pPLN. Assays consisted of 50 mM HEPES, 100 mM KCl, 5 mM MgCl2, 0.2 mM NADH, 0.5 mM PEP, 10 U/mL pyruvate kinase, 10 U/mL lactate dehydrogenase, and 7 μM calcium ionophore A23187 at pH 7.0. ATPase activity was measured by the rate of reduction in NADH absorbance at 340 nm at EGTA-buffered calcium concentrations between 10−7 and 10−4 M, initiated by addition of 5 mM ATP. Activity as a function of calcium concentration was fitted to a Hill function to extract the pKCa values (calcium concentration at half Vmax) shown. Errors indicate the standard deviation from three replicate measurements. Statistical significance was determined by unpaired t-test (Microsoft Excel 365 Version 2002). (D) SDS-PAGE gel of SERCA and PLN reconstituted into bicelles for OS-ssNMR: bicelle sample freshly solubilized by DHPC (B), supernatant after centrifugation (S) and pellet formed from a small non-solubilized component (P).
Figure 8
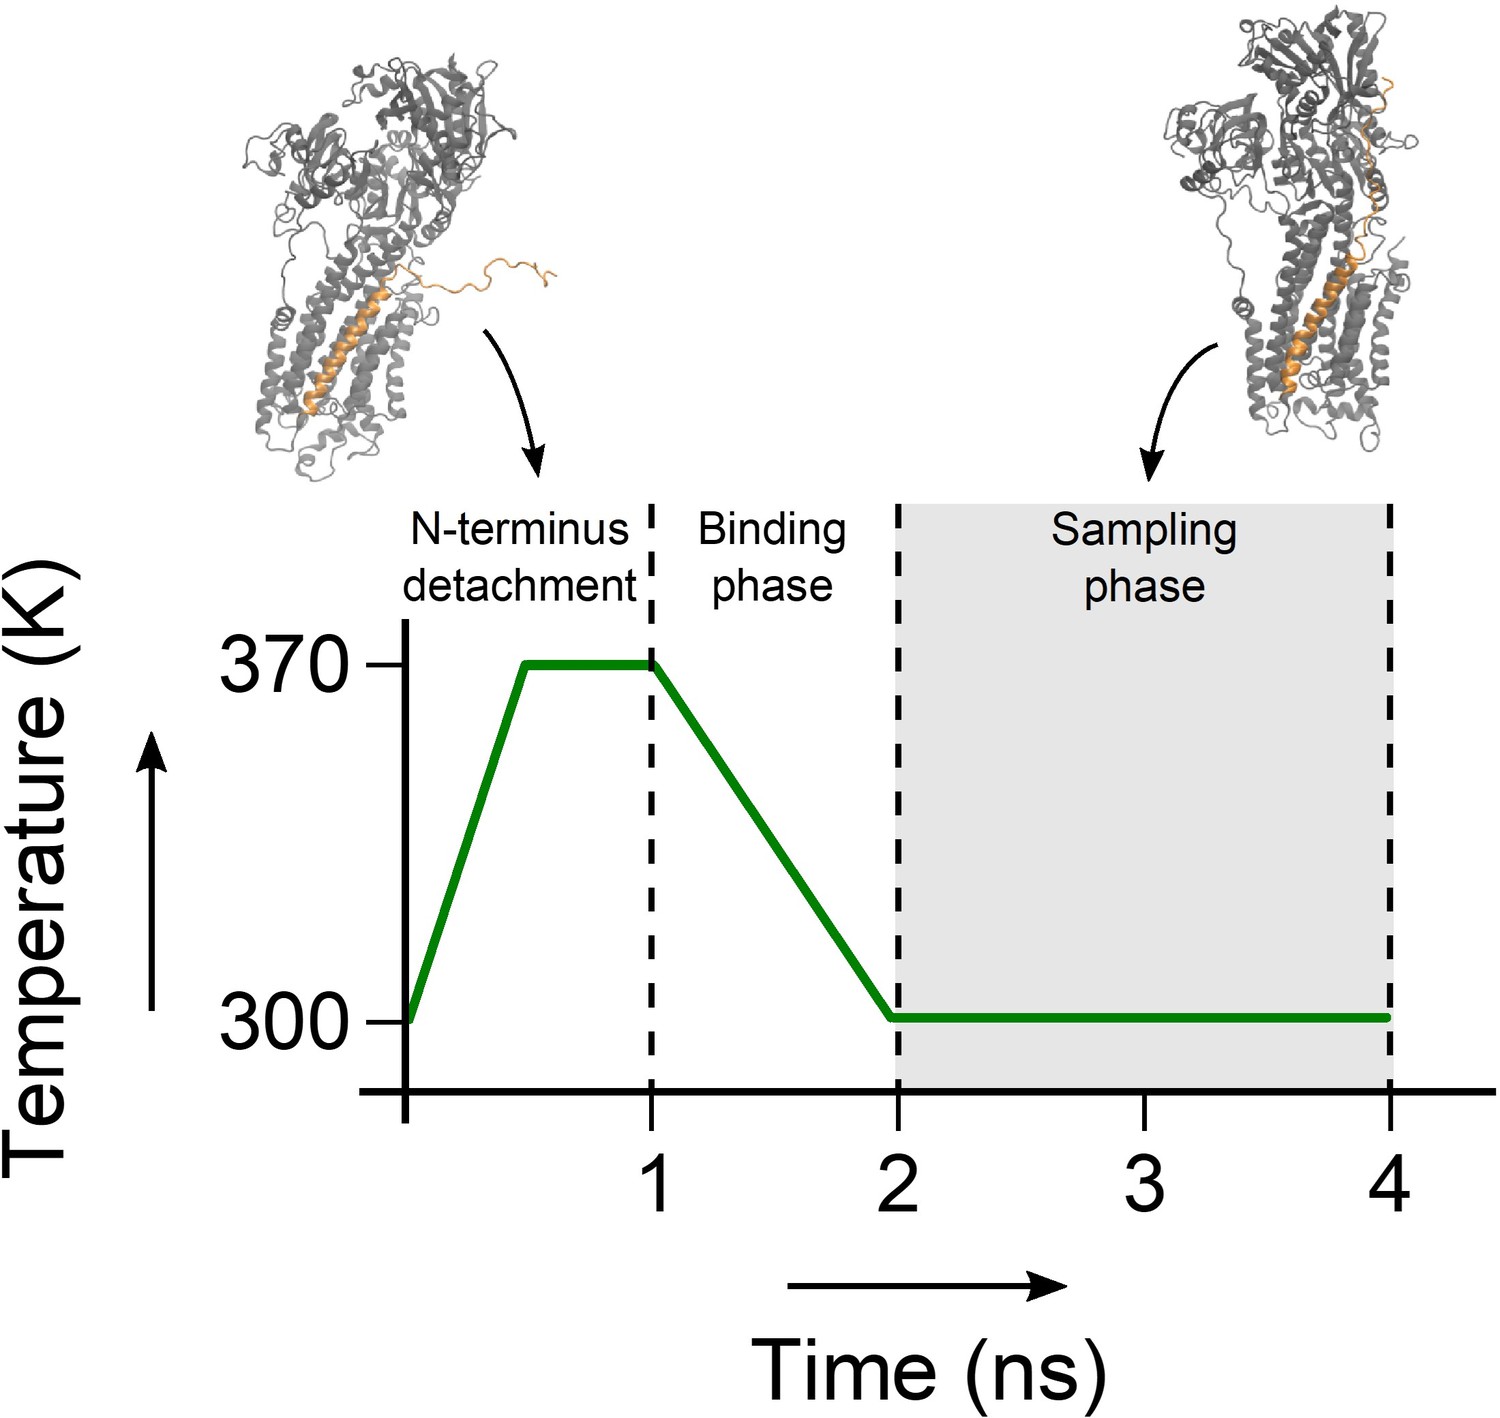
Annealing cycle used in the sampling of the SERCA/PLN complex.
During the first nanosecond of the simulation, the N-terminus of PLN is detached from SERCA and the temperature is raised to 370 K to randomize its conformation. Then the system is cooled back down to 300 K over one ns, during which time the CS, DC and PRE restraints are re-introduced. The complex is sampled for two ns, after which the cycle restarts.
Tables
Table 1
OS-ssNMR assignments.
Summarized 15N CS (ppm) and 15N-1H DC (kHz) assignments of PLN and pPLN reconstituted alone in bicelles or in complex with SERCA in either E2 (Ca2+-free) or E1 (5 mM Ca2+) states.
| Res. | PLN | pSer16-PLN | PLN + SERCA (E2) | pSer16-PLN +SERCA (E2) | PLN + SERCA (E1) | pSer16-PLN +SERCA (E1) | ||||||
|---|---|---|---|---|---|---|---|---|---|---|---|---|
| CS | DC | CS | DC | CS | DC | CS | DC | CS | DC | CS | DC | |
| N27 | 117.6* | 1.19* | 118.1 | 0.90 | - | - | - | - | - | - | - | - |
| N30 | 117.6* | 1.19* | 121.5 | 3.10 | - | - | - | - | - | - | - | - |
| L31 | 152.8 | 0.94 | 155.2 | 0.74 | - | - | 164.3 | 1.26 | - | - | - | - |
| F32 | 167.7 | 2.46 | 177.9 | 3.38 | - | - | 187.6 | 4.07 | 181.6 | 3.78 | 186.6 | 4.56 |
| N34 | 125.8 | 1.36 | 132.4 | 2.71 | - | - | - | - | - | - | - | - |
| F35 | 164.7 | 1.17 | 166.2* | 1.36* | - | - | 179.1 | 2.86 | 176.4 | 2.30 | - | - |
| A36 | 176.5 | 4.74 | 184.3 | 5.28 | 186.5 | 5.72 | 191.0 | 6.37 | 190.4 | 5.91 | 192.8 | 6.76 |
| L37 | 123.9 | 4.89 | 132.2 | 5.71 | 136.5 | 6.66 | 146.0 | 6.57 | 146.1 | 4.73 | 151.7 | 5.87 |
| I38 | 140.8 | 1.03 | 146.5 | 1.40 | 156.9 | 1.86 | 160.3 | 2.54 | 156.4 | 2.11 | 164.9 | 2.14 |
| L39 | 181.7* | 2.31* | 185.7* | 2.86* | 190.3 | 3.88 | 194.4 | 3.99 | 194.5 | 3.76 | 198.5 | 4.75 |
| I40 | 155.7 | 6.19 | 163.5* | 6.88* | 164.0 | 7.04 | 171.5 | 6.87 | 166.7 | 6.99 | 169.9 | 7.25 |
| F41 | 127.8 | 3.39 | 134.6 | 4.19 | - | - | 150.0 | 4.46 | - | - | 148.4 | 4.33 |
| L42 | 160.5 | 0.91 | 166.2* | 1.36* | 175.5 | 1.74 | 179.1 | 2.86 | - | - | 181.1 | 2.63 |
| L43 | 187.5* | 4.17* | 190.9* | 4.46* | 192.8 | 5.77 | 198.3 | 5.76 | 196.5 | 5.89 | - | - |
| L44 | 138.0 | 6.02 | 145.6 | 6.19 | 149.9 | 6.22 | 155.5 | 6.26 | 156.0 | 5.19 | 155.1 | 6.65 |
| I45 | 139.2 | 1.80 | 144.5 | 2.64 | 152.7 | 2.74 | 160.3 | 2.54 | - | - | 162.1 | 3.57 |
| A46 | 181.7* | 2.31* | 185.7* | 2.86* | - | - | 191.4 | 2.84 | - | - | - | - |
| I47 | 170.5 | 6.35 | 175.9 | 6.65 | - | - | 181.8 | 7.23 | 179.5 | 6.74 | 181.9 | 7.99 |
| I48 | 132.7 | 4.88 | 139.2 | 5.39 | 145.5 | 5.16 | 154.3 | 6.03 | 151.2 | 4.94 | - | - |
| V49 | 157.1 | 1.75 | 160.1 | 2.26 | - | - | - | - | - | - | - | - |
| M50 | 187.5* | 4.17* | 190.9* | 4.46* | - | - | 198.0 | 5.14 | 202.5 | 4.80 | 199.9 | 5.94 |
| L51 | 158.3 | 7.06 | 163.5* | 6.88* | - | - | - | - | - | - | - | - |
-
*These peaks are overlapped.
Table 2
Pairwise inter- and intramolecular hydrogen bond summary for PLN/SERCA REMD PCA clusters.
Parentheses report the average number hydrogen bonds to a charged residue of SERCA or PLN (bold font) observed over all frames assigned to the respective clusters. Hydrogen bonds were defined with a donor -acceptor distance less than 3 Å and a donor-H-acceptor angle less than 20°.
| Cluster | Average hydrogen bonds per frame | ||||||
|---|---|---|---|---|---|---|---|
| E2 | K3 | R9 | R13 | R14 | S16 | E19 | |
| 1 | R556 (0.10) K365 (0.08) R638 (0.02) | - | E606 (0.05) | E19 (0.01) | E606 (0.01) | - | K328 (0.08) R13 (0.01) |
| 2 | R556 (0.10) K365 (0.04) | E644 (0.02) D557 (0.02) | D557 (0.01) | E606 (0.05) E19 (0.04) | E606 (0.02) | - | K328 (0.38) R13 (0.04) |
| 3 | K365 (0.11) R556 (0.09) R638 (0.01) | D399 (0.01) | E606 (0.02) | - | E606 (0.06) | - | K328 (0.15) R325 (0.04) K329 (0.03) |
| 4 | K397 (0.14) K365 (0.11) R638 (0.05) | D399 (0.24) | D557 (0.10) E392 (0.02) E606 (0.01) | D616 (0.06) | - | - | - |
Table 3
Pairwise inter- and intramolecular hydrogen bond summary for pSer16-PLN/SERCA REMD PCA clusters.
Hydrogen bonds were measured according to Table 2.
| Cluster | Average hydrogen bonds per frame | ||||||
|---|---|---|---|---|---|---|---|
| E2 | K3 | R9 | R13 | R14 | S16 | E19 | |
| 1 | K365 (0.04) R556 (0.03) K397 (0.02) | D557 (0.01) | D557 (0.14) S16 (0.13) E392 (0.02) | S16 (0.59) E606 (0.02) | S16 (0.72) E606 (0.04) | R14 (0.72) R13 (0.59) R604 (0.54) K605 (0.30) R9 (0.13) | K328 (0.07) K329 (0.02) |
| 2 | K365 (0.07) R556 (0.03) | D399 (0.01) | S16 (0.55) E606 (0.03) | S16 (0.21) E19 (0.06) E748 (0.02) D616 (0.01) | S16 (0.81) E606 (0.06) | R14 (0.81) R9 (0.55) R13 (0.21) K605 (0.16) R604 (0.01) | K328 (0.10) R13 (0.06) |
| 3 | K365 (0.12) K3 (0.02) R556 (0.01) | D399 (0.03) D557 (0.02) E2 (0.02) | S16 (0.82) E606 (0.05) | S16 (0.07) E748 (0.03) | S16 (0.85) E606 (0.01) | R14 (0.85) R9 (0.82) R13 (0.07) K605 (0.05) | - |
| 4 | R556 (0.09) K365 (0.06) R560 (0.02) R638 (0.01) K400 (0.01) | D557 (0.03) | S16 (0.28) E606 (0.05) | S16 (0.57) E19 (0.03) | S16 (0.86) E606 (0.02) | R14 (0.86) R13 (0.57) R9 (0.28) | K328 (0.09) R13 (0.03) K329 (0.02) |
| 5 | R556 (0.07) K365 (0.05) K3 (0.03) K400 (0.03) R638 (0.03) | 399 (0.04) E2 (0.03) | S16 (0.16) E606 (0.05) | S16 (0.77) | S16 (0.77) | R13 (0.77) R14 (0.77) R9 (0.16) K328 (0.03) K329 (0.02) | R325 (0.19) K328 (0.13) K464 (0.02) |
| 6 | R556 (0.06) K3 (0.04) | E2 (0.04) | D399 (0.08) E394 (0.05) | S16 (0.84) | S16 (1.14) E392 (0.25) | R14 (1.14) R460 (0.89) R13 (0.84) K464 (0.11) K329 (0.07) R325 (0.01) | K328 (0.21) K329 (0.04) K464 (0.03) |
| 7 | K365 (0.14) | - | E19 (0.03) D616 (0.02) | E748 (0.54) E606 (0.03) | S16 (0.36) | R325 (1.18) R14 (0.36) K329 (0.31) K328 (0.25) | R9 (0.03) |
| 8 | K397 (0.10) K400 (0.03) | E644 (0.01) | E394 (0.23) | S16 (0.67) | S16 (1.22) E392 (0.65) | R14 (1.22) R13 (0.67) R460 (1.35) | R325 (0.45) K328 (0.44) K329 (0.37) |
Key resources table
| Reagent type (species) or resource | Designation | Source or reference | Identifiers | Additional information |
|---|---|---|---|---|
| Strain, strain background (Escherichia coli) | BL21-CodonPlus (DE3)-RP | Agilent | 230255 | Chemically competent cells for protein expression |
| Recombinant DNA reagent | pMAL c2X PLNAFA (plasmid) | Buck et al., 2003 | MBP fusion with monomeric mutant of rabbit PLN (AFA; C36A, C41F, C46A) | |
| Peptide, recombinant protein | PLNAFA | This work | NCBI NP_001076090.1 | Purified monomeric mutant of rabbit PLN (C36A, C41F, C46A) protein |
| Biological sample (Oryctolagus cuniculus) | SERCA1a | This work | NCBI NP_001082787.1 | Protein extracted and purified from rabbit skeletal muscle |
| Chemical compound, drug | 4-(Trifluoromethyl)benzyl bromide | Sigma-Aldrich | 290564 | Precursor for TMFB-MTS synthesis |
| Chemical compound, drug | Sodium methanethiosulfonate | Sigma-Aldrich | 684538 | Precursor for TMFB-MTS synthesis |
| Chemical compound, drug | 1,2-Dimyristoyl-sn-glycero-3-phosphocholine (DMPC) | Avanti Polar Lipids | 850345 | Bicelle long chain lipid |
| Chemical compound, drug | 1-Palmitoyl-2-oleoyl-glycero-3-phosphocholine (POPC) | Avanti Polar Lipids | 850457 | Bicelle long chain lipid |
| Chemical compound, drug | 1,2-Dimyristoyl-sn-glycero-3-phosphoethanolamine-N-diethylenetriaminepentaacetic acid (ammonium salt) (PE-DTPA) | Avanti Polar Lipids | 790535 | Bicelle long chain lipid for chelating Yb3+ |
| Chemical compound, drug | 1,2-Dihexanoyl-sn-glycero-3-phosphocholine (DHPC) | Avanti Polar Lipids | 850305 | Bicelle short chain lipid |
| Chemical compound, drug | Octaethylene Glycol Monododecyl Ether (C12E8) | Anatrace | O330 | Detergent for SERCA1a extraction/purification and reconstitution |
| Chemical compound, drug | Ytterbium(III) chloride hexahydrate | Sigma-Aldrich | 204870 | For flipping bicelles |
| Software, algorithm | NMRFAM-SPARKY | Lee et al., 2015 | http://pine.nmrfam.wisc.edu/download_packages.html | Analysis of NMR spectra |
| Software, algorithm | PISA-SPARKY | Weber et al., 2020a | http://veglia.chem.umn.edu/software-downloads | Model fitting of SE-SAMPI4 spectra |
| Software, algorithm | NMRPipe | Delaglio et al., 1995 | https://www.ibbr.umd.edu/nmrpipe/ | NMR time-domain processing |
| Software, algorithm | Nmrglue | Helmus and Jaroniec, 2013 | https://www.nmrglue.com/ | NMR spectra plotting, visualization |
| Software, algorithm | MD2SLF | Weber and Veglia, 2020 | http://veglia.chem.umn.edu/software-downloads | MD-based prediction of SE-SAMPI4 spectra |
| Software, algorithm | PyMOL 2.3.0 | Schrödinger | https://pymol.org/2/ | Molecular visualization |
| Software, algorithm | VMD 1.9.3 | Humphrey et al., 1996 | http://www.ks.uiuc.edu/Research/vmd/ | Analysis of MD trajectories |
| Software, algorithm | CHARMM-GUI Membrane Builder | Wu et al., 2014 | http://www.charmm-gui.org/ | Building of unbiased MD simulations |
| Software, algorithm | MODELLER | Webb and Sali, 2016 | https://salilab.org/modeller/ | Missing loop construction in models |
| Software, algorithm | AMBER18 and AMBERTools18 | Case et al., 2018 | https://ambermd.org/ | Unbiased simulations of PLN |
| Software, algorithm | CPPTraj (included in AMBERTools18) | Roe and Cheatham, 2013 | https://ambermd.org/ | Principal component analysis |
| Software, algorithm | GROMACS 4.6.7 | Abraham et al., 2015 | http://www.gromacs.org/ | RAOR-MD and analysis |
| Software, algorithm | RAOR-MD plugin for GROMACS 4.6.7 | De Simone et al., 2014 | https://github.com/maximosanz/modelSSNMR Sanz-Hernández, 2021 (copy archived at swh:1:rev:c930a2995a0f2af0e02661d4816fa64cfd8bfe38) | Plugin for implementing |
Additional files
Download links
A two-part list of links to download the article, or parts of the article, in various formats.
Downloads (link to download the article as PDF)
Open citations (links to open the citations from this article in various online reference manager services)
Cite this article (links to download the citations from this article in formats compatible with various reference manager tools)
Structural basis for allosteric control of the SERCA-Phospholamban membrane complex by Ca2+ and phosphorylation
eLife 10:e66226.
https://doi.org/10.7554/eLife.66226


