Diverse inhibitory projections from the cerebellar interposed nucleus
- Department of Physiology and Biophysics, University of Colorado School of Medicine, Anschutz Medical Campus, United States
Figures
Figure 1 with 5 supplements

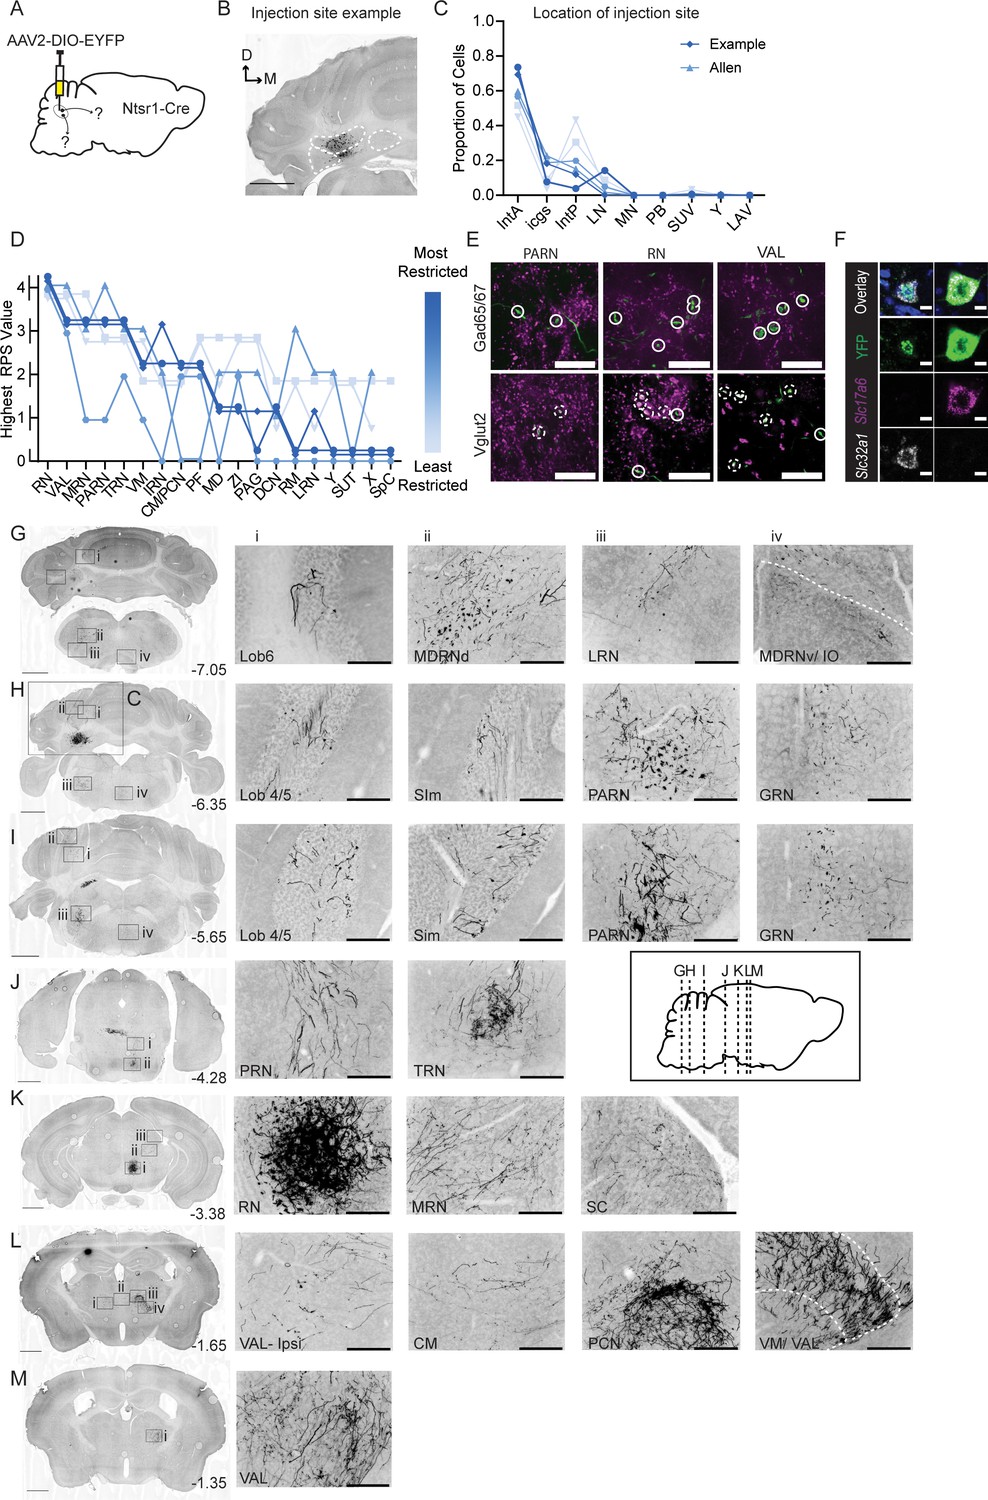
Anterograde tracing of Int-Vgat neurons.
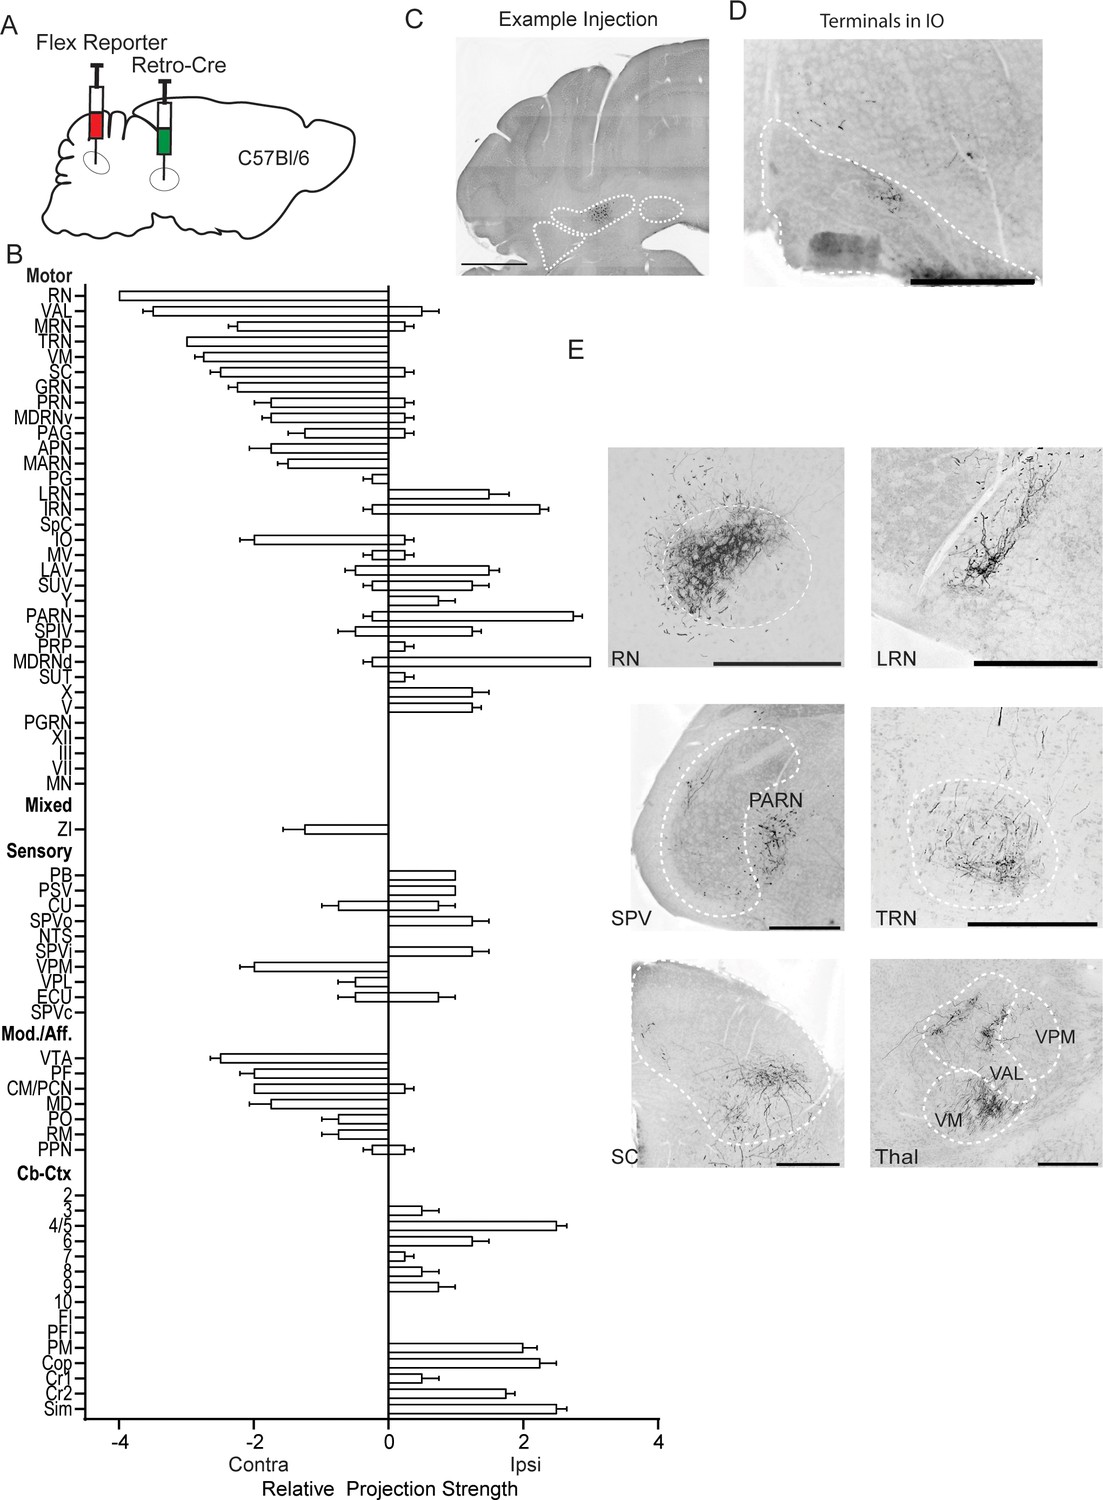
(A) Schematic of injection scheme. (B) Example injection site of AAV2-EF1a-DIO-eYFP. The three main CbN are outlined in white (lateral nucleus (LN), interposed (IN), and medial nucleus (MN) from left to right). Images oriented so that the dorsal-ventral axis runs up/down and the medial/lateral axis runs right/left; right of midline is contralateral. (C) Location of labeled cells by injection into Int of Vgat-Cre mice. Specimens are color-coded by the proportion of cells labeled in anterior interposed (IntA) where the highest proportion corresponds to darkest color. (D) Mapping of terminal fields based on restriction of injection site to IntA. The highest unilateral relative projection strength (RPS) in each region is plotted for all specimens included in analysis. The values are always assigned as integers but are offset here so overlap can be better appreciated. (E) YFP-positive terminals (green) in inferior olive (IO), spinal trigeminal nuclei (SPVc), pontine grey (PG), and red nucleus (RN) are stained for antibodies against Gad65/67 (top) and Vglut2 (bottom; magenta). Dashed circles indicate colocalized terminals while solid lines indicate a lack of colocalization observed in the two channels. Scale bars=20 µm. (F) Example cells from in situ hybridization showing clear overlap with an mRNA probe against Slc32a1 (Vgat) and no overlap with an mRNA probe against Slc17a6 (Vglut2). Scale bars=10 µm. (G) Projection targets in caudal cerebellum and brainstem (B-7.45). Boxes expanded in (i–iii) (top) or (i–iii’) (bottom). (H) Projection targets within the intermediate cerebellum (B-6.35). Injection site depicted in (C). (I) Projection targets within rostral brainstem (B-4.95). (J) Projection targets in the caudal midbrain (B-3.93). (K) Projection targets to the rostral midbrain (B-3.93). Scale bars (C, G–K) =1 mm and (i–iii) 200 µm. The inset (black border) depicts the location of coronal sections shown in (G–K) along a parasagittal axis. Cuneate nucleus (CU), gigantocellular reticular nucleus (GRN), hypoglossal nucleus (XII), intermediate reticular nucleus (IRN), interstitial cell groups (icgs), lateral reticular nucleus (LRN), lateral vestibular nucleus (LAV), midbrain reticular nucleus (MRN), motor nucleus of the trigeminal (V), nucleus prepositus (PRP), Nucleus Y (Y), oculomotor nucleus (III), parabrachial (PB), paraflocculus (PFl), paragigantocellualr reticular nucleus (PGRN), periaqueductal grey (PAG), principle sensory nucleus of the trigeminal (PSV), pontine reticular nucleus (PRN), posterior interposed (IntP), spinal trigeminal nucleus, caudal/interpolar subdivision (SPVc/i), spinal vestibular nucleus (SPIV), superior vestibular nucleus (SUV), and tegmental reticular nucleus (TRN).
Figure 1—figure supplement 1
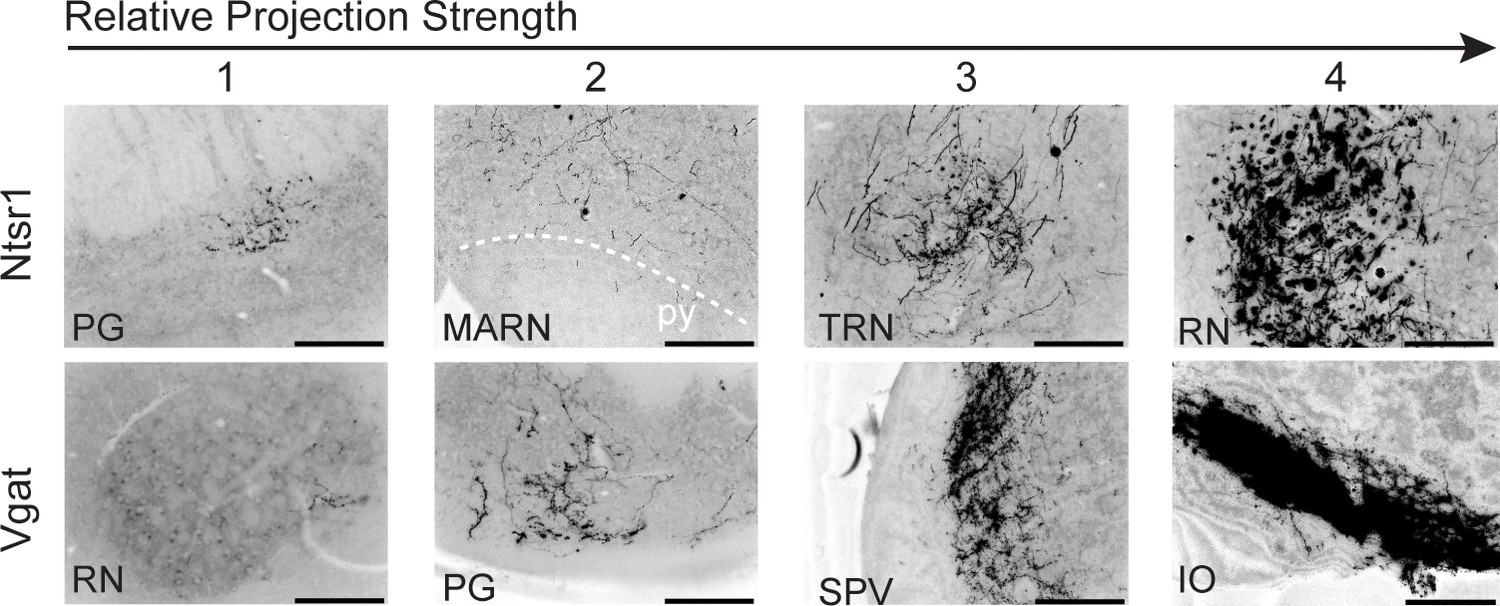
Example of semiquantitative scoring method of terminal field extent and density in Ntsr1 and Vgat-Cre mice.
Top numbers indicate examples scoring ranging from 1 (sparse) to 4 (dense) innervation. Pontine grey (PG), magnocellular reticular nucleus (MARN), tegmental reticular nucleus (TRN), red nucleus (RN), spinal trigeminal nucleus (SPV), and inferior olive (IO).
Figure 1—figure supplement 2
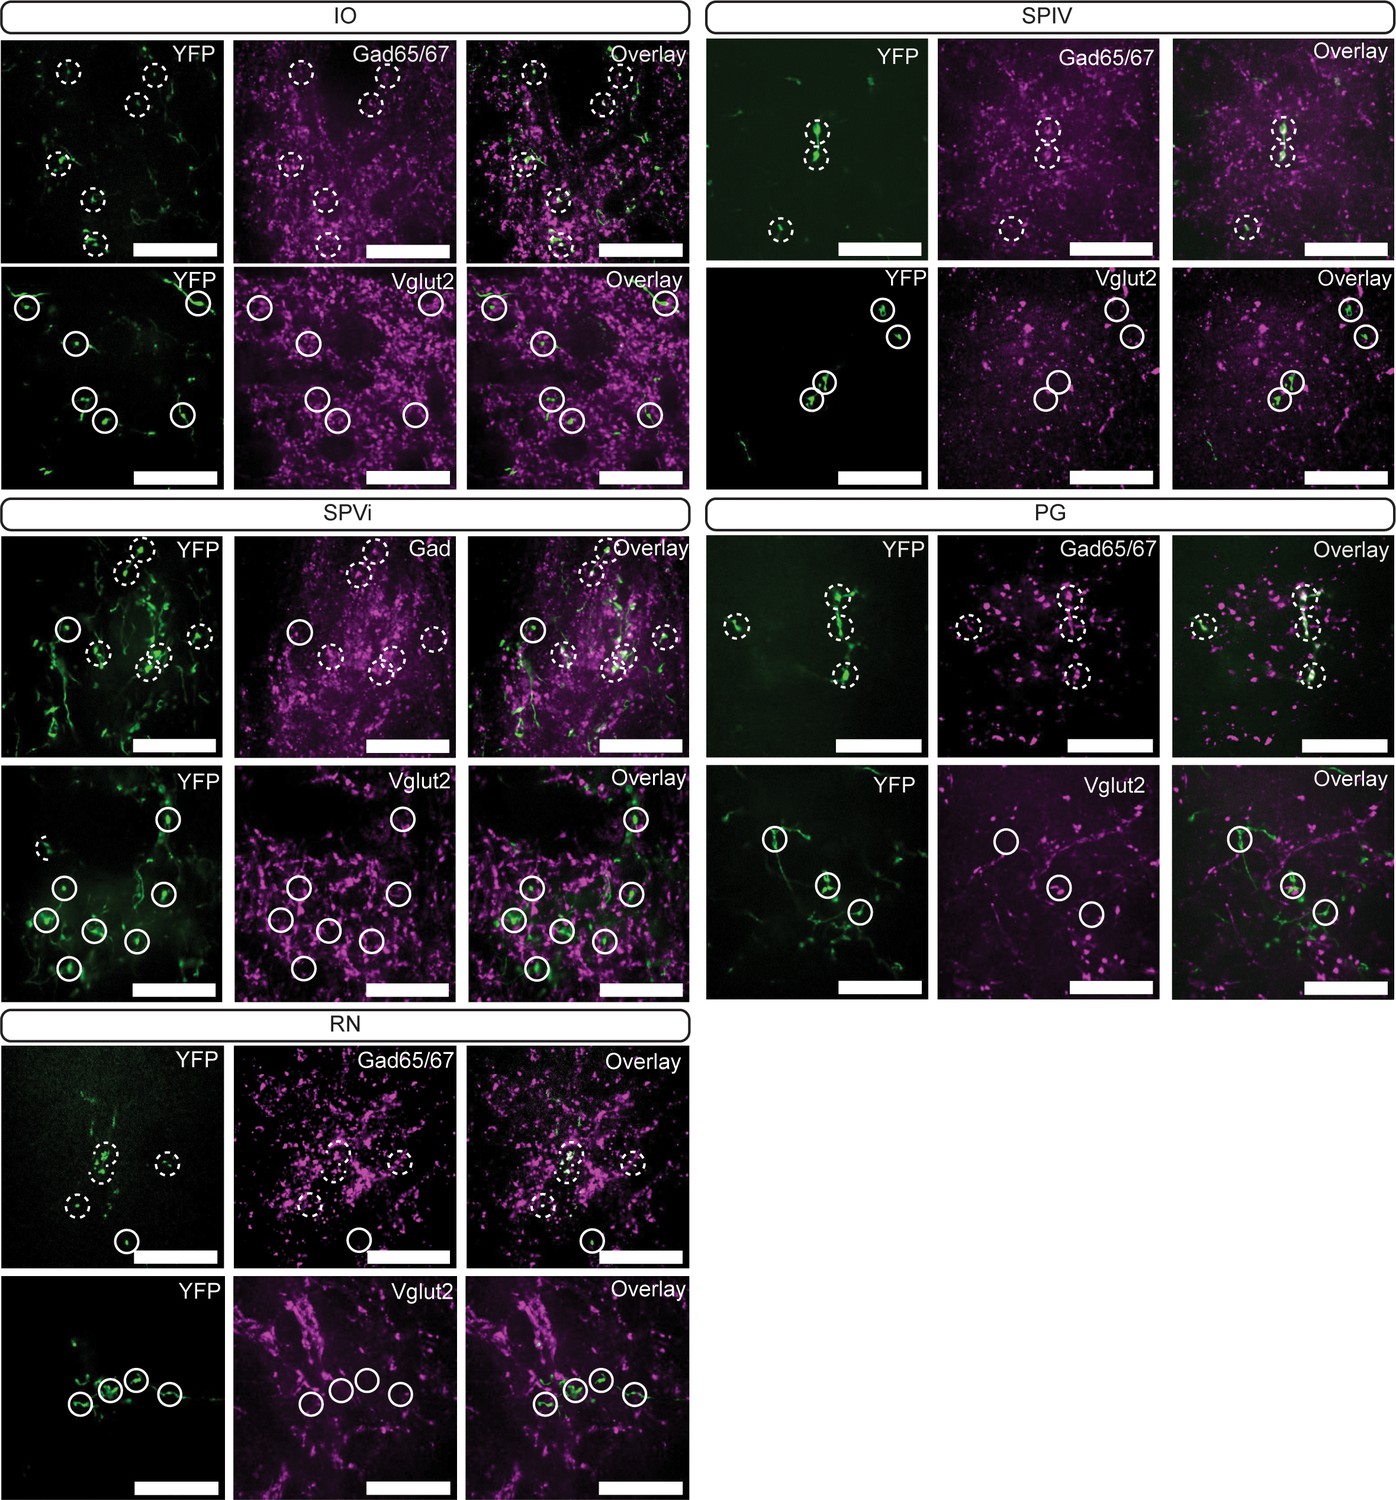
Immunoreactivity of Vgat-Cre terminal varicosities.
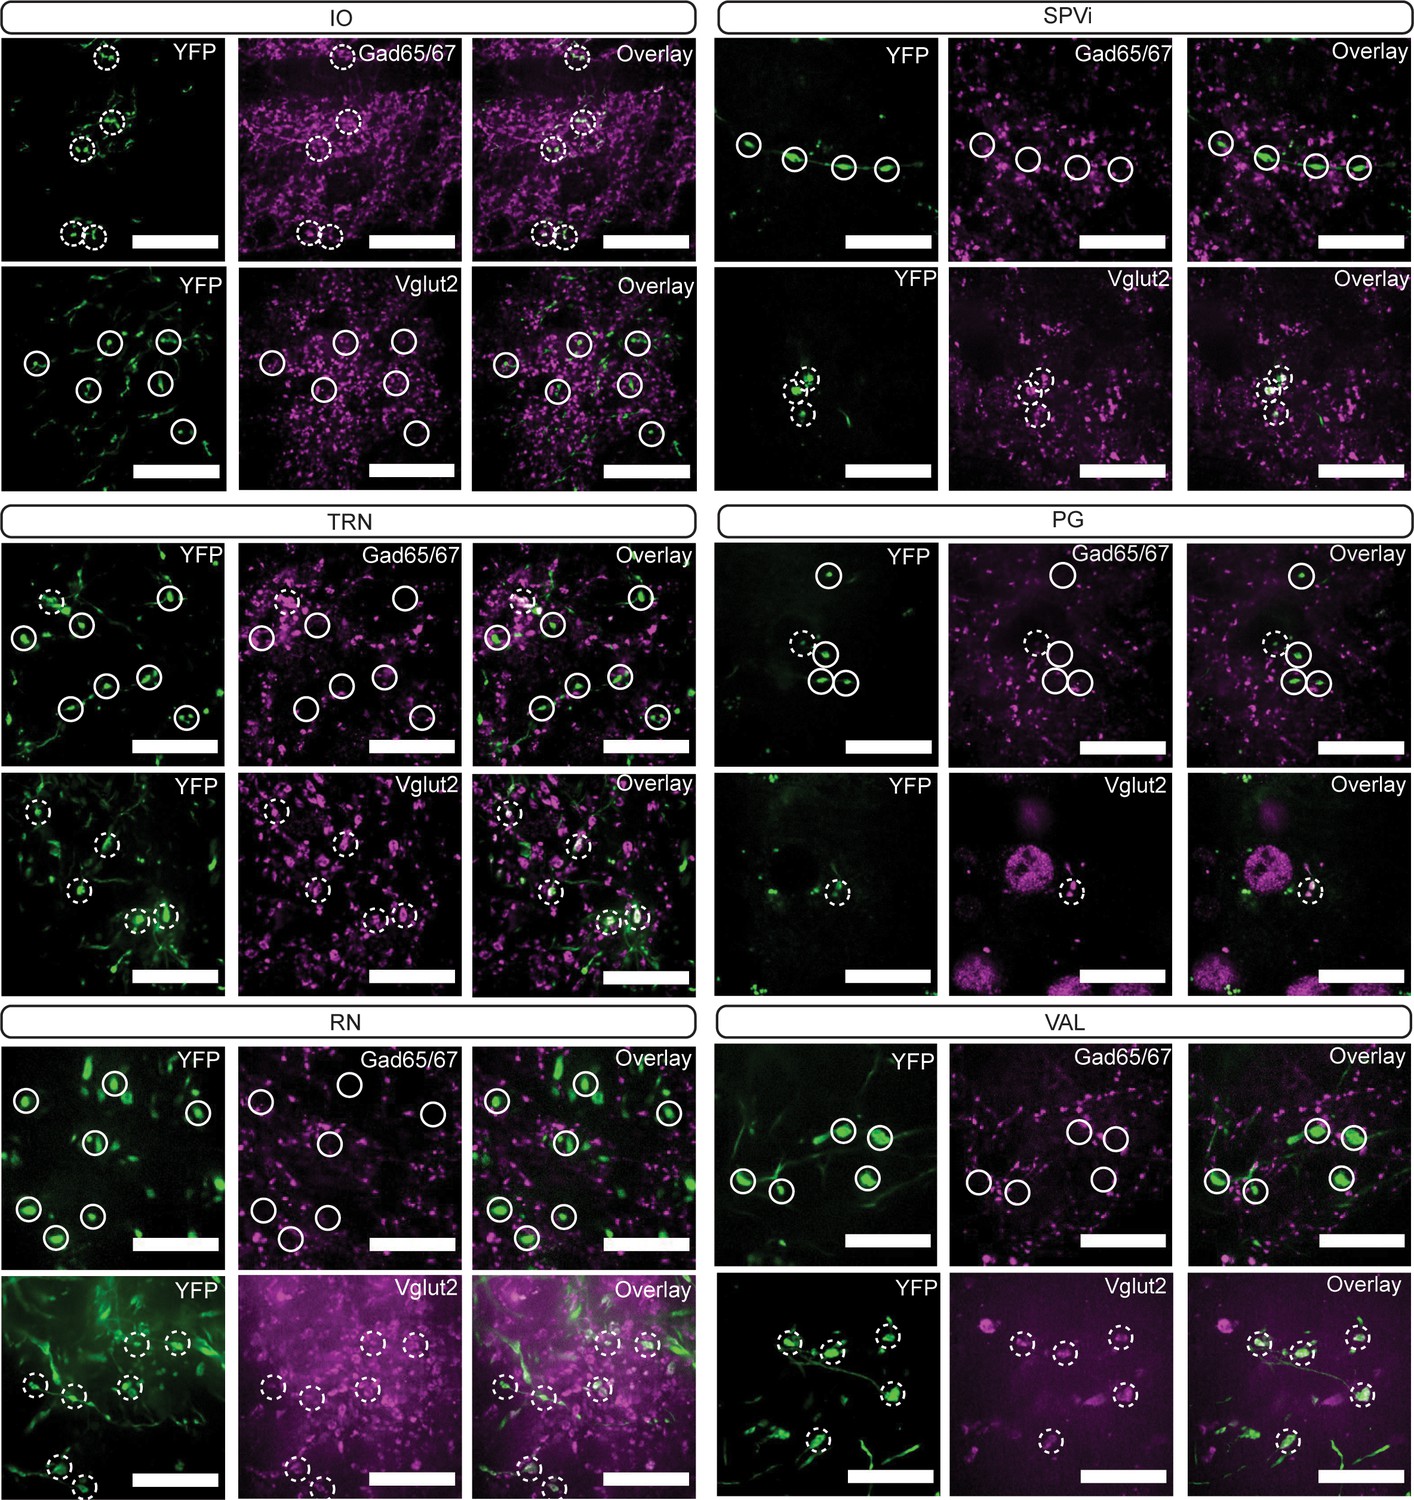
YFP-positive terminals (green, left) in inferior olive (IO), spinal vestibular nucleus (SPIV), spinal trigeminal nuclei, interpolar (SPVi), pontine grey (PG), and red nucleus (RN) are stained for antibodies against Gad65/67 (top row; magenta; middle top) and Vglut2 (bottom row; magenta; middle bottom). Dashed circles indicate colocalized terminals while solid lines indicate a lack of colocalization observed in the two channels. Scale bars=20 µm.
Figure 1—figure supplement 3
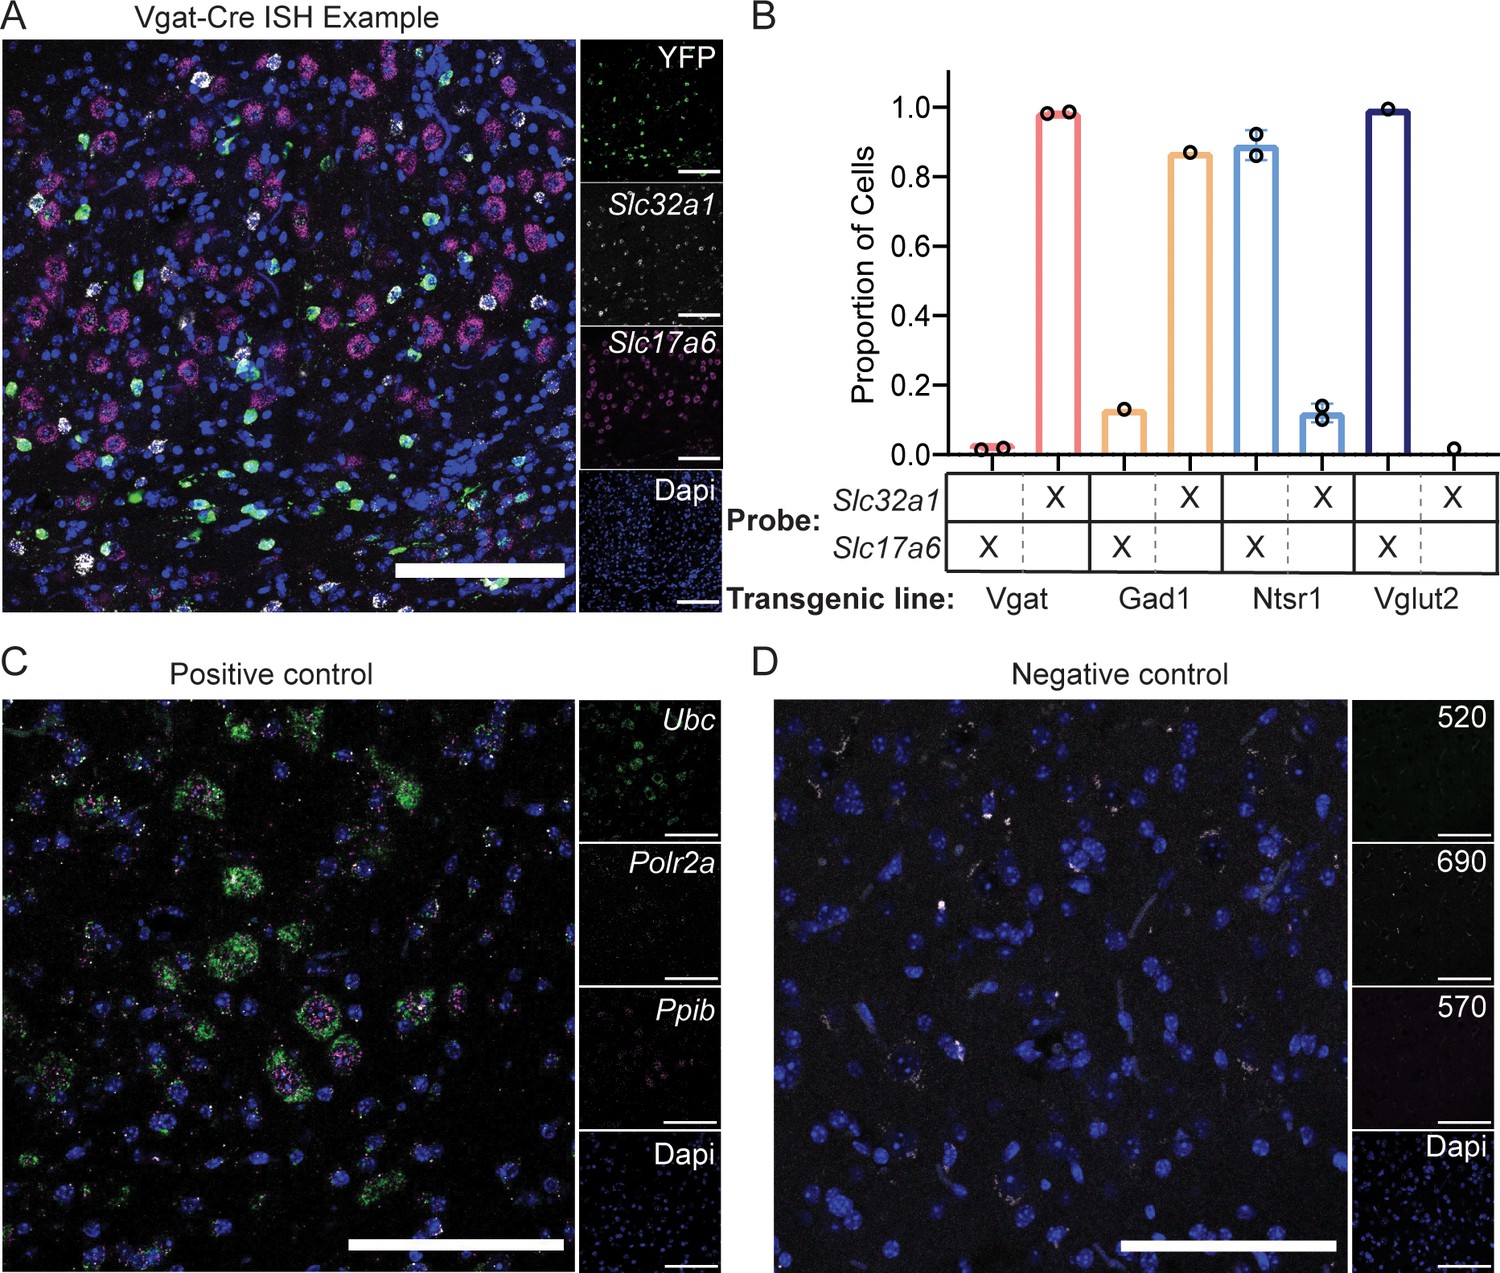
In situ hybridization (ISH) methods and analysis.
(A) Example image of ISH images used for analysis. YFP-expressing cells (green; Opal 520) in a Vgat-Cre mouse colocalize with cells stained using an mRNA probe against Slc32a1 (Vgat; white; Opal 690), but do not colocalize with an mRNA probe against Slc17a6 (Vglut2; magenta; Opal 570). Cellular nuclei are stained with Dapi (blue). Scale bars=200 µm. (B) Quantification of colocalization of YFP expressing cells in four transgenic mouse lines Vgat-Cre, Gad1-Cre, Ntsr1-Cre, and Vglut2-Cre with mRNA probes against Slc32a1 (Vgat) and Slc17a6 (Vglut2). (C) RNAScope positive controls UBC (highest expressor; green; Opal 520 dye), POLR2A (lowest expressor; white; Opal 690 dye), PPIB (medium expressor; magenta; Opal 570 dye), and Dapi (blue) are shown to the right. Scale bars=100 µm. (D) RNAScope negative controls (DapB; Opal 520 dye) with additional Opal dyes (570 and 690) incubated with tissue. Scale bars=100 µm.
Figure 1—figure supplement 4

Gad1-Cre localized to mulitple cellular phenotypes in Int.
(A) Schematic representation of experiment. (B) Example cells from in situ hybridization showing overlap with mRNA probes against Slc32a1 (Vgat) and Slc17a6 (Vglut2). Scale bars=10 µm. (C) YFP-positive terminals (green) in cuneate nucleus (CU), inferior olive (IO), superior colliculus (SC), red nucleus (RN), and ventral anterior-lateral complex of the thalamus (VAL) are stained for antibodies against Gad65/67 (top; magenta) and Vglut2 (bottom; magenta). Dashed circles indicate colocalized terminals while solid lines indicate a lack of colocalization observed in the two channels. Scale bars=20 µm.
Figure 1—figure supplement 5

Example projections from an IntA restricted Int-Vgat specimen.
(A) Example injection site. Scale bars=1 mm. (B) Terminal contacts in ipsilateral (left) and contralateral (right) dorsal subnucleus of the inferior olive (IO). Scale bars=500 µm (top) and 100 µm (bottom). (C) Terminal contacts in the superior vestibular nucleus (SUV), pontine grey (PG), tegmental reticular nucleus (TRN), and pontine reticular nucleus (PRN). Arrows denote example terminal varicosities on axonal processes. Scale bars=100 µm.
Figure 2 with 1 supplement

Intersectional labeling of IO-projecting Int-Vgat neurons (IntIO-Vgat) and comparison with Int-Vgat.
(A) Schematic of experiment. (B) Example injection site of AAV8.hSyn.Con/Fon.hChR2.EYFP in a Vgat-Cre mouse. The three main CbN are outlined in white (lateral nucleus (LN), interposed (IN), and medial nucleus (MN) from left to right). Images oriented as in Figure 1. Scale bars=1 mm. (C) Location of labeled cells by injection of Retro-Flp to the contralateral inferior olive (IO) and Con/Fon-YFP into Int of Vgat-Cre mice. Specimens are color-coded by the proportion of cells labeled in anterior interposed (IntA) where the highest proportion corresponds to darkest color. (D) Graphical representation of average projection strength in all targeted regions for IntIO-Vgat (n=5; maroon) and Int-Vgat (n=6; white) mice. See the list of abbreviations for complete listing. (E) Mapping of terminal fields based on restriction of injection site to IntA. The highest unilateral RPS in each region is plotted for all specimens included in analysis. The values are always assigned as integers but are offset here so overlap can be better appreciated. (F) Example terminal fields within the (IO) and red nucleus (RN) bilaterally, lateral reticular nucleus (LRN), pontine grey (PG), tegmental reticular nucleus (TRN), and spinal vestibular nucleus (SPIV). Scale bars=200 µm. External cuneate nucleus (ECU), hypoglossal nucleus (XII), interstitial cell groups (icgs), lateral vestibular nucleus (LAV), magnocellular reticular nucleus (MARN), Nucleus Y (Y), oculomotor nucleus (III), parabrachial (PB), periaqueductal grey (PAG), pontine reticular nucleus (PRN), posterior interposed (IntP), spinal trigeminal nuclei, interpolar (SPVi), spinal vestibular nucleus (SPIV), superior vestibular nucleus (SUV), and zona incerta (ZI).
Figure 2—figure supplement 1

Viral control injections.
(A) Example injection site (top) of AAV2.DIO.EYFP into a wild-type (C57Bl/6) mouse. Black arrowhead denotes singular fluorescent cell. (B) Example injection site of TVA, oG, and EnvA-ΔG-Rabies into a wild-type (C57Bl/6) mouse. Fewer than 10 cells were identified (denoted by black arrow heads) throughout the injection site location, but no retrogradely labeled cells outside of the cerebellar nuclei (CbN) were identified. (C) Example injection of Con/Fon-EYFP into Int of a wild-type (C57Bl/6) mouse after introduction of Retro.Flp to the contralateral inferior olive (IO). No cells were detected, though some tissue disruption/autofluorescence was noted. (D) Example injection of Con/Fon-EYFP into a Gad1-Cre mouse. No cells were detected.
Figure 3 with 2 supplements
Anterograde tracing of Int-Ntsr1 neurons.
(A) Schematic representation of injection scheme. (B) Example injection site of AAV2-EF1a-DIO-eYFP. The three main CbN are outlined in white (Lateral nucleus (LN), interposed (IN), and medial nucleus (MN) from left to right). Images oriented as in Figure 1. (C) Distribution of labeled cells by injection into Int of Ntsr1-Cre mice. Specimens are color-coded by the proportion of cells labeled in anterior interposed (IntA) where the highest proportion corresponds to darkest color. (D) Mapping of terminal fields based on restriction of injection site to IntA. The highest unilateral RPS in each region is plotted for all specimens included in analysis. The values are always assigned as integers but are offset here so overlap can be better appreciated. (E) YFP-positive terminals (green) in parvicellular reticular nucleus (PARN), red nucleus (RN), and ventral anterior-lateral complex of the thalamus (VAL) are stained for antibodies against Gad65/67 (top; magenta) and Vglut2 (bottom; magenta). Dashed circles indicate colocalized terminals while solid lines indicate a lack of colocalization observed in the two channels. Scale bars=20 µm. (F) Example cells from in situ hybridization showing overlap with both an mRNA probe against Slc32a1 (Vgat) and Slc17a6 (Vglut2). Scale bars=10 µm. (G) Projection targets in caudal cerebellum and brainstem (B-7.05). Boxes expanded in (i–iv). (H) Projection targets within the intermediate cerebellum (B-6.35). Injection site depicted in (C). (I) Projection targets within and ventral to the anterior cerebellum (B-5.65). (J) Projection targets to pontine nuclei (B-4.25). (K) Projection targets in the rostral midbrain (B-3.38). Note the dense terminals in RN. (L) Projection targets to the caudal thalamus (B-1.65). (M) Projection targets to the rostral thalamus (B-1.35). Scale bars (C, G–M) =1 mm and (i–iv) 200 µm. The inset (black border) depicts the location of coronal sections shown in (G–M) along a parasagittal axis. Centromedial nucleus of the thalamus (CM), cuneate nucleus (CU), gigantocellular reticular nucleus (GRN), inferior olive (IO), intermediate reticular nucleus (IRN), interstitial cell groups (icgs), lateral reticular nucleus (LRN), lateral vestibular nucleus (LAV), mediodorsal nucleus of the thalamus (MD), medullary reticular nucleus, dorsal/ventral subdivision (MDRNd/v), midbrain reticular nucleus (MRN), nucleus raphe magnus (RM), nucleus X (X), nucleus Y (Y), parabrachial (PB), paracentral nucleus of the thalamus (PCN), parafascicular nucleus (PF), periaqueductal grey (PAG), pontine reticular nucleus (PRN), posterior interposed (IntP), simplex lobule (Sim), superior colliculus (SC), superior vestibular nucleus (SUV), supratrigeminal nucleus (SUT), spinal cord (SpC), tegmental reticular nucleus (TRN), ventromedial nucleus (VM), and zona incerta (ZI).
Figure 3—figure supplement 1
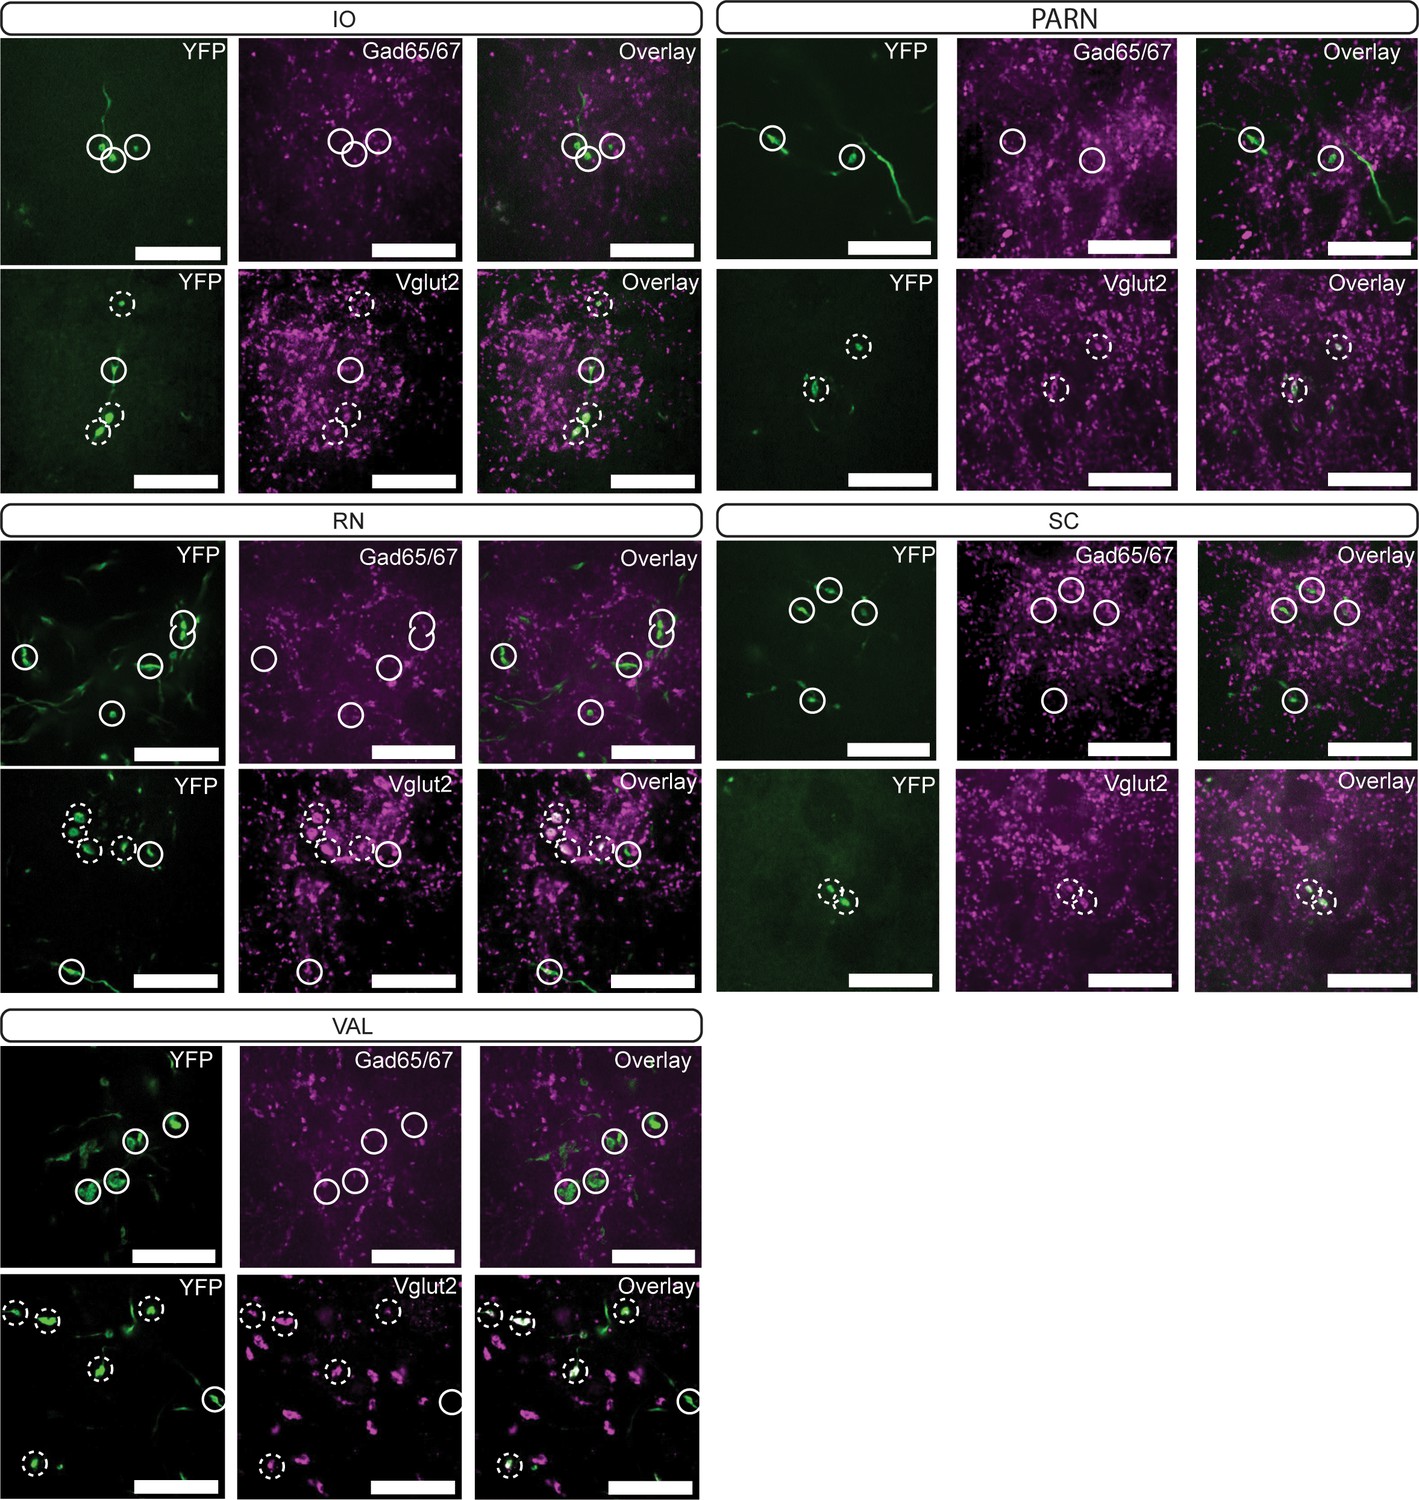
Immunoreactivity of Ntsr1-Cre terminal varicosities.
YFP-positive terminals (green, left) in inferior olive (IO), vestibular nuclei (VEST), spinal trigeminal nuclei (SPV), pontine grey (PG), and red nucleus (RN) are stained for antibodies against Gad65/67 (top row; magenta; middle) and Vglut2 (bottom row; magenta; middle). Dashed circles indicate colocalized terminals while solid lines indicate a lack of colocalization observed in the two channels. Scale bars=20 µm.
Figure 3—figure supplement 2

Int-Ntsr1 neurons (green) target tyrosine hydroxylase (TH; magenta) expressing neurons in the ventral tegmental area (VTA).
Scale bars=100 µm.
Figure 4 with 2 supplements
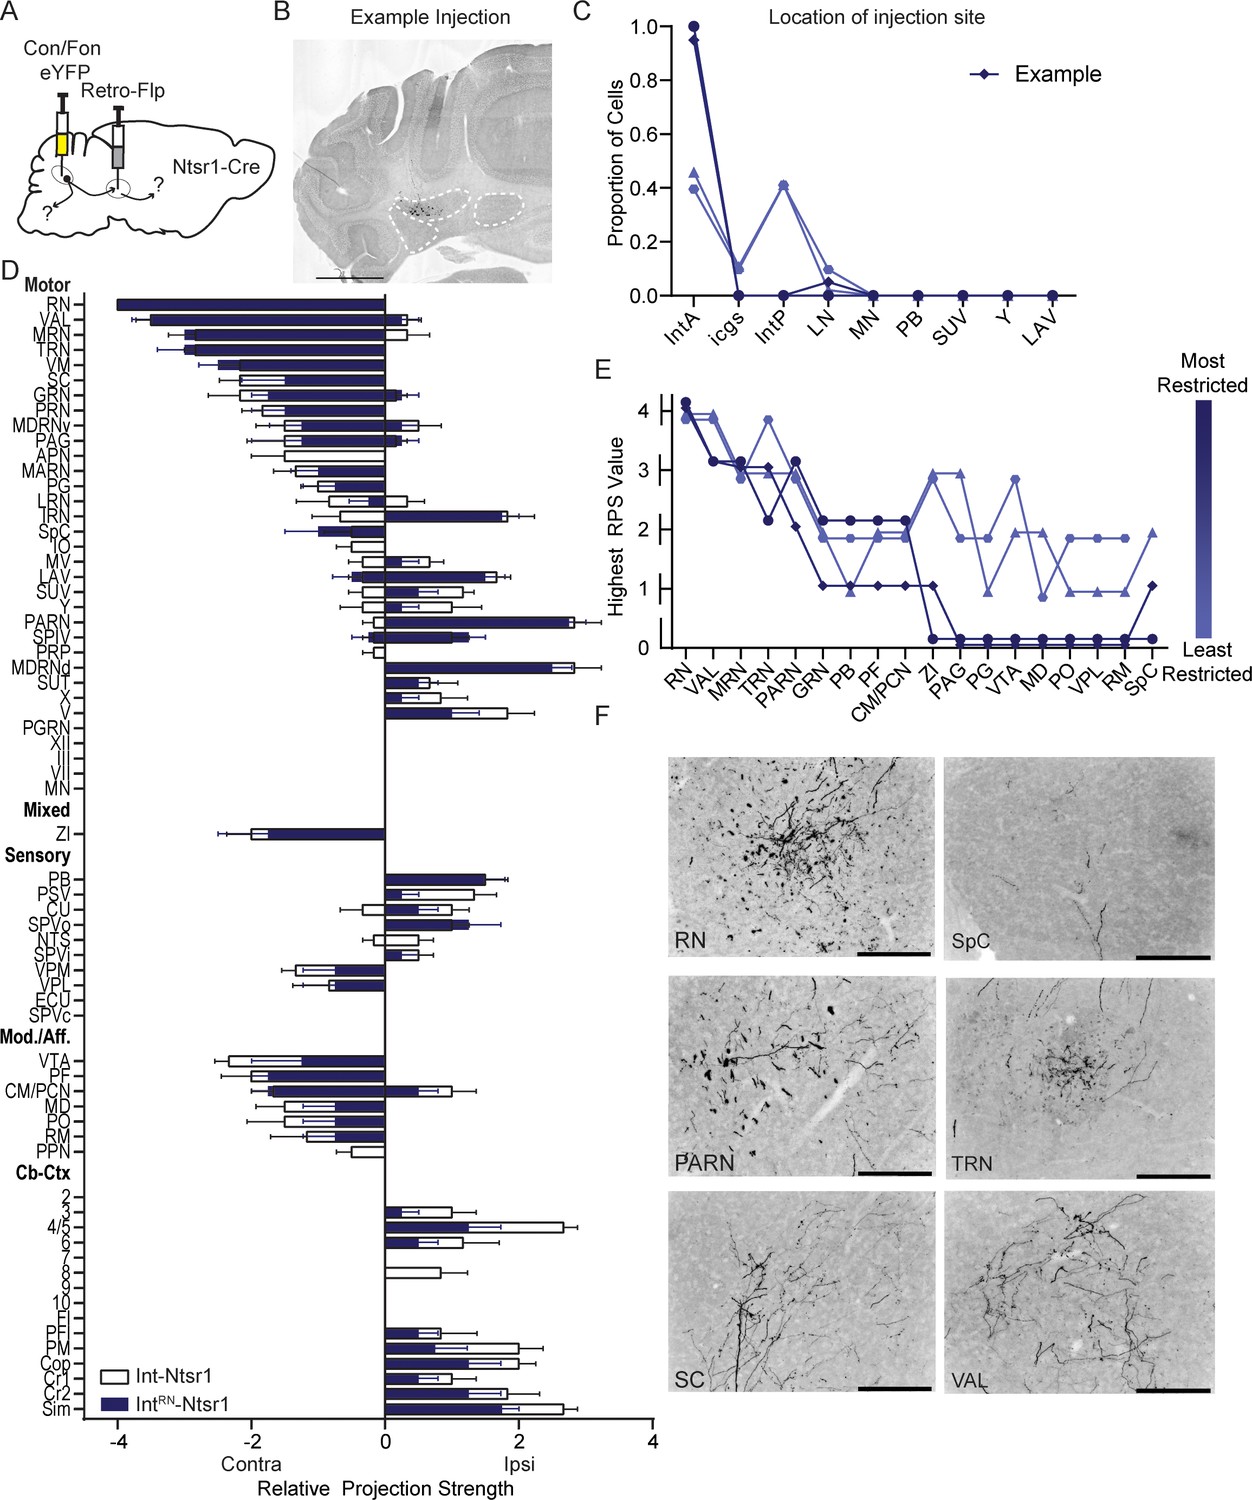
Intersectional labeling of RN-projecting Int-Ntsr1 neurons (IntRN-Ntsr1).
(A) Schematic of experiment. (B) Example injection site of AAV8.hSyn.Con/Fon.hChR2.EYFP in an Ntsr1-Cre mouse. The three main CbN are outlined in white (lateral nucleus (LN), interposed (IN), and medial nucleus (MN) from left to right). Images oriented so right of midline is contralateral. Scale bars=1 mm. (C) Location of labeled cells by injection of Retro-Flp to the contralateral red nucleus (RN) and Con/Fon-YFP into Int of Ntsr1-Cre mice. Specimens are color-coded by the proportion of cells labeled in anterior interposed (IntA) where the highest proportion corresponds to darkest color. (D) Graphical representation of average projection strength in all targeted regions for IntRN-Ntsr1 (n=4; navy) and Int-Ntsr1 (n=6; white) mice. See the list of abbreviations for complete listing. (E) Mapping of terminal fields based on restriction of injection site to IntA. The highest unilateral RPS in each region is plotted for all specimens included in analysis. The values are always assigned as integers but are offset here so overlap can be better appreciated. (F) Example terminal fields within the red nucleus (RN), spinal cord (SpC), parvicellular reticular nucleus (PARN), tegmental reticular nucleus (TRN), superior colliculus (SC), and ventral anterior-lateral complex of the thalamus (VAL). Scale bars=200 µm. Centromedial nucleus of the thalamus (CM), gigantocellular reticular nucleus (GRN), inferior olive (IO), intermediate reticular nucleus (IRN), interstitial cell groups (icgs), lateral reticular nucleus (LRN), lateral vestibular nucleus (LAV), mediodorsal nucleus of the thalamus (MD), midbrain reticular nucleus (MRN), motor nucleus of the trigeminal (V), nucleus raphe magnus (RM), nucleus X (X), nucleus Y (Y), parabrachial (PB), paracentral nucleus of the thalamus (PCN), parafascicular nucleus (PF), periaqueductal grey (PAG), pontine grey (PG), pontine reticular nucleus (PRN), posterior complex of the thalamus (PO), posterior interposed (IntP), superior vestibular nucleus (SUV), supratrigeminal nucleus (SUT), tegmental reticular nucleus (TRN), ventral tegmental area (VTA), ventromedial nucleus (VM), ventral posterolateral nucleus of the thalamus (VPL), and zona incerta (ZI).
Figure 4—figure supplement 1
Labeling of RN-projecting Int neurons using viral Cre delivery.
(A) Schematic of experiment. (B) Graphical representation of average projection strength in all targeted regions for Int-RN (n=4). (C) Example injection site in wild-type C57Bl/6 mouse. The three main CbN are outlined in white (lateral nucleus (LN), interposed (IN), and medial nucleus (MN) from left to right). Scale bars=1 mm. Images are oriented as in Figure 1. (D) Example terminal field in the inferior olive (IO). (E) Example terminal fields within the red nucleus (RN), lateral reticular nucleus (LRN), spinal trigeminal nucleus (SPV), parvicellular reticular nucleus (PARN), tegmental reticular nucleus (TRN), superior colliculus (SC), and several subdivisions of the thalamus (THAL). Scale bars=500 µm. Ventral anterior-lateral complex of the thalamus (VAL), ventral medial nucleus of the thalamus (VM), and ventral posteromedial nucleus of the thalamus (VPM).
Figure 4—figure supplement 2
Immunoreactivity of Int-RetroCreRN terminal varicosities.
YFP-positive terminals (green, left) in inferior olive (IO), spinal trigeminal nucleus, interpolar (SPVi), tegmental reticular nucleus (TRN), pontine grey (PG), red nucleus (RN), and ventral anterior-lateral complex of the thalamus (VAL) are stained for antibodies against Gad65/67 (top row; magenta; middle) and Vglut2 (bottom row; magenta; middle). Dashed circles indicate colocalized terminals while solid lines indicate a lack of colocalization observed in the two channels. Scale bars=20 µm.
Figure 5
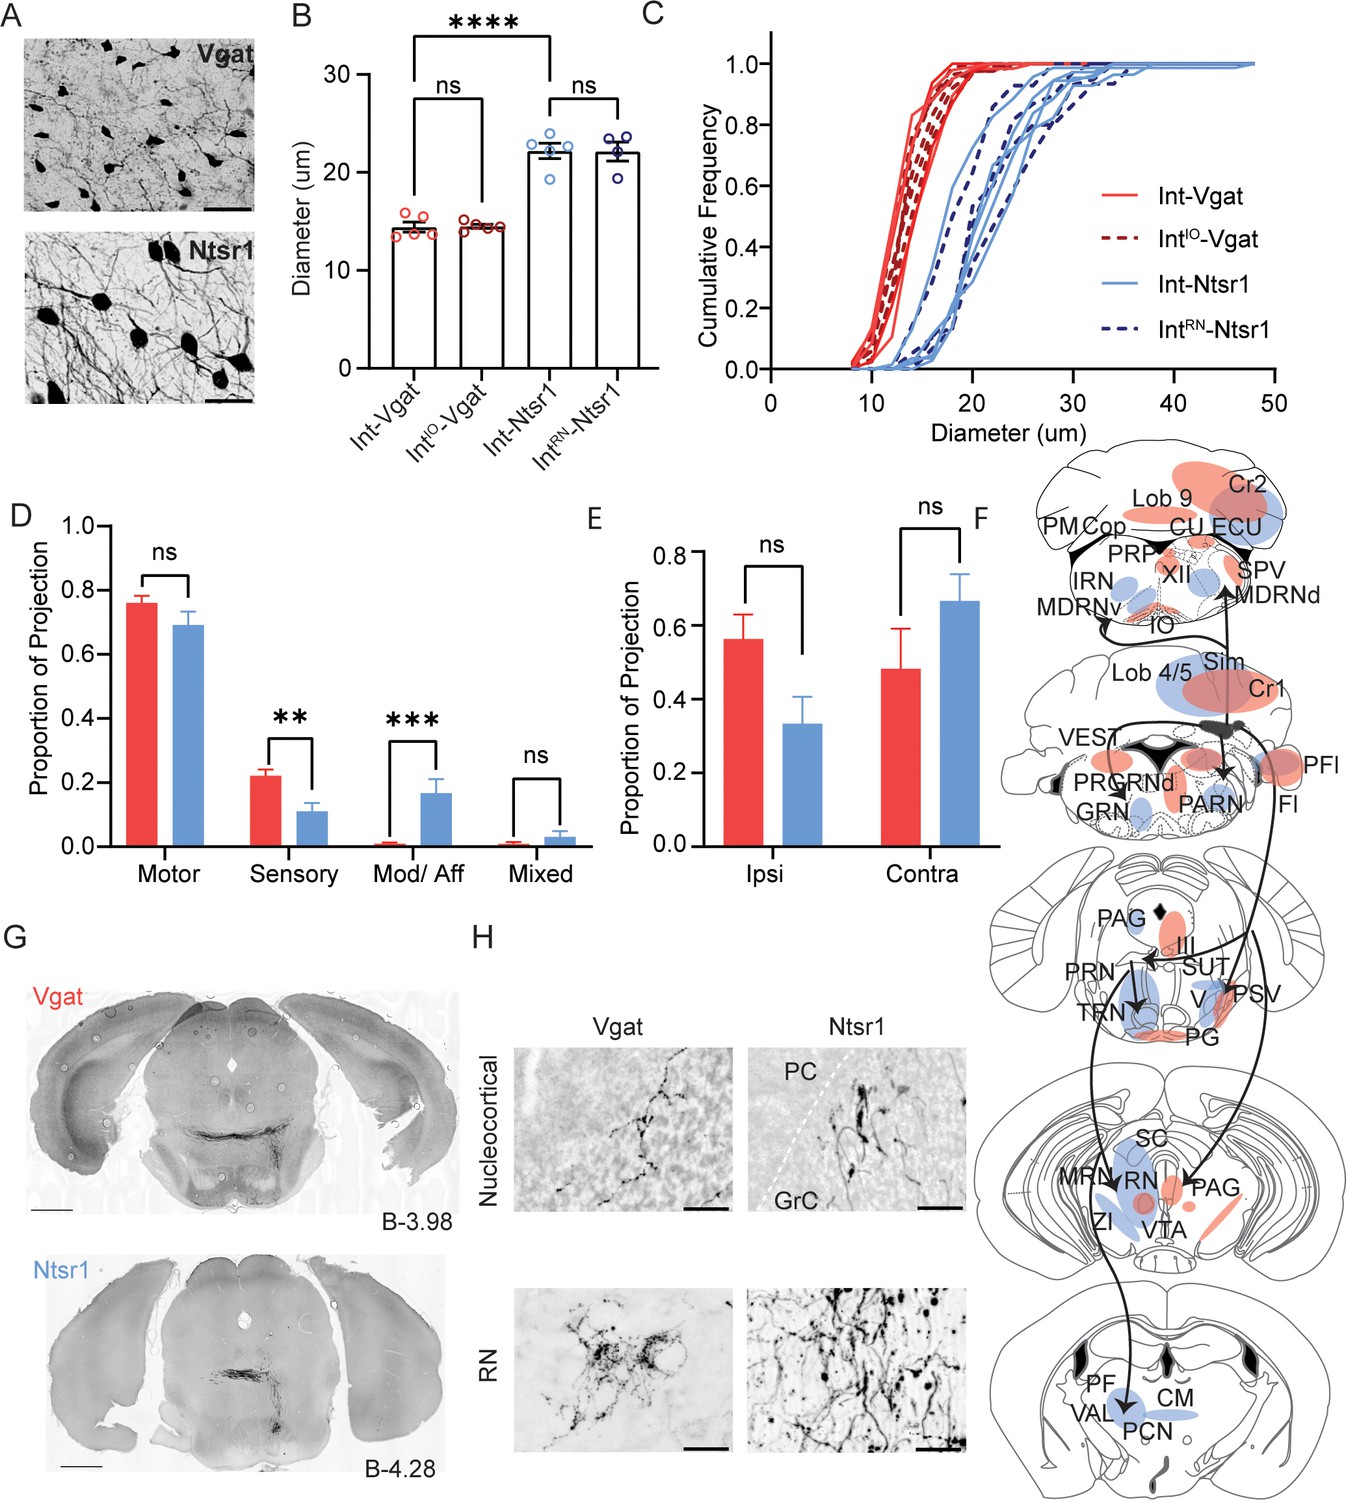
Comparison Int-Vgat and Int-Ntsr1 cell sizes and projection patterns.
(A) Example YFP+ cells in a Vgat-Cre (top) and Ntsr1-Cre (bottom) specimen. Scale bars=50 µm. (B) Differences in soma diameter of neurons based on isolation method. Grand mean ± SEM is plotted; per animal mean is denoted with colored circles (Int-Vgat=red, IntIO-Vgat=maroon, Ntsr1=blue, and IntRN-Ntsr1=navy). Int-Vgat (n=316 cells, 5 mice) or IntIO-Vgat neurons (n=404 cells, 5 mice) are smaller than Int-Ntsr1(n=229 cells, 5 mice) or IntRN-Ntsr1 neurons (n=125 cells, 4 mice; one-way ANOVA; Tukey’s multiple comparison’s test, p<0.0001****). (Note that Int includes all subdivisions of the interposed nucleus and icgs.) (C) Cumulative frequency distribution of measured cell diameter for all specimens. (D) The average proportion of the total (summed) RPS value that is derived from projections to motor, sensory, or modulatory extracerebellar brain regions. Mean and SEM are plotted. Welch’s t-test with FDR correction of 1%, p=0.035 (ns), 0.0014 (**), 0.00023 (***), 0.045 (ns), respectively. (E) Same as (D) but showing the contribution of ipsilateral or contralateral projections to total RPS per transgenic line. Welch’s t-test with FDR correction of 1%, p=0.017 (ns) and 0.16 (ns), respectively. (F) Schematic of projection signatures from Ntsr1-Cre (blue) and Vgat-Cre (red). (G) Axons from Int-Vgat and Int-Ntsr1 follow unique paths through the pontine reticular nuclei (PRN). (H) Morphology differences in terminal contacts within the cerebellar cortex (top; boutons observed within the granule cell (GrC) layer; dotted white line in Nstr1 image denotes Purkinje Cell layer) and red nucleus (RN; bottom). Note mossy fiber nucleocortical terminals seen in Ntrs1-Cre mice but not Vgat-Cre mice. Scale bars=50 µm. Centromedial nucleus of the thalamus (CM), copula (Cop), Crus1 (Cr1) cuneate nucleus (CU), external cuneate nucleus (ECU), flocculus (Fl), gigantocellular reticular nucleus (GRN), hypoglossal nucleus (XII), inferior olive (IO), intermediate reticular nucleus (IRN), lateral reticular nucleus (LRN), lateral vestibular nucleus (LAV), medullary reticular nucleus, dorsal/ventral subdivision (MDRNd/v), midbrain reticular nucleus (MRN), Nucleus Y (Y), nucleus prepositus (PRP), oculomotor nucleus (III), parabrachial (PB), paracentral nucleus of the thalamus (PCN) parafasicular nucleus of the thalamus (PF), paraflocculus (PFl), paragigantocellular reticular nucleus, dorsal (PGRNd), paramedian lobule (PM), parvicellular reticular nucleus (PARN), periaqueductal grey (PAG), pontine grey (PG), pontine reticular nucleus (PRN), principal sensory nucleus of the trigeminal (PSV), simplex lobule (Sim), spinal trigeminal nucleus, caudal/interpolar subdivision (SPVc/i), spinal vestibular nucleus (SPIV), superior colliculus (SC), superior vestibular nucleus (SUV), supratrigeminal nucleus (SUT), superior vestibular nucleus (SUV), tegmental reticular nucleus (TRN), trigeminal motor nucleus (V), ventral tegmental area (VTA), ventromedial nucleus (VM), vestibular nuclei (VEST), and zona incerta (ZI).
-
Figure 5—source data 1
Raw data for Figure 5B,C containing the size (in pixels and microns) of thresholded YFP labeled soma in Int per specimen, data is segregated by transgenic mouse line.
- https://cdn.elifesciences.org/articles/66231/elife-66231-fig5-data1-v2.xlsx
Figure 6 with 1 supplement
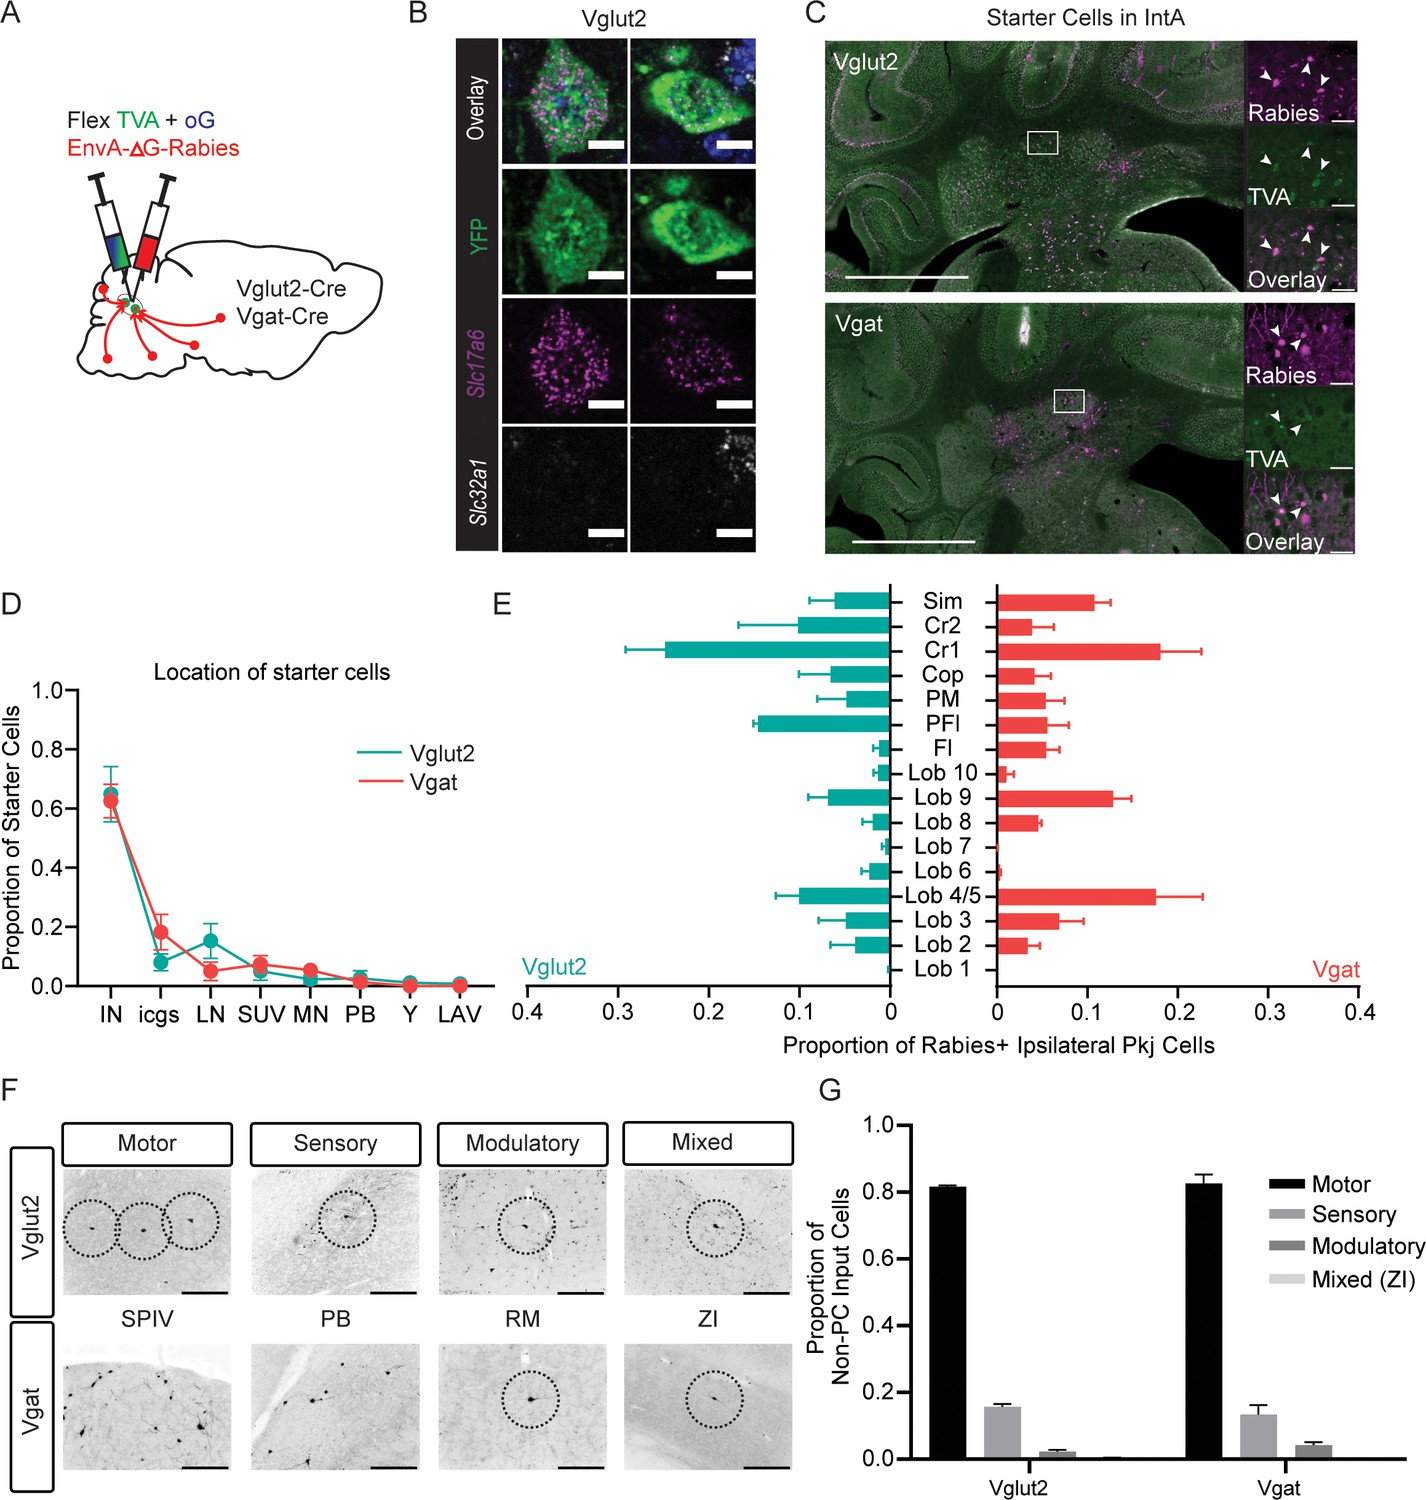
Monosynpatic tracing of inputs to the interposed nucleus.
(A) Schematic of viral experiment. Cells labeled by this method provide monosynaptic input to Int. (B) Example Slc17a6-Cre driven YFP cell following in situ hybridization showing overlap with an mRNA probe against Slc17a6 (Vglut2) and no overlap with an mRNA probe against Slc32a1 (Vgat). Scale bars=10 µm. (C) Example starter cells from both transgenic mouse lines in IntA. Scale bars=1 mm. Insets to the right show rabies (magenta, top), TVA (green channel, top), and overlay (bottom). Scale bars=50 µm. (D) Locations of putative starter cells largely overlap for both cell types (mean + SEM). Note starter label in both IntA and IntP (IN). (E) Location of retrogradely labeled ipsilateral PCs by lobule. (F) Example extracerebellar rabies positive cells in motor (spinal vestibular nuclei, SPIV), sensory (parabrachial, PB), modulatory (raphe magnus, RM), and mixed (zona incerta, ZI) brain regions for both mouse lines. (G) Proportion of non-PC inputs to Vglut2-Cre or Vgat-Cre starter cells separated by modality. Simplex lobule (sim), Crus1 (Cr1), Crus 2 (Cr2), Copula (cop), paramedian lobule (PM), Paraflocculus (PFl), and Flocculus (FL).
Figure 6—figure supplement 1

Summary of monosynaptically labeled inputs to Vglut2 (teal, n=3 mice) and Vgat (red, n=3 mice) neurons in the interposed nucleus from extracerebellar regions.
Mean and standard error are plotted. Note that the cerebellar nuclei included in the motor category did not express TVA and thus were not starter cells. See the list of abbreviations.
Figure 7
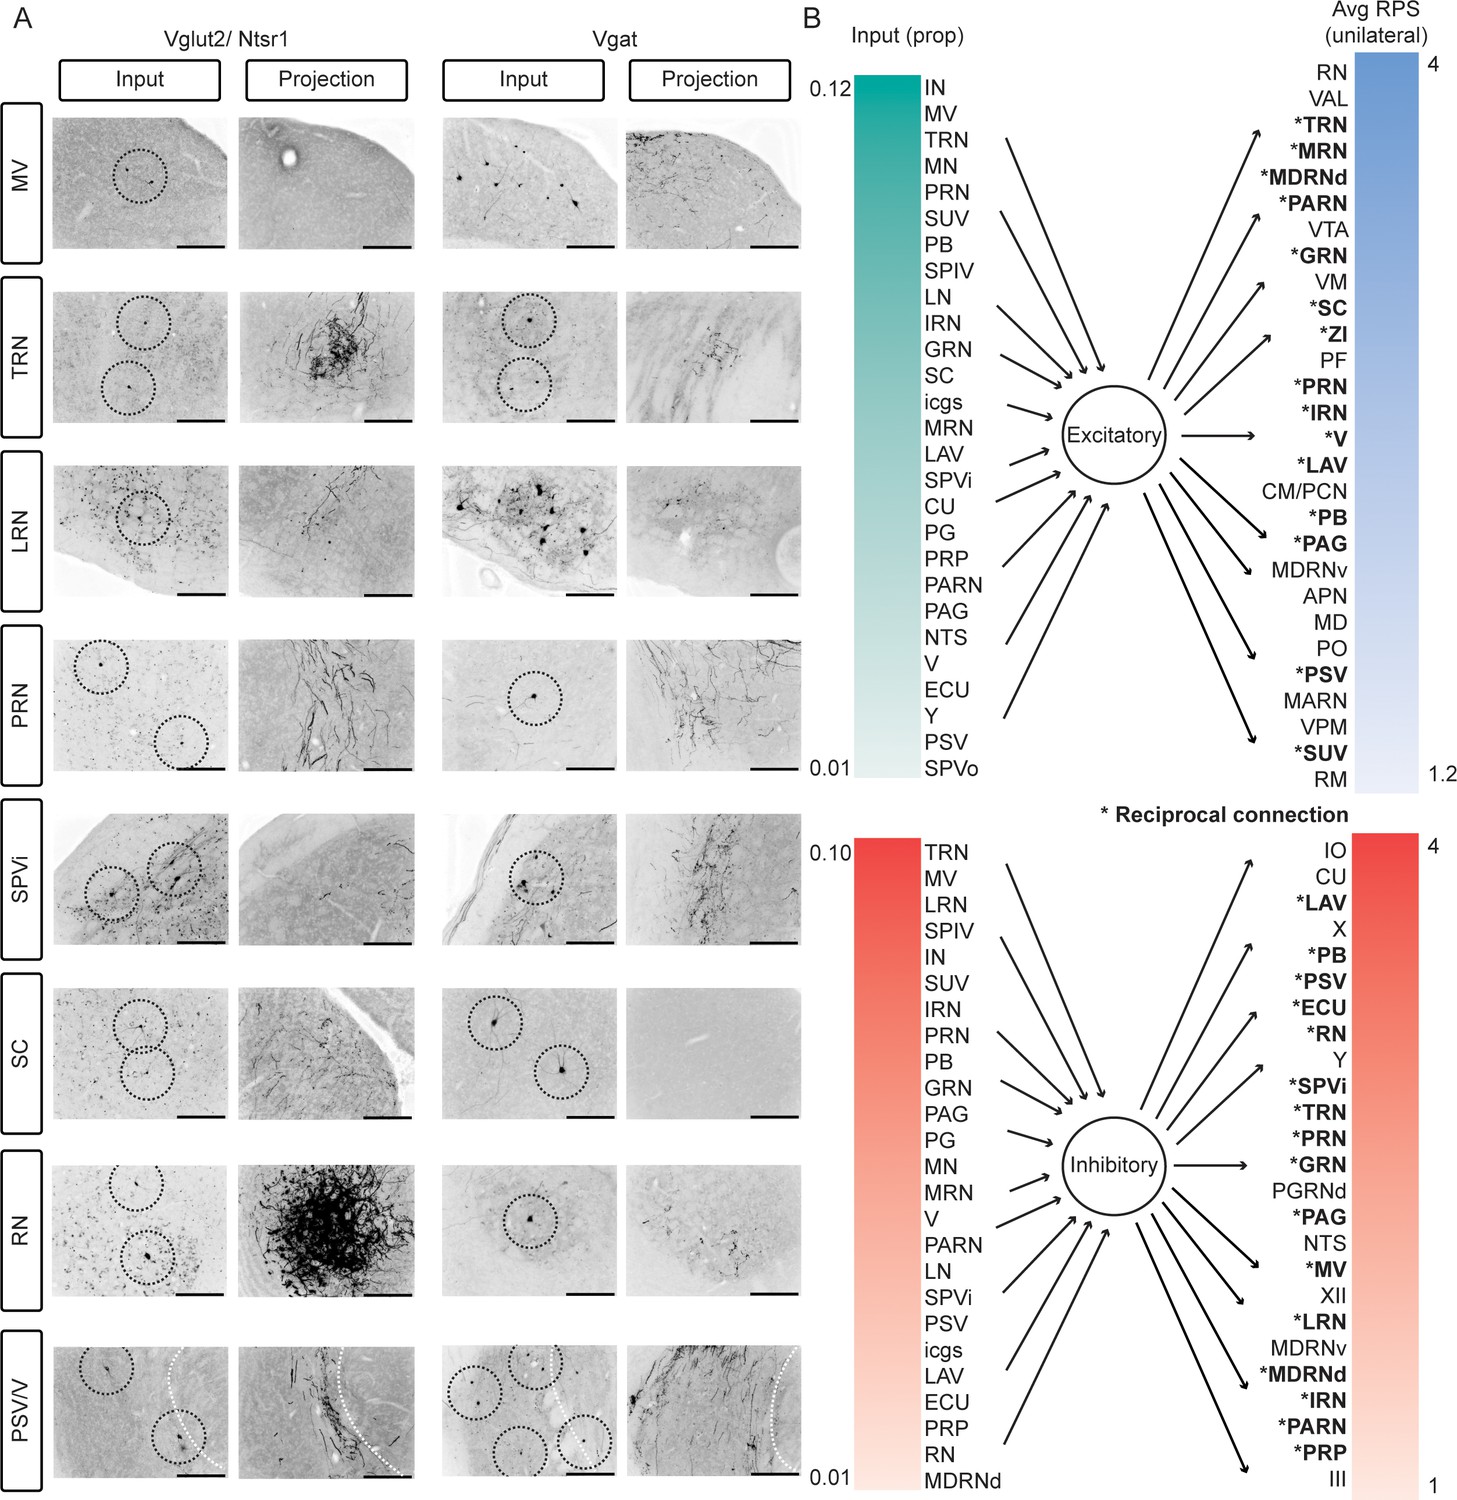
Reciprocal loops between Int and extracerebellar targets, for both Vglut2 and Vgat expressing cells.
(A) Images depicting rabies labeled cells (columns 1 and 3, rabies + cells circled if singular or very small) and projections that included axon varicosities to the same regions at the same coordinates relative to bregma (columns 2 and 4). Medial vestibular nuclei (MV), tegmental reticular nucleus (TRN), lateral reticular nucleus (LRN), pontine reticular nuclei (PRN), spinal trigeminal nucleus, interpolar subdivision (SPVi), superior colliculus (SC), red nucleus (RN), principal sensory nucleus of the trigeminal (PSV), nd motor nucleus of the trigeminal (V). White dotted line denotes boundary between PSV and V. (B) Inputs and outputs listed in order of percent of non-PC rabies labeled cells (left) and relative projection strength (right). Only inputs with greater than 1% of the total extracerebellar rabies labeled cells and regions with mean relative projection strengths greater than 1 are listed. Asterisks denote regions that constituted a major afferent (>1% of the total input) and received a major projection (an RPS>1 in Slc32a1-Cre mice and >1.2 in Ntsr1-Cre mice). Anterior pretectal nucleus (APN), centromedial nucleus of the thalamus (CM), cuneate nucleus (CU), external cuneate nucleus (ECU), gigantocellular reticular nucleus (GRN), hypoglossal nucleus (XII), inferior olive (IO), intermediate reticular nucleus (IRN), interposed nucleus (IN), interstitial cell groups (icgs), lateral nucleus (LN), lateral reticular nucleus (LRN), lateral vestibular nucleus (LAV), magnocellular reticular nucleus (MARN), medial nucleus (MN), medial vestibular nuclei (MV), mediodorsal nucleus of the thalamus (MD), medullary reticular nucleus, dorsal/ventral subdivision (MDRNd/v), midbrain reticular nucleus (MRN), motor nucleus of the trigeminal (V), nucleus of the solitary tract (NTS), nucleus raphe magnus (RM), nucleus X (X), Nucleus Y (Y), nucleus prepositus (PRP), oculomotor nucleus (III), parabrachial (PB), paracentral nucleus of the thalamus (PCN), parafasicular nucleus of the thalamus (PF), paragigantocellular reticular nucleus, dorsal (PGRNd), paramedian lobule (PM), parvicellular reticular nucleus (PARN), periaqueductal grey (PAG), pontine grey (PG), pontine reticular nucleus (PRN), principal sensory nucleus of the trigeminal (PSV), red nucleus (RN), spinal trigeminal nucleus, interpolar/oral subdivision (SPVi/o), spinal vestibular nucleus (SPIV), superior colliculus (SC), superior vestibular nucleus (SUV), supratrigeminal nucleus (SUT), superior vestibular nucleus (SUV), tegmental reticular nucleus (TRN), trigeminal motor nucleus (Y), ventral anterior-lateral complex of the thalamus (VAL), ventral posteromedial nucleus of the thalamus (VPM), ventral tegmental area (VTA), ventromedial nucleus (VM), and zona incerta (ZI).
Tables
Key resources table
| Reagent type (species) or resource | Designation | Source or reference | Identifiers | Additional information |
|---|---|---|---|---|
| Strain, strain background (Mus musculus) | C57BL/6J | Charles River | Stock | |
| Genetic reagent (M. musculus) | Gad1-Cre | Gift from Dr. Diego Restrepo, recv’d frozen embryos from Tamamaki group | RRID: IMSR CARD:2065 | PMID:19915725 |
| Genetic reagent (M. musculus) | Ntsr1-Cre | Mutant Mouse Regional Resource Center | RRID: MMRRC_030648-UCD Stock, Tg(Ntsr1-cre) GN220 Gsat/Mmucd | PMID:17855595 |
| Genetic reagent (M. musculus) | Vgat-ires-cre knock-in (C57BL/6J) | Jackson Labs | RRID: IMSR_JAX:028862Stock, #028862 | PMID:21745644 |
| Genetic reagent (M. musculus) | Vglut2-ires-cre knock-in (C57BL/6J) | Jackson Labs | RRID: IMSR_JAX:028862Stock, #028863 | PMID:21745644 |
| Recombinant DNA reagent | AAV1.CAG.flex.GFP (virus) | Addgene | RRID: Addgene_51502Lot #: V41177 | Titer: 2.0×10¹³ (GFP)1.2×10¹³ (RFP) |
| Recombinant DNA reagent | AAV1.CAG.flex.RFP (virus) | Addgene | RRID: Addgene_28306Lot #: V5282 | |
| Recombinant DNA reagent | rAAV2.EF1a.DIO. eYFP.WPRE.pA (virus) | UNC | RRID: Addgene_27056Lot #: AV4842F | Titer: 4.5×10¹² |
| Recombinant DNA reagent | AAV8.hysn.ConFon. eYFP (virus) | Addgene | RRID: Addgene_55650Lot #: V15284 | PMID:24908100Titer: 2.97×10¹³ |
| Recombinant DNA reagent | AAVretro.EF1a. FlpO (virus) | Addgene | RRID: Addgene_55637Lot # V56725 | PMID:24908100 Titer: 1.02×10¹³ |
| Recombinant DNA reagent | AAV2.retro.hSyn. NLS.GFP.Cre (virus) | Viral preparations were a gift of Dr. Jason Aoto | RRID: Addgene_175381 | PMID:23827676 |
| Recombinant DNA reagent | AAV9.EF1a.FLEX. H2B.GFP.2A.oG (virus) | Salk Institute | RRID: Addgene_74289 | Titer: 2.41×10¹² |
| Recombinant DNA reagent | AAV1.EF1a.FLEX. TVA.mCherry (virus) | UNC | RRID: Addgene_38044 | PMID:22681690 |
| Recombinant DNA reagent | AAV1.syn.FLEX.split TVA.EGFP.tTA (virus) | Addgene | RRID: Addgene_100798 | PMID:28847002 |
| Recombinant DNA reagent | AAV1.TREtight.mTag BFP2.B19G (virus) | Addgene | RRID: Addgene_100799 | PMID:28847002 |
| Recombinant DNA reagent | EnvA.Gdeleted. EGFP (virus) | Salk Institute | RRID: Addgene_32635 | |
| Recombinant DNA reagent | EnvA.Gdeleted. mCherry (virus) | Salk Institute | RRID: Addgene_32636 | |
| Antibody | Anti-Vglut2 (Rabbit monoclonal) | Abcam | RRID: AB_2893024Cat #: a FP1487001KT b216463 | Lot #: GR3249111-2(1:250) |
| Antibody | Anti-Gad65/67 (Rabbit polyclonal) | Sigma-Aldrich | RRID: AB_2893025Cat#: ABN904 | Lot#: 3384833(1:200) |
| Antibody | Anti-Tyrosine Hydroxylase (Sheep polyclonal) | MilliporeSigma | RRID: AB_90755Cat#: AB1542 | (1:200) |
| Antibody | Anti-GFP-Alexa Fluor 488 conjugate (Rabbit polyclonal) | Invitrogen | RRID: AB_221477Cat#: A21311 | Lot #: 2017366(1:400) |
| Antibody | Anti-Rabbit DyL594 (Goat polyclonal) | Bethyl | RRID:AB_10631380Cat#: A120-601D4 | (1:400) |
| Antibody | Anti-Mouse AF555 (Goat polyclonal) | Life Technologies | RRID:AB_141596Cat#: A21127 | (1:400) |
| Antibody | Anti-Sheep AF 568 (Donkey polyclonal) | Life Technologies | RRID:AB_2535753Cat#: A21099 | (1:400) |
| Commercial Assay Kit | RNAscope Intro Pack for Multiplex Fluorescent Reagent Kit v2 | Advanced Cell Diagnostics | Cat#: 323,136 | |
| Sequence-based reagent | EYFP-C1 | Advanced Cell Diagnostics | Cat#: 312,131 | mRNA probe |
| Sequence-based reagent | Mm-Slc32a1-C2 | Advanced Cell Diagnostics | Cat#: 319,191 | mRNA probe |
| Sequence-based reagent | Mm-Slc17a6-C3 | Advanced Cell Diagnostics | Cat#: 319,171 | mRNA probe |
| Other | Opal Fluorophore Reagent Pack 520 | Akoya Biosciences | Cat #: FP1487001KT | |
| Other | Opal Fluorophore Reagent Pack 570 | Akoya Biosciences | Cat #: FP1488001KT | |
| Other | Opal Fluorophore Reagent Pack 690 | Akoya Biosciences | Cat #: FP1497001KT | |
| Other | DAPI stain | Advanced Cell Diagnostics | Cat#: 323,108 |
Additional files
-
Transparent reporting form
- https://cdn.elifesciences.org/articles/66231/elife-66231-transrepform1-v2.docx
-
Supplementary file 1
Summary of average projection strength by targeting method.
- https://cdn.elifesciences.org/articles/66231/elife-66231-supp1-v2.docx
-
Supplementary file 2
In situ hybridization results.
- https://cdn.elifesciences.org/articles/66231/elife-66231-supp2-v2.xlsx
-
Supplementary file 3
Anterograde tracing data by specimen.
- https://cdn.elifesciences.org/articles/66231/elife-66231-supp3-v2.xlsx
-
Supplementary file 4
Rabies positive neurons in each brain region by specimen.
- https://cdn.elifesciences.org/articles/66231/elife-66231-supp4-v2.xlsx
-
Source data 1
Projection strength data by targeting method.
- https://cdn.elifesciences.org/articles/66231/elife-66231-supp5-v2.xlsx
-
Source data 2
Analysis of in situ hybridization data.
- https://cdn.elifesciences.org/articles/66231/elife-66231-supp6-v2.xlsx
-
Source data 3
Proportion of rabies labeled cells in Vgat and Vglut2-cre mice.
- https://cdn.elifesciences.org/articles/66231/elife-66231-supp7-v2.xlsx
Download links
A two-part list of links to download the article, or parts of the article, in various formats.
Downloads (link to download the article as PDF)
Open citations (links to open the citations from this article in various online reference manager services)
Cite this article (links to download the citations from this article in formats compatible with various reference manager tools)
Diverse inhibitory projections from the cerebellar interposed nucleus
eLife 10:e66231.
https://doi.org/10.7554/eLife.66231


