Chromatin structure-dependent histone incorporation revealed by a genome-wide deposition assay
- Division of Cancer Biology, The Cancer Institute of Japanese Foundation for Cancer Research, Japan
- Laboratory of Chromatin Structure and Function, Institute for Quantitative Biosciences, The University of Tokyo, Japan
- Division of Transcriptomics, Medical Institute of Bioregulation, Kyushu University, Japan
- Division of Experimental Chemotherapy, Cancer Chemotherapy Center, Japanese Foundation for Cancer Research, Japan
- Cell Biology Center, Institute of Innovative Research, Tokyo Institute of Technology, Japan
Figures
Figure 1 with 4 supplements
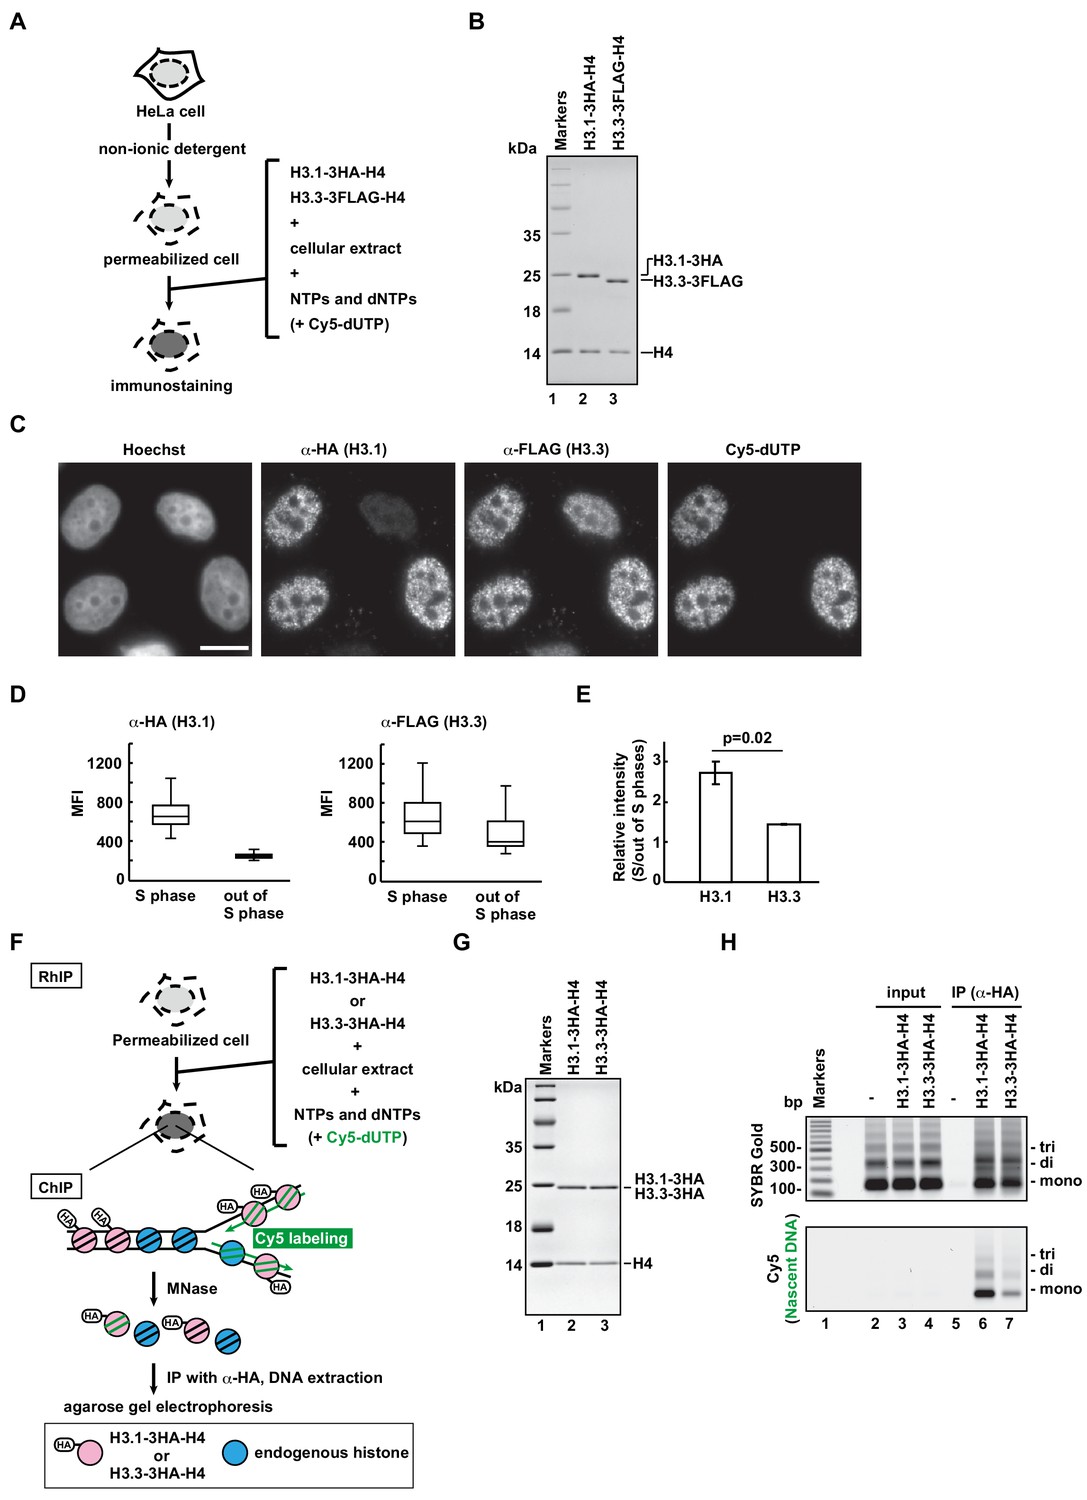
RhIP (Reconstituted histone complex Incorporation into chromatin of Permeabilized cells) assay recapitulates the replication-coupled H3.1-H4 and -dependent H3.3-H4 depositions.
(A) Schematic representation of the RhIP assay, using reconstituted H3.1-H4 and H3.3-H4 complexes. Permeabilized cells were prepared from HeLa cells treated with non-ionic detergent, to perforate the cellular membranes. The in vitro reconstituted H3-H4 complexes were then added to the cells with the cellular extract and nucleotides. Cy5-dUTP was added to label the nascent DNA, so replication could be monitored. (B) Reconstituted H3.1-H4 and H3.3-H4 complexes were analyzed by SDS-16% PAGE with Coomassie Brilliant Blue staining. The 3HA and 3FLAG tags were fused to the C-termini of H3.1 and H3.3, respectively. Lane one indicates the molecular mass markers, and lanes 2 and 3 indicate the H3.1-H4 and H3.3-H4 complexes, respectively. (C) RhIP-immunostaining of H3.1 and H3.3. Exogenously added H3-H4 complexes were stained with an anti-HA or -FLAG antibody. Cells in S phase were monitored with Cy5-dUTP, which was incorporated into the nascent DNA. Bar indicates 10 μm. (D) Quantification of C. The mean fluorescence intensities (MFI) of H3.1–3HA (left) and H3.3-3FLAG (right) were measured. Nuclei were divided into S phase (Cy5 positive) and out of S phase (Cy5 negative) (n > 50, triplicate). (E) Relative intensity of H3.1 or H3.3 signal in S phase against signal out of S phase. Experiments were repeated three times and averaged data with standard deviations are shown. The two-tailed Student’s t-test was used for the statistical comparisons. (F) Schematic representation of the RhIP-ChIP assay, using the reconstituted H3.1-H4 and H3.3-H4 complexes. The reconstituted H3.1-H4 or H3.3-H4 complex was added to permeabilized cells with the cellular extract and nucleotides. Cy5-dUTP was added to label the nascent DNA. The chromatin was partially digested with micrococcal nuclease (MNase). Chromatin immunoprecipitation was performed with anti-HA magnetic beads. The precipitated DNA was extracted and analyzed by agarose gel electrophoresis. (G) Reconstituted H3.1-H4 and H3.3-H4 complexes were analyzed by SDS-16% PAGE with Coomassie Brilliant Blue staining. A 3HA tag was fused to the C-termini of H3.1 and H3.3. Lane one indicates the molecular mass markers, and lanes 2 and 3 indicate the H3.1-H4 and H3.3-H4 complexes, respectively. (H) The immunoprecipitated DNA was analyzed by 2% agarose electrophoresis. Upper and lower images were obtained from the same gel. The DNA was visualized with SYBR Gold (upper), and the nascent DNA was visualized by detecting the Cy5 signals (lower). Lane 1 indicates the 100 bp DNA ladder. Lanes 2–4 and 5–7 indicate input samples and immunoprecipitated samples, respectively. Each set includes the experiments with no reconstituted histone complex (negative control, lanes 2 and 5), with H3.1–3HA-H4 (lanes 3 and 6), and with H3.3–3HA-H4 (lanes 4 and 7).
Figure 1—figure supplement 1
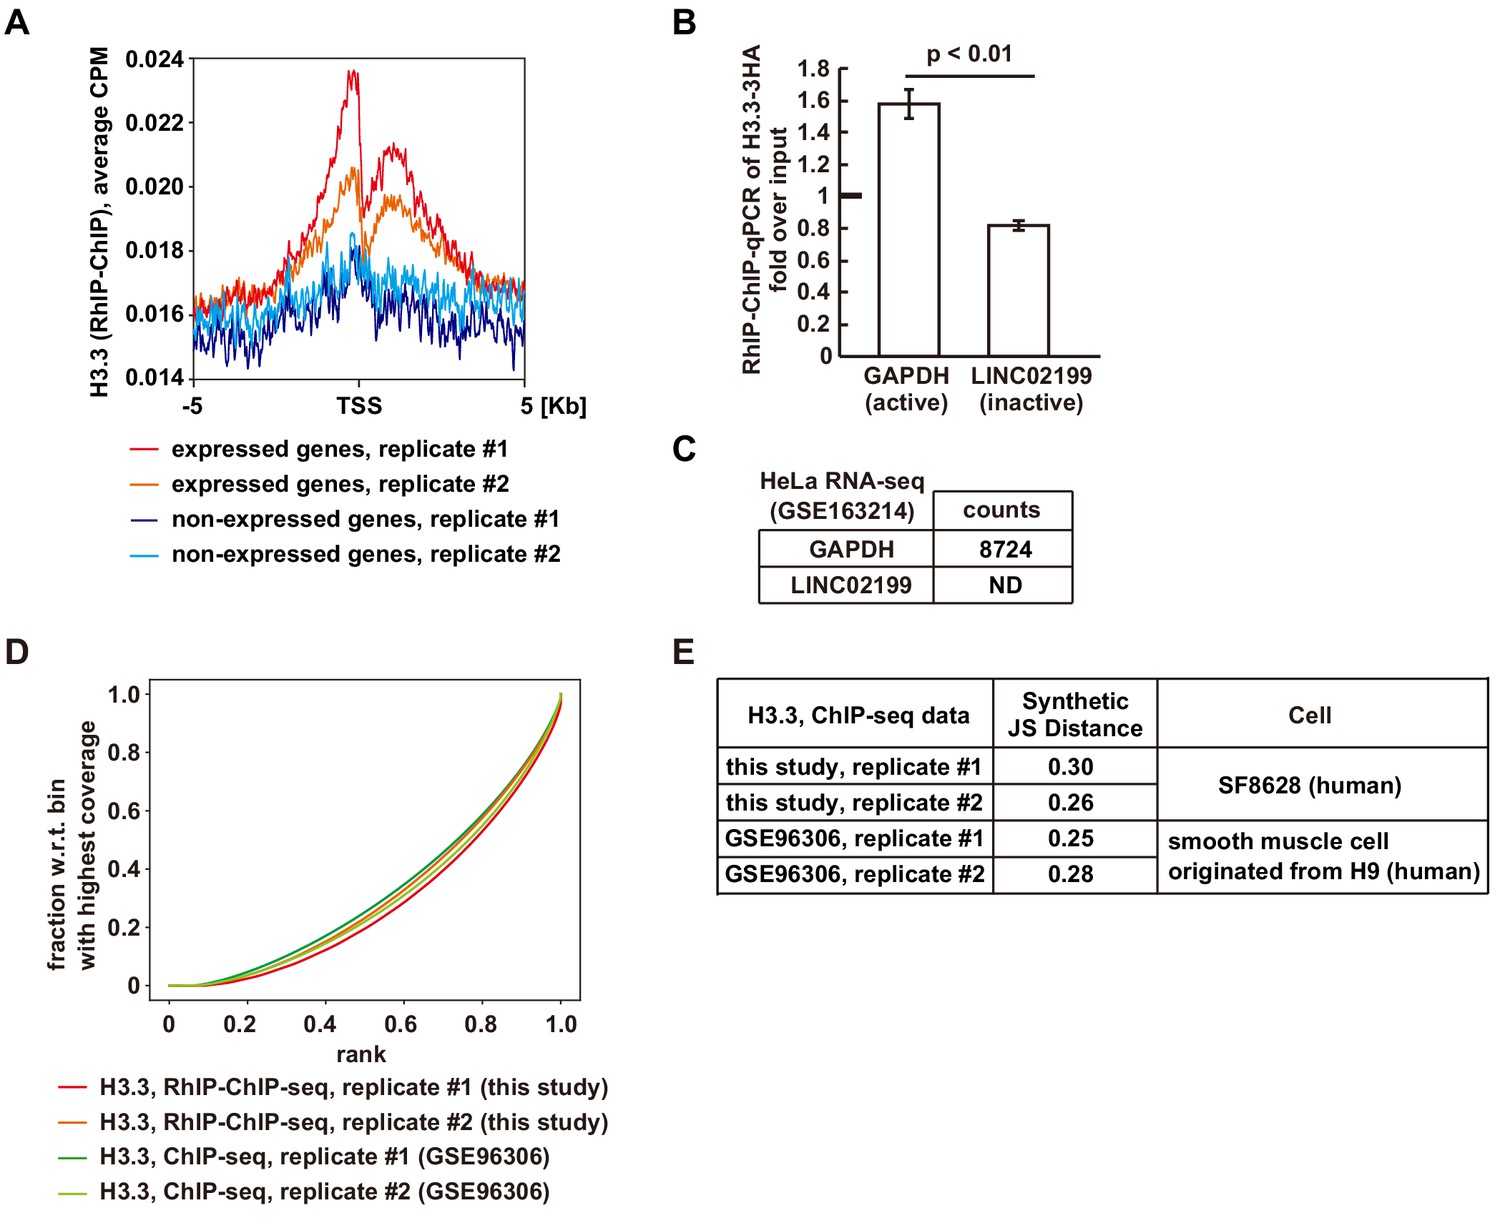
H3.3 is enriched in active genes in the RhIP assay.
(A) An aggregate plot of reads occupancy surrounding the TSS of active or inactive genes from the RhIP-ChIP-seq of H3.3. (B) The results of RhIP-ChIP-qPCR of H3.3. ChIP enrichments (fold enrichment over input) for GAPDH (active) and LIC02199 (inactive) genes are shown. Experiments were repeated three times and averaged data with standard deviations are shown. The two-tailed Student’s t-test was used for the statistical comparisons. (C) The read counts of GAPDH and LINC02199 of RNA-seq (GSE163214). (D) The plotFingerprints of RhIP-ChIP-seq and ChIP-seq of H3.3. (E) Quality control metrics of each sequencing data set shown in (D). The synthetic JS distance is the Jensen-Shannon distance between a given sample and the expected distribution of a perfect input sample. Higher values indicate greater differences.
Figure 1—figure supplement 2
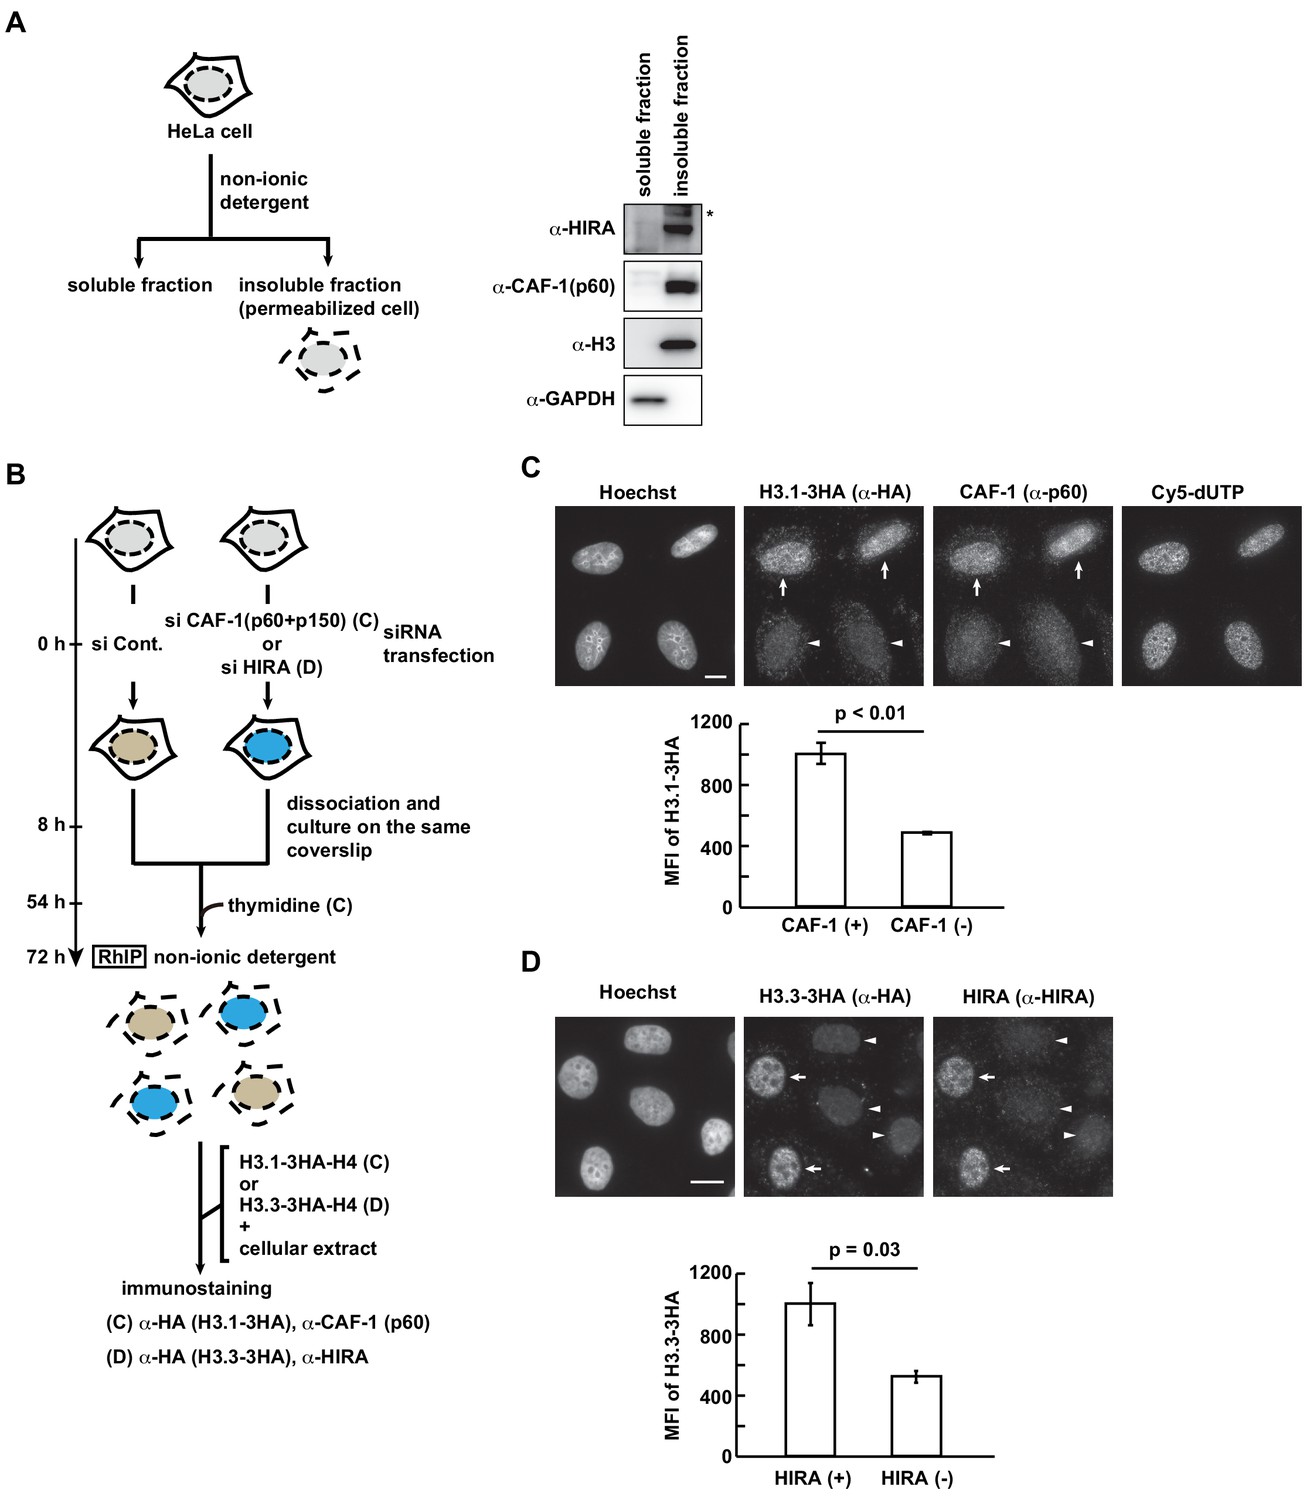
CAF-1 and HIRA in permeabilized cells are essential for H3.1 and H3.3 incorporations in the RhIP assay.
(A) Scheme of cell fractionation (left). HeLa cells were treated with non-ionic detergent and the supernatant (soluble fraction), which is removed from permeabilized cells, and the pellet, which corresponds to permeabilized cells, were separated (insoluble fraction). Distributions of HIRA and CAF-1 (p60) were investigated by western blotting (right). Histone H3 and GAPDH served as the chromatin and cytoplasmic protein controls, respectively. Asterisk indicates a non-specific band. (B) Scheme of RhIP-immunostaining assay using CAF-1- or HIRA-knockdown cells. HeLa cells were transfected with siRNAs against CAF-1 (p60 and p150), HIRA or luciferase (control) for 8 hr. For evaluation by immunostaining, the CAF-1- or HIRA-knockdown cells were mixed with control cells, and then plated on the same dish. For the CAF-1-knockdown experiment to measure replication-coupled H3.1 incorporation, thymidine was added to synchronize the cells in S phase, 18 hr before the permeabilization. After 72 hr, RhIP-immunostainings were performed. The CAF-1- and HIRA-knockdown cells were identified with antibodies against CAF-1 (p60) and HIRA, respectively. (C) RhIP-immunostaining of H3.1 using CAF-1 (p60 and p150) -knockdown cells. Upper: All cells shown here are in S-phase with Cy5-dUTP incorporation (right). The H3.1 incorporation was identified with anti-HA antibodies (arrows), and the CAF-1 (p60) -knockdown was identified as the absence of α-p60 signals (arrowheads). Bar indicates 10 μm. Lower: Quantification of the image data above. The mean fluorescence intensities (MFI) of H3.1–3HA in control cells (CAF-1 (+)) and CAF-1-knockdown cells (CAF-1 (-)) in S phase were measured (n > 35, triplicate). The two-tailed Student’s t-test was used for the statistical comparisons. (D) RhIP-immunostaining of H3.3 using HIRA-knockdown cells. Upper: The H3.3 incorporation was identified with anti-HA antibodies (arrows), and HIRA-knockdown cells were identified by the absence of anti-HIRA signals (arrowheads). Bar indicates 10 μm. Lower: Quantification of the image data shown above. The mean fluorescence intensities (MFI) of H3.3–3HA in control cells (HIRA (+)) and HIRA-knockdown cells (HIRA (-)) (n > 50 triplicate). The two-tailed Student’s t-test was used for the statistical comparisons.
Figure 1—figure supplement 3
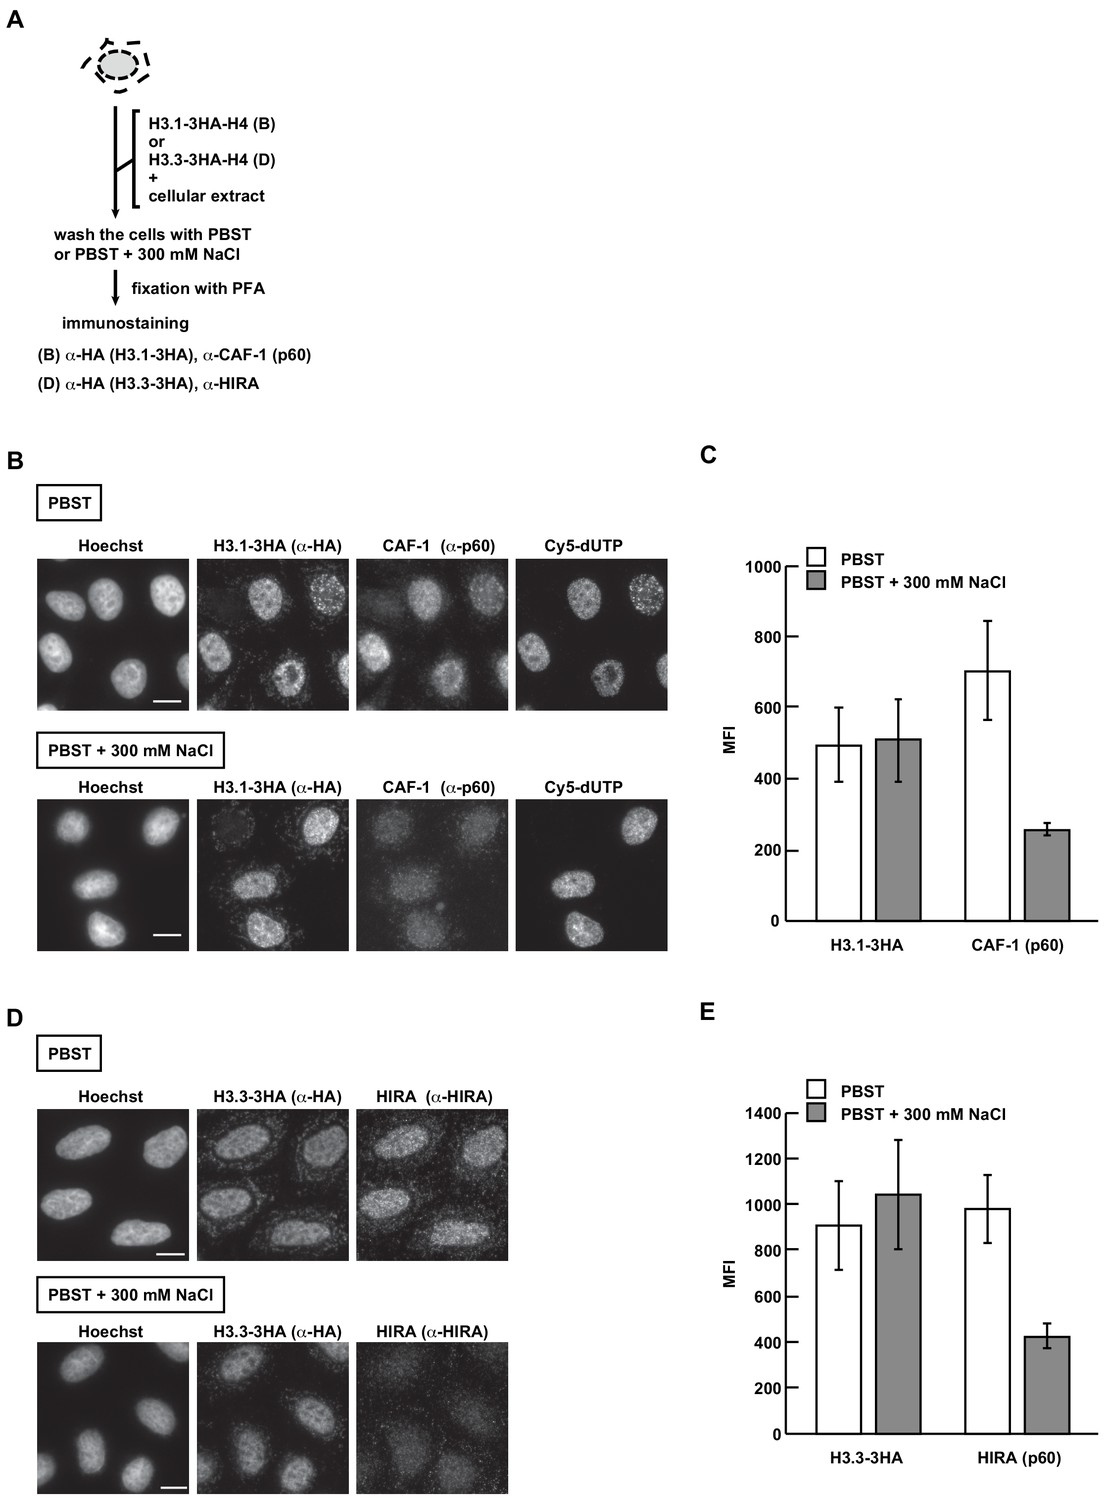
The exogenously added H3.1 and H3.3 are mostly incorporated into the chromatin in the RhIP assay.
(A) Scheme of the RhIP-immunostaining with harsh washing conditions. The RhIP assay was performed with H3.1-H4 and H3.3-H4, and then the cells were washed with PBST or PBST containing 300 mM NaCl prior to fixation. (B) RhIP-immunostaining of H3.1 with PBST (upper) and PBST containing 300 mM NaCl (lower) conditions. Exogenously added H3.1–3HA-H4 complex and CAF-1 (p60) were stained with anti-HA and anti-p60 antibodies, respectively. Cells in S phase were monitored with Cy5-dUTP, which was incorporated within the nascent DNA. Bar indicates 10 μm. (C) Quantification of (B). The mean fluorescence intensities (MFI) of H3.1–3HA (left) and CAF-1 (p60) (right) were measured (n > 100). (D) RhIP-immunostaining of H3.3 with PBST (upper) and PBST containing 300 mM NaCl (lower) conditions. Exogenously added H3.3–3HA-H4 complex and HIRA were stained with anti-HA and anti-HIRA antibodies, respectively. Bar indicates 10 μm. (E) Quantification of (D). The mean fluorescence intensities (MFI) of H3.3–3HA (left) and HIRA (right) were measured (n > 100).
Figure 1—figure supplement 4
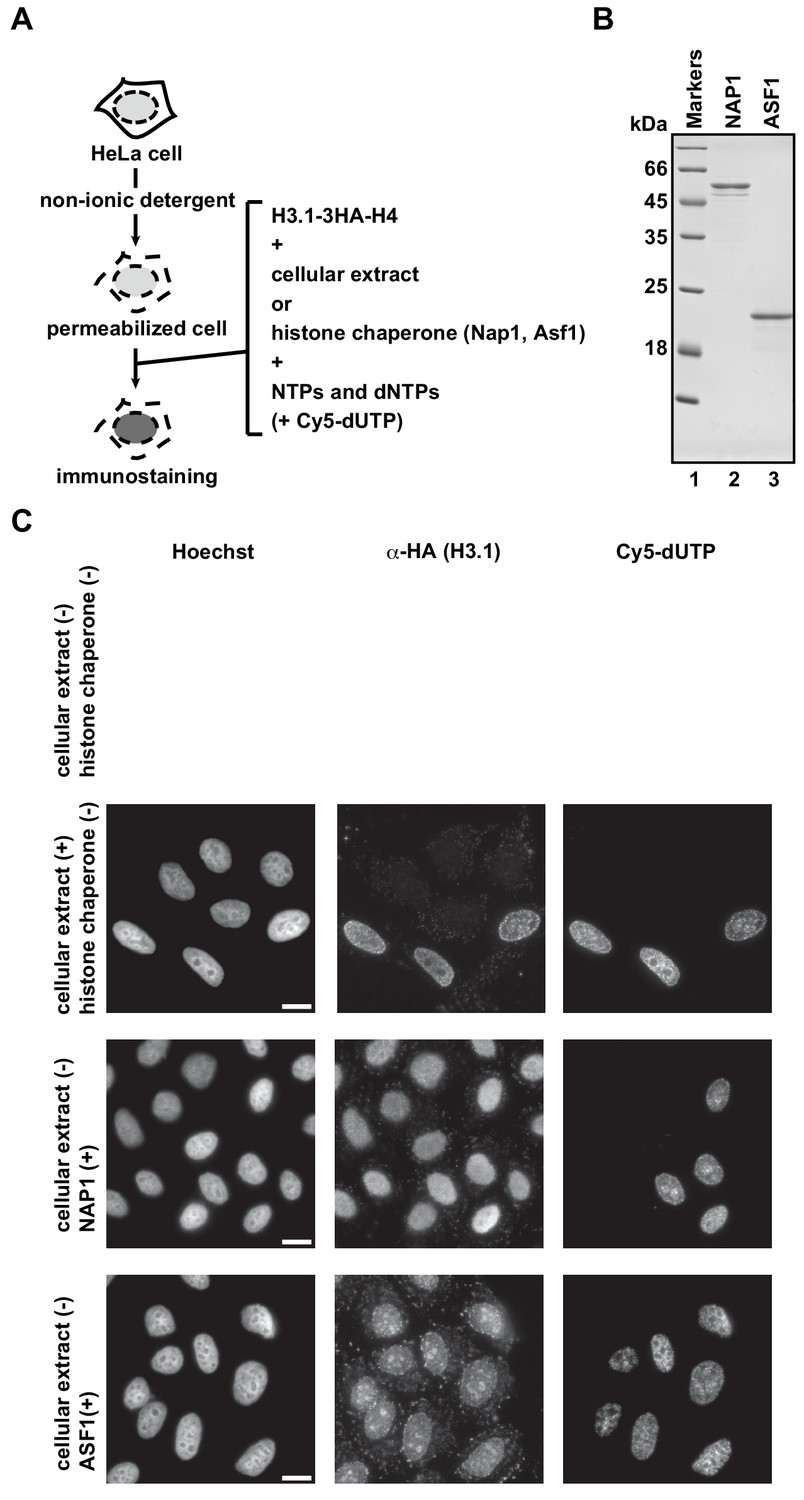
Replication-coupled H3.1 deposition in the RhIP assay requires the cellular extract.
(A) Schematic representation of the RhIP assay. The RhIP assay was performed with H3.1-H4, in the presence of either the cellular extract or the histone chaperones NAP1 or ASF1. (B) Purified human NAP1 and ASF1 were analyzed by SDS-16% PAGE with Coomassie Brilliant Blue staining. Lane 1 indicates the molecular mass markers, and lanes 2 and 3 indicate Nap1 and Asf1, respectively. (C) RhIP-immunostaining images of H3.1. The exogenously added H3.1–3HA-H4 complex was stained with an anti-HA antibody. Cells in S phase were monitored with Cy5-dUTP. Bar indicates 10 μm.
Figure 2 with 2 supplements
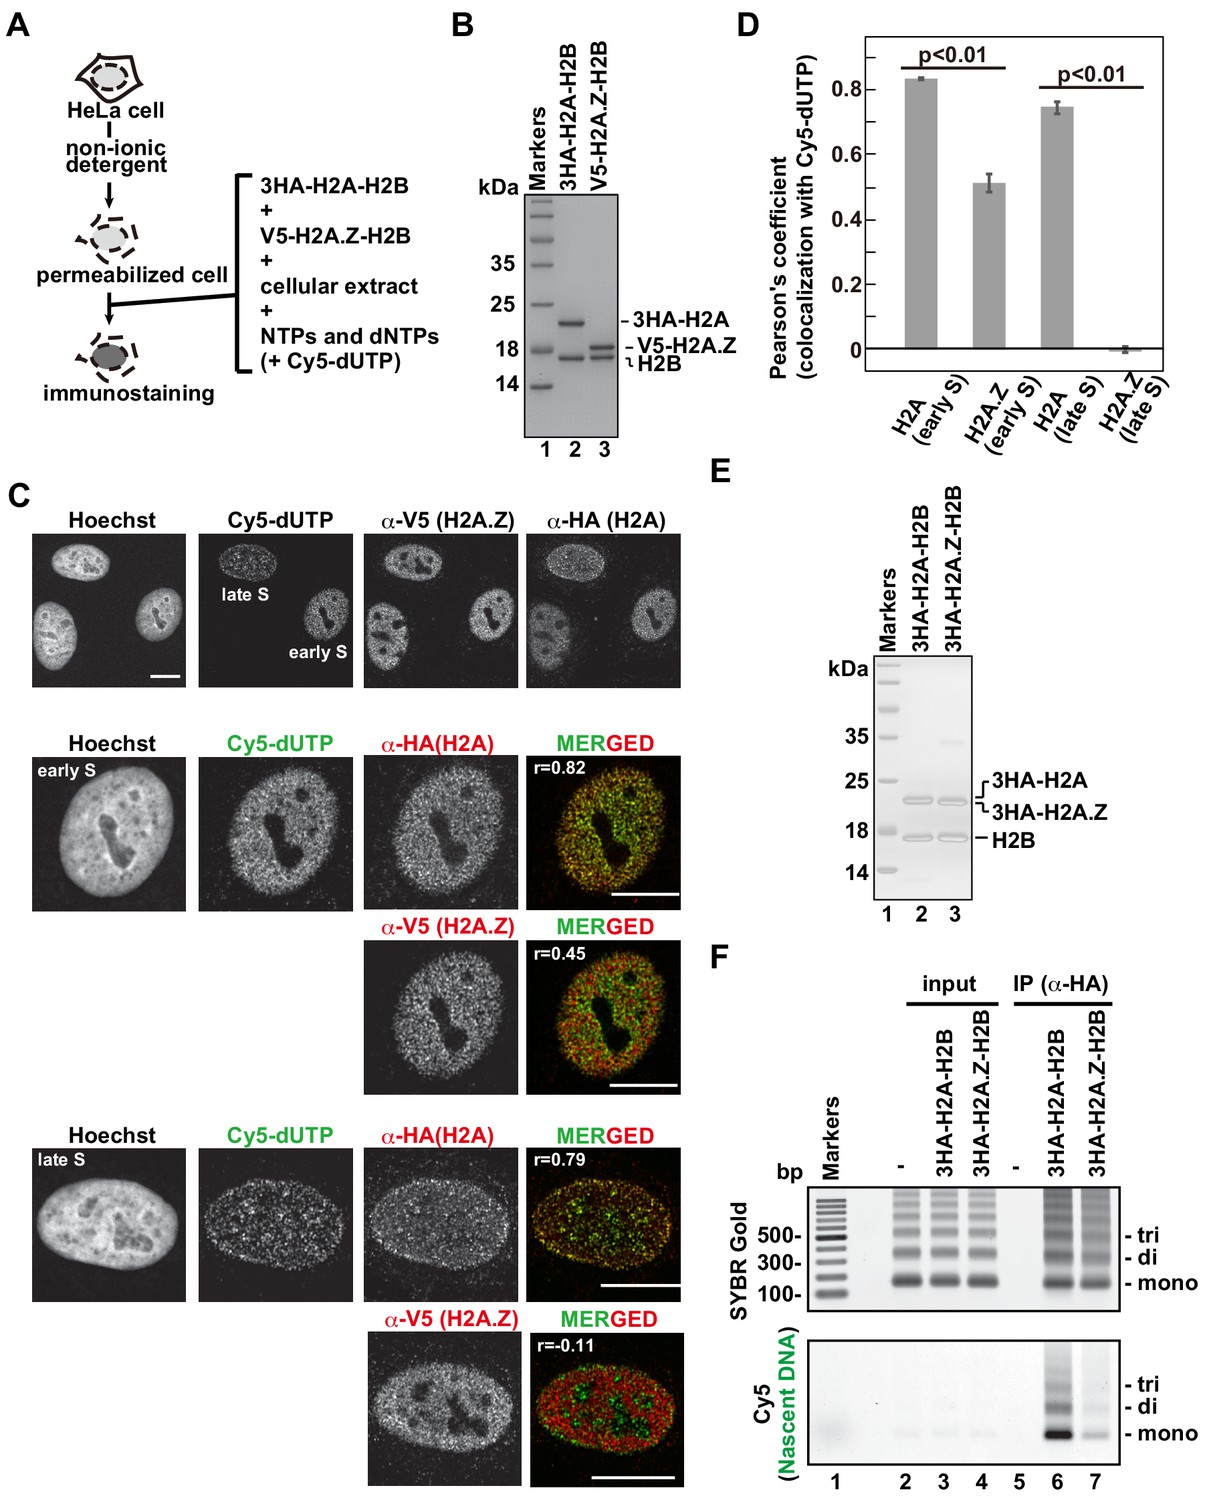
The H2A.Z and H2A deposition patterns are different in the RhIP assay.
(A) Schematic representation of the RhIP assay, using the reconstituted H2A-H2B and H2A.Z-H2B complexes. (B) The reconstituted H2A-H2B and H2A.Z-H2B complexes were analyzed by SDS-16% PAGE with Coomassie Brilliant Blue staining. The 3HA and V5 tags were fused to the N-termini of H2A and H2A.Z, respectively. Lane one indicates the molecular mass markers, and lanes 2 and 3 indicate the H2A-H2B and H2A.Z-H2B complexes, respectively. (C) RhIP-immunostaining of H2A and H2A.Z. Top: Exogenously added H2A-H2B or H2A.Z-H2B complexes were stained with either an anti-HA or -V5 antibody. Cells in S phase were monitored with Cy5-dUTP. Middle and Bottom: merged images of Cy5-dUTP (green) and H2A or H2A.Z (red) in early S (Middle) and late S (Bottom) phase. Bar indicates 10 μm, and r indicates the Pearson’s correlation coefficient. (D) Colocalization analyses of Cy5-dUTP and H2A.Z or H2A (n > 35 cells). Experiments were repeated three times and averaged data are shown. The two-tailed Student’s t-test was used for the statistical comparisons. (E) Reconstituted H2A-H2B and H2A.Z-H2B complexes were analyzed by SDS-16% PAGE with Coomassie Brilliant Blue staining. A 3HA tag was fused to the N-termini of H2A and HA.Z. Lane 1 indicates the molecular mass markers, and lanes 2 and 3 indicate the H2A-H2B and H2A.Z-H2B complexes, respectively. (F) The RhIP-ChIP assay was performed using H2A and H2A.Z, as described in Figure 1F. The immunoprecipitated DNA was analyzed by 2% agarose electrophoresis. Upper and lower images were obtained from the same gel. The DNA was visualized with SYBR Gold (upper), and the nascent DNA was visualized by detecting the Cy5 signals (lower). Lane 1 indicates the 100 bp DNA ladder. Lanes 2–4 and 5–7 indicate input samples and immunoprecipitated samples, respectively. Each set has the experiments with no reconstituted histone complex (negative control, lanes 2 and 5), with 3HA-H2A-H2B (lanes 3 and 6), and with 3HA-H2A.Z-H2B (lanes 4 and 7).
Figure 2—figure supplement 1
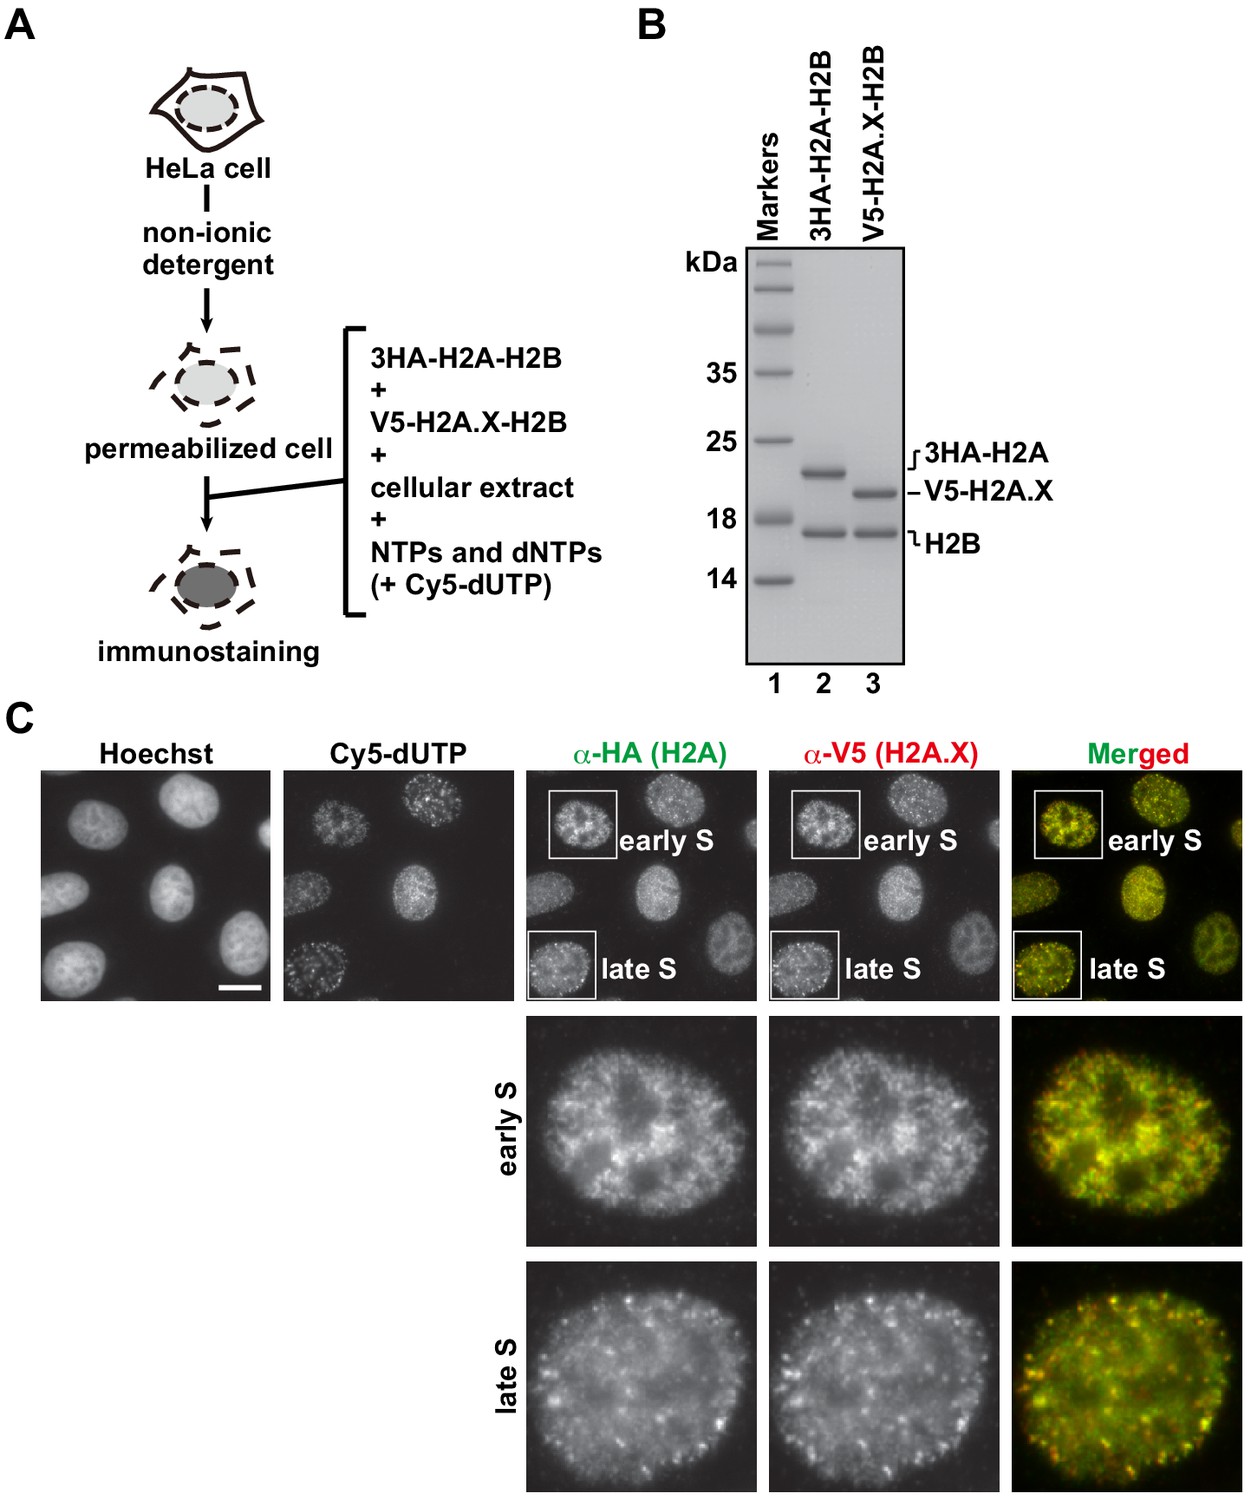
H2A.X shows the same deposition patterns as H2A in the RhIP assay.
(A) Schematic representation of the RhIP assay, using the reconstituted H2A-H2B and H2A.X-H2B complexes. (B) Reconstituted H2A-H2B and H2A.X-H2B complexes were analyzed by SDS-16% PAGE with Coomassie Brilliant Blue staining. The 3HA and V5 tags were fused to the N-termini of H2A and H2A.X, respectively. Lane one indicates the molecular mass markers, and lanes 2 and 3 indicate the H2A-H2B and H2A.X-H2B complexes, respectively. (C) RhIP-immunostaining images of H2A and H2A.X. Exogenously added H2A-H2B complexes were stained with an anti-HA or -V5 antibody. Cells in S phase were monitored with Cy5-dUTP. Bar indicates 10 μm.
Figure 2—figure supplement 2
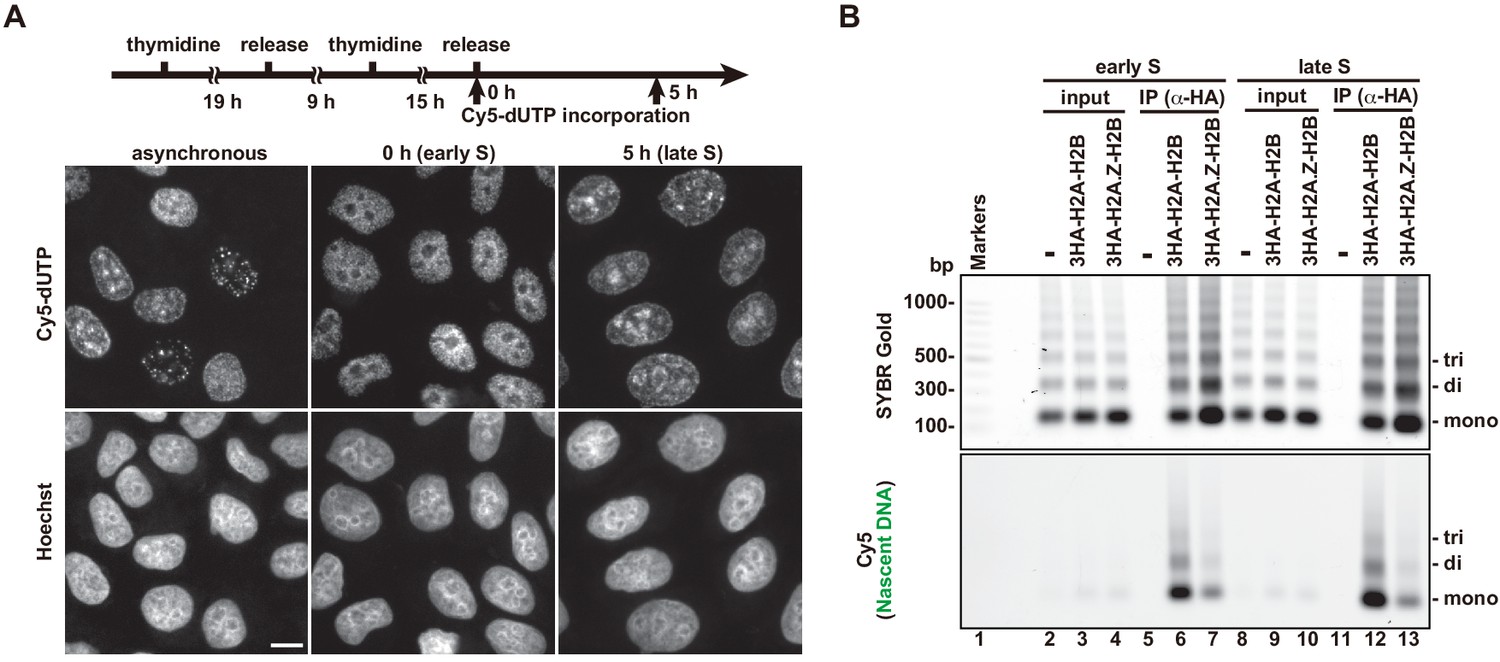
Replication-coupled H2A.Z deposition does not change during S phase progression.
(A) Cells were synchronized in early or late S phase by a double thymidine block. The experimental scheme is shown above the image panels. Cell synchronization was confirmed by the homogeneous replication pattern, revealed by Cy5-dUTP labeling (middle and right top panels). (B) The immunoprecipitated DNA was analyzed by 1.5% agarose electrophoresis. Upper and lower images were obtained from the same gel. The DNA was visualized with SYBR Gold (upper) and the nascent DNA was visualized by detecting the Cy5 signals (lower). Lane 1 indicates a 100 bp DNA ladder. Lanes 2–7 and 8–13 indicate early S and late S phase samples, respectively. Lanes 2–4 and 8–10 indicate input samples, and lanes 5–7 and 11–13 indicate immunoprecipitated samples, respectively. Each set has the experiments with no reconstituted histone complex (negative control, lanes 2, 5, 8, and 11), and with 3HA-H2A.Z-H2B (lanes 4, 7, 10, and 13). H2A.Z is rarely present in the Cy5-labeled nascent chromatin, in both early and late S phase cells, suggesting replication-independent chromatin incorporation.
Figure 3 with 2 supplements
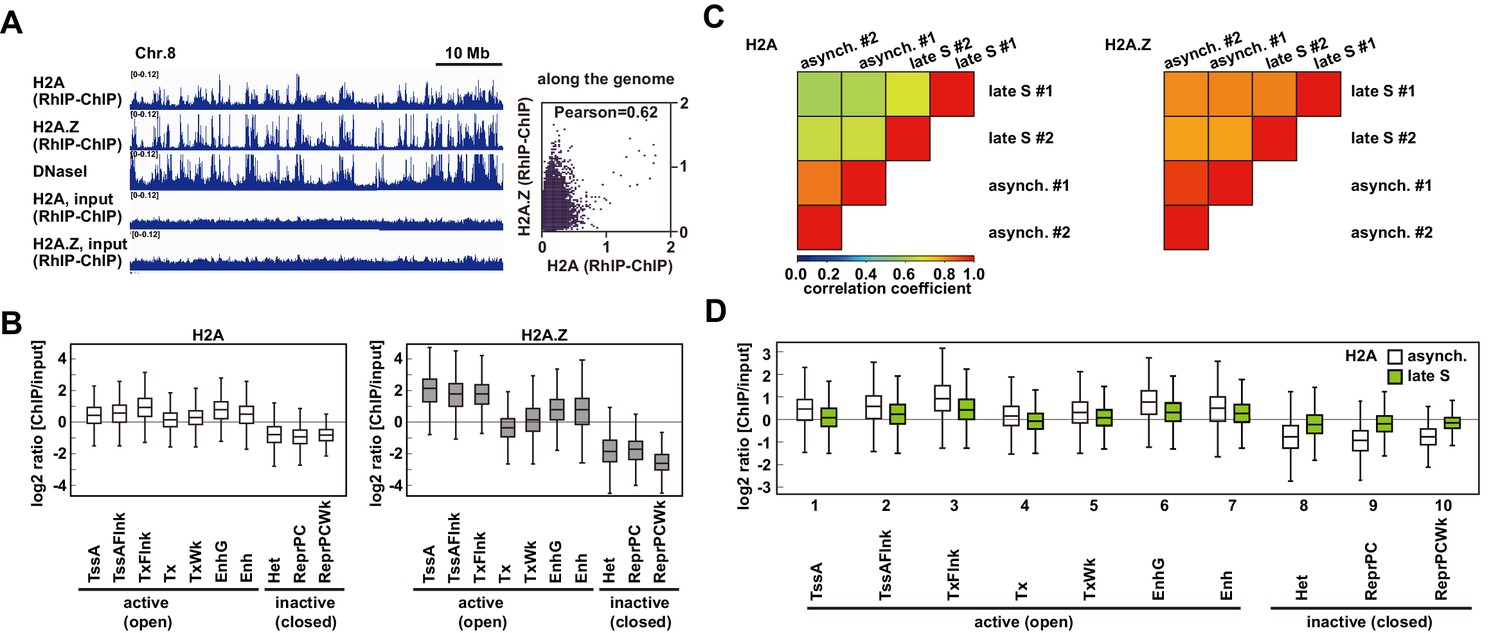
The incorporation of histones H2A and H2A.
Z mainly occurs at less condensed chromatin and H2A incorporation into condensed chromatin requires a replication-coupled deposition mechanism. (A) RhIP-ChIP-seq and DNaseI-seq profiles using asynchronous cells were visualized with the Integrative Genomics Viewer (left). From top to bottom, profiles of H2A, H2A.Z, DNaseI-seq (GEO:GSM816643), input (H2A), and input (H2A.Z) are indicated. Scatter plot analyses of the H2A.Z and H2A RhIP-ChIP-seq along the genome (right). (B) Enrichment of incorporated H2A (left) or H2A.Z (right) in asynchronous cells. Each chromatin region was previously annotated by the chromHMM, as follows. TssA: active TSS, TssAFlnk: flanking active TSS, TxFlnk: transcribed state at the 5' and 3' ends of genes showing both the promoter and enhancer signatures, Tx: strong transcription, TxWk: weak transcription, EnhG: genic enhancers, Enh: enhancers, Het: heterochromatin, ReprPC: repressed PolyComb, and ReprPCWk: weak repressed PolyComb (Ernst and Kellis, 2012; Roadmap Epigenomics Consortium et al., 2015). (C) The Pearson’s correlation coefficients between asynchronous and late S cells (two biological replicates each) were calculated from the RhIP-ChIP-seq data at 800 bp intervals. Left and right panels indicate the correlation coefficients of the H2A and H2A.Z data, respectively. (D) Enrichment of incorporated H2A in asynchronous (white boxes) and late S (green boxes) phase cells. Data for asynchronous cells are those shown in Figure 4C.
Figure 3—figure supplement 1
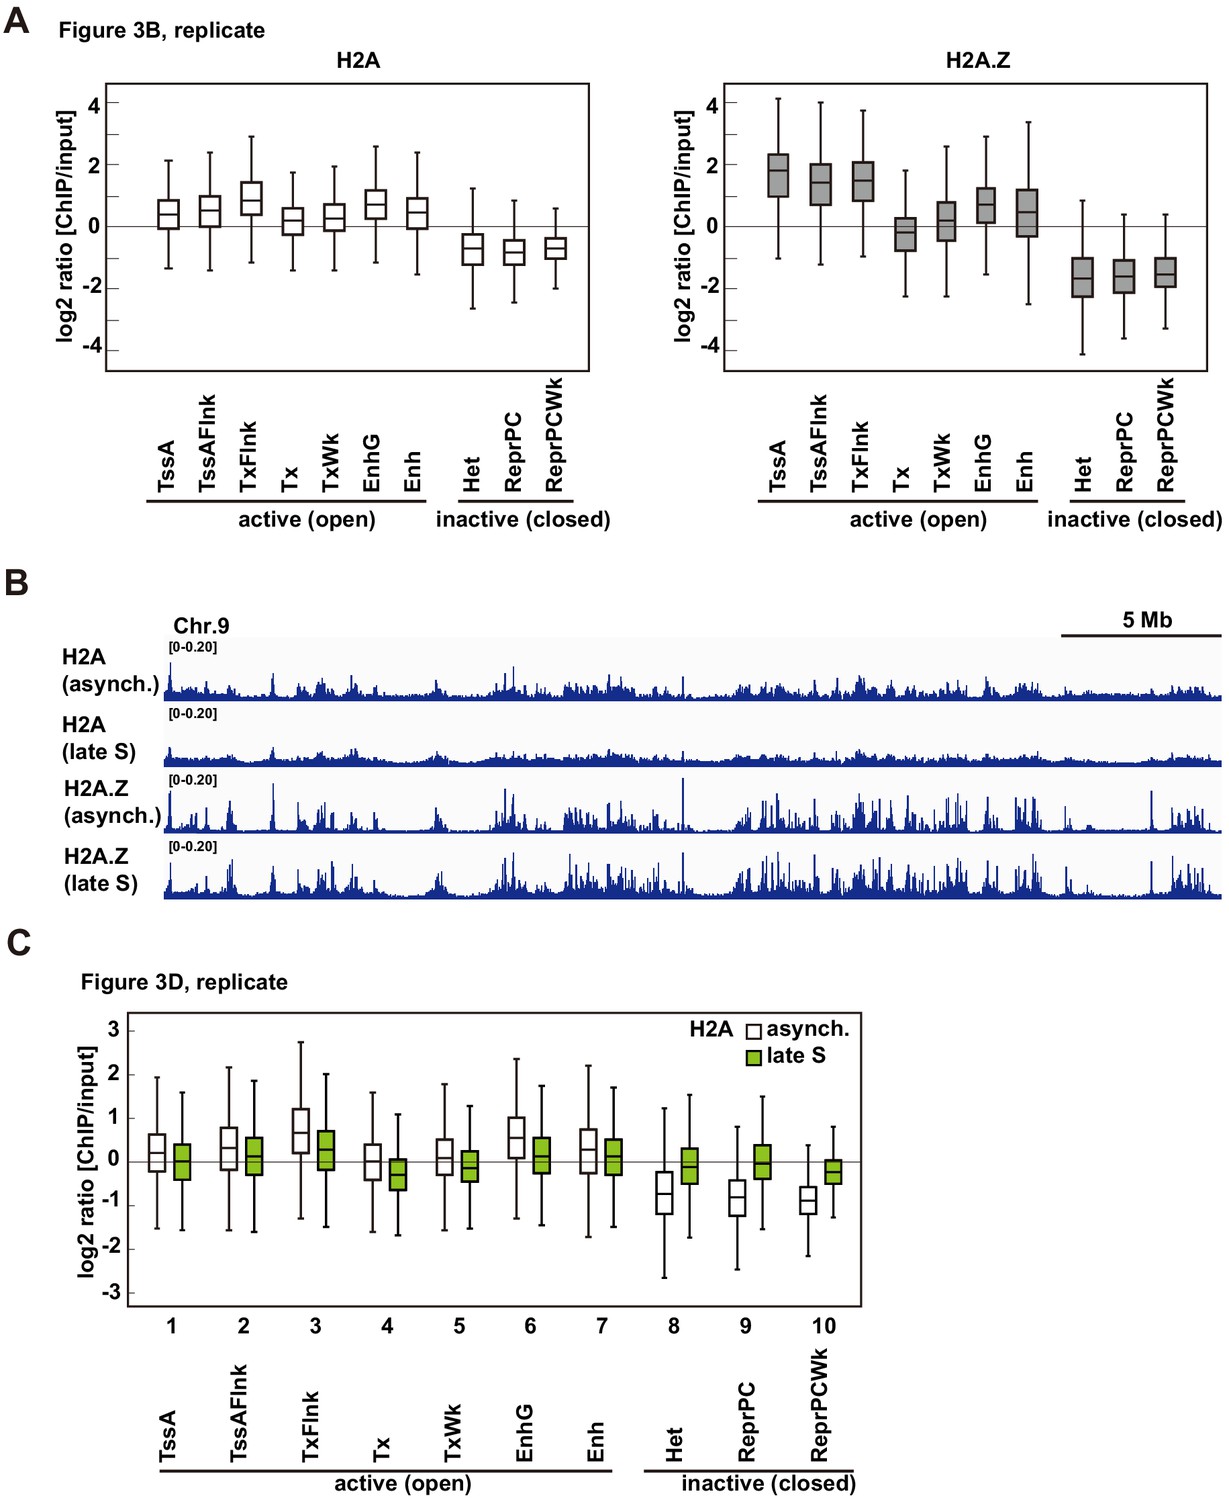
Biological replicates of RhIP-ChIP-seq analyses of H2A and H2A.Z.
(A) Biological replicate of Figure 3B. (B) RhIP-ChIP-seq profiles using asynchronous and late S phase cells were visualized with the Integrative Genomics Viewer. From top to bottom, profiles of H2A (asynchronous), H2A (late S), H2A.Z (asynchronous) and H2A.Z (late S) are indicated (chr9: 72883596–106296034). (C) Biological replicate of Figure 3D.
Figure 3—figure supplement 2
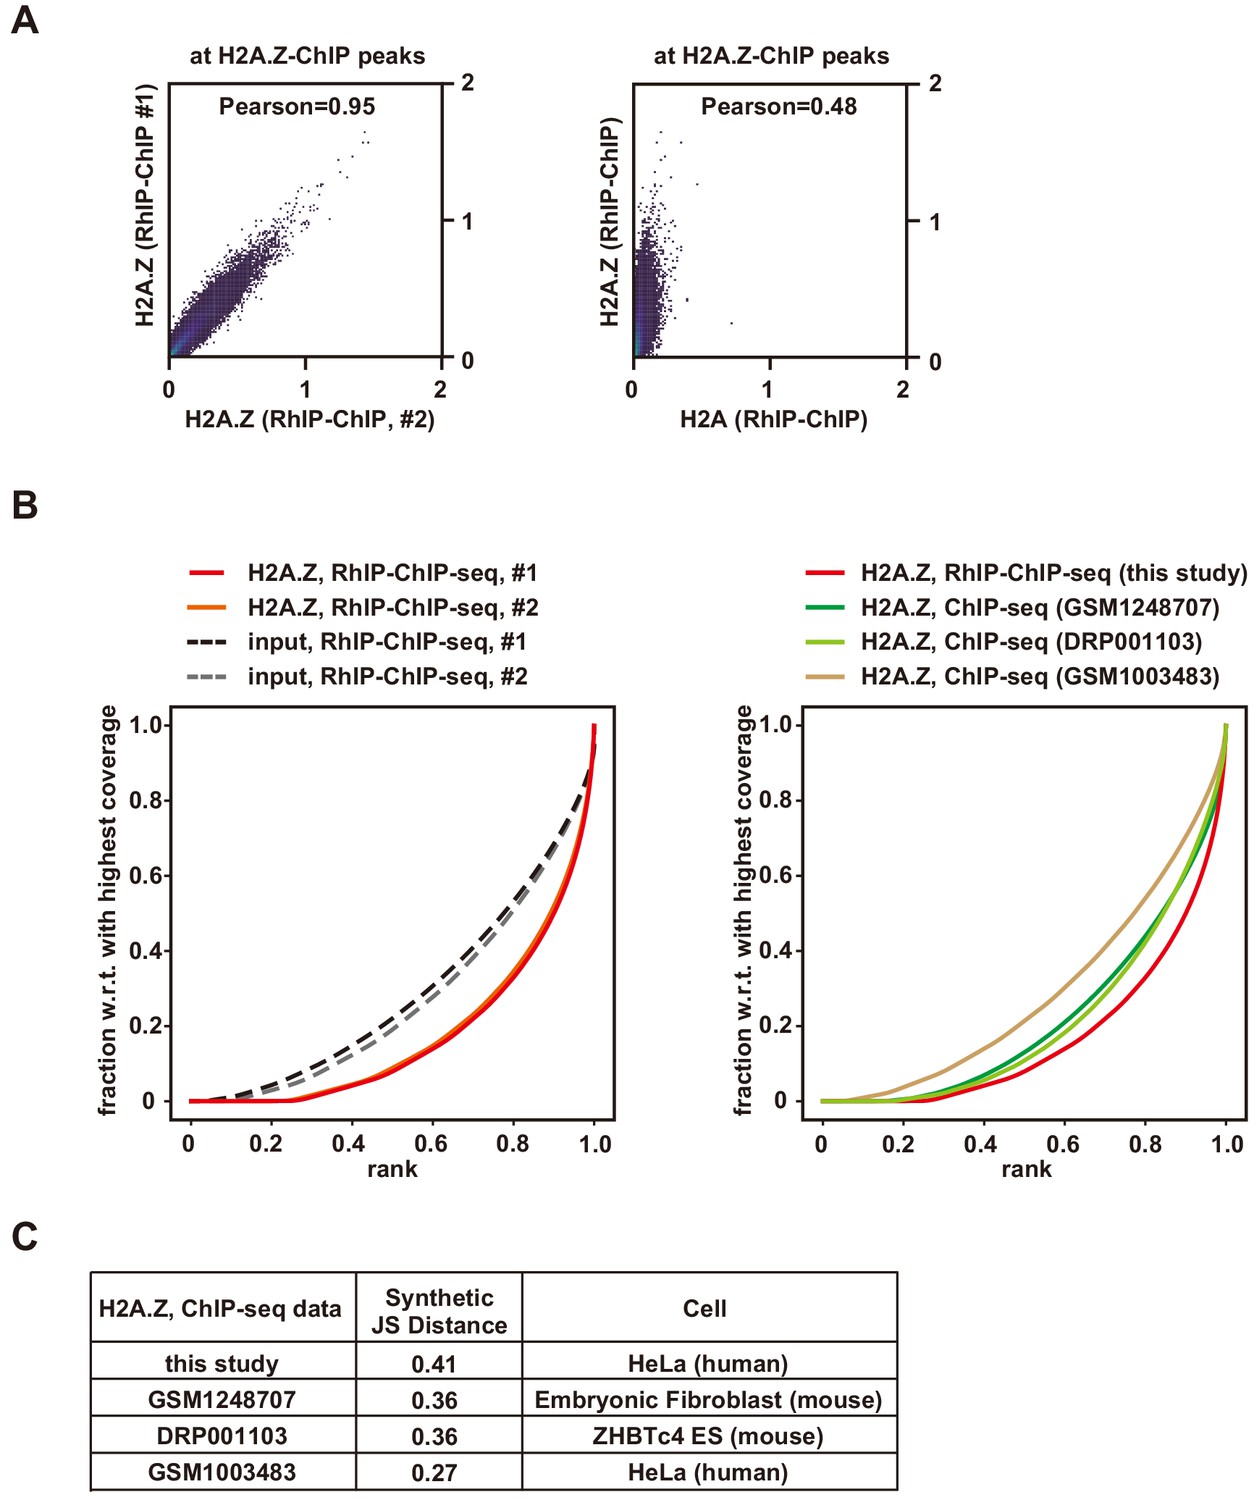
Quality check of RhIP-ChIP-seq analysis of H2A.Z.
(A) Scatter plot analyses of the H2A.Z RhIP-ChIP-seq replicates (left), and the H2A.Z and H2A RhIP-ChIP-seq (right) at known H2A.Z sites. (B) The plotFingerprints of RhIP-ChIP-seq (left and right) or ChIP-seq of H2A.Z (right). (C) Quality control metrics of each sequencing data set shown in (B). The synthetic JS distance is the Jensen-Shannon distance between a given sample and the expected distribution of a perfect input sample. Higher values indicate greater differences between the two curves, with minimum and maximum values of 0 and 1, respectively.
Figure 4 with 1 supplement
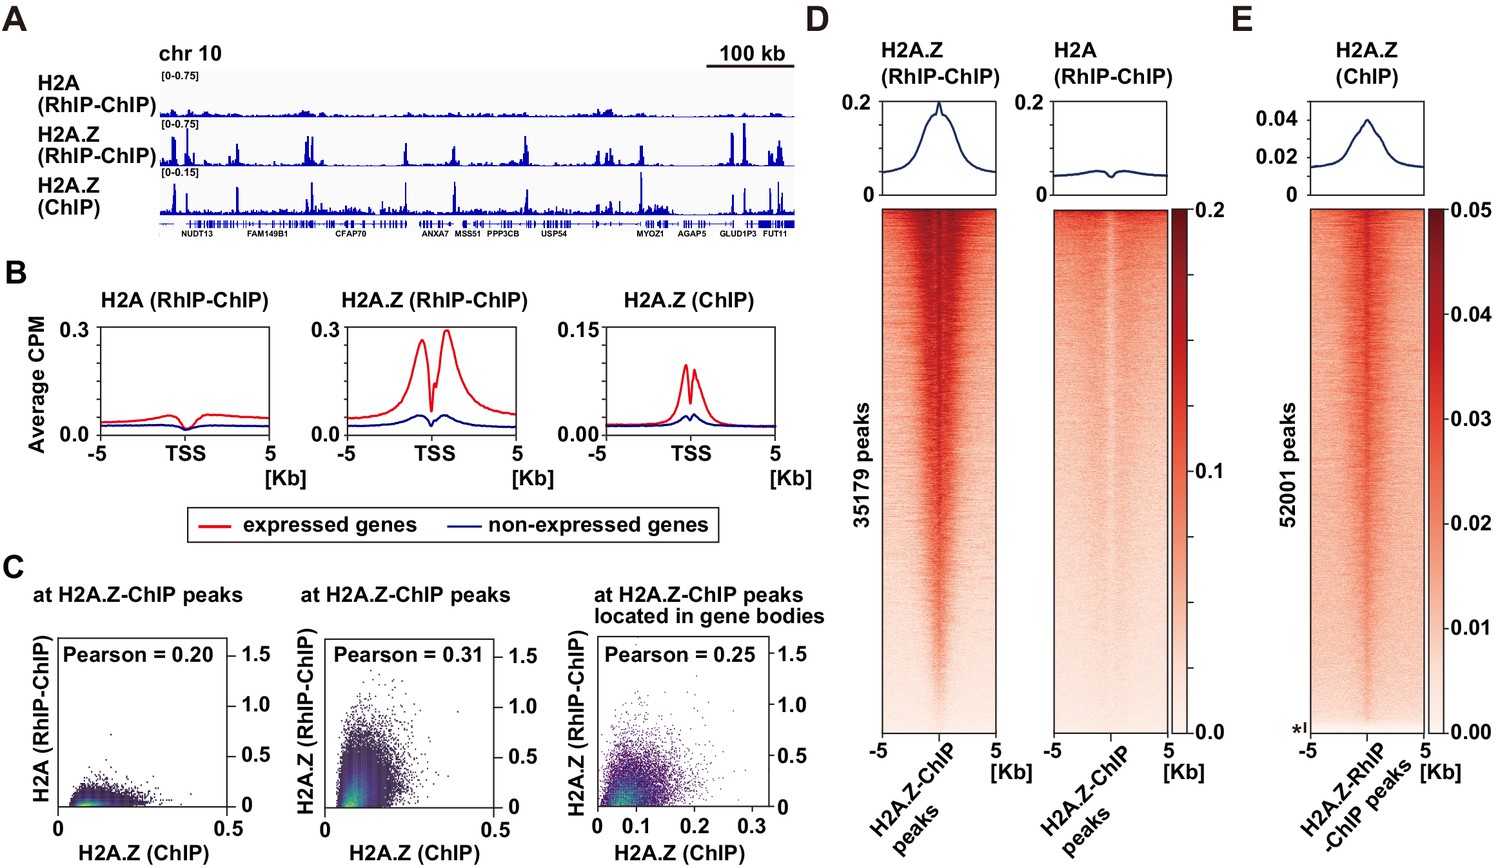
H2A.Z is specifically enriched around transcription start sites in the RhIP assay.
(A) Representative profiles of RhIP-ChIP-seq using asynchronous cells and ChIP-seq (GEO:GSM1003483) at chr10: 73,079,443–73,805,171. (B) Aggregation plots of the H2A (RhIP-ChIP, left), H2A.Z (RhIP-ChIP, center), and H2A.Z (ChIP, right) at the center of TSS-flanking 5 Kb regions from the whole genome. Red and blue lines indicate expressed and non-expressed genes, respectively. (C) The correlations of H2A.Z (ChIP) and H2A (RhIP-ChIP) (left), and H2A.Z (ChIP), H2A.Z (RhIP-ChIP) (center) at known H2A.Z sites determined by ChIP-seq analysis. The correlations of H2A.Z (ChIP) and H2A.Z (RhIP-ChIP) at known H2A.Z sites located in gene bodies (right). (D) Heatmaps of H2A.Z and H2A (RhIP-ChIP) at the center of H2A.Z peaks of ChIP-seq flanking 5 Kb regions. The heatmap represents H2A.Z peaks ranked from the strongest to weakest in RhIP-ChIP-seq. Corresponding aggregation plots are at the top. (E) Reversed analysis of (D). Heatmap of H2A.Z (ChIP) at the H2A.Z peaks of RhIP-ChIP-seq. The corresponding aggregation plot is at the top. Asterisk indicates peaks with no read counts of H2A.Z (ChIP), which are approximately 3% of the entire peaks.
Figure 4—figure supplement 1
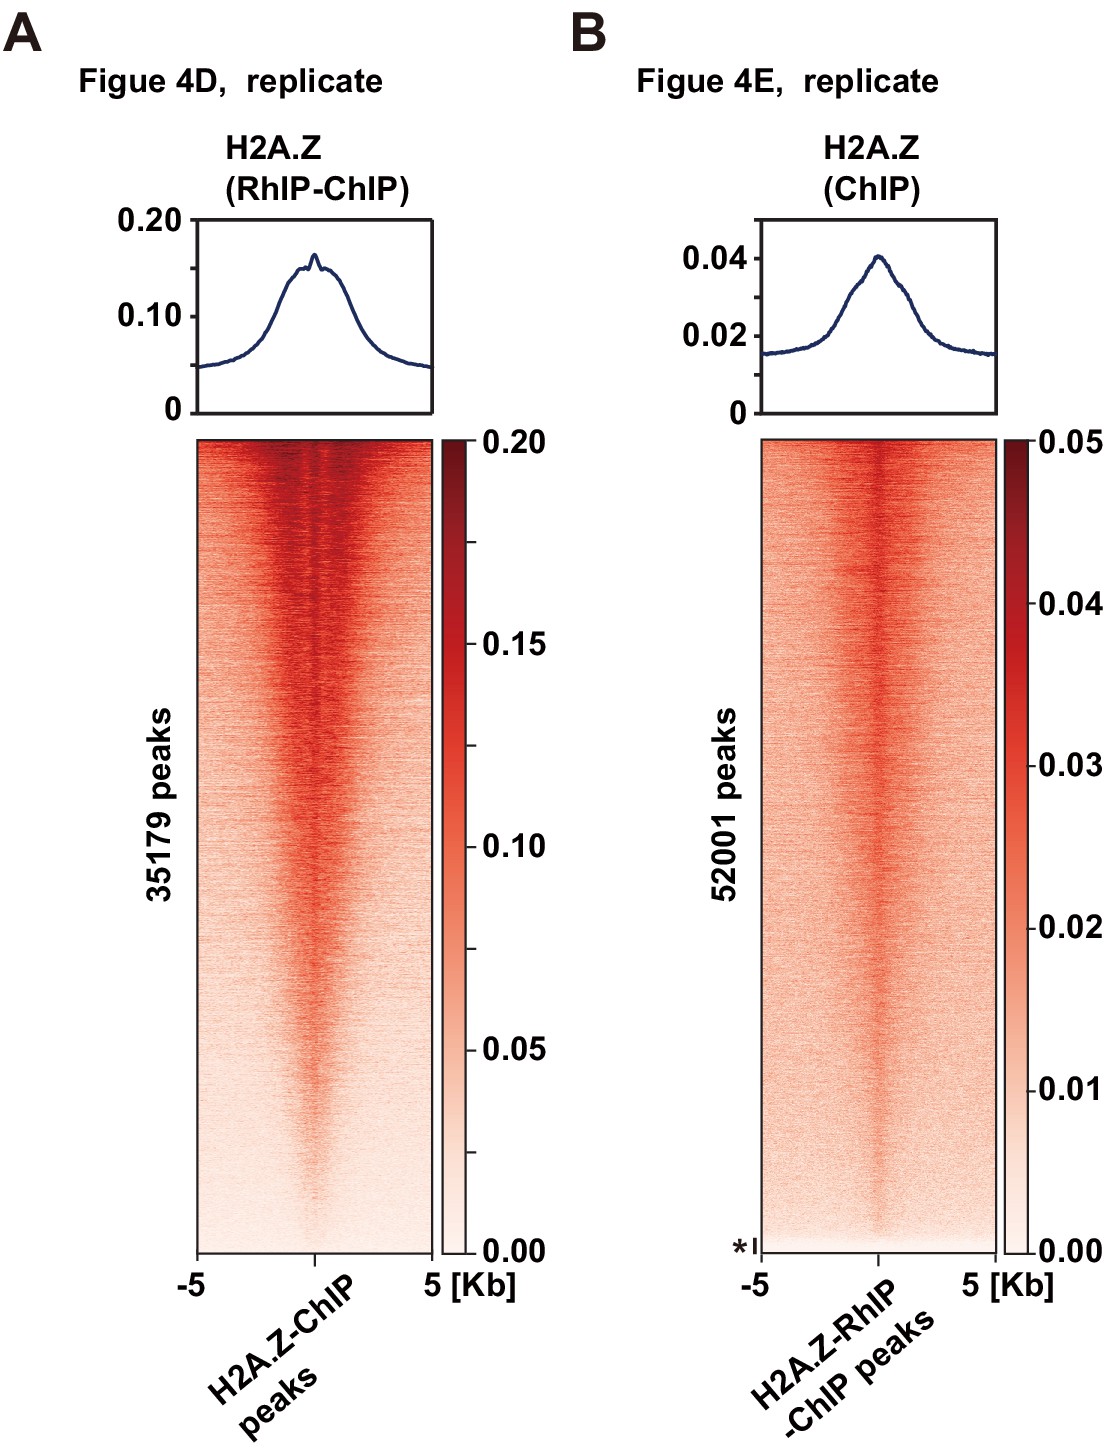
The biological replicate of the distribution analysis of incorporated H2A.Z in the RhIP-ChIP.
Figure 5 with 1 supplement
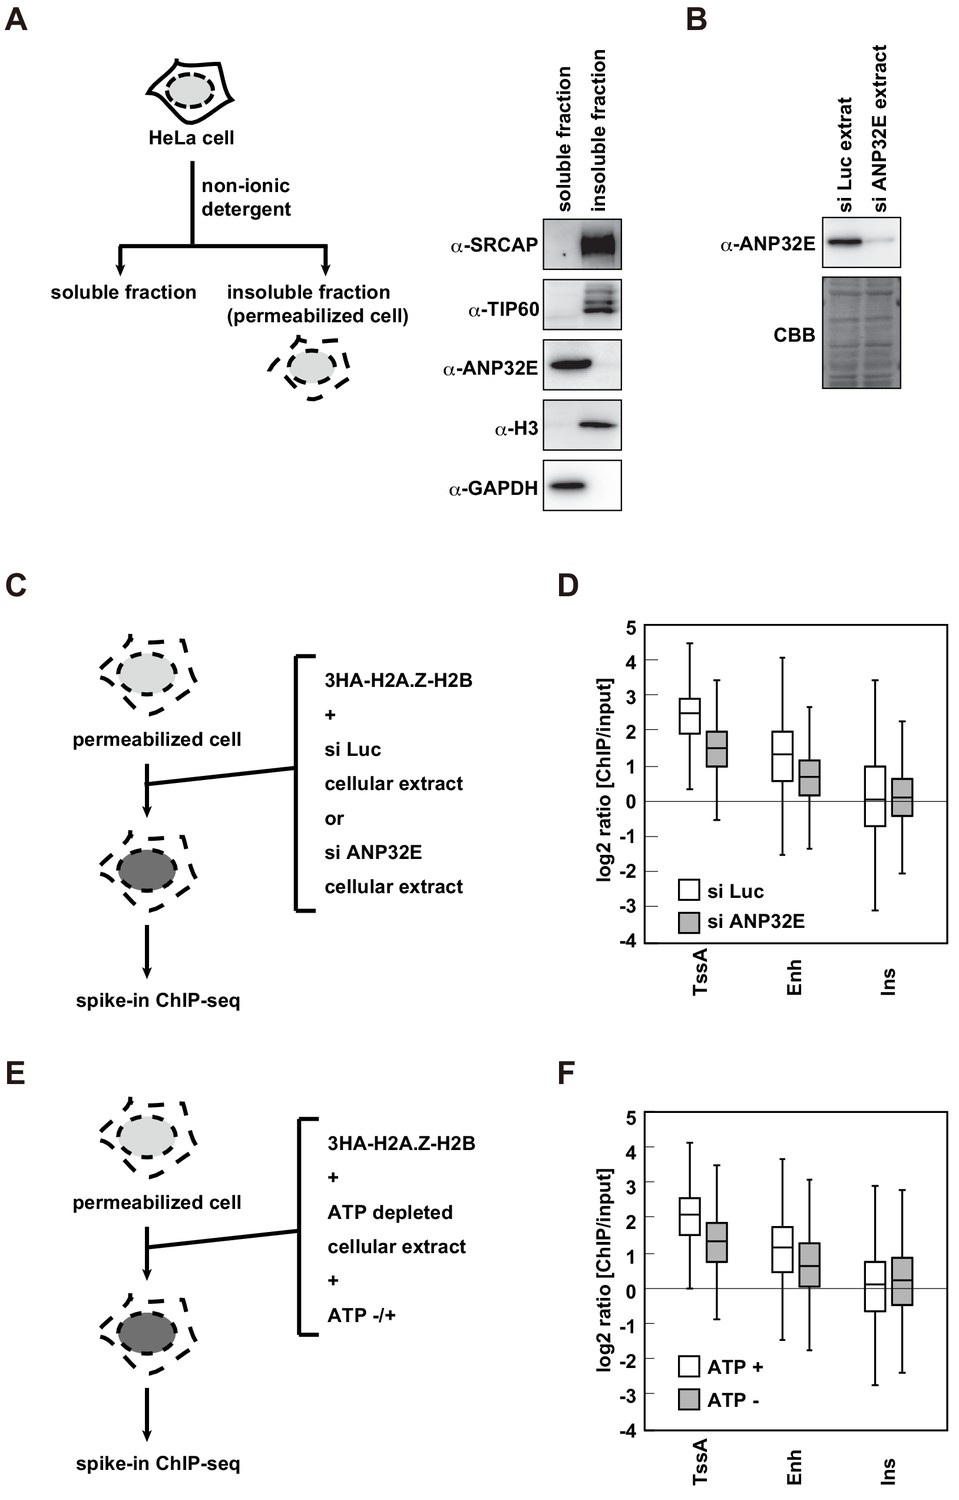
H2A.Z deposition requires both ANP32E and ATP in the RhIP assay.
(A) Scheme of cell fractionation (left). HeLa cells were treated with non-ionic detergent and the supernatant (soluble fraction), which is removed from permeabilized cells, and the pellet, which corresponds to permeabilized cells, were separated (insoluble fraction). Distributions of SRCAP, TIP60 and ANP32E were investigated by western blotting (right). Histone H3 and GAPDH served as the chromatin and cytoplasmic protein controls, respectively. (B) Preparation of the ANP32E-knockdown cellular extract. HeLa cells were transfected with siRNA against ANP32E. After 72 hr, the ANP32E-knockdown cellular extract was prepared from the cells. The ANP32E-knockdown was confirmed by western blotting (upper). Loading control with the membrane stained with CBB (lower). (C) Scheme of RhIP-ChIP-seq of H2A.Z using the ANP32E-knockdown cellular extract. (D) Enrichment of incorporated H2A.Z with the control or ANP32E-knockdown extract. Each chromatin region was previously annotated by the chromHMM, as follows. TssA: active TSS, Enh: enhancers, and Ins: insulator. (E) Scheme of RhIP-ChIP-seq of H2A.Z using the ATP-depleted cellular extract. (F) Enrichment of incorporated H2A.Z with the ATP-depleted or ATP-supplemented extract. Each chromatin region was the same as in (D).
Figure 5—figure supplement 1
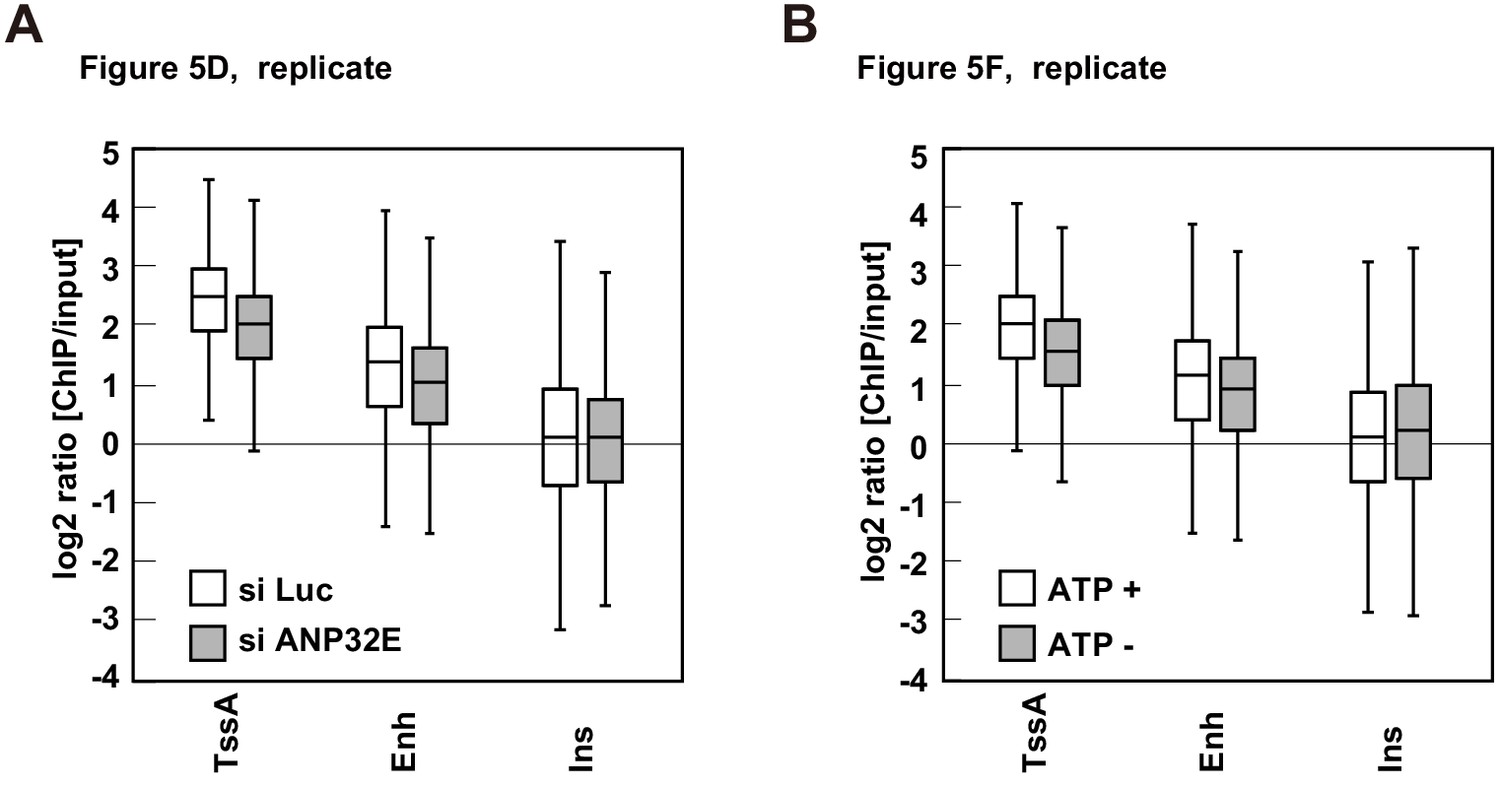
The biological replicate of RhIP-ChIP-seq analysis of H2A.Z using ANP32E- or ATP-depleted cellular extract.
Figure 6
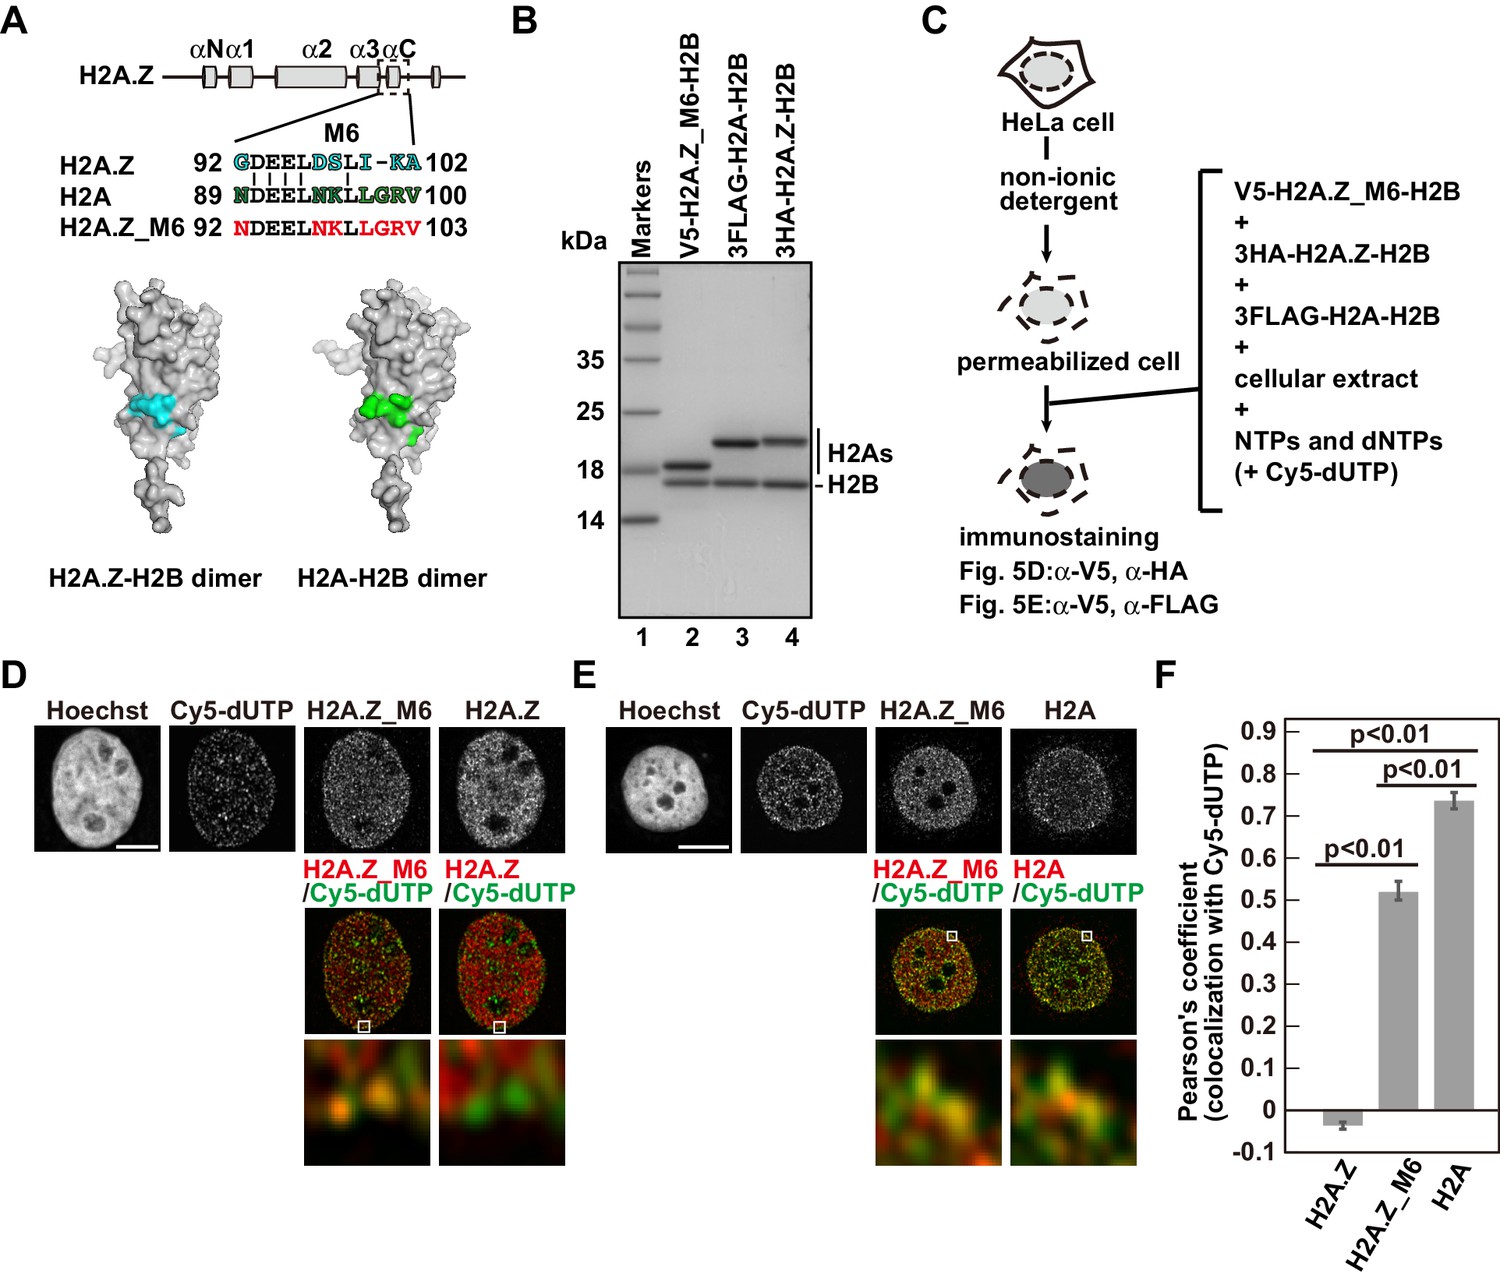
Identification of responsible residues for H2A- and H2A.Z-specific incorporations.
(A) Amino acid alignments of the H2A.Z M6 region and its counterpart in H2A (upper). The structural models of the H2A.Z-H2B and H2A-H2B dimers (PDB IDs: 3WA9 and 3AFA, respectively). The specific residues are highlighted in cyan or green, respectively. All residues are located on the surface of the dimers. (B) Reconstituted H2AZ_M6-H2B, H2A-H2B, and H2A.Z-H2B complexes were analyzed by SDS-16% PAGE with Coomassie Brilliant Blue staining. H2AZ_M6, H2A, and H2A.Z were expressed as N-terminally V5, 3FLAG, and 3HA fused proteins, respectively. Lane 1 indicates the molecular mass markers, and lanes 2–4 indicate the H2A.Z_M6-H2B, H2A-H2B, and H2A.Z-H2B complexes, respectively. (C) Schematic representation of the RhIP assay, using the reconstituted H2A.Z_M6-H2B, H2A-H2B, and H2A.Z-H2B complexes. (D) RhIP-immunostaining images of H2A.Z and H2A.Z_M6. Exogenously added H2A.Z-H2B and H2A.Z_M6-H2B complexes were stained with the anti-V5 or -HA antibody. Cells in S phase were monitored with Cy5-dUTP. Middle: merged images of Cy5-dUTP (green) and H2A.Z_M6 (red) or H2A.Z (red). Bottom: magnified images of boxed areas are shown. Bar indicates 5 μm. (E) RhIP-immunostaining images of H2A and H2A.Z_M6. Exogenously added H2A-H2B and H2A.Z_M6-H2B complexes were stained with the anti-V5 or -FLAG antibody. Cells in S phase were monitored with Cy5-dUTP. Middle: merged images of Cy5-dUTP (green) and H2A.Z_M6 (red) or H2A (red). Bottom: magnified images of boxed areas are shown. Bar indicates 5 μm. (F) Colocalization analyses of Cy5-dUTP and H2A.Z, H2A.Z_M6 or H2A in late S phase (n > 35 cells). Experiments were repeated three times and averaged data are shown. The two-tailed Student’s t-test was used for the statistical comparisons.
Figure 7
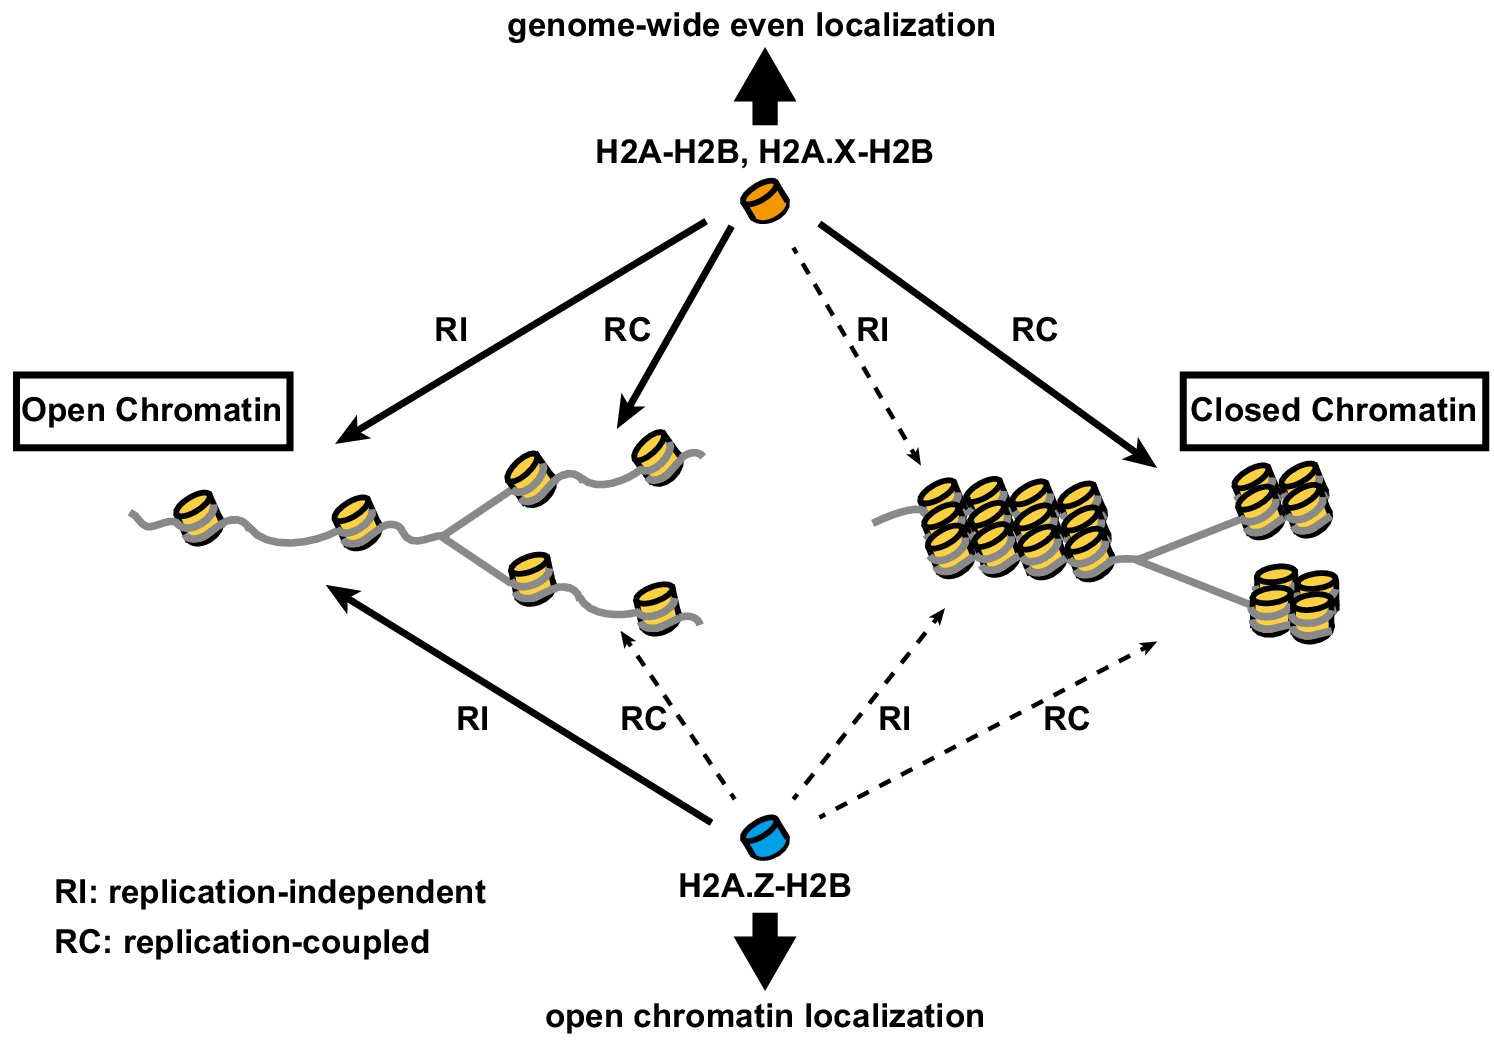
Model of differential histone incorporations into open and closed chromatin.
In open chromatin, the H2A-H2B and H2A.X-H2B complexes are incorporated in replication-independent (RI) and replication-coupled (RC) manners, respectively, while H2A.Z-H2B is incorporated only in a replication-independent manner. In closed chromatin, new histone depositions of H2A and H2A.X, but not H2A.Z, occur only in a replication-coupled manner. This leads to the global localizations of H2A-H2B and H2A.X-H2B, as well as the specific localization of H2A.Z-H2B, including its elimination from closed chromatin.
Tables
Key resources table
| Reagent type (species) or resource | Designation | Source or reference | Identifiers | Additional information |
|---|---|---|---|---|
| Antibody | Anti-HA (mouse, monoclonal) | Santa Cruz | sc-7392 RRID:AB_627809 | IF(1:1,000) |
| Antibody | Anti-HA (rabbit, monoclonal) | Cell Signaling Technology | 3724 RRID:AB_1549585 | IF(1:2,000) only used in Figure 1—figure supplements 1D and 3D |
| Antibody | Anti-DDDDK (anti-FLAG) (rabbit, polyclonal) | MBL | PM020 RRID:AB_591224 | IF(1:500) |
| Antibody | Anti-V5 (chicken, polyclonal) | Abcam | ab9113 RRID:AB_307022 | IF(1:1000) |
| Antibody | Anti-p60 (rabbit, monoclonal) | Abcam | ab109442 RRID:AB_10861771 | IF(1:400) |
| Antibody | Anti-HIRA (mouse, monoclonal) | Active Motif | WC119.2H11 RRID:AB_10715607 | IF(1:200) |
| Antibody | Anti-HIRA (rabbit, monoclonal) | Abcam | ab129169 RRID:AB_11140220 | WB(1:500) |
| Antibody | Anti-p60 (rabbit, monoclonal) | Abcam | ab109442 RRID:AB_10861771 | WB(1:400) |
| Antibody | Anti-H3 (mouse, monoclonal) | MBL | MABI0301 RRID:AB_11142498 | WB(1:1000) |
| Antibody | Anti-SRCAP (rabbit, polyclonal) | Kerafast | ESL103 | WB(1:1000) |
| Antibody | Anti-TIP60 (mouse, monoclonal) | Santa Cruz | sc-166323 RRID:AB_2296327 | WB(1:50) |
| Antibody | Anti-ANP32E (rabbit, polyclonal) | MyBioSource | MBS9214243 | WB(1:1000) |
| Antibody | Anti-GAPDH (mouse, monoclonal) | MBL | ML171-3 RRID:AB_10597731 | WB(3:1000) |
| Sequence-based reagent | GAPDH_F | This paper | PCR primers | AAAGGGTGCAGCTGAGCTAG |
| Sequence-based reagent | GAPDH_R | This paper | PCR primers | TACGAAGCCCTTCCAGGAGA |
| Sequence-based reagent | LINC02199_F | This paper | PCR primers | CCGGTGTCAAATGTCACAATGAA |
| Sequence-based reagent | LINC02199_R | Thermo Fisher | PCR primers | GGGGTTTTGAGGATTCCAAAGTG |
| Sequence-based reagent | si_p60 gene | This paper | siRNA | AAUGAUAACAAGGAGCCGGAGdTdT |
| Sequence-based reagent | si_p150 gene | This paper | siRNA | CUGUCAUGUGGGUUCUGACdTdT |
| Sequence-based reagent | ON-TARGET SMARTpool siRNA (HIRA gene) | Dharmacon | siRNA | L-013610-00-0005 |
| Cell line (Homo sapiens) | HeLa | Peter R Cook | N/A | A human cervical cancer cell line (female origin) |
| Cell line (Homo sapiens) | SF8628 | Merck | SCC127 RRID:CVCL_IT46 | Human DIPG H3.3-K27M Cell Line |
Additional files
Download links
A two-part list of links to download the article, or parts of the article, in various formats.
Downloads (link to download the article as PDF)
Open citations (links to open the citations from this article in various online reference manager services)
Cite this article (links to download the citations from this article in formats compatible with various reference manager tools)
Chromatin structure-dependent histone incorporation revealed by a genome-wide deposition assay
eLife 10:e66290.
https://doi.org/10.7554/eLife.66290


