Distinct forms of synaptic plasticity during ascending vs descending control of medial olivocochlear efferent neurons
- Physiology & Pharmacology Graduate Program, Oregon Health & Science University, United States
- Oregon Hearing Research Center and Vollum Institute, Oregon Health & Science University, United States
Figures
Figure 1
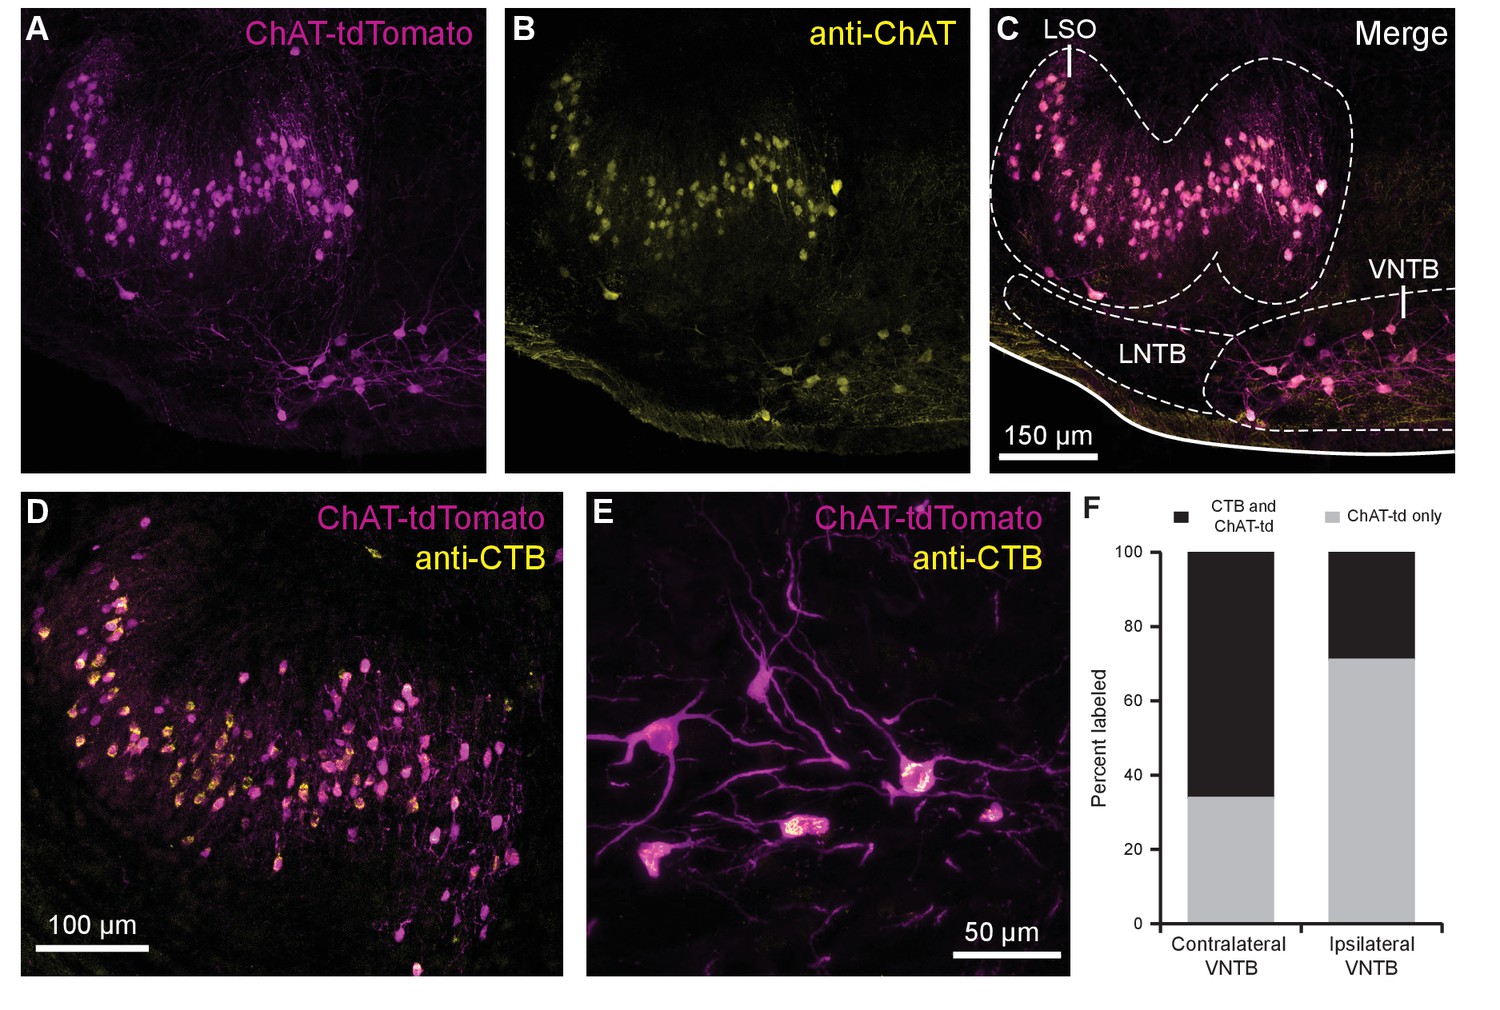
Cholinergic auditory efferent neurons identified with the retrograde tracer CTB were tdTomato-positive in ChAT-Cre/tdTomato mice.
(A) ChAT-Cre/tdTomato-positive neurons in the LSO and VNTB of the superior olivary complex co-labeled with anti-ChAT antibody (B) confirming they are cholinergic neurons (C). ChAT-Cre/tdTomato-positive neurons in the ipsilateral LSO (D) and contralateral VNTB (E) were retrogradely labeled by cochlear CTB injections. (F) Contralateral to cochlear CTB injections, 66.1% of ChAT-Cre/tdTomato-positive VNTB neurons were labeled. In ipsilateral VNTB, 28.9% of ChAT-Cre/tdTomato=positive neurons were labeled (N = 3 mice, 205 cells). Abbreviations: LNTB, lateral nucleus of the trapezoid body; LSO, lateral superior olive; VNTB, ventral nucleus of the trapezoid body; CTB, cholera toxin subunit B.
Figure 2

Medial olivocochlear neurons accurately encoded stimulus intensity and duration.
(A) Whole-cell current-clamp recording example of medial olivocochlear (MOC) neuron voltage responses to current injections. Black arrowhead illustrates a double undershoot after-hyperpolarization waveform often observed at action potential threshold-level current injection and is characteristic of MOC neurons. (B) Example of the instantaneous spike rate over time at increasing current injections from the same neuron in (A). Current steps begin at 0.5 nA and increase to 3.0 nA in 0.5 nA steps. (C) Mean spike rate during 500-ms current injections of increasing intensity (N = 33). Averages for current injections up to 900 pA demonstrated a linear input-output curve. A linear function was fit to the mean data, and the y-intercept was forced to 0 pA (, r2 = 0.972). (D) Same neurons from (C), with current injections up to 4 nA. (E) The ratio of spike-rate adaptation during the last five spikes compared to spikes #1–5 (N = 11). Analysis was not performed on current steps below 200 pA for panels (E) and (F), as no MOC neuron met the minimum requirement of 15 action potentials at those current intensities. (F) The mean spike rate of spikes #5–10 and the mean spike rate of the last five spikes. All error bars are ± SEM (N = 11). Linear functions were fit to the average spike rate of spikes #5–10 (, r2 = 0.999) and the average spike rate of the last five spikes (, r2 = 0.997).
Figure 3 with 1 supplement
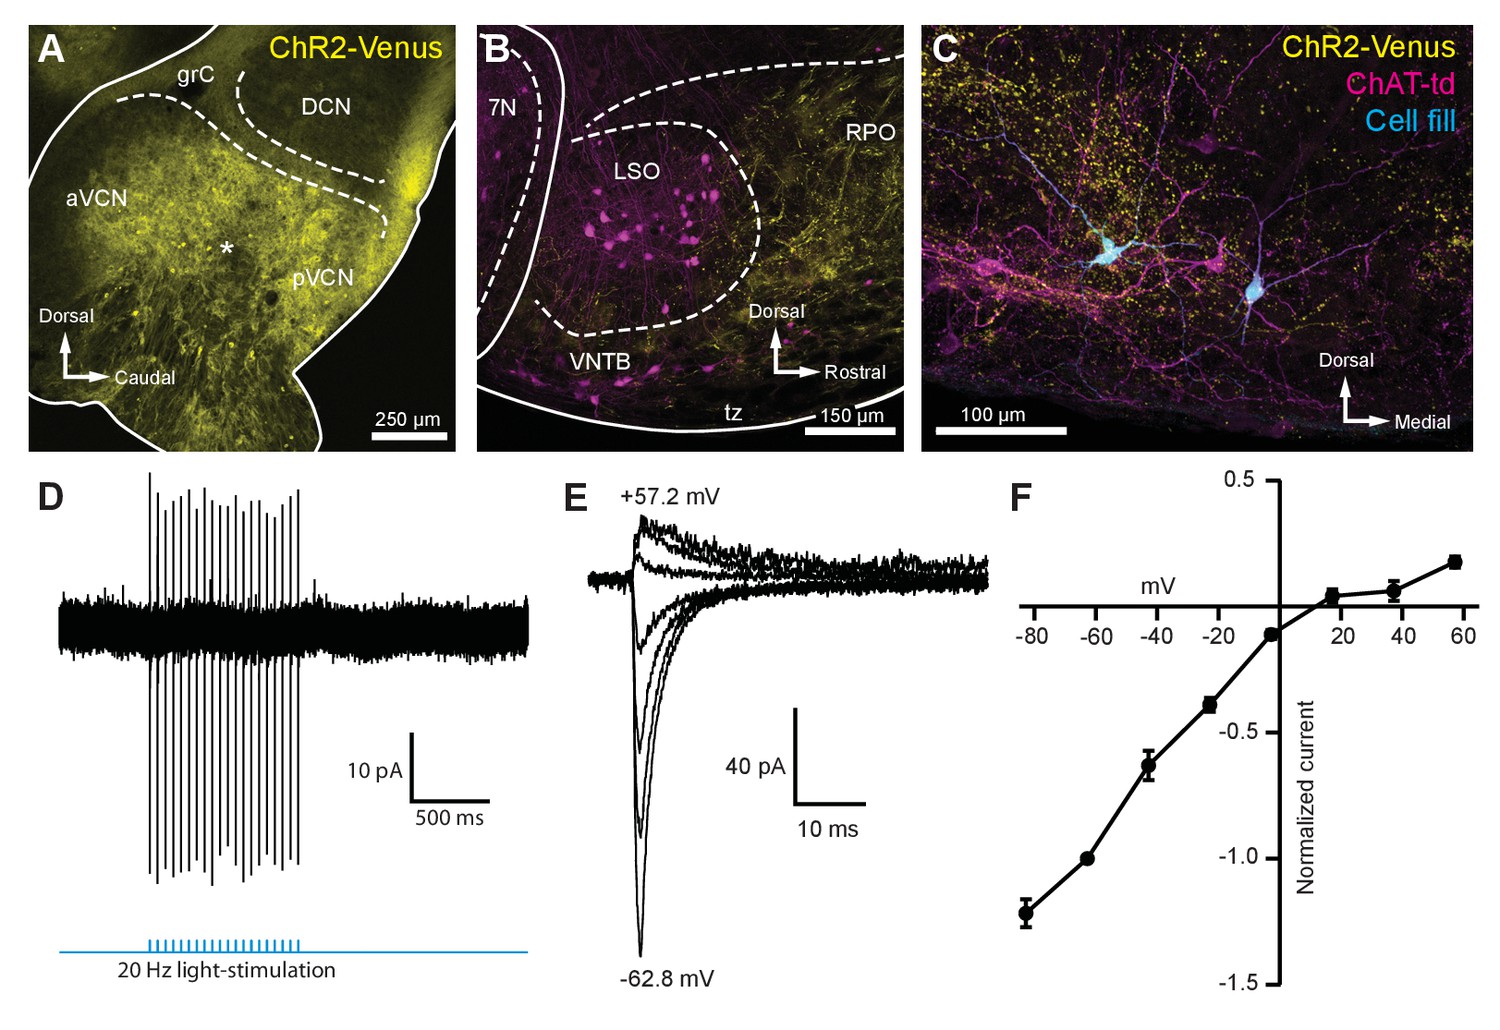
Light-evoked EPSCs produced by ascending cochlear nucleus inputs were due to inwardly rectifying AMPARs.
(A) Sagittal micrograph of a ChR2-Venus-positive ventral cochlear nucleus (* marks the presumed injection site). (B) Micrograph from the same mouse as in (A), where ChR2-positive fibers are present in the VNTB and RPO near MOC neuron somata. (C) Two MOC neurons in the VNTB that were recorded from a coronal brain section and filled with biocytin after post-hoc histochemistry. (D) Example of loose-patch cell-attached recording of a ChR2-Venus-positive neuron in the VCN. Neurons positive for ChR2-Venus can reliably fire action potentials in response to light stimuli. (E) An example of EPSCs evoked during voltage clamp, with holding potentials ranging from −62.8 mV to +57.2 mV in 20 mV steps. Each sweep was baselined to 0 pA and low-pass Bessel filtered at 3000 Hz. (F) I-V relation of normalized cumulative data (N = 3–9 per mean). Error bars are ± SEM. Abbreviations: VCN, ventral cochlear nucleus; aVCN, anteroventral cochlear nucleus; pVCN, posteroventral cochlear nucleus; DCN, dorsal cochlear nucleus; grC, granule cell layer; 7N, facial motor nucleus; RPO, rostral periolivary region; MOC, medial olivocochlear; VNTB, ventral nucleus of the trapezoid body.
Figure 3—figure supplement 1
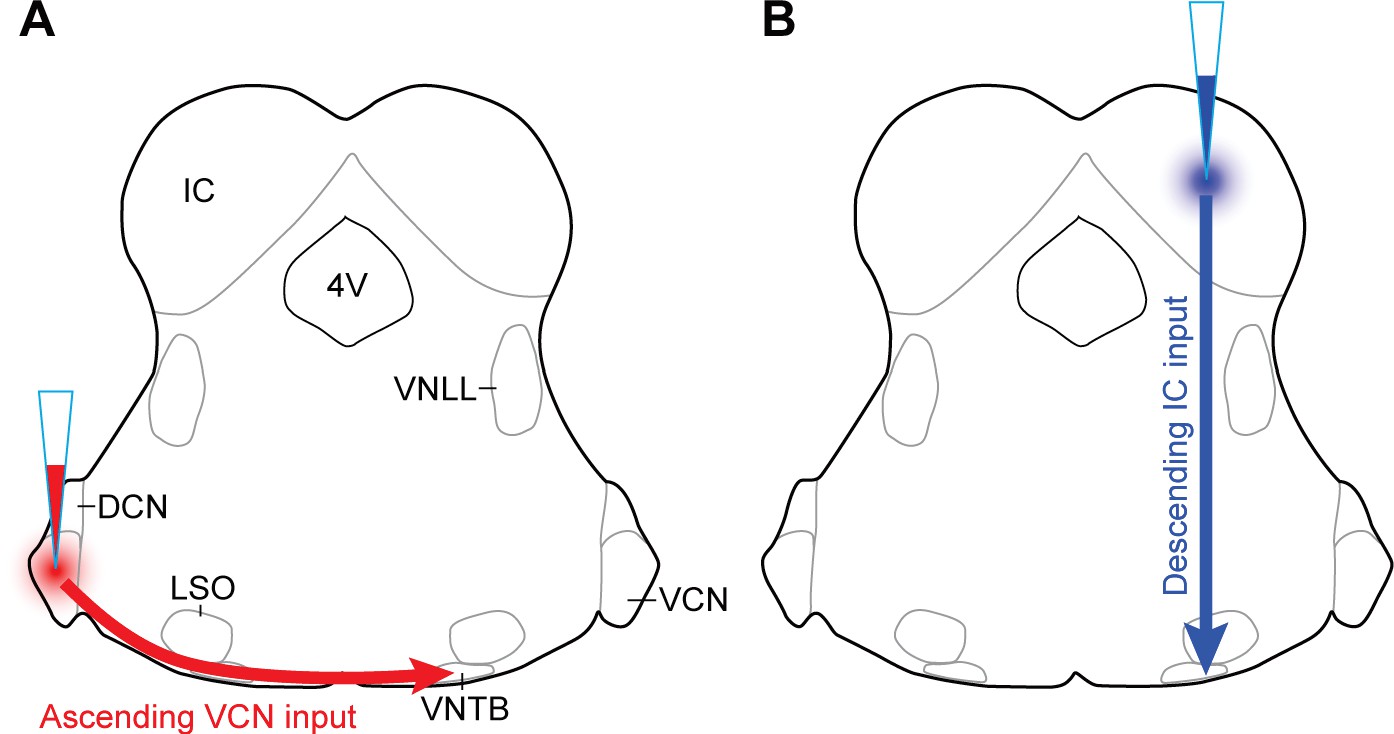
AAV injection schemes to target ascending or descending inputs to MOC neurons.
Schematics depicting a unilateral injection of ChR2-Venus-expressing AAV (AAV1-CAG-ChR2-Venus-WPRE-SV40) into (A) ventral cochlear nucleus (VCN) or (B) inferior colliculus (IC) of ChAT-Cre/tdTomato mice.
Figure 4 with 1 supplement
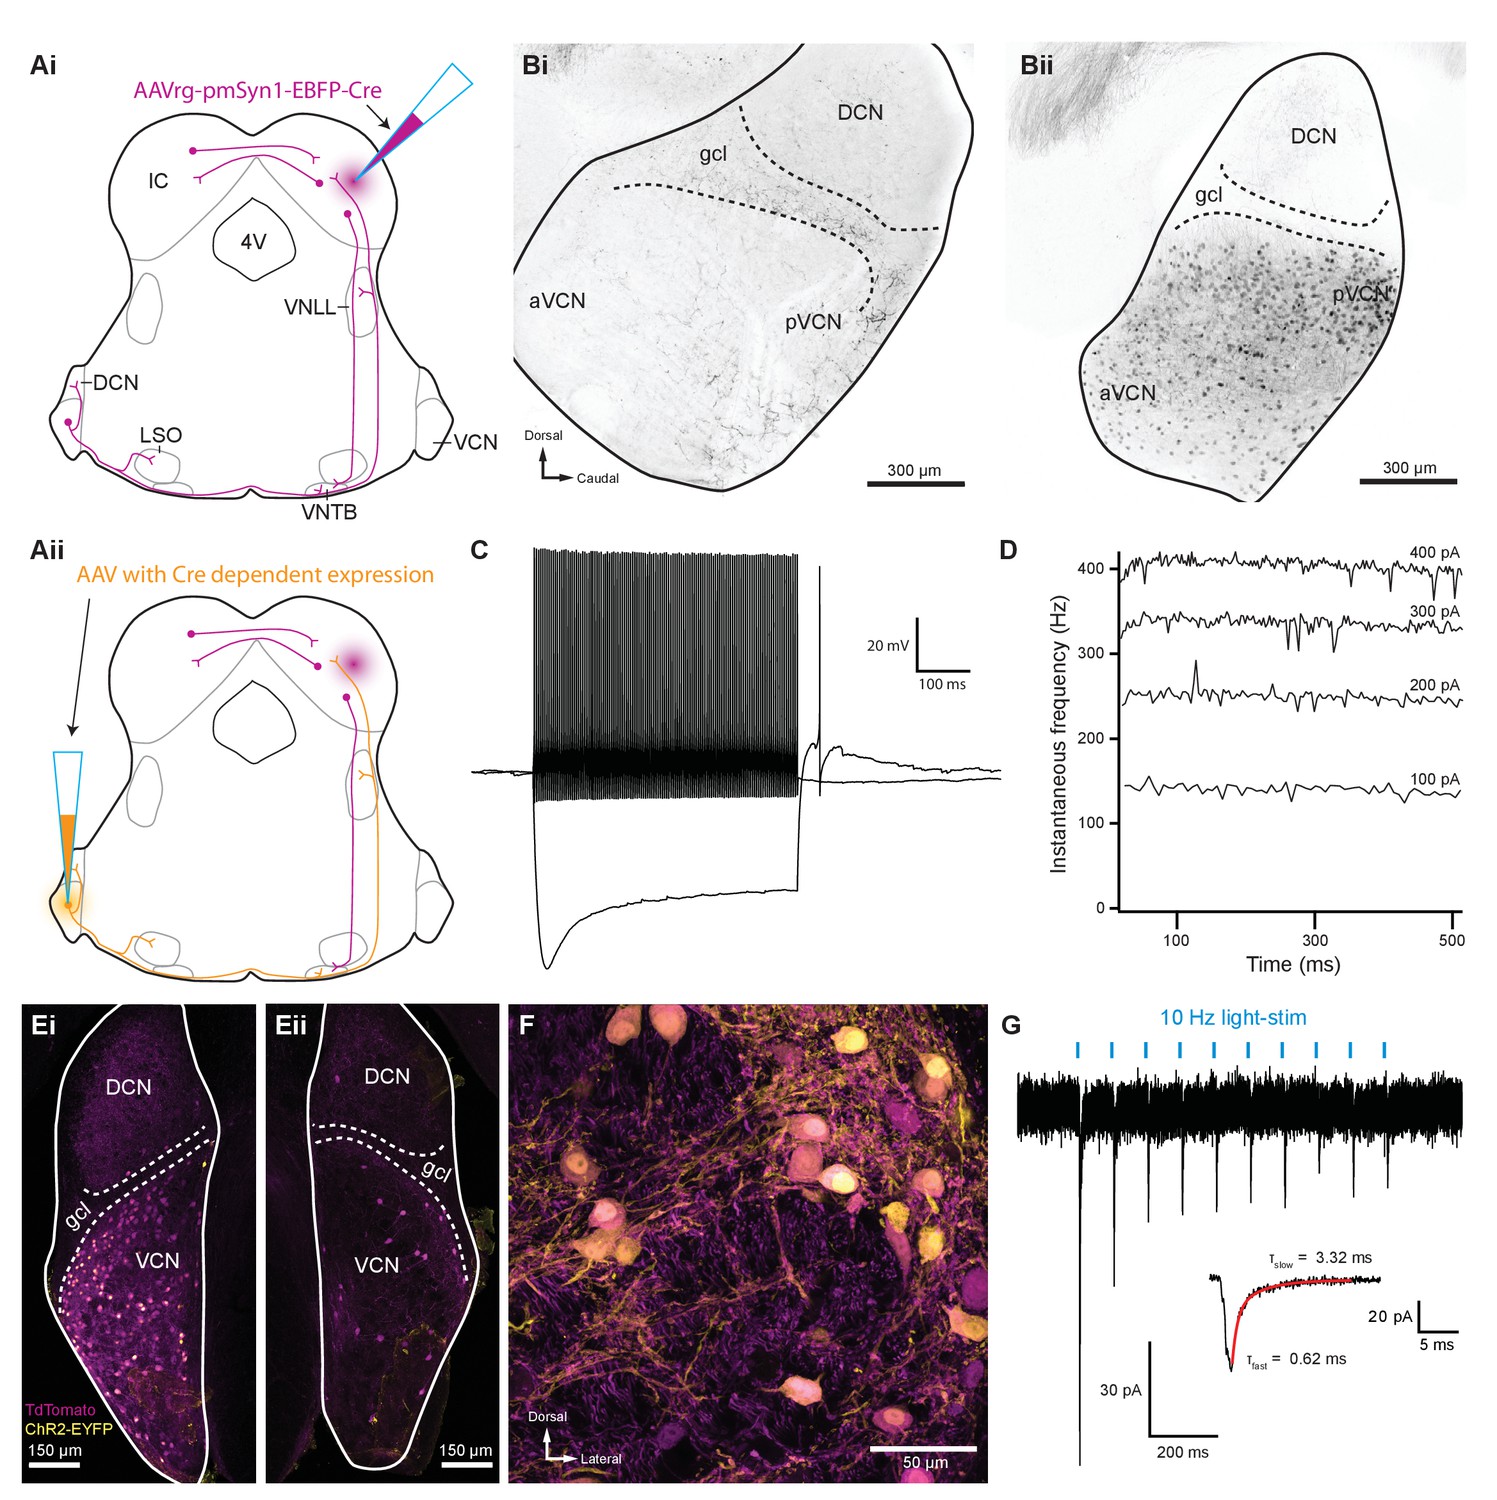
Inferior colliculus projecting T-stellate neurons synapsed onto MOC neurons in the ventral nucleus of the trapezoid body.
(Ai) Schematic depicting an inferior colliculus injection site of Cre recombinase-expressing retrograde AAV (AAVrg-pmSyn1-EBFP-Cre) and putative retrogradely infected neurons and projections (magenta), including T-stellate cells and descending IC projections to olivocochlear efferents. (Aii) Continuation of (Ai), depicting the ventral cochlear nucleus injection site for a second AAV expressing a Cre-dependent channelrhodopsin. T-stellate neurons (orange) positive for both AAVs project to the VNTB, where MOC neuron somata reside. (Bi) Sagittal micrograph of a ChAT-Cre/tdTomato cochlear nucleus. TdTomato-positive fibers were visible throughout the nucleus; however, there was a complete lack of tdTomato-positive somata in VCN. (Bii) Sagittal micrograph of a ChAT-Cre/tdTomato cochlear nucleus infected with Cre-expressing retrograde AAV that was injected into the contralateral IC. TdTomato-positive somata were visible throughout the VCN. (C) Example of a current-clamp whole-cell recording from an AAVrg-pmSyn1-EBFP-Cre/tdTomato-positive cell in the VCN. All recordings from tdTomato-positive cells in VCN (N = 13) exhibited responses to current injections characteristic of T-stellate cells. Action potentials fired tonically with a sustained rate in response to depolarizing current injections (0.2 nA). Hyperpolarizing current injections (−0.5 nA) revealed a rectifying voltage response. (D) Example plot of instantaneous frequency of action potentials throughout the duration of depolarizing stimuli ranging from 100 to 400 pA. The spike frequency is sustained throughout the duration of the stimulus, which is characteristic of T-stellate neurons in the VCN. (Ei) Coronal micrograph of a cochlear nucleus contralateral to Cre-expressing retrograde AAV infection of IC. The VCN contralateral to IC infection was additionally infected with AAV2-EF1a-DIO-hChR2(E123T/T159C)-p2A-EYFP (UNC Vector Core), which expressed EYFP in the cytosol. (Eii) Coronal micrograph of a cochlear nucleus ipsilateral to Cre-expressing retrograde AAV infection of IC from the same mouse as in (Ei). Many somata positive for both tdTomato and EYFP are seen in VCN contralateral to the IC infection in (Ei), whereas no cells positive for EYFP are seen in VCN ipsilateral to the IC infection in (Eii). (F) A micrograph of VCN contralateral to Cre-expressing retrograde AAV infection of the IC depicting tdTomato and EYFP expression from the same mouse as in (Ei) and (Eii). (G) Whole-cell voltage-clamp recording from an MOC neuron of a ChAT-Cre/tdTomato mouse contralateral to T-stellate cells expressing ChR2 via the intersectional AAV approach. Light-evoked EPSCs were stimulated with 2 ms pulses of blue light at 10 Hz, and in this example, the EPSCs were depressed with repetitive stimulation. This trace was created by averaging 20 sweeps of the same protocol from the same MOC neuron. Inset illustrates fast and slow decay time constants (τ) of the first averaged EPSC and were fit with a double exponential function (red). Abbreviations: AAV, adeno-associated virus; EYFP, enhanced yellow fluorescent protein; IC, inferior colliculus; 4V, fourth ventricle; VNLL, ventral nucleus of the lateral lemniscus; DCN, dorsal cochlear nucleus; VCN, ventral cochlear nucleus; aVCN, anteroventral cochlear nucleus; pVCN, posteroventral cochlear nucleus; LSO, lateral superior olive; MOC, medial olivocochlear; VNTB, ventral nucleus of the trapezoid body.
Figure 4—figure supplement 1
Intersectional AAV injection micrographs and T-stellate cell targets.
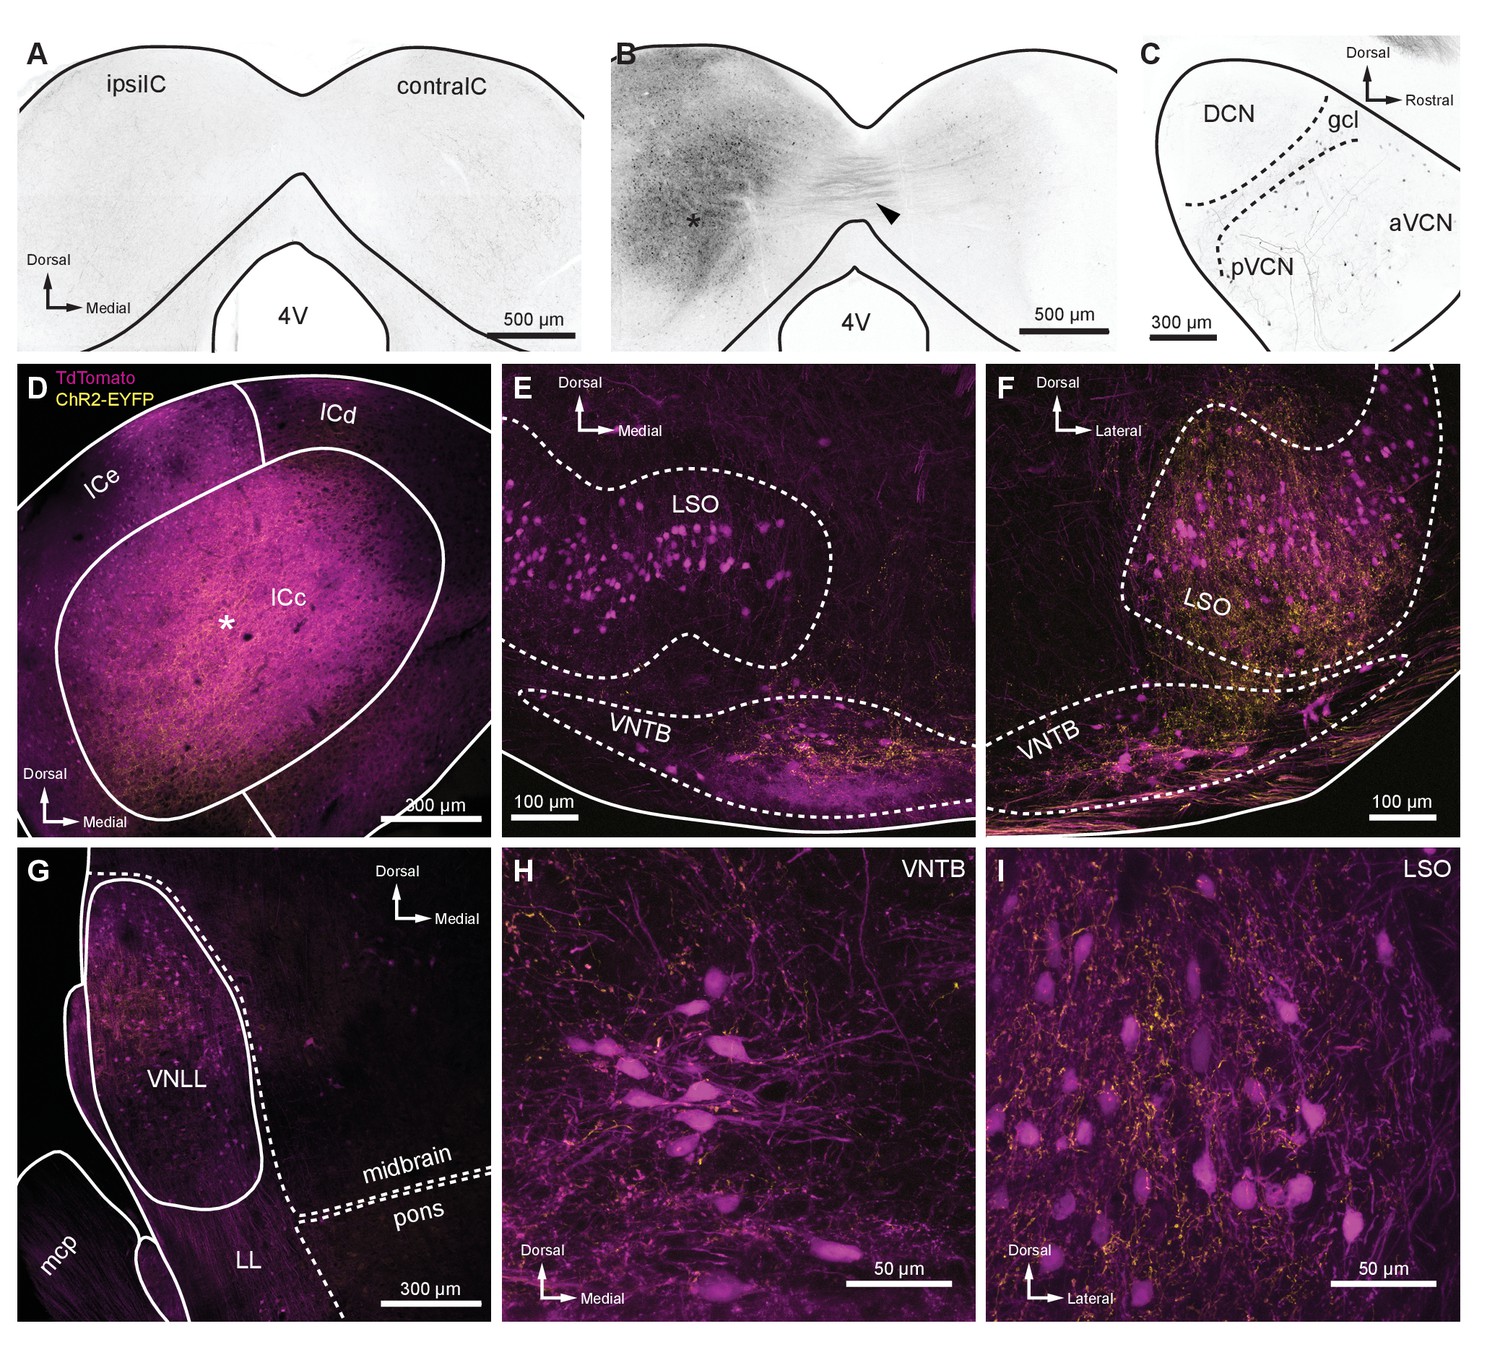
(A) The ChAT-Cre line was crossed to an Ai9 reporter to generate mice with tdTomato in Cre-positive cells (ChAT-Cre/tdTomato). This coronal micrograph of the IC showed tdTomato expression before AAV infection. TdTomato fluorescence is represented in grayscale. (B) Coronal micrograph of the IC, ipsilateral (ipsilIC) and contralateral (contralIC) to the injection site of retrograde AAV (AAVrg-pmSyn1-EBFP-Cre, asterisk), which infected local neurons, and neurons that projected to the injection site. TdTomato-expressing projections in the commissure of the IC were visible (arrowhead), as were retrogradely labeled cells in IC contralateral to the infection (contraIC). (C) Sagittal micrograph of cochlear nucleus ipsilateral to Cre-expressing retrograde AAV infection of ipsilIC, using the same mouse as in (B). All micrographs in (D–I) were from coronal sections of a ChAT-Cre/tdTomato mouse infected with AAVrg-pmSyn1-EBFP-Cre in IC and AAV9-EF1a-DIO-hChR2(H134R)-EYFP in VCN contralateral to IC infection. EYFP is fused to ChR2, enhancing the visualization of T-stellate projections over cytosolic fluorophores. (D) Coronal micrograph of IC, where ChAT-Cre/tdTomato-positive neurons were seen in close proximity to an AAVrg-pmSyn1-EBFP injection site (asterisk). T-stellate-originating ChR2-EYFP-positive fibers projecting to the central nucleus of the IC (ICc) were also visible (yellow). (E) Micrograph of the superior olivary complex ipsilateral to the IC infection. Cholinergic neurons positive for ChAT-Cre/tdTomato delineate the LSO and VNTB. TdTomato-positive fibers originating from the IC were seen in the ventral VNTB (compare to contralateral VNTB in panel (F)). T-stellate fibers positive for ChR2-EYFP were prominently visible within, and dorsal to, VNTB, with little to no expression in LSO. (F) Micrograph of superior olivary complex contralateral to IC infection. T-stellate fibers positive for ChR2-EYFP were prominently visible within LSO and VNTB. (G) Micrograph of LL ipsilateral to the IC infection. T-stellate fibers were visible within the VNLL. Cells positive for tdTomato were likely due to trans-synaptic Cre expression (Zingg et al., 2017) or ectopic ChAT-Cre expression. (H–I) High-magnification micrographs of VNTB (H) and LSO (I) ipsilateral and contralateral to IC infection, respectively. T-stellate boutons positive for ChR2-EYFP terminated in both nuclei. Abbreviations: AAV, adeno-associated virus; EYFP, enhanced yellow fluorescent protein; IC, inferior colliculus; LL, lateral lemniscus; VNLL, ventral nucleus of the lateral lemniscus; VCN, ventral cochlear nucleus; LSO, lateral superior olive; VNTB, ventral nucleus of the trapezoid body.
Figure 5 with 1 supplement
Light-evoked EPSCs produced by descending inferior colliculus inputs were due to inwardly rectifying AMPARs.
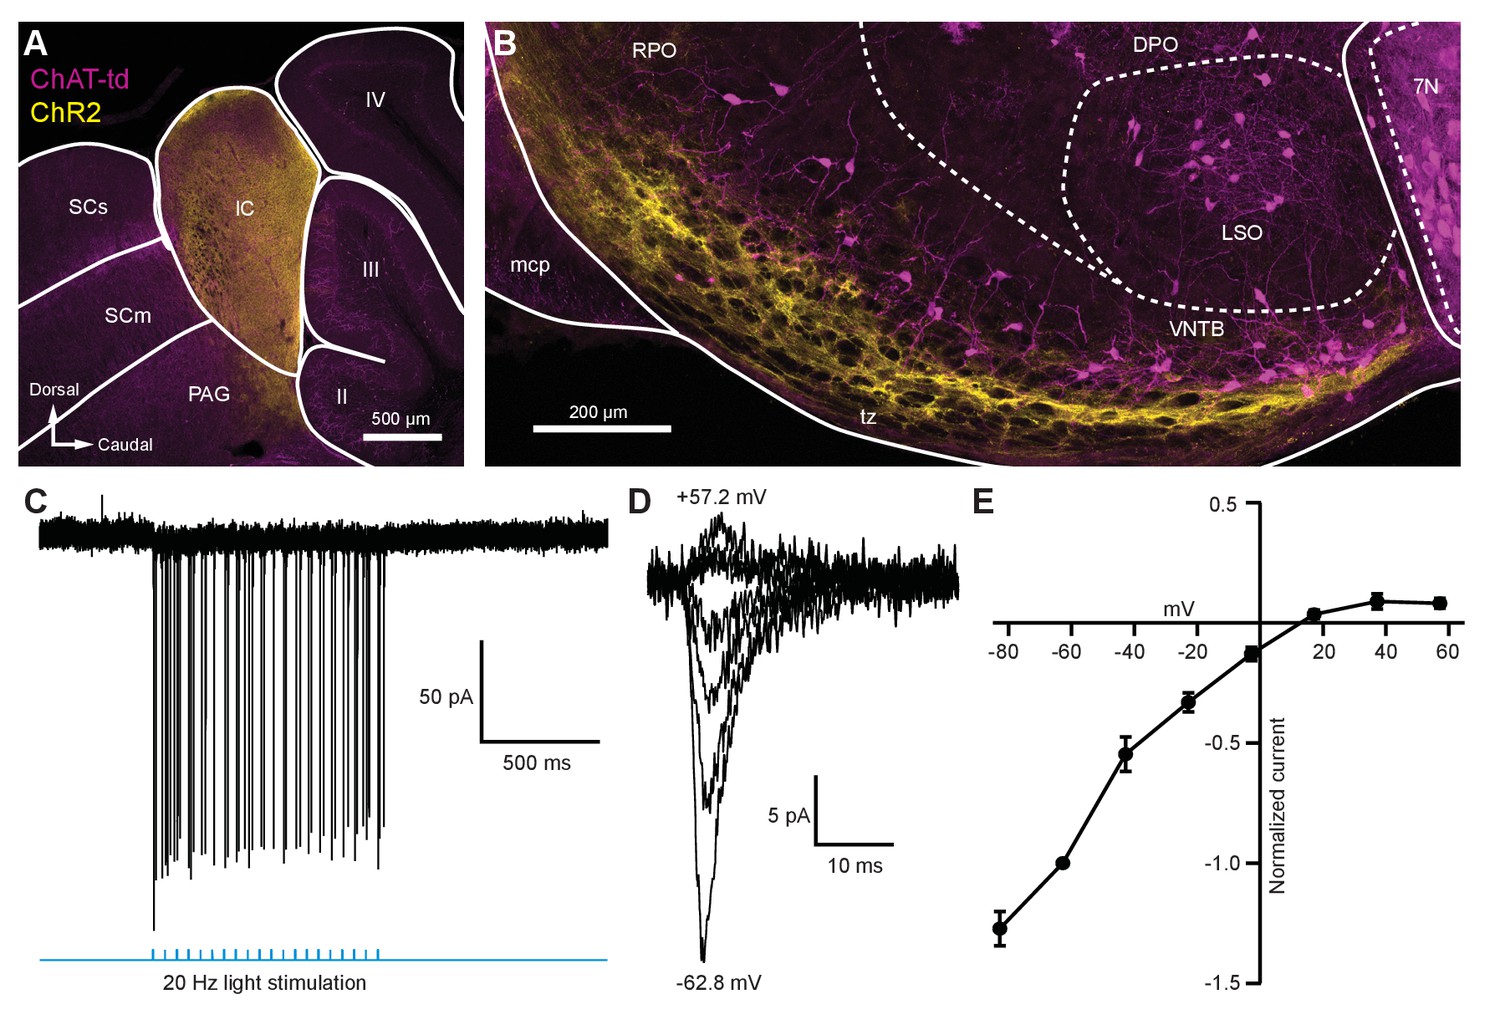
(A) Sagittal micrograph of a ChAT-Cre/tdTomato brain section showing an IC injection site positive for ChR2-Venus. (B) Sagittal micrograph of the superior olivary complex from the same mouse as in (A). The majority of ChR2-positive fibers were visible in the ventral portion of the VNTB/RPO, near MOC neuron somata. (C) Loose-patch cell-attached recording of a ChR2-positive neuron in the IC. ChR2-Venus-positive neurons can reliably fire action potentials in response to light stimuli. (D) An example of EPSCs evoked during voltage clamp, with holding potentials ranging from −62.8 mV to +57.2 mV in 20 mV steps. (E) I-V relation reporting normalized cumulative data (N = 4–7 per mean, N = 2 at +57.2 mV). Error bars are ± SEM. Abbreviations: SCs, sensory superior colliculus; SCm, motor superior colliculus; IC, inferior colliculus; PAG, periaqueductal gray; labeled II-IV, cerebellar lobules; PG, pontine gray; RPO, rostral periolivary region; DPO, dorsal periolivary region; mcp, middle cerebellar peduncle; LSO, lateral superior olive; VNTB, ventral nucleus of the trapezoid body; 7N, facial motor nucleus; MOC, medial olivocochlear.
Figure 5—figure supplement 1
IC projections to MOC neurons.
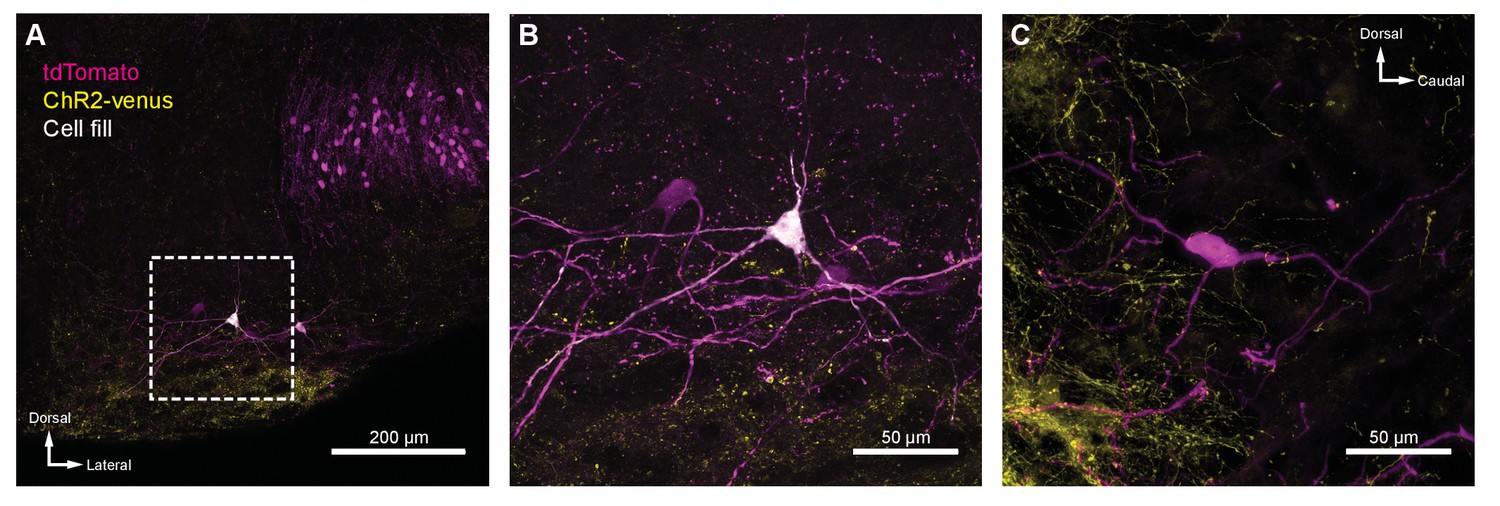
(A) Coronal micrograph of biocytin-filled medial olivocochlear (MOC) neuron in ventral nucleus of the trapezoid body (VNTB) ipsilateral to ChR2-Venus-infected inferior colliculus (IC). (B) High-magnification micrograph of MOC neuron from (A). (C) High-magnification sagittal micrograph of a putative MOC neuron from Figure 5B. While a majority of ChR2-Venus-positive fibers were ventral to MOC neurons, many positive fibers were in close apposition to MOC neuron dendrites and somata.
Figure 6
EPSC inward rectification was due to endogenous polyamine block and Ca2+-permeable AMPARs.
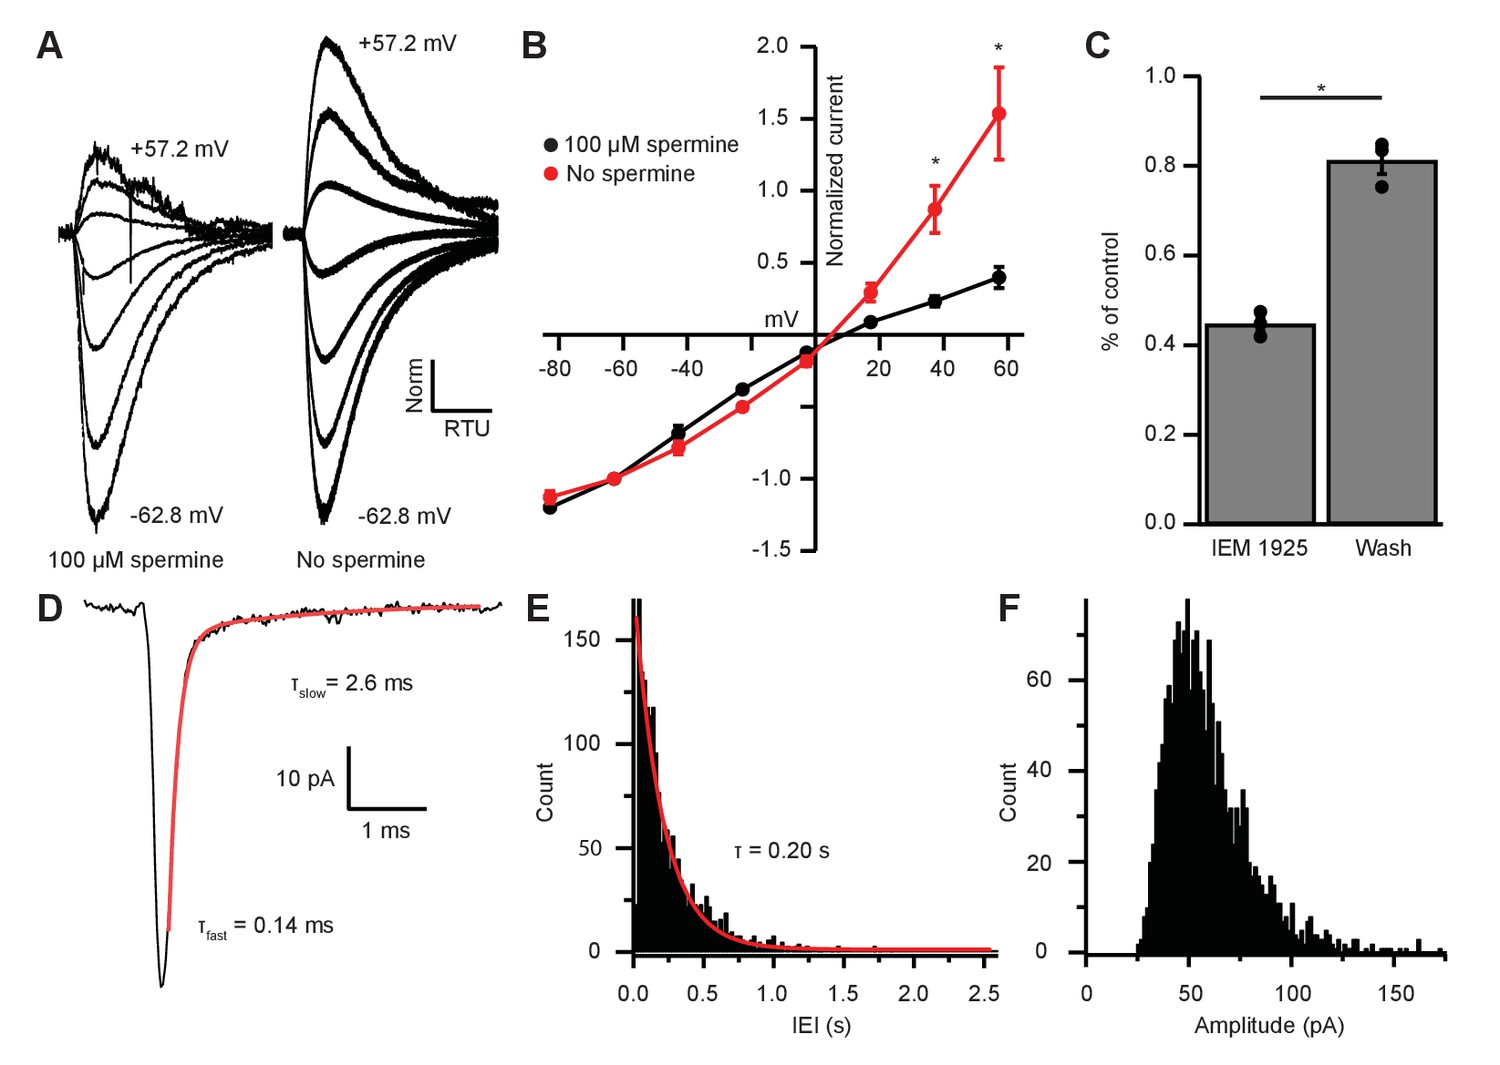
(A) α-amino-3-hydroxy-5-methyl-4-isoxazolepropionic acid receptor (AMPAR)-mediated currents in medial olivocochlear (MOC) neurons evoked by 1 mM pressure-puffed glutamate near the cell soma. The soma of MOC neurons were dialyzed with an internal pipette solution containing 100 µM or no spermine. In the presence of spermine, glutamate-evoked currents resulted in an inwardly rectifying I-V relation. In the absence of spermine, the rectification was relieved though dialysis, which resulted in a linear I-V relation. Voltage steps ranged from −62.8 mV to +57.2 mV in 20 mV steps; average of 3–10 sweeps per trace. Each sweep was baselined to 0 pA, Bessel filtered at 3000 Hz, and normalized to glutamate-current decays and maximum amplitudes at −62.8 mV. (B) An I-V curve showing the average amplitudes (normalized to -62.8 mV) of glutamate-evoked currents in spermine-free (N = 3) and 100-µM spermine (N = 4) conditions. Error bars are ± SEM. Conditions were significantly different at +37.2 and +57.2 mV (p = 0.019 and 1.2 × 10⁻⁶, respectively; two-way analysis of variance (ANOVA) with post-hoc Tukey test). (C) At -82.8 mV, AMPAR-mediated currents were reduced by 55.29 ± 1.60% with bath application of Ca2+-permeable AMPAR antagonist, N-(1-phenylcyclohexyl)-1,5-pentanediamine dihydrobromide (IEM 1925; 25 µM). Wash-out of IEM 1925 resulted in inward currents that recovered to 81.20 ± 2.97% of control. (D) Average of 582 mEPSCs from one neuron. The fast component (τfast) was responsible for 93.2% of the decay amplitude. Fast decay kinetics are indicative of GluA2-lacking Ca2+-permeable AMPARs (CP-AMPARs). (E) Inter-event-interval (IEI) distribution of mEPSC activity, 0.02 s bins, 1873 events from three neurons. (F) Amplitude distribution of mEPSCs, 1.5 pA bins.
Figure 7 with 1 supplement
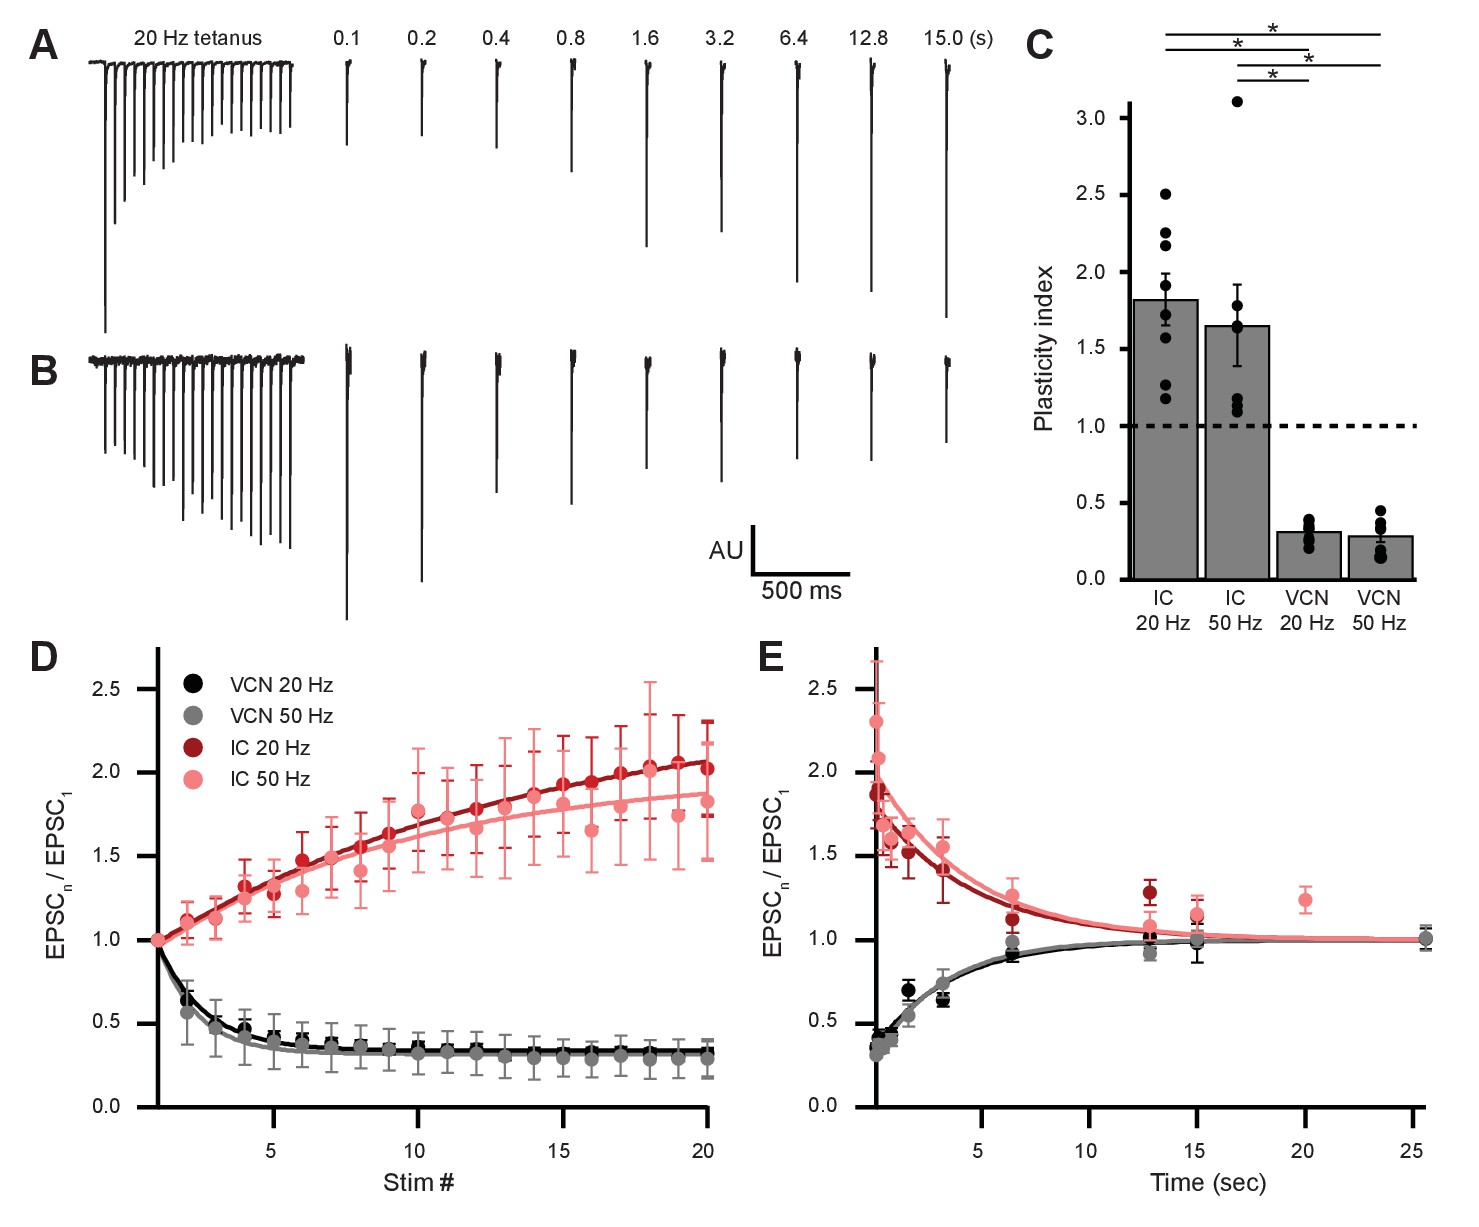
Ascending and descending inputs to medial olivocochlear neurons showed distinct short-term plasticity.
(A, B) Light-evoked EPSCs originating from ventral cochlear nucleus (VCN) (A) or inferior colliculus (IC) (B) input. During a 20-Hz tetanus stimulus, VCN-originating EPSCs depressed, whereas IC-originating EPSCs facilitated. After each 20-pulse tetanus, a test EPSC was evoked at time intervals increasing from 100 ms to 25.6 s. Each average test EPSC was normalized to the first EPSC of the respective tetanus stimulus. (C) ‘Plasticity index’ to illustrate the degree of facilitation or depression. The index for IC input was the ratio of the amplitude of the last three EPSCs of the tetanus over the amplitude of the first three EPSCs. The index for VCN input was the ratio of the amplitude of the last three EPSCs over the amplitude of the first EPSC of the tetanus. There was no significant difference between 20 Hz and 50 Hz stimulation between inputs of the same origin; however, all IC input was significantly different to all VCN input (p = 4.0 × 10⁻⁷ at 20 Hz and p = 2.7 × 10⁻⁴ at 50 Hz; two-way analysis of variance (ANOVA) with post-hoc Tukey test). Error bars are ± SEM. (D) Ascending VCN input depresses in amplitude during a tetanus stimulation at both 20 Hz and 50 Hz (20 pulses), while descending IC input facilitates. The average normalized EPSC during a tetanus stimulation is shown for both VCN (N=7, 50 Hz; N=8, 20 Hz) and IC (N=7, 50 Hz; N=8, 20 Hz) inputs. (E) Depression observed by ascending VCN input (τ20Hz = 3.5 ± 0.7 s, τ50Hz = 3.1 ± 0.4 s) recovered with a similar time course to IC input facilitation (τ20Hz = 4.5 ± 1.4 s, τ50Hz = 4.4 ± 1.7 s).
Figure 7—figure supplement 1
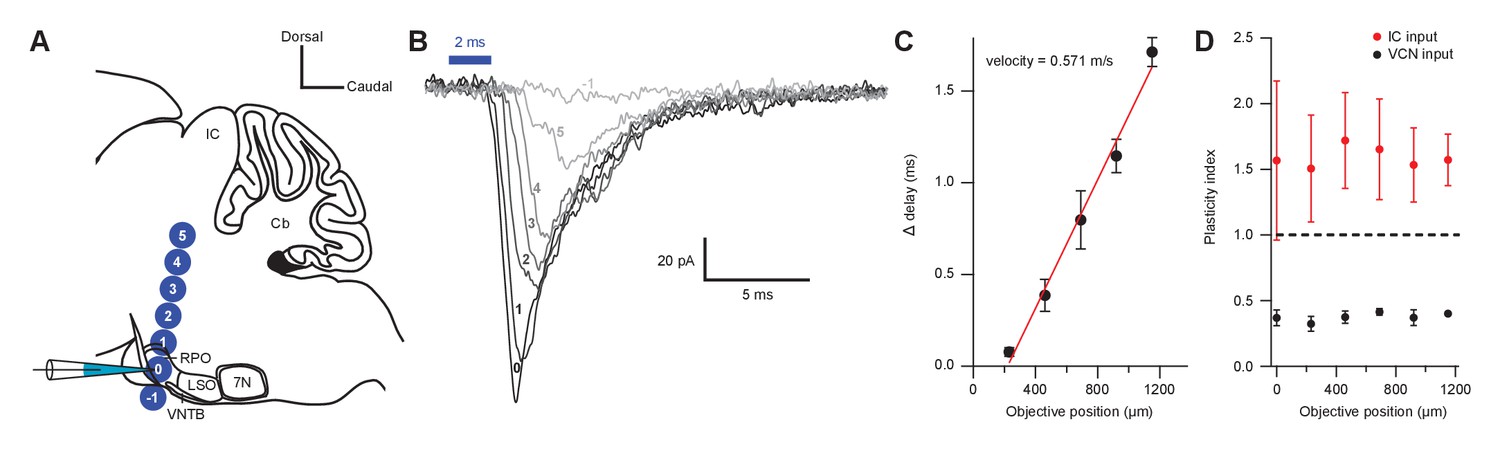
Short-term plasticity from VCN and IC inputs onto medial olivocochlear neurons was observed with axonal and terminal level light stimulation.
(A) Schematic illustrating the positioning of a X40 objective lens at varying distances with respect to a recording pipette attached to an medial olivocochlear (MOC) neuron (not to scale). For both ventral cochlear nucleus (VCN) and inferior colliculus (IC) inputs, the objective lens was moved either toward or away from the IC in 230 µm increments. It was assumed that axonal stimulation of IC input resulted in orthodromic activation, while axonal stimulation of VCN input resulted in antidromic activation, as VCN-originating T-stellate neurons project to the IC, further confirming that T-stellate neurons make functional depressing synapses onto MOC neurons. (B) Example traces of EPSCs evoked from activating IC inputs at varying distances from the recording pipette. Numbers −1 through 5 correspond to the objective positions illustrated in panel (A). As the objective lens was moved further from the recording location, EPSC onset was delayed. The EPSC amplitude often reduced, likely due to a lower probability of intact fibers at distances farther from the recording site. Each trace was an average of 20 sweeps, low-pass Bessel filtered at 3000 Hz, and baselined to 0 pA. (C) A plot showing the increase in delay from the first EPSC with increasing distance from the recorded MOC neuron. The ‘onset’ of each EPSC was measured at −5 pA from baseline. Data from IC and VCN were not significantly different and the data were combined (N = 9 at 0 through 690 µm, N = 8 at 920 µm, and N = 5 at 1150 µm). Axon velocity was determined from the slope of a linear fit of the mean data (). Error bars are ± SEM. (D) Light stimulation of VCN or IC inputs at varying distances from the recorded MOC neuron had no effect on short-term depression or facilitation, respectively (for IC input, N = 4 at 0 through 690 µm, N = 3 at 920 through 1150 µm; for VCN input, N = 5 at 0 through 920 µm, N = 2 at 1150 µm). Error bars are ± SEM.
Figure 8 with 1 supplement
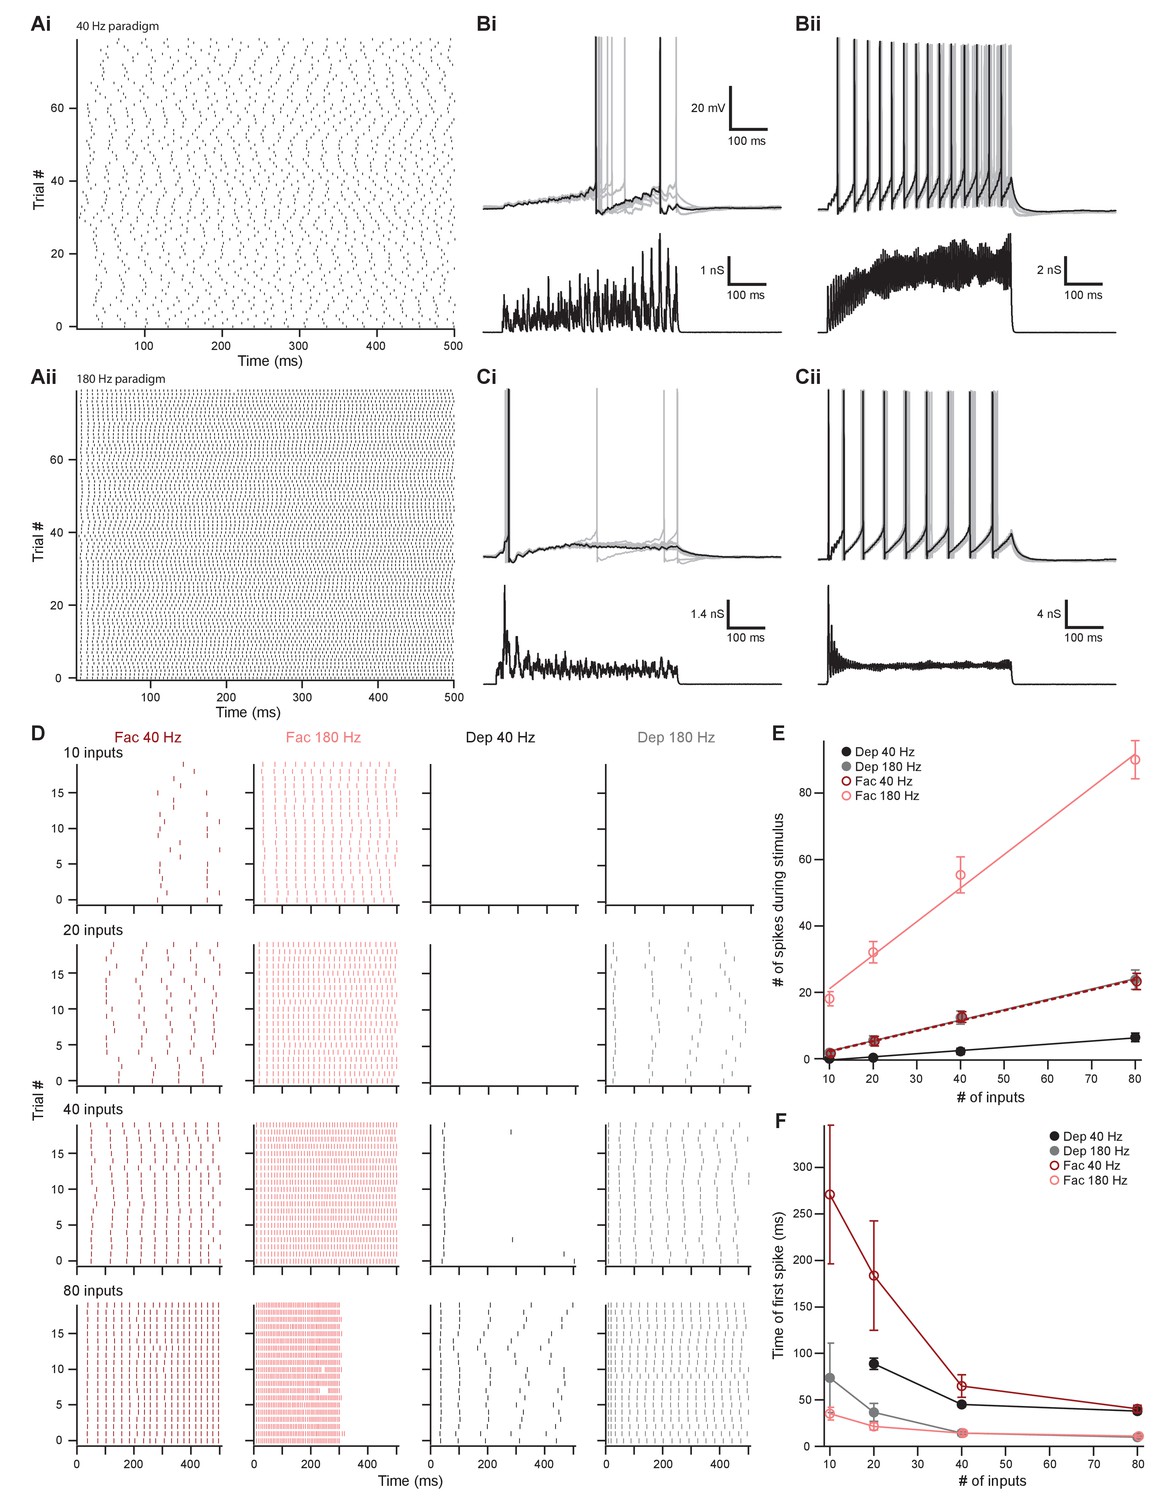
The number of presynaptic inputs and type of short-term plasticity control the dynamic range and onset timing of MOC neuron output.
(A) Raster plots of presynaptic excitatory postsynaptic conductance (EPSG) onset timing. The ~40 Hz paradigm (Ai) had an average rate of 41.1 ± 0.5 Hz for all 80 trials. The ~180 Hz paradigm (Aii) had an average rate of 176 ± 1 Hz for all 80 trials. Each trial was considered a presynaptic input in our model. (B) Ten example traces of membrane voltage responses to injected conductance waveforms simulating 10 inputs at ~40 Hz (Bi) or ~180 Hz (Bii) that underwent short-term facilitation. Scale bar is the same for all voltage responses in (B) and (C). (C) Ten example traces of membrane voltage responses to injected conductance waveforms simulating 40 inputs at ~40 Hz (Ci) or ~180 Hz (Cii) that underwent short-term depression. (D) Example raster plots of postsynaptic medial olivocochlear (MOC) neuron action potential timing in response to injected conductance waveforms. Rows of raster plots correspond to the number of simulated inputs, and columns correspond to the type of simulated presynaptic short-term plasticity and firing rate. Blank raster plots represent an absence of firing. One example (80 presynaptic inputs at ~180 Hz with short-term facilitation) underwent depolarization block after ~300 ms. All examples are from the same MOC neuron. (E) Average total number of action potentials evoked in MOC neurons (N = 6) during each conductance waveform paradigm. Error bars are ± SEM. (F) Average timing of the peak of the first action potential evoked in MOC neurons (N = 6) during each conductance waveform paradigm. Error bars are ± SEM.
Figure 8—figure supplement 1
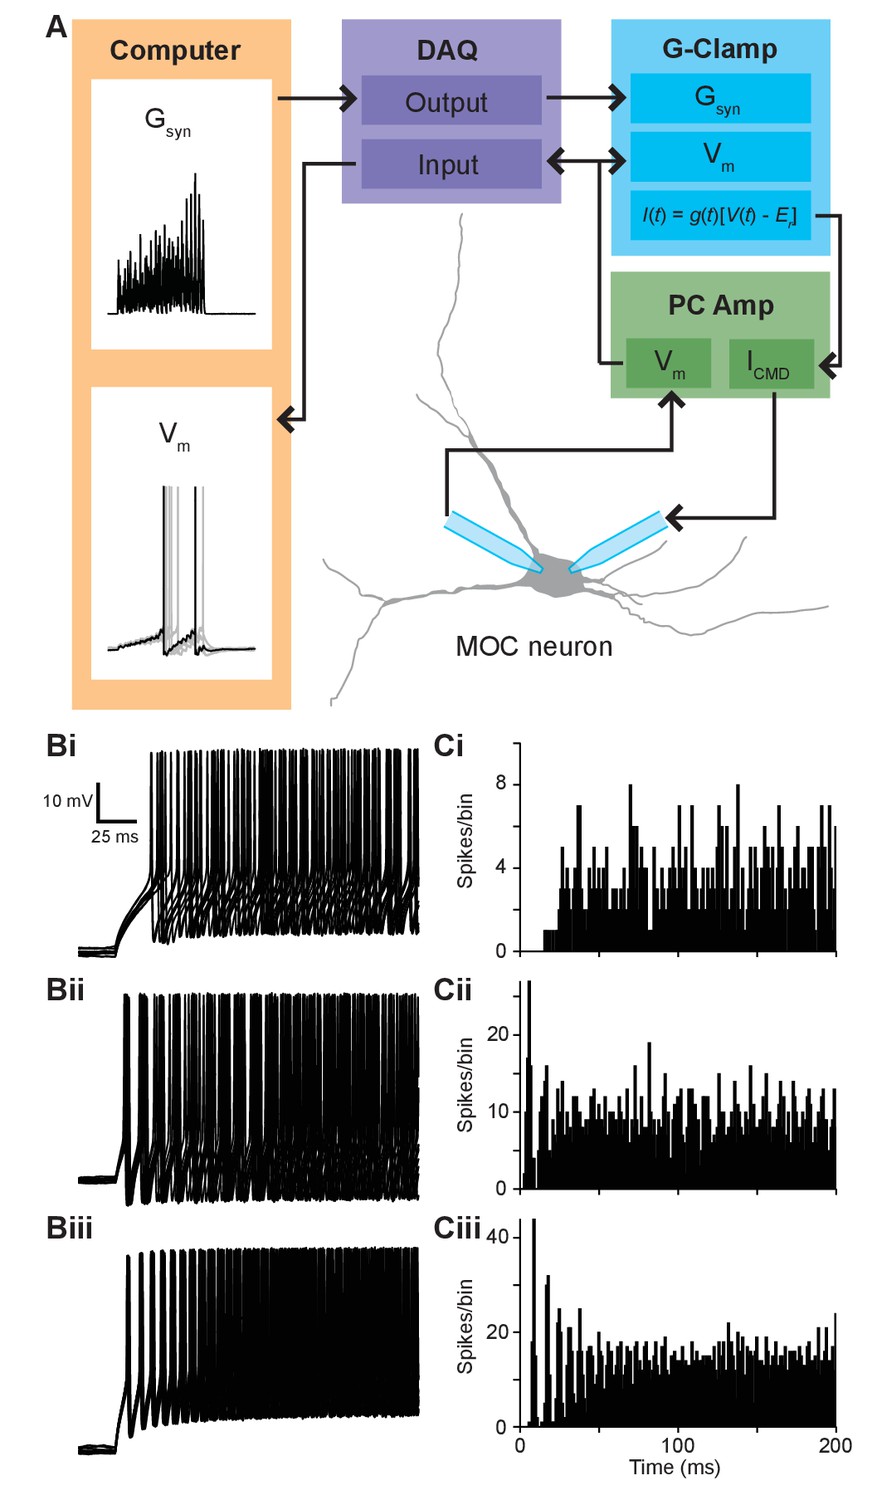
Synaptic conductance waveforms were modeled after physiological data.
(A) Flowchart of conductance-clamp configuration. Computer-generated conductance waveforms (Gsyn) were sent to a data acquisition (DAQ) instrument, which was connected to a rectifying Gsyn-command input on an analog conductance-clamp (G-Clamp) circuit. Medial olivocochlear (MOC) neurons were patched simultaneously with two patch pipettes connected to a patch-clamp amplifier (PC Amp). One electrode served as a membrane voltage (Vm) follower while the other injected current. In real-time, the conductance input to the G-Clamp amplifier instantaneously reacted to the membrane potential, producing a current, following the equation . The membrane potential signal was sent to the DAQ instrument and was digitally recorded by a computer. (B) Ten example traces of membrane voltage responses from T-stellate cells in response to repeated 500-ms current injections. Spike timing in response to 100-pA current injections was used for the ~40 Hz paradigm (Bi), 150-pA current injections for the ~110 Hz paradigm (Bii), and 200-pA current injections for the ~180 Hz paradigm (Biii). (C) Peristimulus time histograms depicting the spike timing of T-stellate cells in response to all 80 repeated 500-ms current injections used for ~40 Hz (Ci), ~110 Hz (Cii), and ~180 Hz paradigms (Ciii). Bins are of 1 ms.
Figure 9
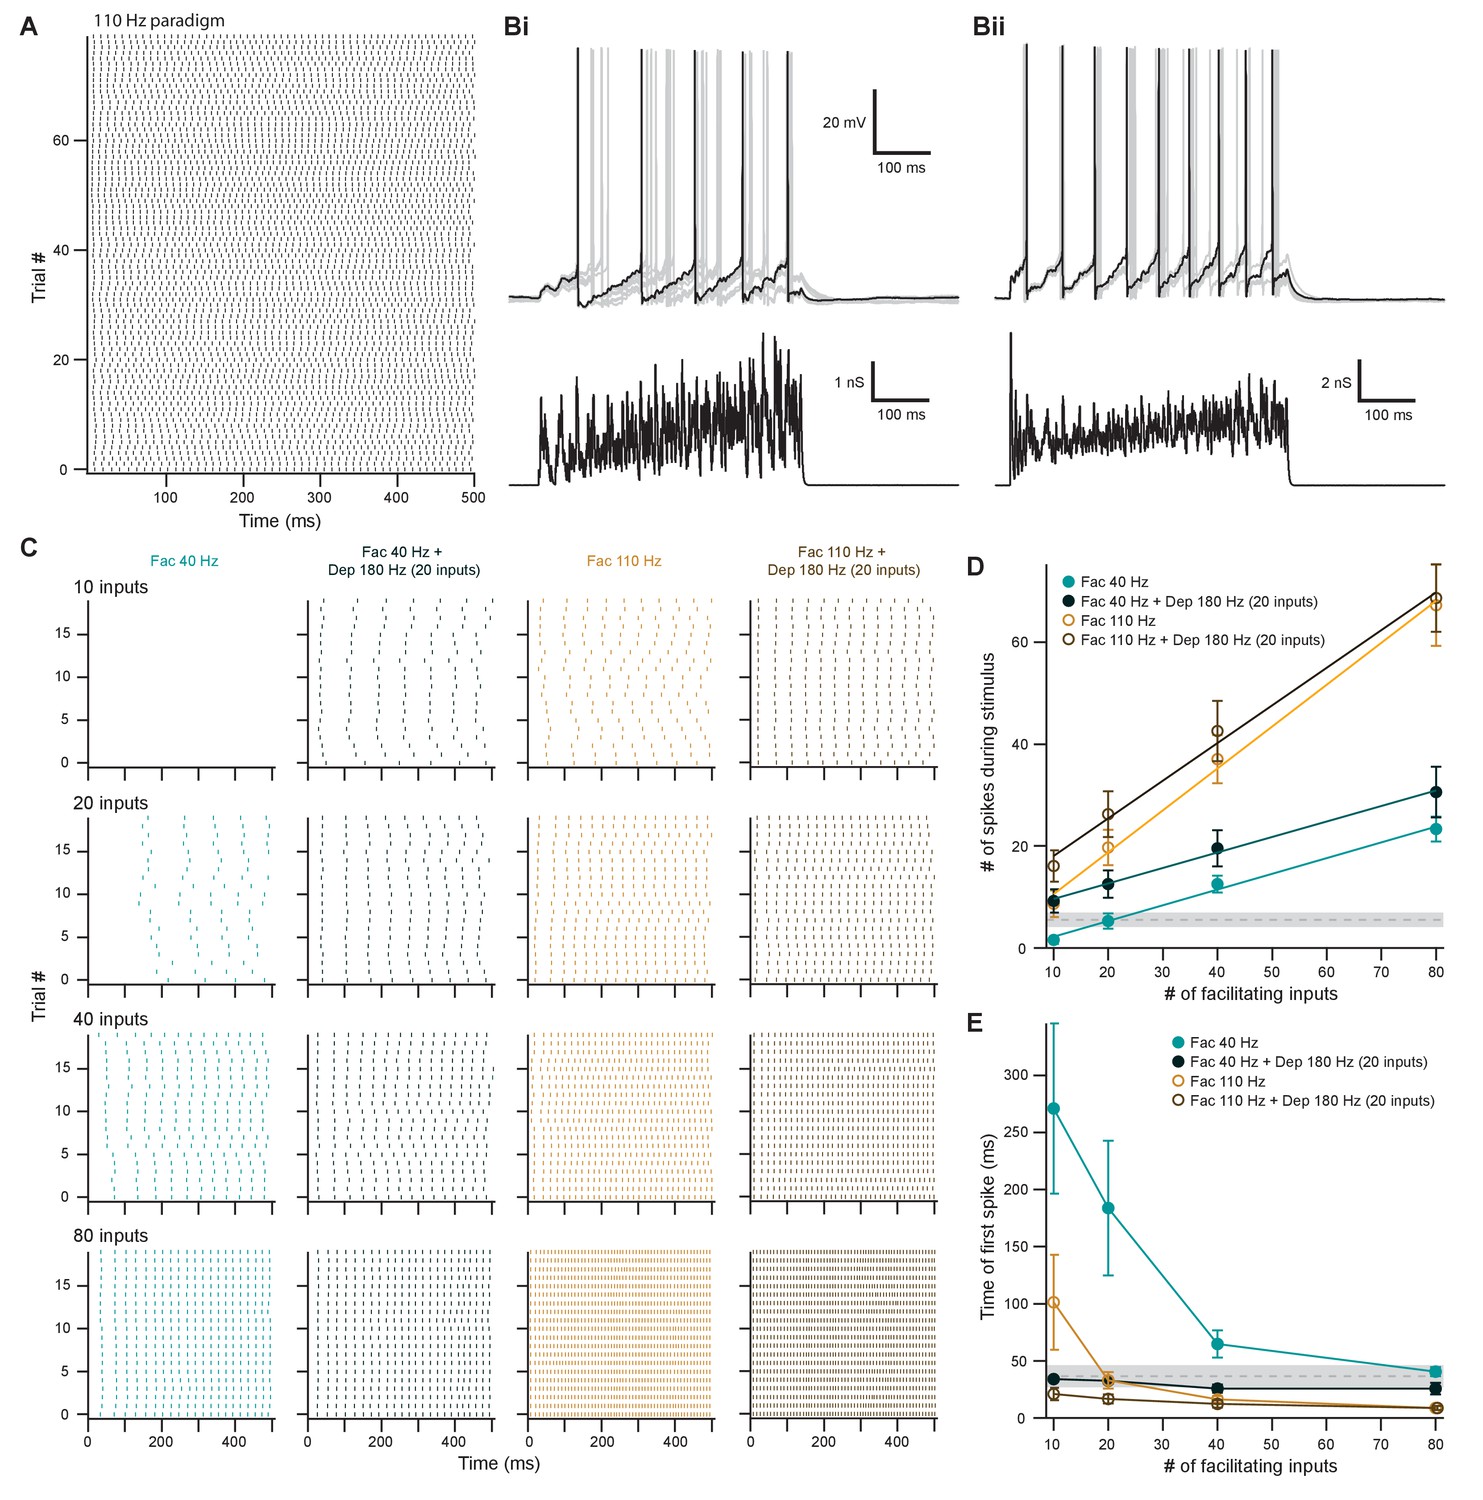
Facilitating inputs to MOC neurons can override or be enhanced by depressing inputs, depending on their number and rate.
(A) Raster plot of presynaptic excitatory postsynaptic conductance (EPSG) onset timing for the ~110 Hz paradigm, which had an average rate of 111 ± 1 Hz for all 80 trials. Each trial was considered a presynaptic input in our model. (B) Ten example traces of membrane voltage responses to injected conductance waveforms simulating 20 facilitating inputs at ~40 Hz without (Bi) or with (Bii) the addition of 20 depressing inputs at ~180 Hz. Scale bar is the same for both voltage responses. (C) Example raster plots of postsynaptic medial olivocochlear (MOC) neuron action potential timing in response to injected conductance waveforms, without (even columns) or with (odd columns) the addition of 20 depressing inputs at ~180 Hz. Rows of raster plots correspond to the number of simulated inputs, and columns correspond to the type of simulated presynaptic short-term plasticity and firing rate. Blank raster plots represent an absence of firing. All examples are from the same MOC neuron. (D) Average total number of action potentials evoked in MOC neurons (N = 5) during each conductance waveform paradigm. Error bars are ± SEM. Gray dashed line represents 20 depressing inputs at ~180 Hz, and the shaded area represents ± SEM in (D) and (E). (E) Average timing of the peak of the first action potential evoked in MOC neurons (N = 5) during each conductance waveform paradigm. Error bars are ± SEM.
Tables
Table 1
Decay time constants for evoked and miniature EPSCs.
| Double exponential | Single exponential | ||||||
|---|---|---|---|---|---|---|---|
| τfast (ms) | τslow (ms) | Afast (pA) | Aslow (pA) | %Afast (*100) | τw (ms) | τ (ms) | |
| VCN input N = 12 | 0.75 ± 0.26 (7) | 4.11 ± 0.86 (7) | −78.63 ± 21.10 (7) | −37.98 ± 13.10 (7) | 70.79 ± 0.25 (7) | 1.59 ± 0.25 (7) | 2.22 ± 0.68 (5) |
| T-stellate input N = 4 | 0.62 (1) | 3.32 (1) | −131.60 (1) | −54.12 (1) | 70.86 (1) | 1.19 (1) | 1.73 ± 0.57 (3) |
| IC input N = 28 | 0.63 ± 0.09 (13) | 3.43 ± 0.30 (13) | −73.09 ± 16.55 (13) | −45.44 ± 9.13 (13) | 60.64 ± 5.00 (13) | 1.72 ± 0.22 (13) | 2.09 ± 0.28 (15) |
| mEPSC N = 3 | 0.17 ± 0.01 (3) | 1.72 ± 0.43 (3) | −47.07 ± 5.36 (3) | −5.63 ± 1.37 (3) | 89.04 ± 3.00 (3) | 0.32 ± 0.02 (3) | N/A |
-
, . Number of cells per data point denoted as (N).
Key resources table
| Reagent type (species) or resource | Designation | Source or reference | Identifiers | Additional information |
|---|---|---|---|---|
| strain, strain background (M. musculus) | ChAT-IRES-Cre | Jackson Laboratory PMID:21284986 | RRID:IMSR_JAX:006410 | |
| strain, strain background (M. musculus) | Ai9(RCL-tdT) | Jackson Laboratory PMID:22446880 | RRID:IMSR_JAX:007909 | |
| strain, strain background (M. musculus) | C57BL/6J | Jackson Laboratory | RRID:IMSR_JAX:000664 | |
| Chemical compound, drug | Strychnine hydrochloride | Sigma | Cat# S8753 | |
| Chemical compound, drug | SR-95531 hydrobromide | Tocris | Cat# 1262 | |
| Chemical compound, drug | NBQX disodium salt | Tocris | Cat# 1044 | |
| Chemical compound, drug | (+)-MK-801 hydrogen maleate | Sigma Aldrich | Cat# M107 | |
| Chemical compound, drug | Tetrodotoxin (TTX) | Sigma Aldrich | CAT# 554412 | |
| Chemical compound, drug | Biocytin | ThermoFisher Scientific | Cat# B1592 | |
| Chemical compound, drug | Cholera toxin subunit B | List Labs | Cat# 104 | |
| Antibody | anti-ChAT (Goat polyclonal) | Millipore | Cat# AB144P RRID:AB_2079751 | IHC (1:500) |
| Antibody | anti-GFP (Chicken polyclonal) | Aves Labs | Cat# GFP-1020RRID:AB_10000240 | IHC (1:1000) |
| Antibody | anti-Cholera Toxin B Subunit (Goat polyclonal) | List Labs | Cat# 703 RRID:AB_10013220 | IHC (1:1000) |
| Antibody | anti-DsRed (Rabbit polyclonal) | Clontech | Cat# 632496RRID:AB_10013483 | IHC (1:500) |
| Antibody | anti-chicken Alexa Fluor 488 (Donkey polyclonal) | Jackson ImmunoResearch Labs | Cat# 703-545-155RRID:AB_2340375 | IHC(1:1000) |
| Antibody | anti-goat Alexa Fluor 488 (Donkey polyclonal) | Jackson ImmunoResearch Labs | Cat# 705-545-147 RRID:AB_2336933 | IHC (1:500) |
| Antibody | anti-Rabbit Alexa Fluor 594 (Donkey polyclonal) | Jackson ImmunoResearch Labs | Cat# 711-585-152RRID:AB_2340621 | IHC(1:500) |
| Antibody | Streptavidin-Alexa Fluor 647 | ThermoFisher Scientific | Cat# S21374RRID:AB_2336066 | IHC (1:2000) |
| Recombinant DNA reagent | AAVrg-pmSyn1-EBFP-Cre (6×10¹² GC/mL) | addgene | Cat# 51507-AAVrg | |
| Recombinant DNA reagent | AAV9-EF1a-DIO-hChR2(H134R)-EYFP-WPRE-HGHpA (2.2×10¹³ GC/mL) | addgene | Cat# 35507-AAVrg | |
| Recombinant DNA reagent | AAV1-CAG-ChR2-Venus-WPRE-SV40 (8.99×10¹² GC/mL) | addgene | Cat# 20071-AAV1 | |
| Recombinant DNA reagent | AAV2-EF1a-DIO-hChR2(E123T/T159C)-p2A-eYFP-WPRE | addgene | Cat# 35509-AAV2 | |
| Software, algorithm | pClamp 10 | Molecular Devices | RRID:SCR_011323 | |
| Software, algorithm | Igor Pro 8 | WaveMetrics | RRID:SCR_000325 | |
| Software, algorithm | NeuroMatic | Rothman and Silver, 2018; DOI:10.3389/fninf.2018.00014 | RRID:SCR_004186 | |
| Software, algorithm | Axograph | Axograph | RRID:SCR_014284 | |
| software, algorithm | Excel | Microsoft | RRID:SCR_016137 | |
| Software, algorithm | FIJI | Fiji.sc | RRID:SCR_002285 | |
| Software, algorithm | Adobe Illustrator CS2 | Adobe | RRID:SCR_010279 |
Additional files
Download links
A two-part list of links to download the article, or parts of the article, in various formats.
Downloads (link to download the article as PDF)
Open citations (links to open the citations from this article in various online reference manager services)
Cite this article (links to download the citations from this article in formats compatible with various reference manager tools)
Distinct forms of synaptic plasticity during ascending vs descending control of medial olivocochlear efferent neurons
eLife 10:e66396.
https://doi.org/10.7554/eLife.66396


