Repeated introductions and intensive community transmission fueled a mumps virus outbreak in Washington State
- Vaccine and Infectious Disease Division, Fred Hutchinson Cancer Research Center, United States
- Department of Epidemiology, University of Washington, United States
- Office of Communicable Disease Epidemiology, Washington State Department of Health, United States
- Arkansas Department of Health, United States
Figures
Figure 1
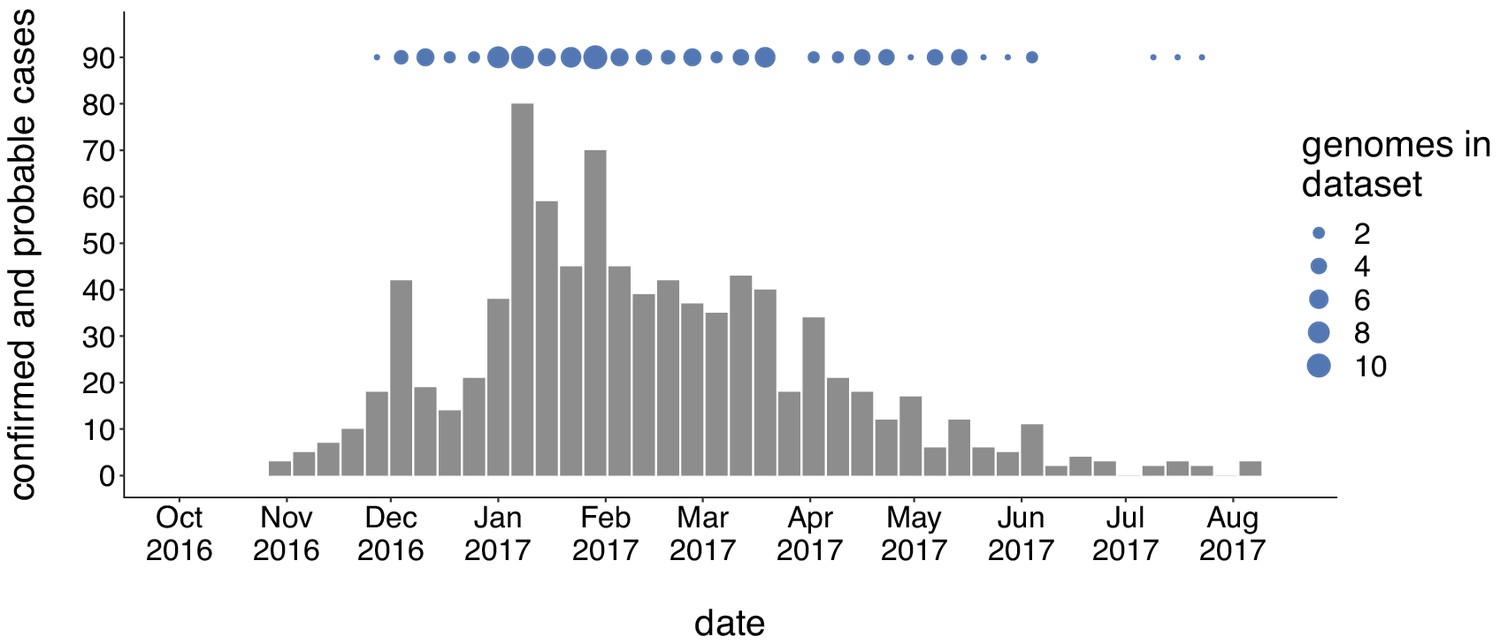
Genomic sampling covers the duration of the outbreak.
The first mumps case in Washington was reported on October 30, 2016, and case counts peaked in the winter of 2017. Here we show recorded numbers of confirmed and probable cases by epidemiologic (epi) week. Blue dots above the epidemiologic curve represent the number of Washington genome sequences sampled from viruses collected during that epi week.
-
Figure 1—source data 1
Washington State mumps case counts in 2016–2017.
- https://cdn.elifesciences.org/articles/66448/elife-66448-fig1-data1-v2.txt
-
Figure 1—source data 2
Metadata for sequences generated in this manuscript with collection dates.
- https://cdn.elifesciences.org/articles/66448/elife-66448-fig1-data2-v2.txt
Figure 2 with 5 supplements
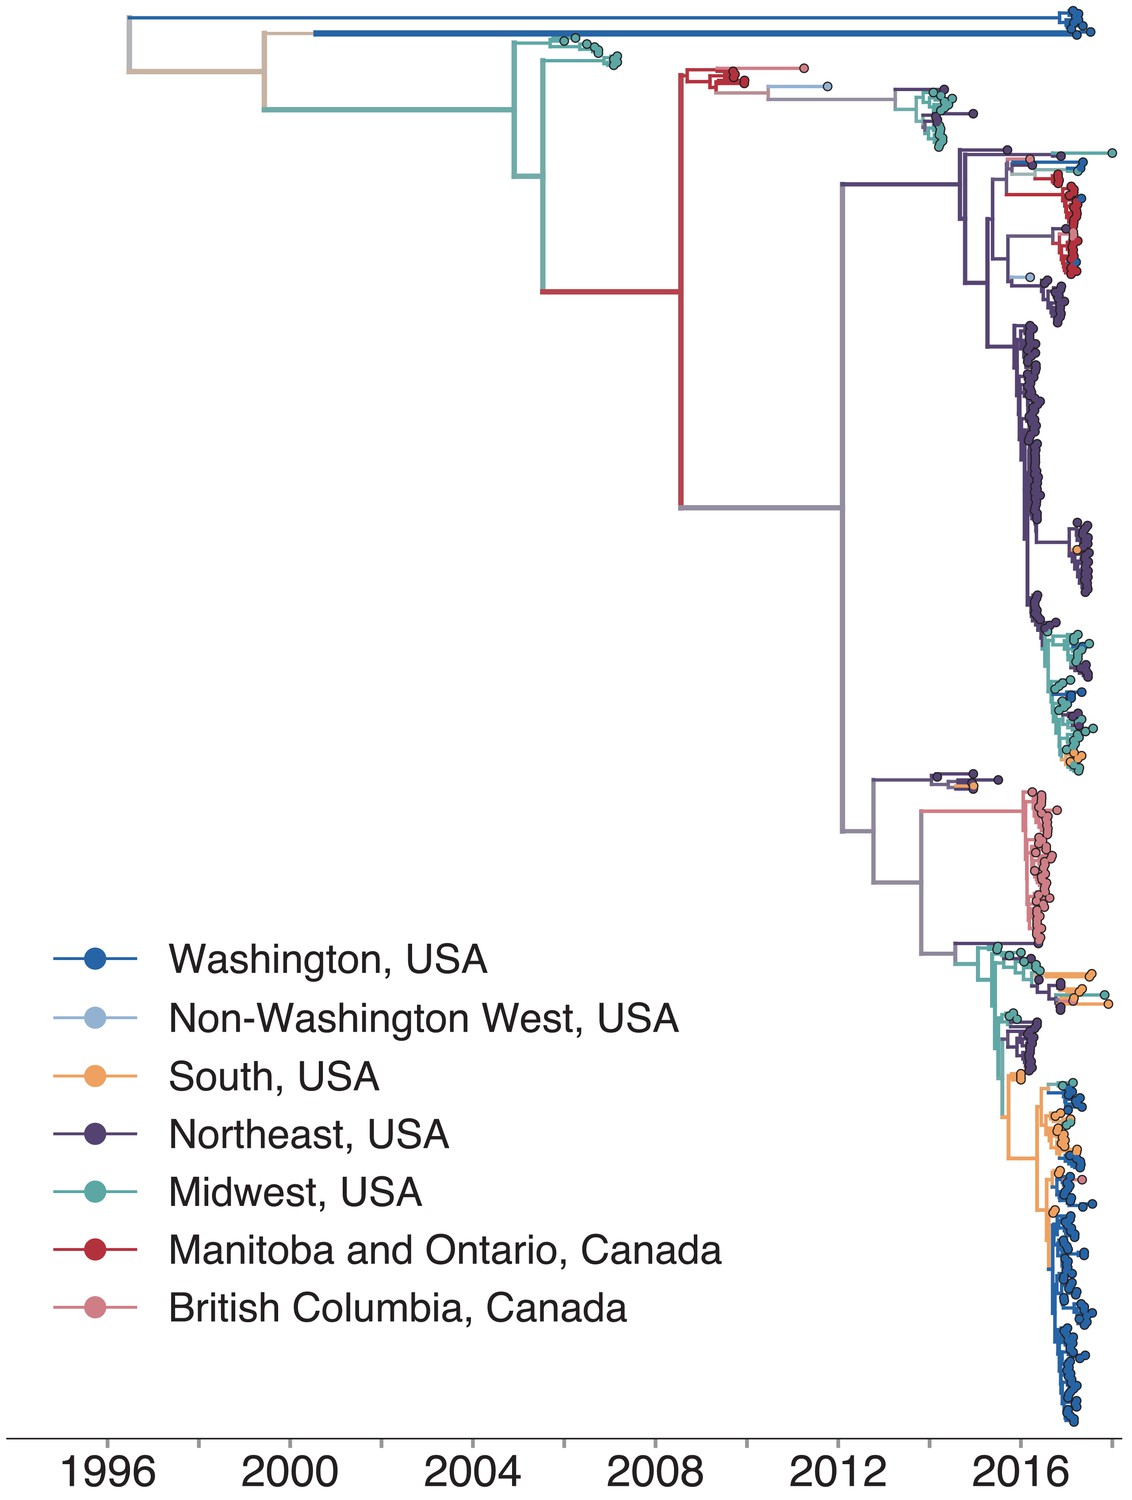
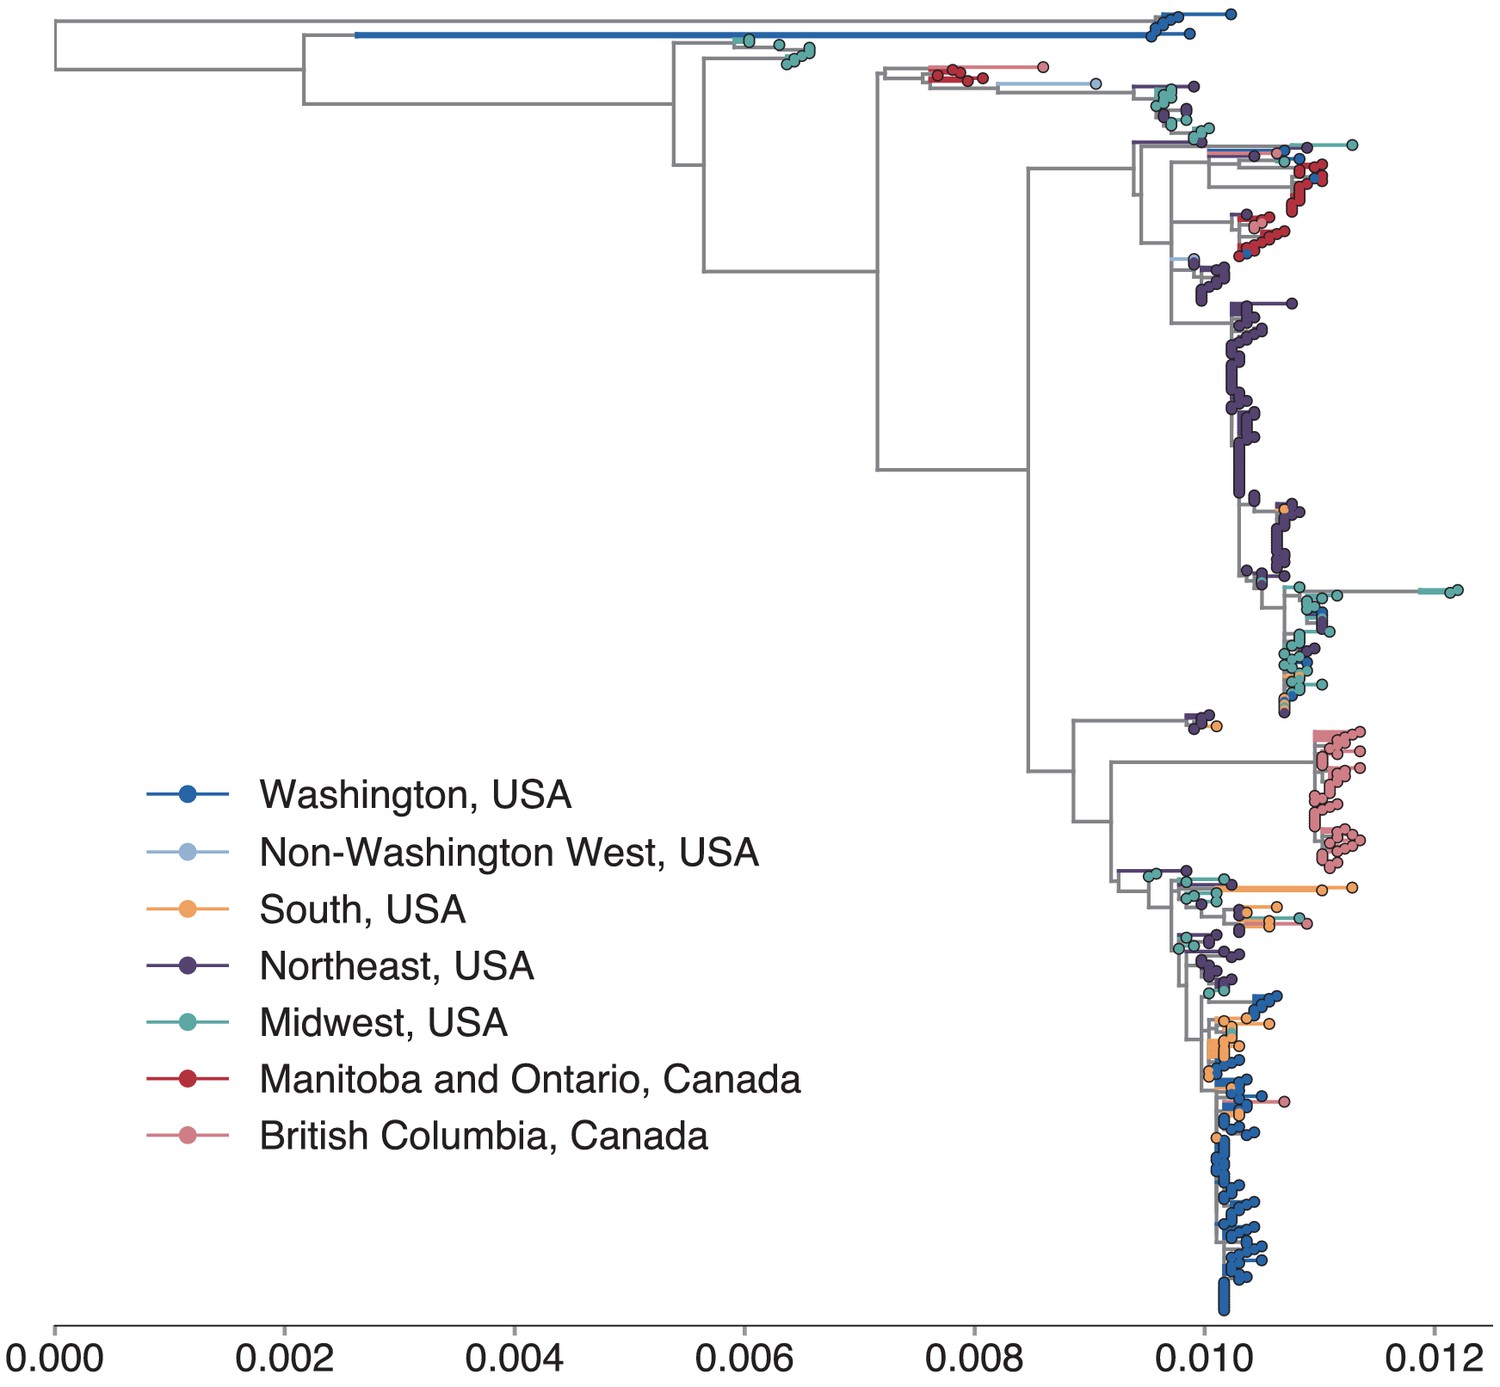
North American mumps outbreaks are related.
We combined all publicly available North American mumps genomes and built a time-resolved phylogeny. We inferred geographic transmission history between each US state and Canadian province using a discrete trait model, but have grouped these locations into regions for plotting purposes. A tree colored by the full geographic transmission history across all 27 locations is shown in Figure 2—figure supplement 2. Here, we display the maximum clade credibility tree, where color represents geographic location. We grouped the US states by geography as follows: non-Washington West include California and Montana; Midwest USA includes North Dakota, Kansas, Missouri, Iowa, Wisconsin, Indiana, Michigan, Ohio, and Illinois; South USA includes North Carolina, Alabama, Virginia, Georgia, Texas, Arkansas, and Louisiana; Northeast USA includes New York, Massachusetts, Pennsylvania, New Hampshire, and New Jersey. Canadian provinces are also grouped by geographic area. The x-axis represents the collection date (for tips), or the inferred time to the most recent common ancestor (for internal nodes). The internal node coloring represents the sum of the posterior probabilities for each inferred geographic division within the most probable region. For example, since we group Manitoba and Ontario into the same Canadian region, if a node was inferred with highest probability to circulate in Manitoba, then the node would be colored red to represent that Canadian region. The opacity of the color then corresponds to the sum of the probabilities that the node circulated in Manitoba or that the node circulated in Ontario. The posterior probability is expressed by the color gradient, where increasingly gray tone represents decreasing certainty of the inferred geographic state. The ancestral state at the root was poorly resolved and is therefore colored mostly gray.
-
Figure 2—source data 1
XML file to run discrete trait phylogeographic analysis of North American mumps transmission shown in Figure 2, with combined mcc tree and output log files.
- https://cdn.elifesciences.org/articles/66448/elife-66448-fig2-data1-v2.zip
-
Figure 2—source data 2
Divergence trees with metadata for divergence trees shown in Figure 2—figure supplement 4 and Figure 2—figure supplement 5.
- https://cdn.elifesciences.org/articles/66448/elife-66448-fig2-data2-v2.zip
Figure 2—figure supplement 1
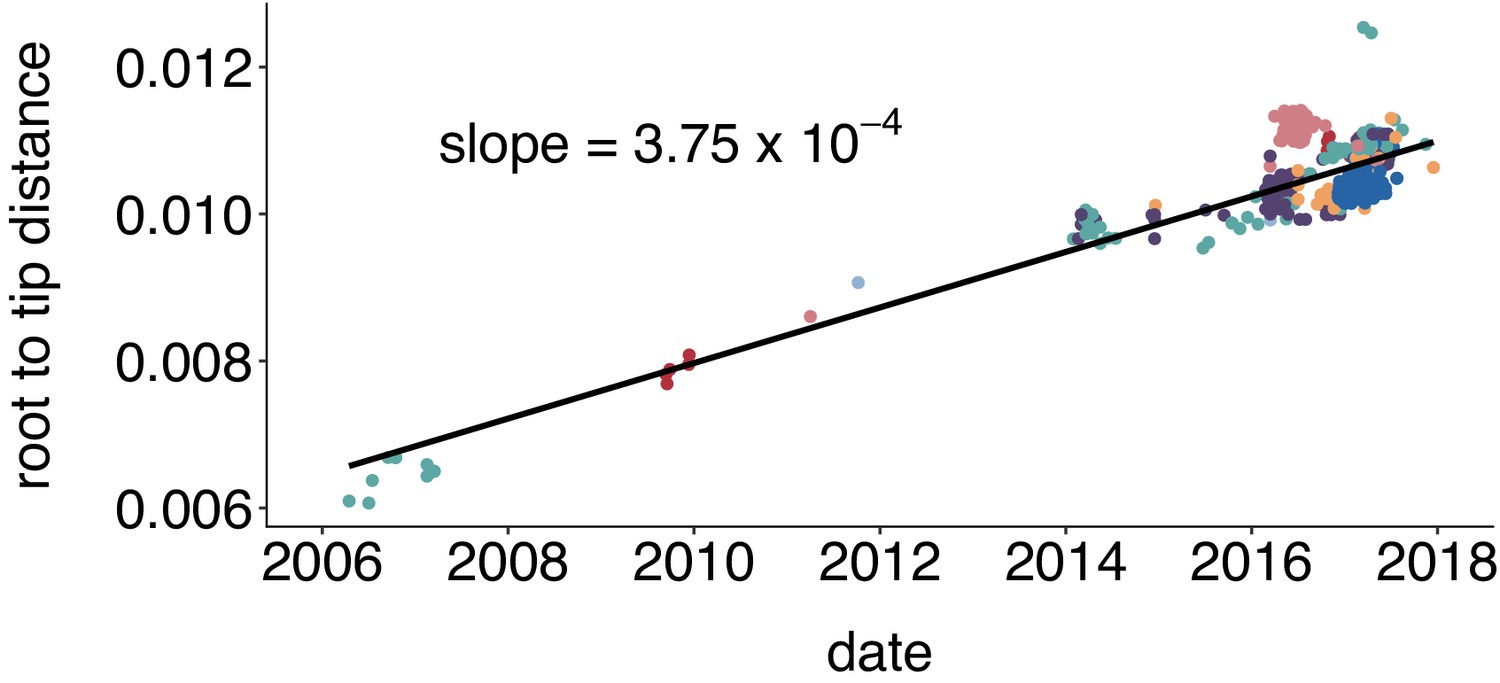
Mumps genomes accumulate mutations linearly over time.
We inferred a maximum likelihood phylogeny using IQTREE for all available complete mumps genomes of genotype G, sampled from North America between 2006 and 2018. We inferred the root-to-tip distance with TempEst and plot the root to tip divergence vs. sample collection date. Color represents geographic location (either Canadian province or US state), with colors corresponding to those in Figure 2. We infer that mumps genomes accumulate mutations at a rate of 3.75 × 10⁻⁴ substitutions per site per year.
Figure 2—figure supplement 2
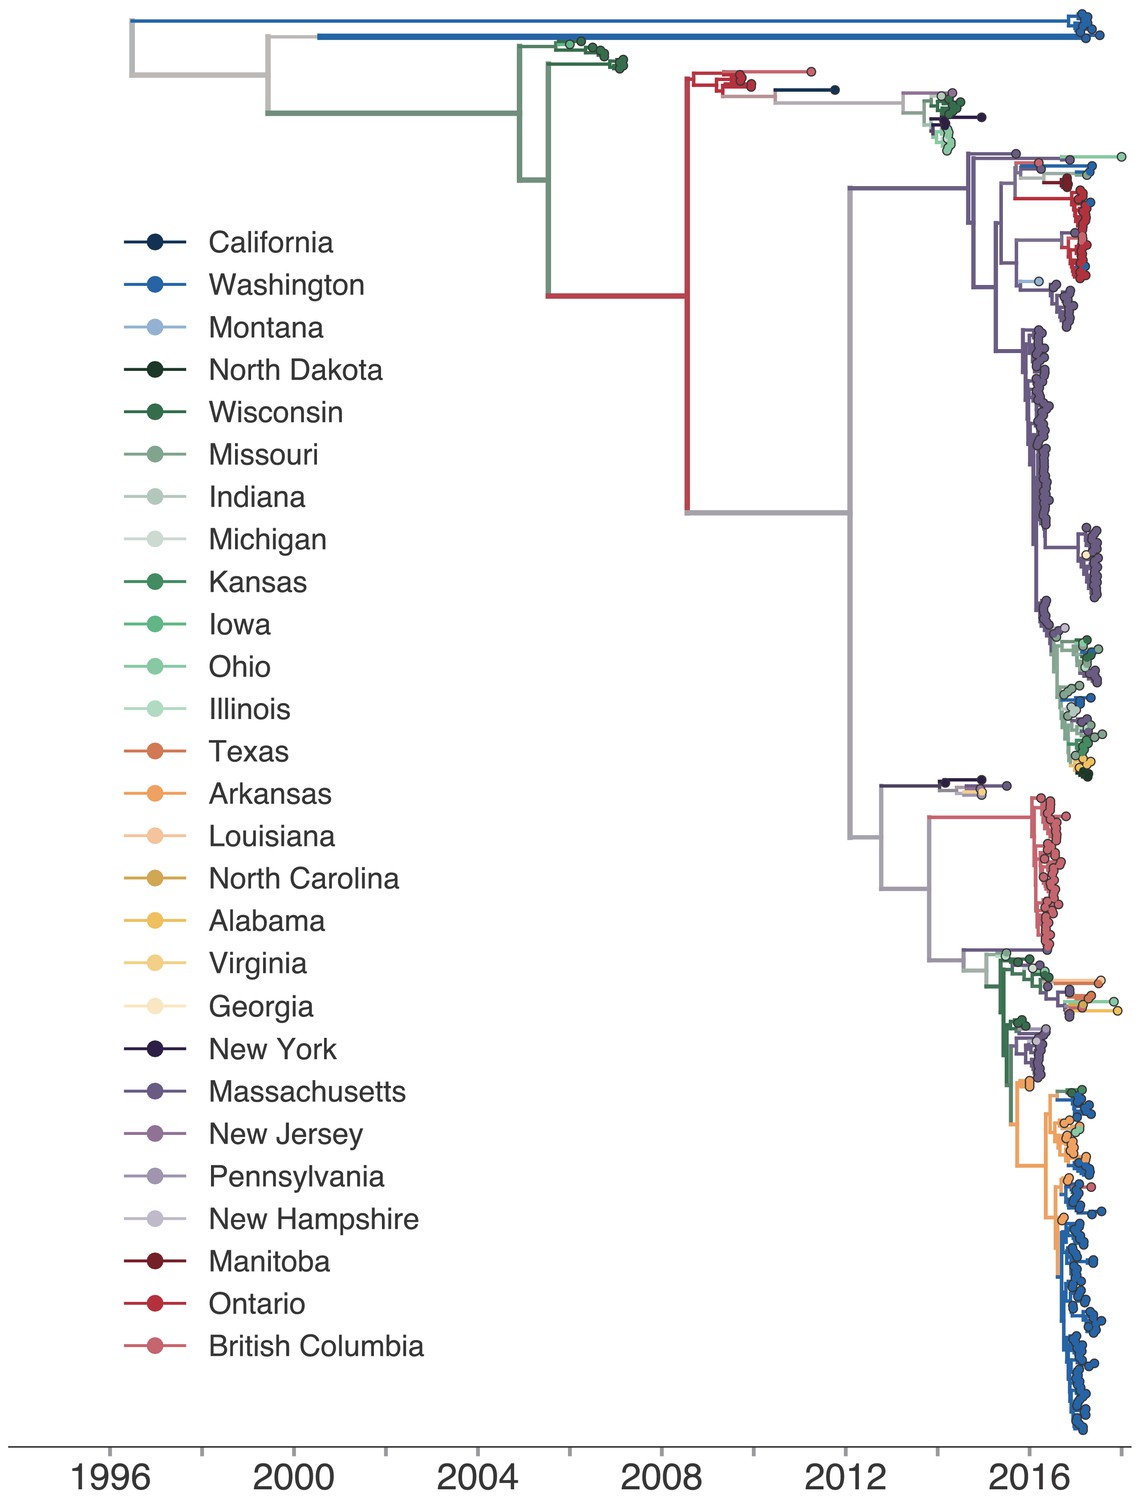
Phylogeographic history inferred with the full, 27-state discrete trait model.
The same phylogenetic tree as shown in Figure 2, except that each color represents a single US state or Canadian province. The full transmission history was inferred between each US state and Canadian province using a discrete trait model. The color of each internal node represents the posterior probability that the ancestral node was inferred to be labelled that US state or province.
Figure 2—figure supplement 3

Placement of divergent Washington and non-genotype G genomes on a global phylogeny.
To place the divergent Washington genomes and non-genotype G Washington and Wisconsin genomes in the context of global mumps diversity, we generated a full genome divergence phylogeny using all publicly available mumps genotypes collected from anywhere in the world. The branch point for genotype G viruses is marked with a black circle and annotated with text. Color indicates the geographic region from which the sample was collected and the x-axis represents substitutions per site. For ease of viewing, we have collapsed all sequences that fall within the main genotype G lineage of North American mumps that is shown in Figure 2 into the blue triangle. This includes all sequences descending from the 2006 midwest outbreak sequences, but does not include the divergent Washington lineages shown at the top of Figure 2. The genotype H and A genomes from Wisconsin are highlighted in callouts 1 and 2. The Washington genotype K sequence is shown in callout 3, while the nine divergent Washington genomes shown in Figure 2 are highlighted here in callouts 4 and 5.
Figure 2—figure supplement 4
The full genome divergence tree closely matches the time-resolve phylogeny.
We inferred a maximum likelihood phylogeny using IQTREE for all available complete mumps genomes of genotype G, sampled from North America between 2006 and 2018. Color represents geographic location, and the x-axis displays divergence in substitutions per site per year. To reduce the number of displayed colors, we grouped the US states by geography as follows: non-Washington West include California and Montana; Midwest USA includes North Dakota, Kansas, Missouri, Iowa, Wisconsin, Indiana, Michigan, Ohio, and Illinois; South USA includes North Carolina, Alabama, Virginia, Georgia, Texas, Arkansas, and Louisiana; Northeast USA includes New York, Massachusetts, Pennsylvania, New Hampshire, and New Jersey. Canadian provinces are also grouped by geographic area.
Figure 2—figure supplement 5

SH gene sequences are inadequate for fine-scale resolution of mumps transmission.
To compare whether we would recover similar tree topologies if we had only sequenced the SH gene, we downloaded all available complete mumps genomes of genotype G, sampled from North America between 2006 and 2018 and truncated our sequences to include only the coding region for SH. We then inferred a maximum likelihood phylogeny using the same procedure as in Figure 2—figure supplement 2. The vast majority of North American mumps sequences are identical and form a single polytomy, suggesting that SH sequencing alone provides limited resolution for inferring geographic spread. Color represents geographic location, and the x-axis displays divergence in substitutions per site per year. To reduce the number of displayed colors, we grouped the US states by geography as follows: non-Washington West include California and Montana; Midwest USA includes North Dakota, Kansas, Missouri, Iowa, Wisconsin, Indiana, Michigan, Ohio, and Illinois; South USA includes North Carolina, Alabama, Virginia, Georgia, Texas, Arkansas, and Louisiana; Northeast USA includes New York, Massachusetts, Pennsylvania, New Hampshire, and New Jersey. Canadian provinces are also grouped by geographic area.
Figure 3
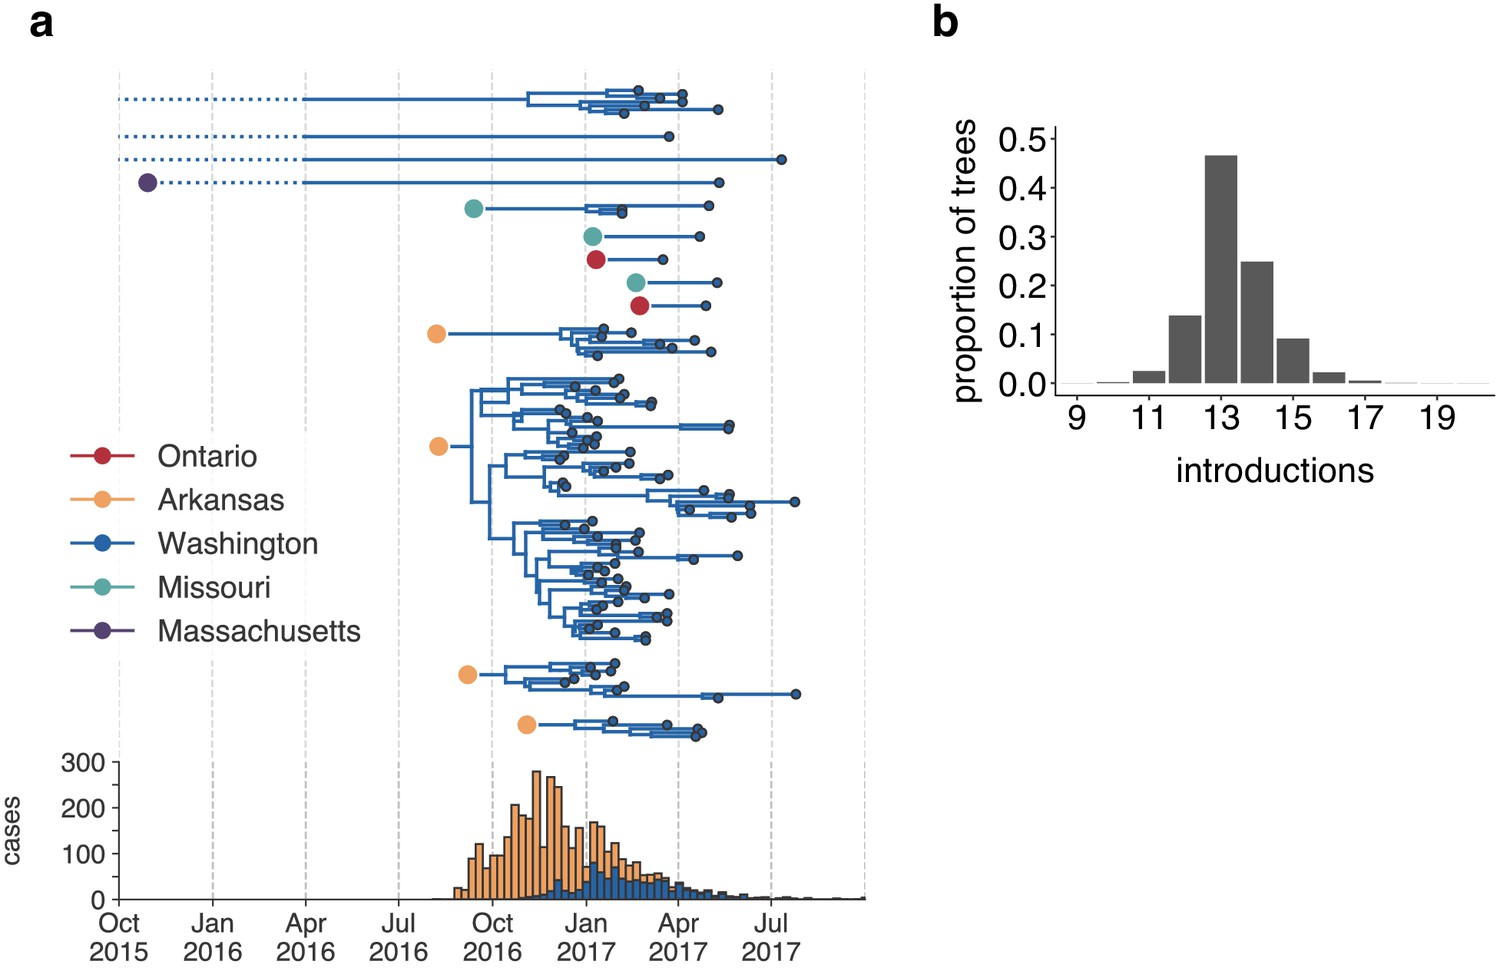
The mumps outbreak in Washington was seeded by approximately 13 introductions.
(a) We separated each introduction into Washington inferred on the maximum clade credibility tree (Figure 2) and plotted them independently. Large, colored dots represent the inferred geographic location that the Washington introduction was seeded from. Branches that extend further back in time than April 2016 (approximately 6 months prior to the first reported case in Washington) are dotted to represent that transmission likely occurred via other, unsampled locations. The nine tips at the very top without inferred geographic ancestry represent the highly divergent nine Washington genomes with a TMRCA of ~22 years that are highlighted in Figure 2—figure supplement 3 and shown in Figure 2. For reference, the cumulative case counts from Arkansas and Washington are plotted below. (b) For each tree in the posterior set, we inferred the number of introductions into Washington. We plot the proportion of trees in the posterior set in which that number of introductions was inferred.
-
Figure 3—source data 1
Inferred introductions into Washington State across posterior distribution.
- https://cdn.elifesciences.org/articles/66448/elife-66448-fig3-data1-v2.txt
Figure 4 with 1 supplement
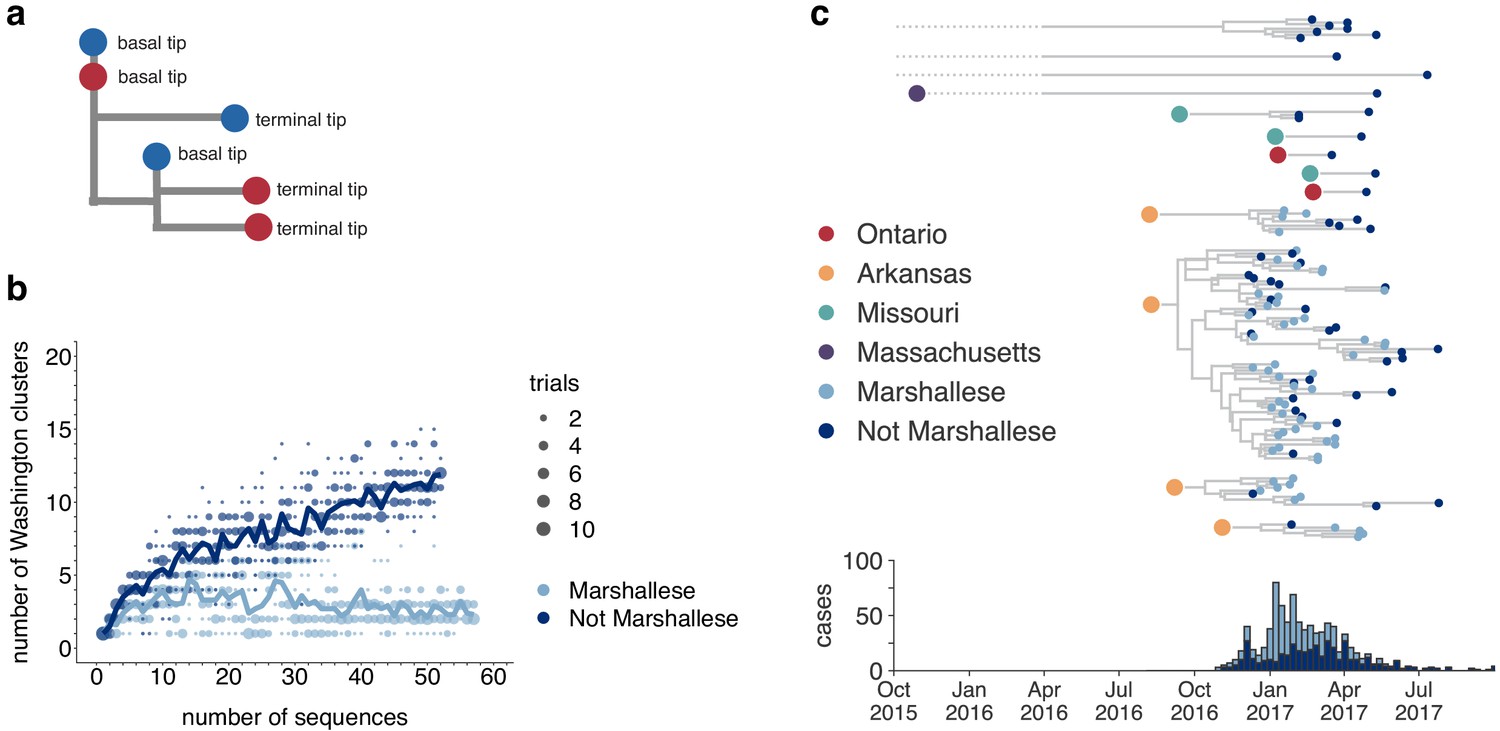
Marshallese individuals sustain longer transmission chains.
(a) A schematic for quantifying tips that lie ‘upstream’ in transmission chains. For tips that lie on an internal node, meaning that they have a branch length separating them from their parent internal node of less than one mutation, we infer the number of child tips that descend from that tip’s parental node. For each tip in the example tree, its classification as either a ‘basal tip’ or a ‘terminal tip’ is annotated alongside it. All tips that have a nonzero branch length are annotated as terminal tips. We can then compare whether sequences of particular groups (here, blue vs. red) are more likely to be basal or terminal via logistic regression. (b) We separated all Washington tips and classified them into Marshallese and not Marshallese. We then performed a rarefaction analysis and plotted the number of inferred Washington clusters (y-axis) as a function of the number of sequences included in the analysis (x-axis). Dark blue represents not Marshallese sequences, and light blue represents Marshallese sequences. Each dot represents the number of trials in which that number of clusters was inferred, and the solid line represents the mean across trials. (c) The exploded tree as shown in Figure 3a is shown, but tips are now colored by whether they represent Marshallese or non-Marshallese cases. For reference, the number of Washington cases (y-axis) is plotted over time (x-axis), where bar color represents whether those cases were Marshallese or not.
-
Figure 4—source data 1
Rarefaction results for community status analysis shown in Figure 4b.
- https://cdn.elifesciences.org/articles/66448/elife-66448-fig4-data1-v2.txt
Figure 4—figure supplement 1
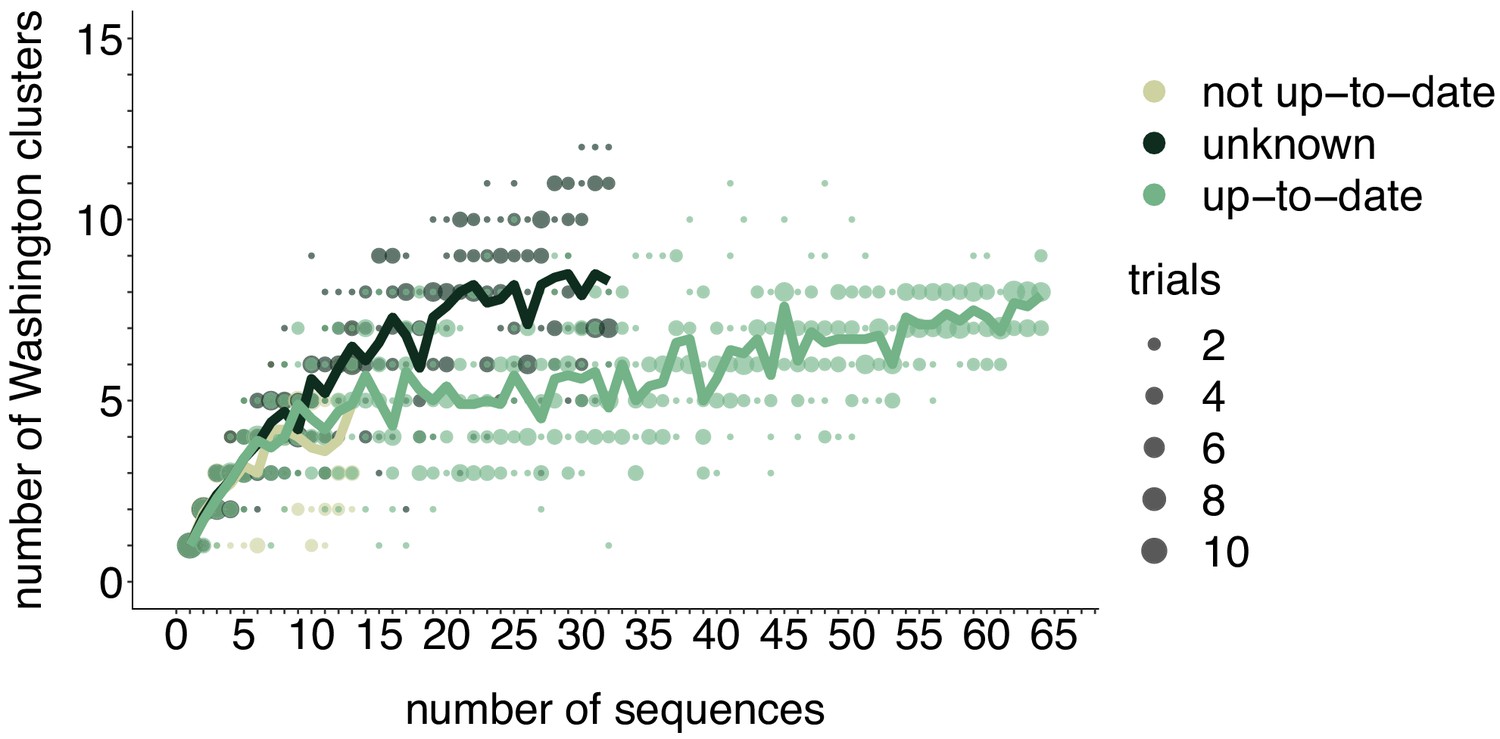
Rarefaction results by vaccination status.
We repeated the rarefaction analysis shown in Figure 4b for vaccination status. We separated all Washington tips and classified them by vaccination status into up-to-date, not up-to-date, or unknown vaccination status. We then performed a rarefaction analysis and plot the number of inferred Washington clusters (y-axis) as a function of the number of sequences included in the analysis (x-axis). Dark green represents unknown vaccination status, light green represents not up-to-date, and green represents up-to-date. The majority of sequences in our data set were derived from individuals who were up-to-date for mumps vaccine. Each dot represents the number of trials in which that number of clusters was inferred, and the solid line represents the mean across trials.
-
Figure 4—figure supplement 1—source data 1
Rarefaction results for vaccination status analysis shown in Figure 4—figure supplement 1.
- https://cdn.elifesciences.org/articles/66448/elife-66448-fig4-figsupp1-data1-v2.txt
Figure 5 with 2 supplements
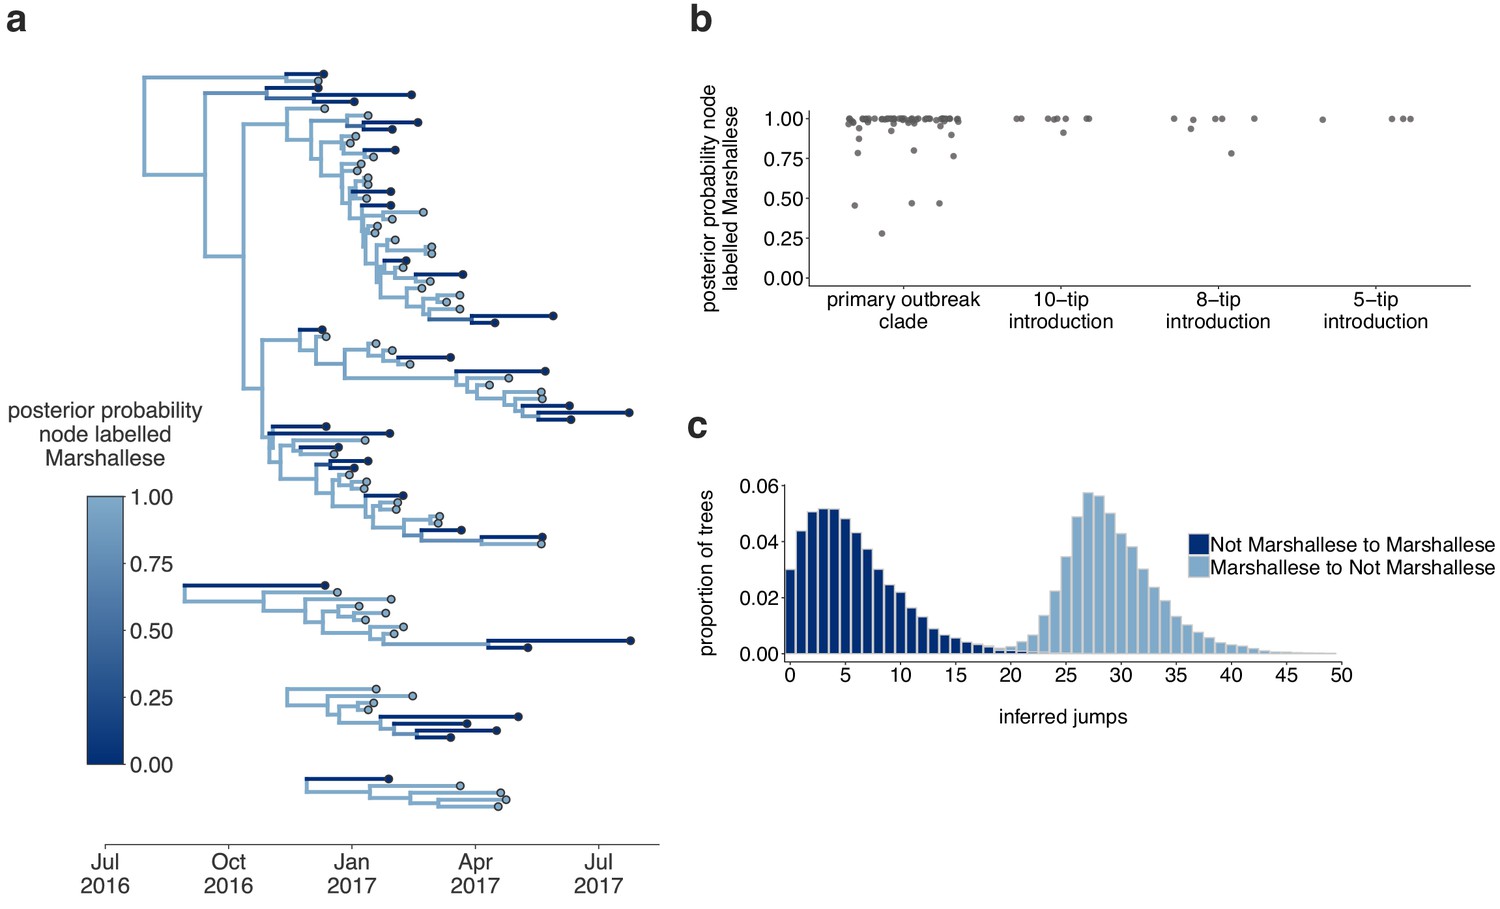
The Washington outbreak was sustained by transmission in the Marshallese community.
(a) Using the four Washington clusters that had a mixture of Marshallese and non-Marshallese cases, we inferred phylogenies using a structured coalescent model. Each group of sequences shared a clock model, migration model, and substitution model, but each topology was inferred separately, allowing us to incorporate information from all four clusters into the migration estimation. For each cluster, the maximum clade credibility tree is shown, where the color of each internal node represents the posterior probability that the node is Marshallese. (b) For each internal node shown in panel (a), we plot the posterior probability of that node being Marshallese. Across all four clusters, 74 out of 88 internal nodes (84%) are inferred as Marshallese with a posterior probability of at least 0.95. (c) The posterior distribution of the number of ‘jumps’ or transmission events from Marshallese to not Marshallese (light blue) and not Marshallese to Marshallese (dark blue) inferred for the primary outbreak clade.
-
Figure 5—source data 1
XML file to run structured coalescent analysis and combined output log and tree files with a migration rate prior of 1 (shown in Figure 5, identifiable metadata have been removed).
- https://cdn.elifesciences.org/articles/66448/elife-66448-fig5-data1-v2.zip
Figure 5—figure supplement 1
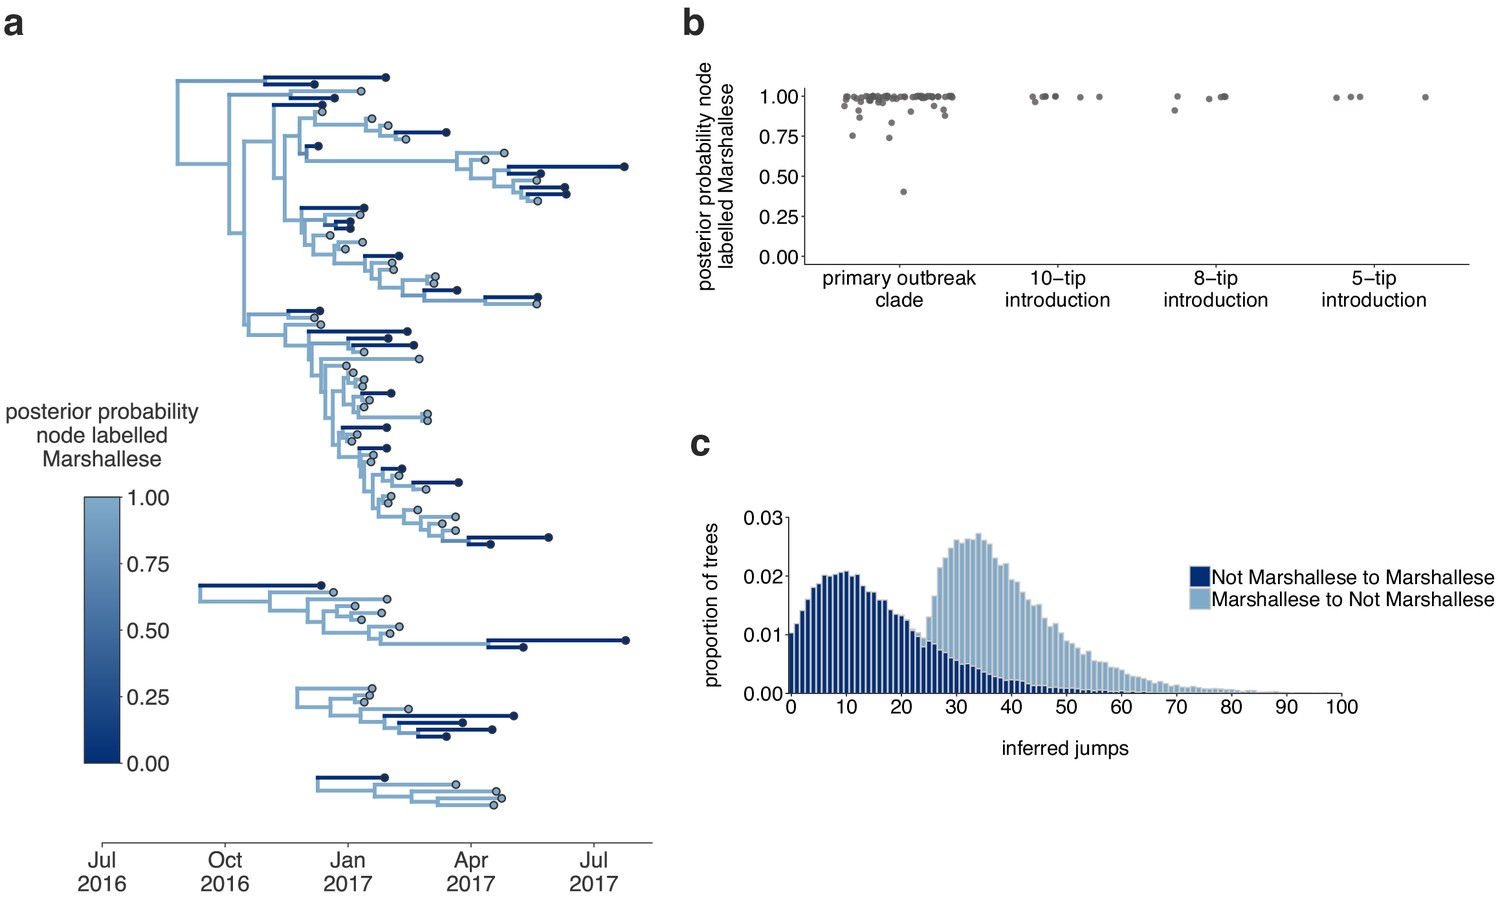
Inferences are similar under a higher migration rate prior.
The results are shown for the exact same analyses displayed in Figure 5, except inferred under a model with a higher migration rate prior (mean of 10 instead of mean of 1). (a) Using the four Washington clusters that had a mixture of Marshallese and non-Marshallese cases, we inferred phylogenies using a structured coalescent model. Each group of sequences shared a clock model, migration model, and substitution model, but each topology was inferred separately, allowing us to incorporate information from all four clusters into the migration estimation. For each cluster, the maximum clade credibility tree is shown, where the color of each internal node represents the posterior probability that the node is Marshallese. (b) For each internal node shown in panel (a), we plot the posterior probability of that node being Marshallese. Across all four clusters, almost every internal node is inferred as Marshallese with high probability. (c) The posterior distribution of the number of ‘jumps’ or transmission events from Marshallese to not Marshallese (light blue) and not Marshallese to Marshallese (dark blue) inferred for the primary outbreak clade.
-
Figure 5—figure supplement 1—source data 1
XML file to run structured coalescent analysis and combined output log and tree files with a migration rate prior of 10 (shown in Figure 5—figure supplement 1, identifiable metadata have been removed).
- https://cdn.elifesciences.org/articles/66448/elife-66448-fig5-figsupp1-data1-v2.zip
Figure 5—figure supplement 2
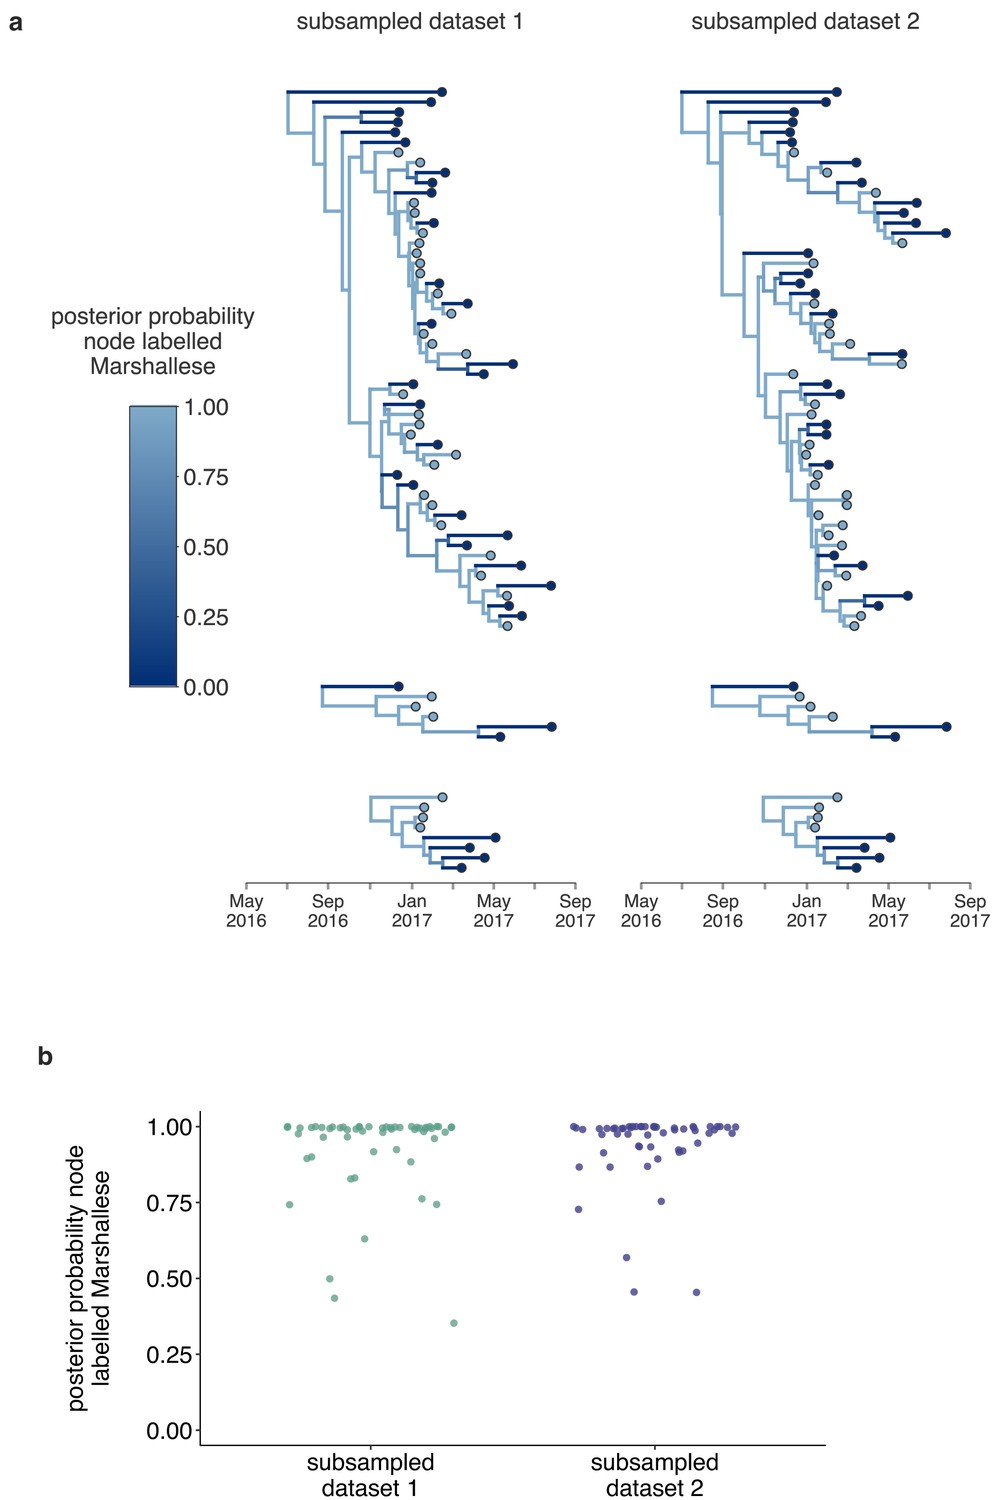
Structured coalescent analyses are robust to sampling differences.
To ensure that our results were robust to differences in sampling of Marshallese and non-Marshallese tips within the clusters used for this analysis, we subsampled our data set three independent times, and ran three independent chains per unique subsampling. In each subsampled data set, the number of Marshallese tips was randomly subsampled to be equal to the number of non-Marshallese tips in each of the four clusters. We then ran each of these subsampled data sets with the exact same model as run with the full data set. In subsampled data sets 1 and 2, two out of three chains converged, and results were combined and displayed here. In the third subsampled data set, none of the three chains converged, so those results are not shown. (a) For each subsampled data set, we plot the inferred maximum clade credibility tree from the combined tree outputs from the two converged chains. The color of each tip represents whether that sample was derived from a Marshallese or non-Marshallese case, and the color of the internal node represents the posterior probability of that internal node being Marshallese. (b) For each tree shown in (a), the posterior probability that each internal node is labeled as Marshallese is shown. The number of the subsampled data set is shown on the x-axis and the posterior probability is shown on the y-axis.
-
Figure 5—figure supplement 2—source data 1
XML files and combined output files to run structured coalescent analysis where clades were subsampled to have equal numbers of Marshallese and non-Marshallese tips (shown in Figure 5—figure supplement 2, identifiable metadata have been removed).
- https://cdn.elifesciences.org/articles/66448/elife-66448-fig5-figsupp2-data1-v2.zip
Figure 6 with 1 supplement
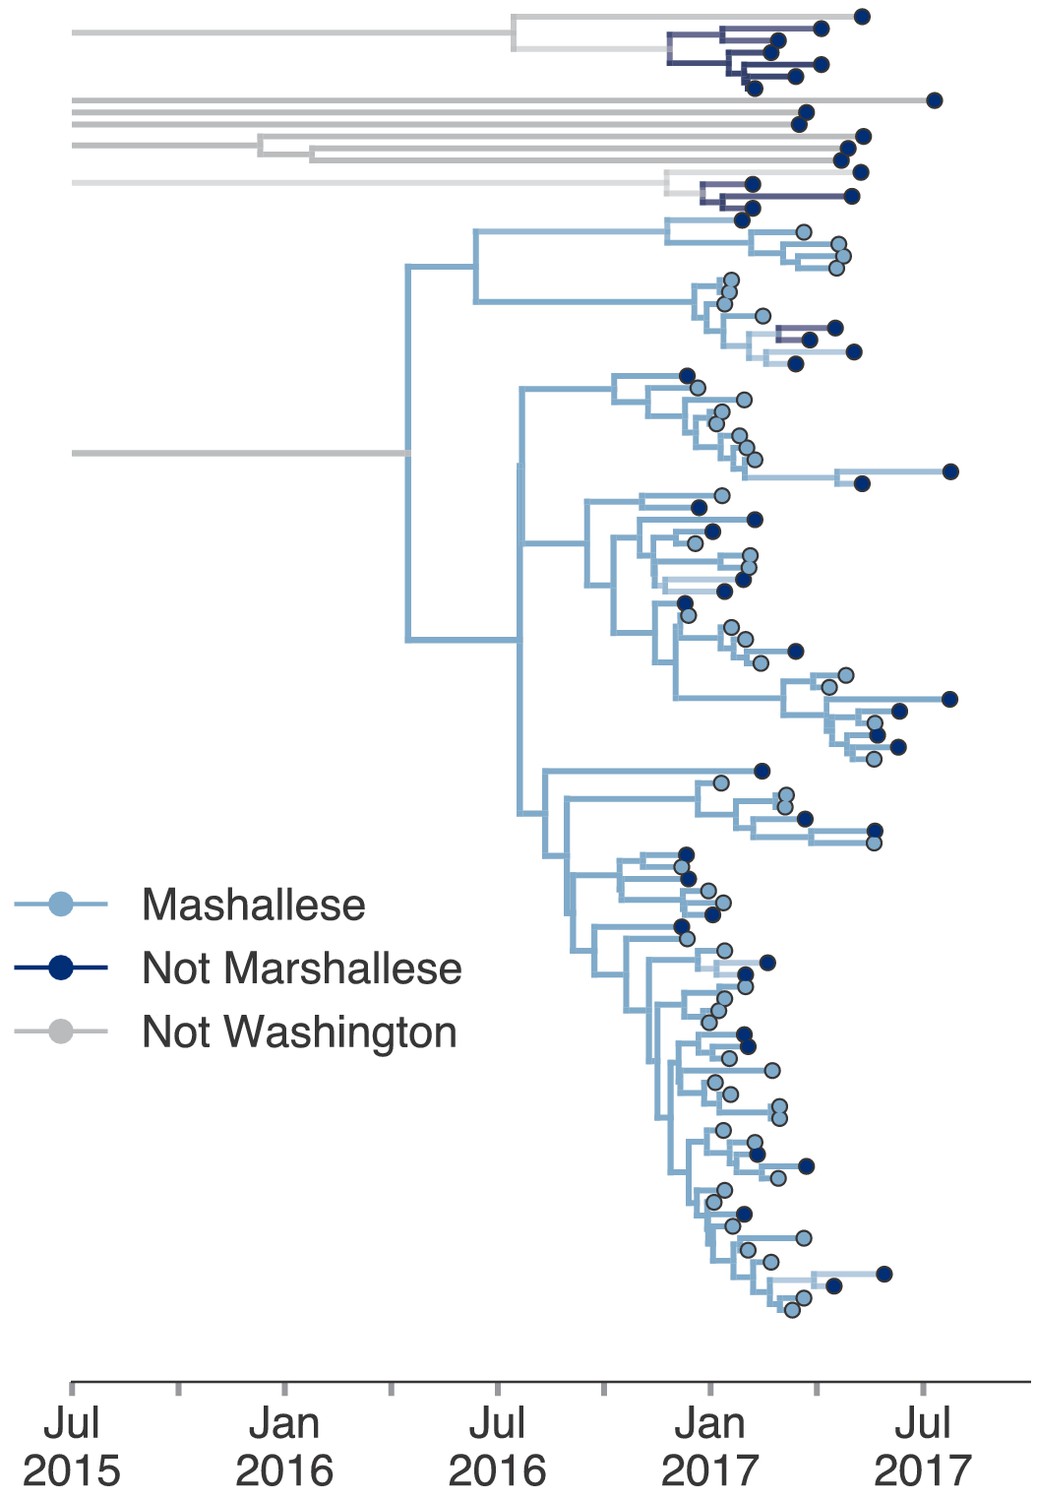
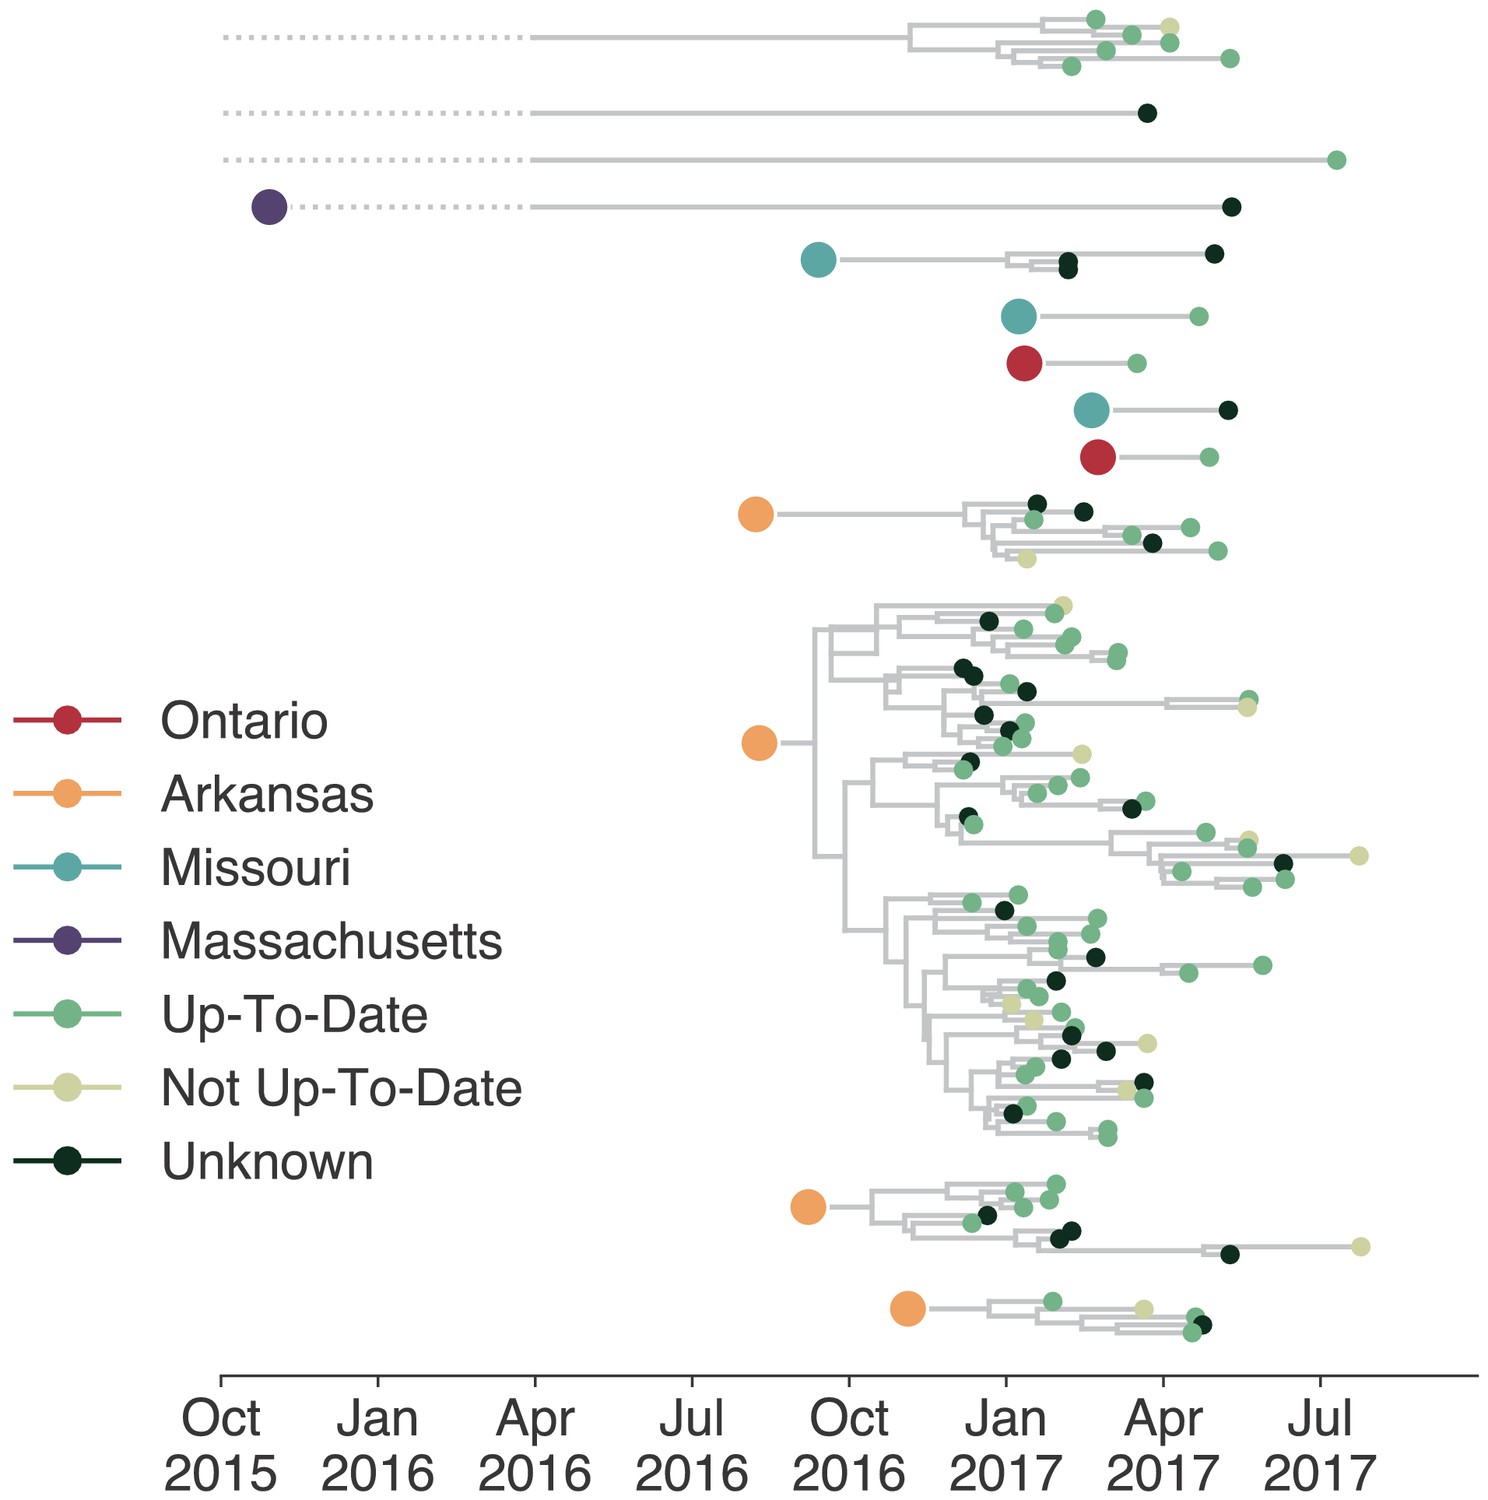
Including all Washington sequences recovers majority of transmission in Marshallese.
To ensure that excluding non-Marshallese clusters did not skew our findings, we inferred a single tree using all Washington sequences. We performed a structured coalescent analysis specifying three groups: Marshallese, not Marshallese, and not Washington. Each internal node is colored by its most probable group, with its opacity specifying the posterior probability of being in that group (fully opaque being probability = 1, fully transparent being probability = 0).
-
Figure 6—source data 1
XML file and output files to run structured coalescent analysis with unsampled ‘ghost’ deme shown in Figure 6 (identifiable metadata have been removed).
- https://cdn.elifesciences.org/articles/66448/elife-66448-fig6-data1-v2.zip
Figure 6—figure supplement 1
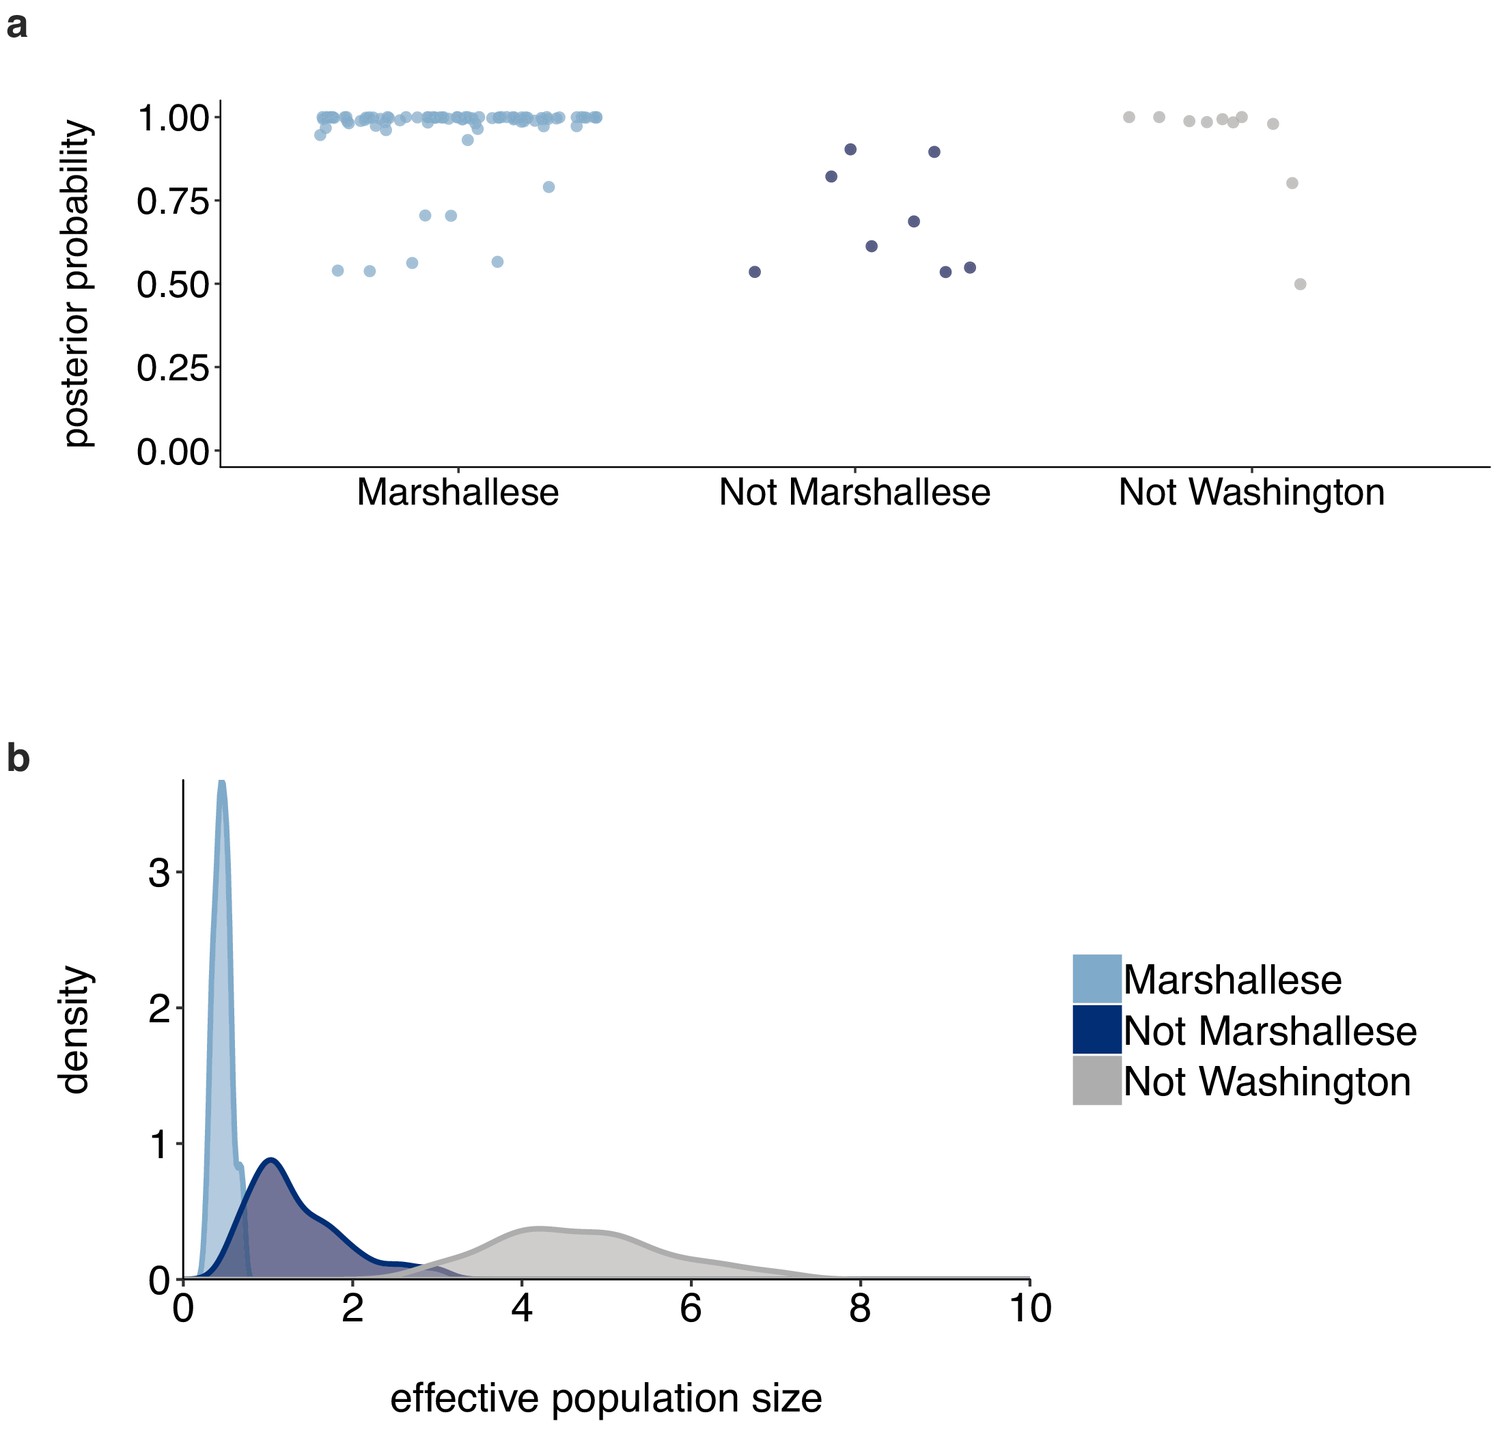
Posterior probabilities of internal node states.
(a) For the tree shown in Figure 6, each internal node is plotted. For each internal node, its color and placement on the x-axis represent its inferred most probable group (Marshallese, not Marshallese, or not Washington). The posterior probability of being labeled its most probable group is shown on the y-axis. We recover moderate support for a small number of non-Marshallese internal nodes, while the vast majority of internal nodes remain inferred as Marshallese. (b) The 95% highest posterior density intervals of the inferred effective population sizes for Marshallese, non-Marshallese, and not Washington demes.
Figure 7
Individuals in different vaccination groups are infected by genetically similar viruses.
The exploded tree as shown in Figure 3a is shown, but tips are now colored by whether they represent cases from individuals who are up-to-date for mumps vaccination, not up-to-date, or cases for which vaccination status was unknown. The color of the large dot represents the inferred geographic location from which the Washington introduction was seeded.
Figure 8
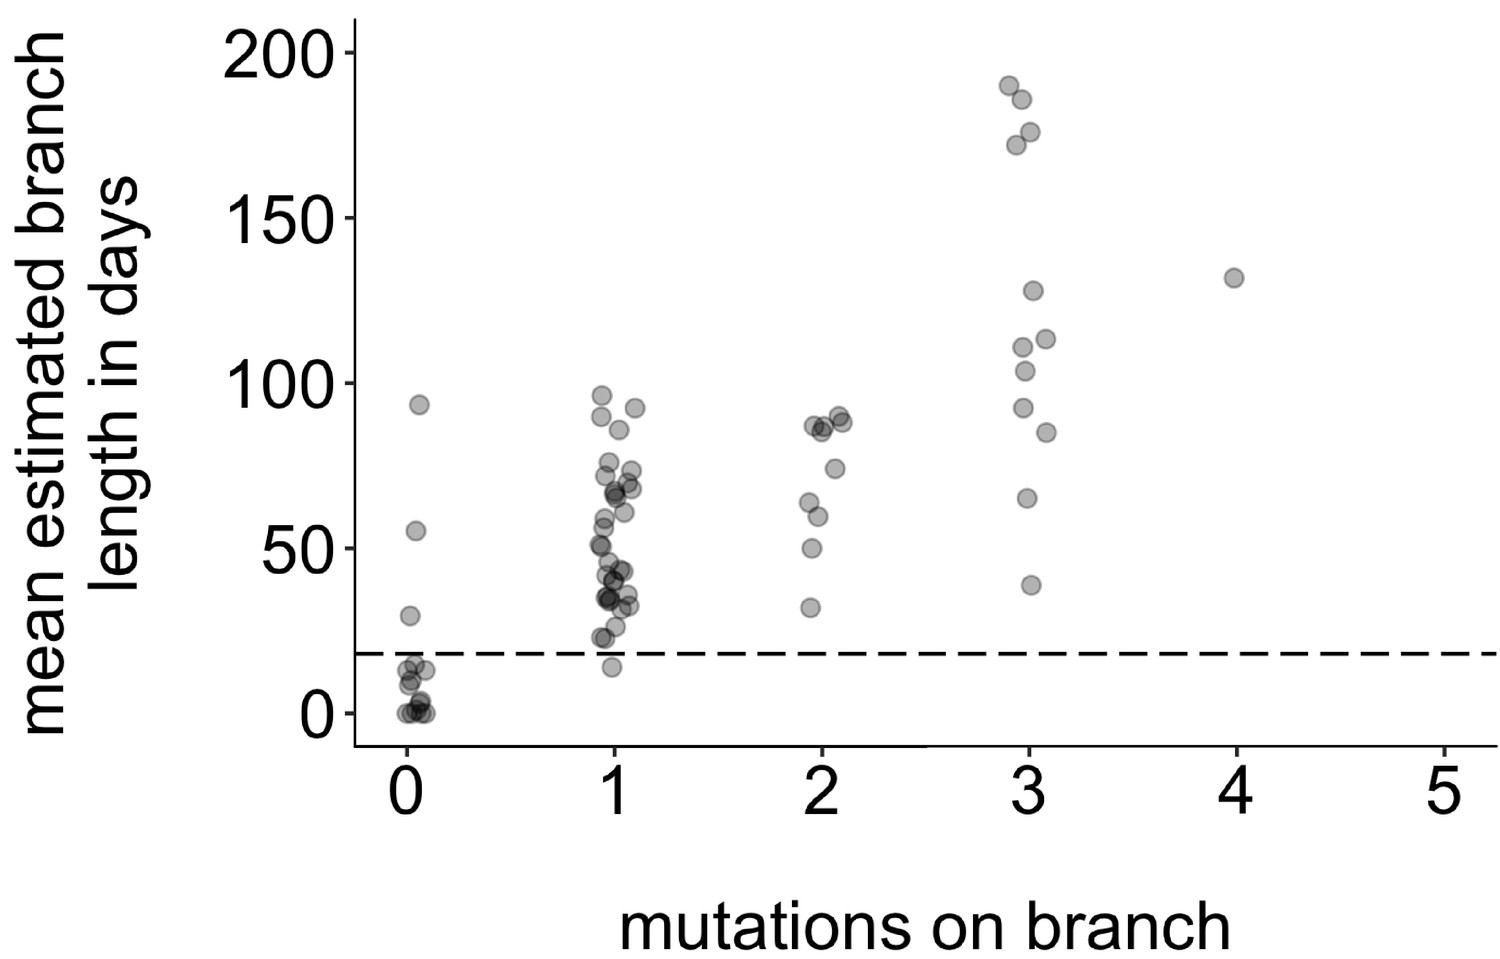
Mutations vs. estimated branch length in days.
For each Washington tip in the full North American phylogeny with an estimated branch length in time units of ≤1 year, we show the number of mutations on that branch on the x-axis vs. the mean estimated branch length in days on the y-axis. The dashed line at 18 represents the mumps serial interval.
Figure 9
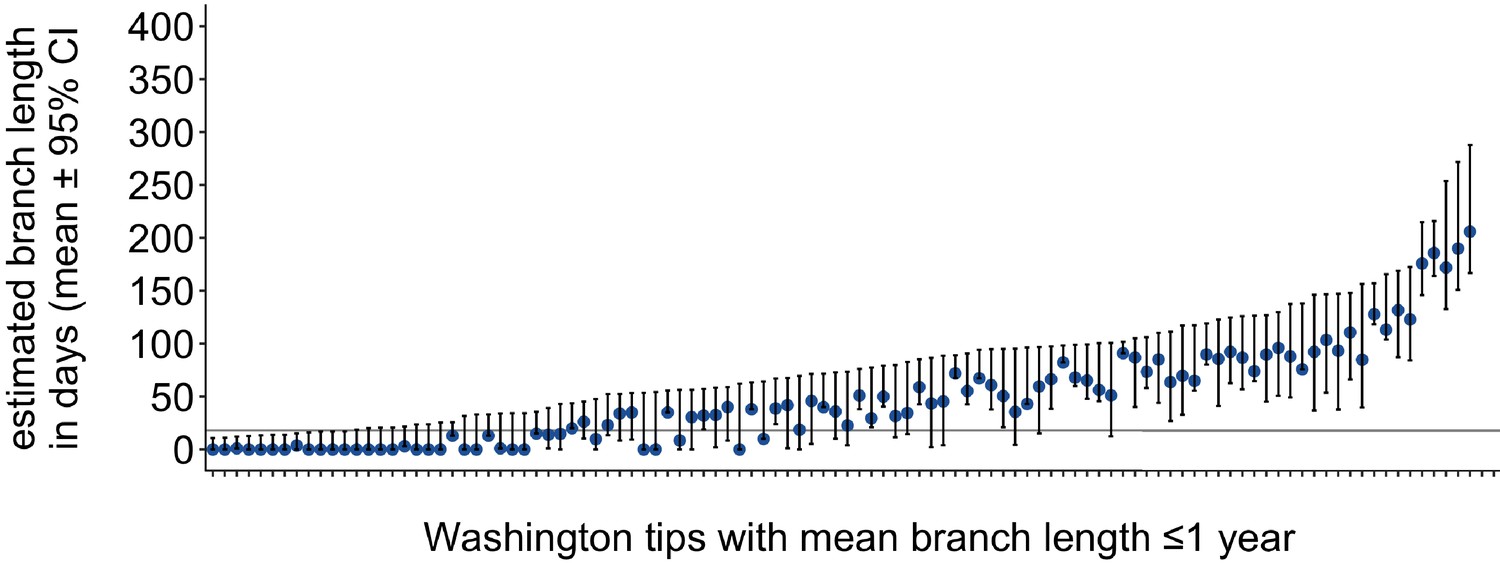
Washington tip branch lengths in days.
For each Washington tip in the full North American phylogeny with an estimated branch length in time units of ≤1 year, we show the estimated branch length in days with the 95% confidence interval. The solid line at 18 represents the mump serial interval. For most tips, the estimated branch length is variable, depending on the placement of its parental internal node. This variability in internal node placement complicates setting a clear threshold for branch lengths based on time.
Tables
Table 1
Associations between basal tip position in the phylogeny and possible predictors of transmission.
| Predictor variable | Estimated coefficient (standard error) | Odds ratio (95% CI) | p-value |
|---|---|---|---|
| Not up-to-date | −0.76 (0.69) | 0.47 (0.11, 1.73) | 0.27 |
| Vaccination status unknown | 0.72 (0.77) | 2.04 (0.47, 10.15) | 0.35 |
| Age ≥20 years | −0.38 (0.51) | 0.69 (0.25, 1.86) | 0.46 |
| Community status | 1.21 (0.42) | 3.36 (1.49, 7.91) | 0.0042 |
Key resources table
| Reagent type (species) or resource | Designation | Source or reference | Identifiers | Additional information |
|---|---|---|---|---|
| Biological sample (Mumps virus) | 110 buccal swabs from mumps positive patients in Washington | Washington StateDepartment of Health | Sequences were deposited in Genbank under accessions MT859507-MT859672. Raw reads were deposited under SRA project number PRJNA641715 | Full metadata for each sequence is available in the manuscript in Supplementary file 1a |
| Biological sample (Mumps virus) | 56 buccal swabs from mumps positive patients from other US states | Wisconsin State Lab of Hygiene | Sequences were deposited in Genbank under accessions MT859507-MT859672. Raw reads were deposited under SRA project number PRJNA641715 | Full metadata for each sequence is available in the manuscript in Supplementary file 1a |
| Biological sample (Mumps virus) | Publicly available mumps genomes | NIAID Virus Pathogen Database and Analysis Resource (ViPR) (Pickett et al., 2012) | http://www.viprbrc.org/ | |
| Sequence- based reagent | mumps_1.5 kb primers | This paper | PCR primers | Full list of PCR primer sequences is available in the Materials and methods section under ‘Viral RNA extraction, cDNA synthesis, and amplicon generation’ |
| Commercial assay or kit | QiAmp Viral RNA Mini Kit | Qiagen, Valencia, CA, USA | Cat #: 52904 | |
| Commercial assay or kit | Protoscript II First strand synthesis kit | New England Biolabs, Ipswich MD, USA | Cat #: E6560L | |
| Commercial assay or kit | Q5 Hotstart DNA polymerase | New England Biolabs, Ipswich, MD, USA | Cat #: M0493L | |
| Commercial assay or kit | Ampure XP beads | Beckman Coulter | Cat #: A63881 | |
| Commercial assay or kit | Nextera XT DNA Library Prep Kit | Illumina, San Diego, CA, USA | Cat #: FC-131–1096 | |
| Software, algorithm | Bowtie2 | Langmead and Salzberg, 2012 | http://bowtie-bio.sourceforge.net/bowtie2/index.shtml | RRID:SCR_016368 |
| Software, algorithm | MAFFT | Katoh et al., 2002 | https://mafft.cbrc.jp/alignment/software/ | RRID:SCR_016368 |
| Software, algorithm | TreeTime | Sagulenko et al., 2018 | https://github.com/neherlab/treetime | |
| Software, algorithm | BEAST (versions 1.8.4 and 2.6.2) | Drummond et al., 2012, Lemey et al., 2009, Bouckaert et al., 2019 | https://beast.community/ and https://www.beast2.org/ | RRID:SCR_010228 |
| Software, algorithm | IQTREE | Nguyen et al., 2015 | http://www.iqtree.org | |
| Software, algorithm | Github repo with protocols for generating mumps sequences from buccal swabs | This paper | https://github.com/blab/mumps-seq | This github repository contains documentation and protocols for all lab procedures and bioinformatics pipelines used to generate consensus genomes from mumps buccal swabs |
| Software, algorithm | Github repo with scripts used to analyze data and generate figures for this manuscript | This paper | https://github.com/blab/mumps-wa-phylodynamics | This github repository contains all of the code used to generate figures and perform the analyses described in this manuscript. This repository also contains xml files used for input for BEAST analyses and alignments and tree files used to generate and plot phylogenetic trees |
Additional files
-
Supplementary file 1
Sample metadata.
All genomes generated for this analysis are described above. Dates are formatted as year-month-day. Vaccination status, Ct, and sample collection type are all available for the Washington samples. Genome coverage represents the total proportion of bases in the genome with at least 20× coverage for which we were able to call a base. Sites with <20× coverage were labeled as Ns. Only samples with at least 50% non-N bases were included in the analysis.
- https://cdn.elifesciences.org/articles/66448/elife-66448-supp1-v2.docx
-
Transparent reporting form
- https://cdn.elifesciences.org/articles/66448/elife-66448-transrepform-v2.docx
Download links
A two-part list of links to download the article, or parts of the article, in various formats.
Downloads (link to download the article as PDF)
Open citations (links to open the citations from this article in various online reference manager services)
Cite this article (links to download the citations from this article in formats compatible with various reference manager tools)
Repeated introductions and intensive community transmission fueled a mumps virus outbreak in Washington State
eLife 10:e66448.
https://doi.org/10.7554/eLife.66448


