Hybrid protein assembly-histone modification mechanism for PRC2-based epigenetic switching and memory
- Computational and Systems Biology, John Innes Centre, United Kingdom
- Cell and Developmental Biology, John Innes Centre, United Kingdom
Figures
Figure 1 with 4 supplements
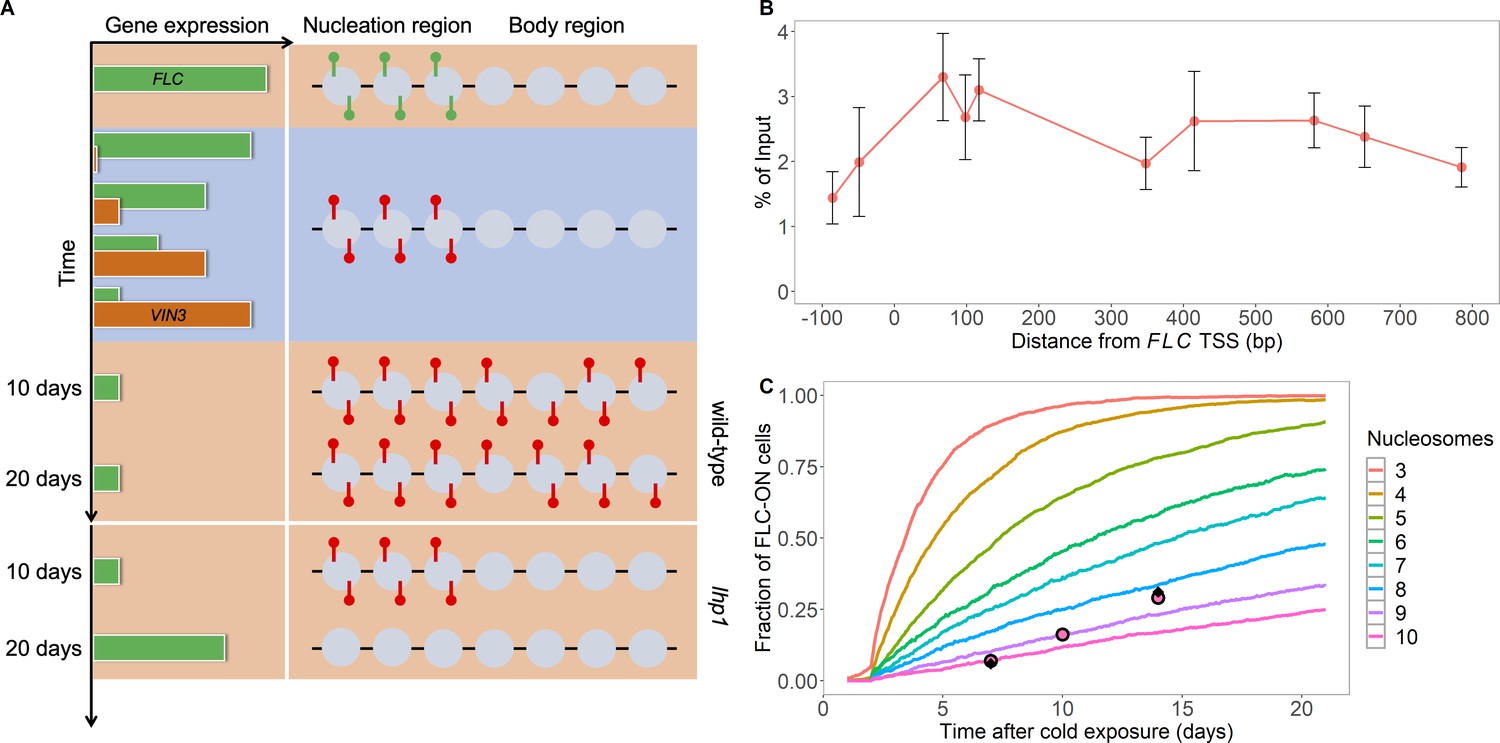
Existing model cannot explain persistence of metastable memory at FLC.
(A) Schematic of FLC and VIN3 expression (left) and chromatin states (right, H3K36me3 modifications in green and H3K27me3 in red) over time, in the warm (red background), in the cold (blue background) and subsequent warm (red background), with wild-type at 10 and 20 days post-cold shown first and lhp1 mutant at 10 and 20 days post-cold below. (B) MN-ChIP data for H3K27me3 profile (normalised to H3 levels) at FLC nucleation region (H3 and H3K27me3 levels with error bars are shown separately in Figure 1—figure supplement 1) after a 6-week cold treatment at 5°C. Error bars are sem, from n=3 biological replicates, with separate populations of seedlings harvested from MS plates. (C) Fraction of FLC-ON cells in simulated lhp1 mutant from model in Berry et al., 2017a in warm after cold (full curves, each averaged over 4000 realisations). Number of nucleation-region nucleosomes varied, with assumption that 1/6 of the nucleation region covered in H3K27me2/me3 is sufficient for full silencing, with cells being FLC-ON if this is not satisfied at one or both of the FLC copies. Simulations compared to experimental data (black diamonds) from Yang et al., 2017 and newly acquired data (pink circles) (see also Figure 1—figure supplements 2, 3 and 4 and Materials and methods).
-
Figure 1—source data 1
MN-ChIP data used in Figure 1B and Figure 1—figure supplement 1.
- https://cdn.elifesciences.org/articles/66454/elife-66454-fig1-data1-v2.xlsx
-
Figure 1—source data 2
Fraction of FLC-ON cells used in Figures 1C and 2D and Figure 1—figure supplement 2.
- https://cdn.elifesciences.org/articles/66454/elife-66454-fig1-data2-v2.xlsx
Figure 1—figure supplement 1
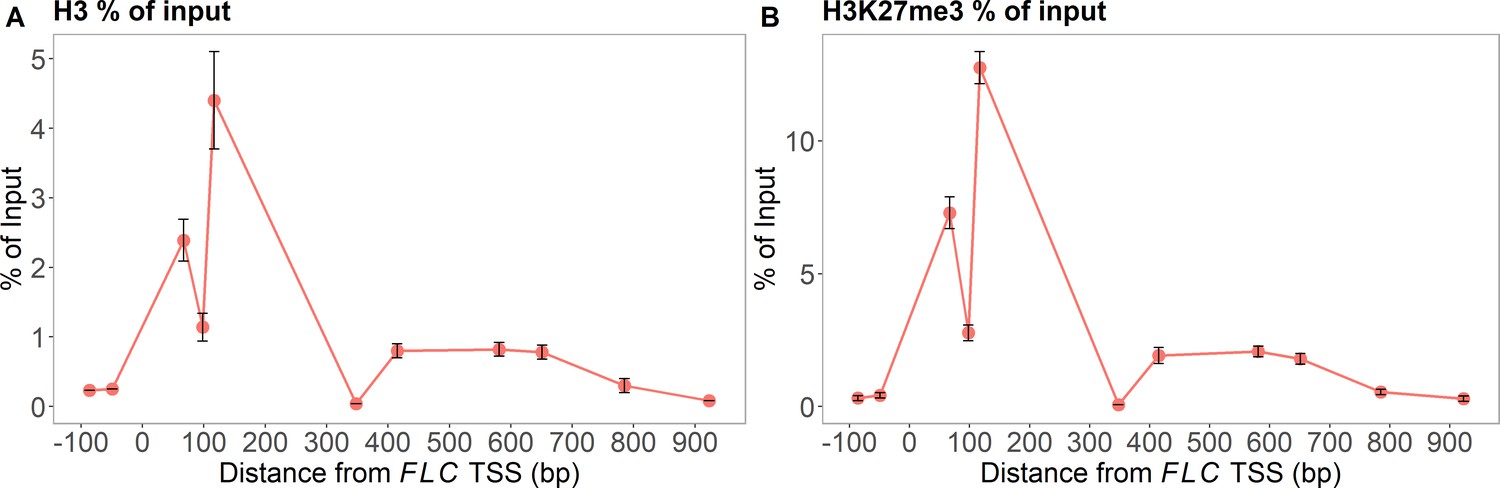
MN-ChIP experimental results across the FLC locus after a 6-week cold treatment at 5°C.
Positions of H3 shown in (A) and H3K27me3 in (B) (error bars: sem, n=3 biological replicates, with separate populations of seedlings harvested from MS plates).
Figure 1—figure supplement 2
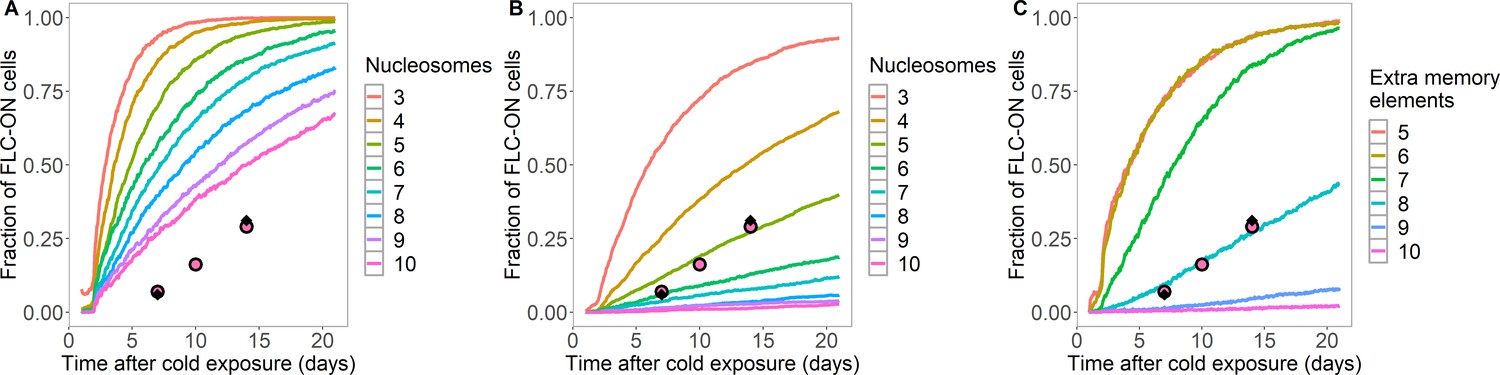
Simulated fraction of FLC-ON cells in lhp1 as a function of time in the warm after cold.
(A,B) Simulated data from histone-feedback only model: full colored lines, with varying number of nucleation region nucleosomes, as indicated on right of each panel. Experimental data: same as Figure 1C. (A) As in Figure 1C, but here at least 1/3 of the H3 histones must carry K27me2/me3 for full silencing, with cells being FLC-ON if this is not satisfied at one or both of the FLC copies. (B) As in Figure 1C, but here the nucleosomes are regularly distributed after DNA replication (one to each daughter strand in turn), and where at least 1/6 of the H3 histones must carry K27me2/me3 for full silencing, with cells being FLC-ON if this is not satisfied at one or both of the FLC copies. (C) Fraction of FLC-ON cells in simulated lhp1 mutant using hybrid assembly/histone modification model, where nucleosomes are also regularly distributed after DNA replication (one to each daughter strand in turn). Full coloured curves: varying number of non-histone modification memory elements, as indicated on right of panel, in addition to modifications on three nucleosomes (each curve averaged over 4000 realisations). Experimental data: same as Figure 1C. At least 1/3 of the H3 histones must carry K27me2/me3 for full silencing, with cells being FLC-ON if this is not satisfied at one or both of the FLC copies.
Figure 1—figure supplement 3
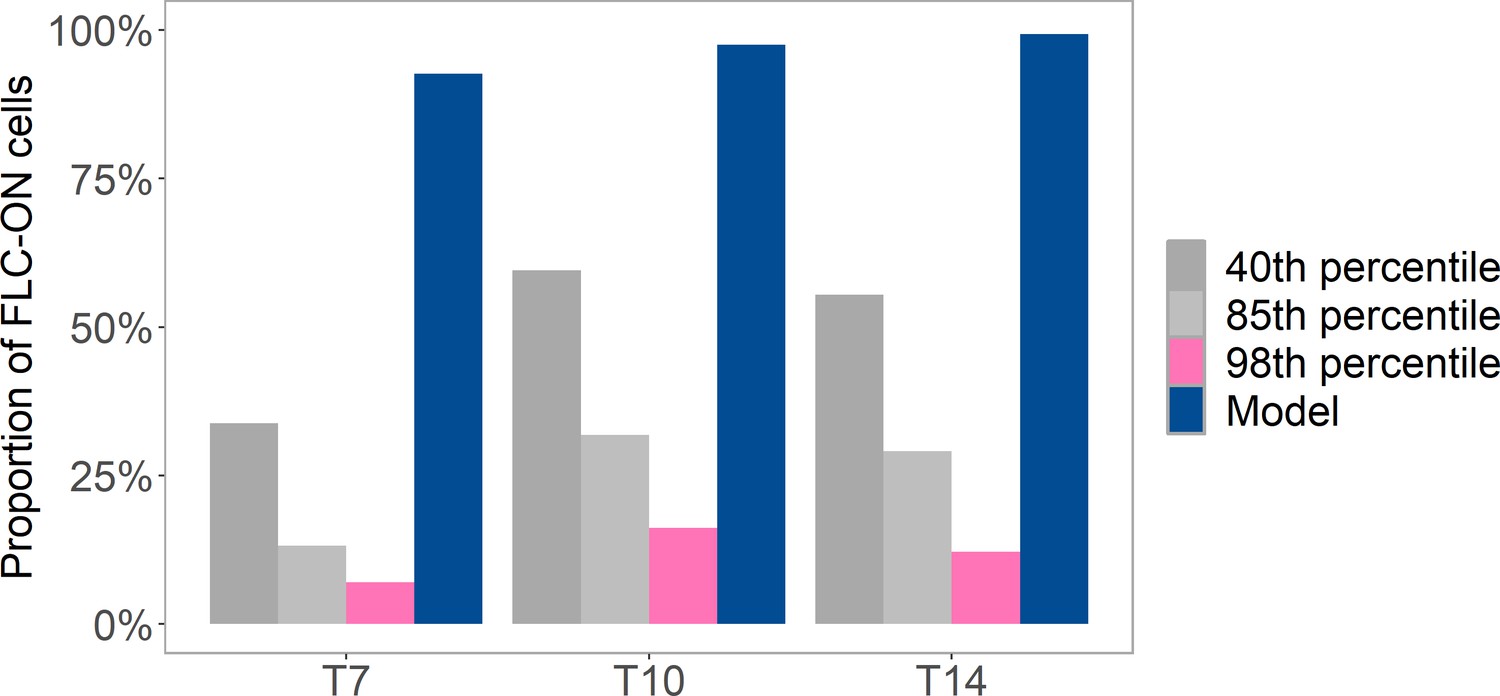
Analysis of proportion of FLC-ON cells in lhp1 after a 10-week cold treatment.
Cold at 5°C was followed by different number of days (where Tx = x days) in long-day, warm conditions (at 20°C with 16 hr of light). Pink and gray bars are from same imaging data but where a variable threshold is used to determine the fraction of ON-cells (40th percentile, 85th percentile, 98th percentile, see ‘Experimental details’). Also shown is prediction from histone-feedback only model (blue), with three nucleosomes and at least 1/6 of the H3 histones must carry K27me2/me3 for full silencing, with cells being FLC-ON if this is not satisfied at one or both of the FLC copies, as in Figure 1C.
Figure 1—figure supplement 4
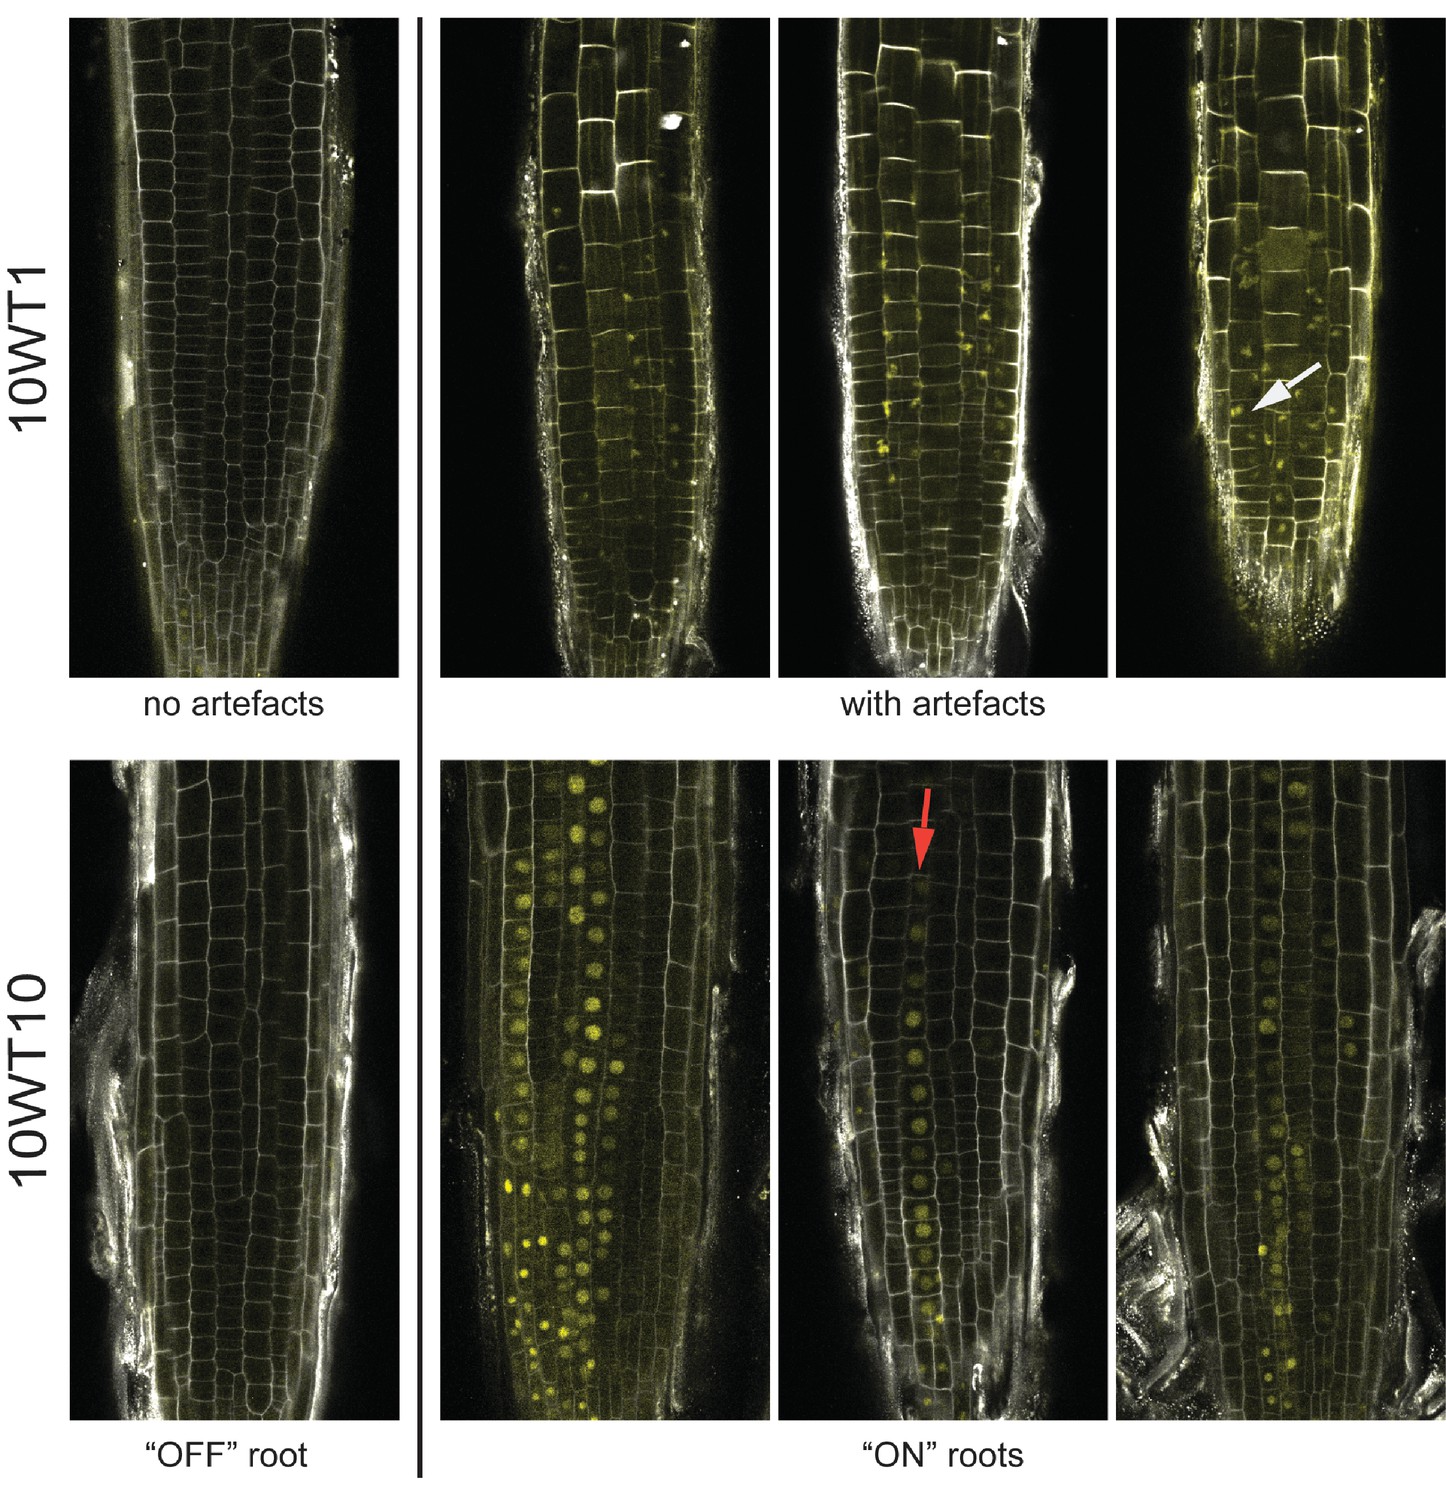
Images of lhp1 mutant roots.
Top: Images of representative roots from an early timepoint, 10WT1, 1 day after 10 weeks of cold at 5°C. The first root from the left has no FLC-ON cells. The other roots show Venus signal that is not located in the nucleus, with the white arrow pointing to a particular example. Bottom: Images of representative roots from a later timepoint, 10WT10, 10 days after 10 weeks of cold at 5°C. The first root from the left has no FLC-ON cells. The other roots show nuclear-localised FLC-Venus signal in some cells/cell files. The red arrow marks a file of ON-cells.
Figure 2 with 2 supplements
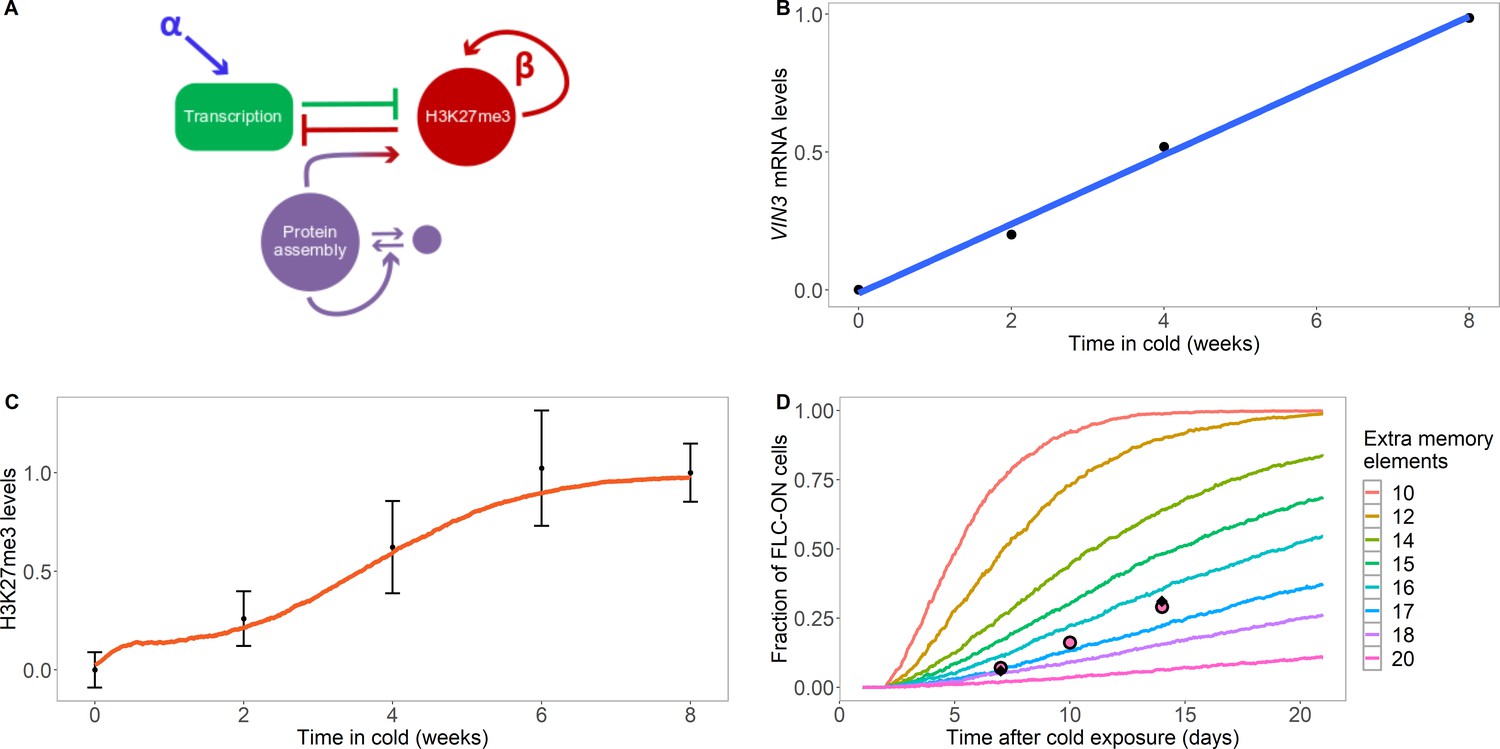
Model with extra assembly memory elements can explain nucleation dynamics and metastable memory at FLC.
(A) Schematic of the model with protein assembly as extra memory elements (see Figure 2—figure supplement 1 for a detailed schematic of the model). (B) VIN3 mRNA levels (black circles) in 8°C cold treatment for ColFRI, replotted data from Hepworth et al., 2018, blue line: linear fit. (C) Simulated H3K27me3 nucleation peak dynamics in cold (fraction of maximum possible occupancy; red line, averaged over 4000 realisations), with extra protein assembly memory elements, compared to data from Yang et al., 2014 (black circles, error bars: sem) for wild-type ColFRI. (D) Fraction of FLC-ON cells (full curves, each averaged over 4000 realisations) in simulated lhp1 mutant using model with varying number of non-histone modification memory elements, in addition to modifications on three nucleosomes, and with the assumption that 1/3 of the nucleation region covered in H3K27me2/me3 is sufficient for full silencing, with cells being FLC-ON if this is not satisfied at one or both of the FLC copies. Comparison shown to experimental data (black diamonds) from Yang et al., 2017, and newly acquired data (pink circles) (see also Figure 1—figure supplement 3 and Materials and methods). Details of the model, simulations and parameters are found in Materials and methods and Figure 2—figure supplement 2.
Figure 2—figure supplement 1
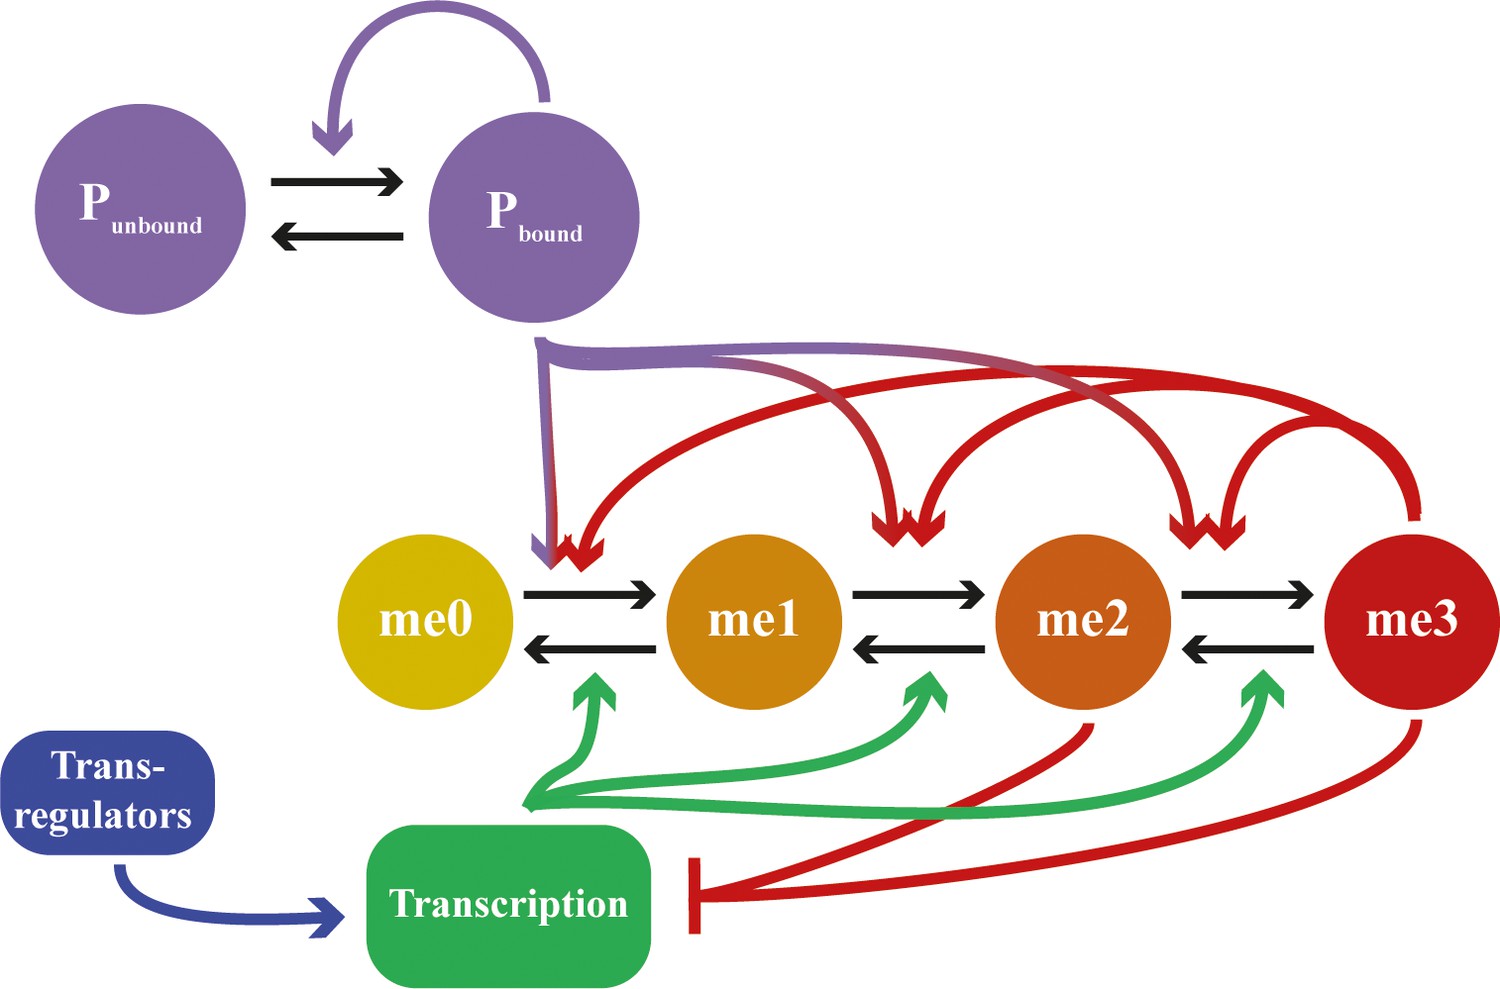
Detailed schematic of feedbacks in mathematical model including assembly dynamics.
States me0 to me3 refer to methylation state of H3K27. Neutral marks are me0/me1, repressive marks are me2/me3. States Pbound and Punbound represent whether a site in the nucleation region is bound by an assembly subunit or not. Black arrows represent state transitions; coloured arrows represent feedback interactions. Feedbacks from me2 state not included for clarity.
Figure 2—figure supplement 2
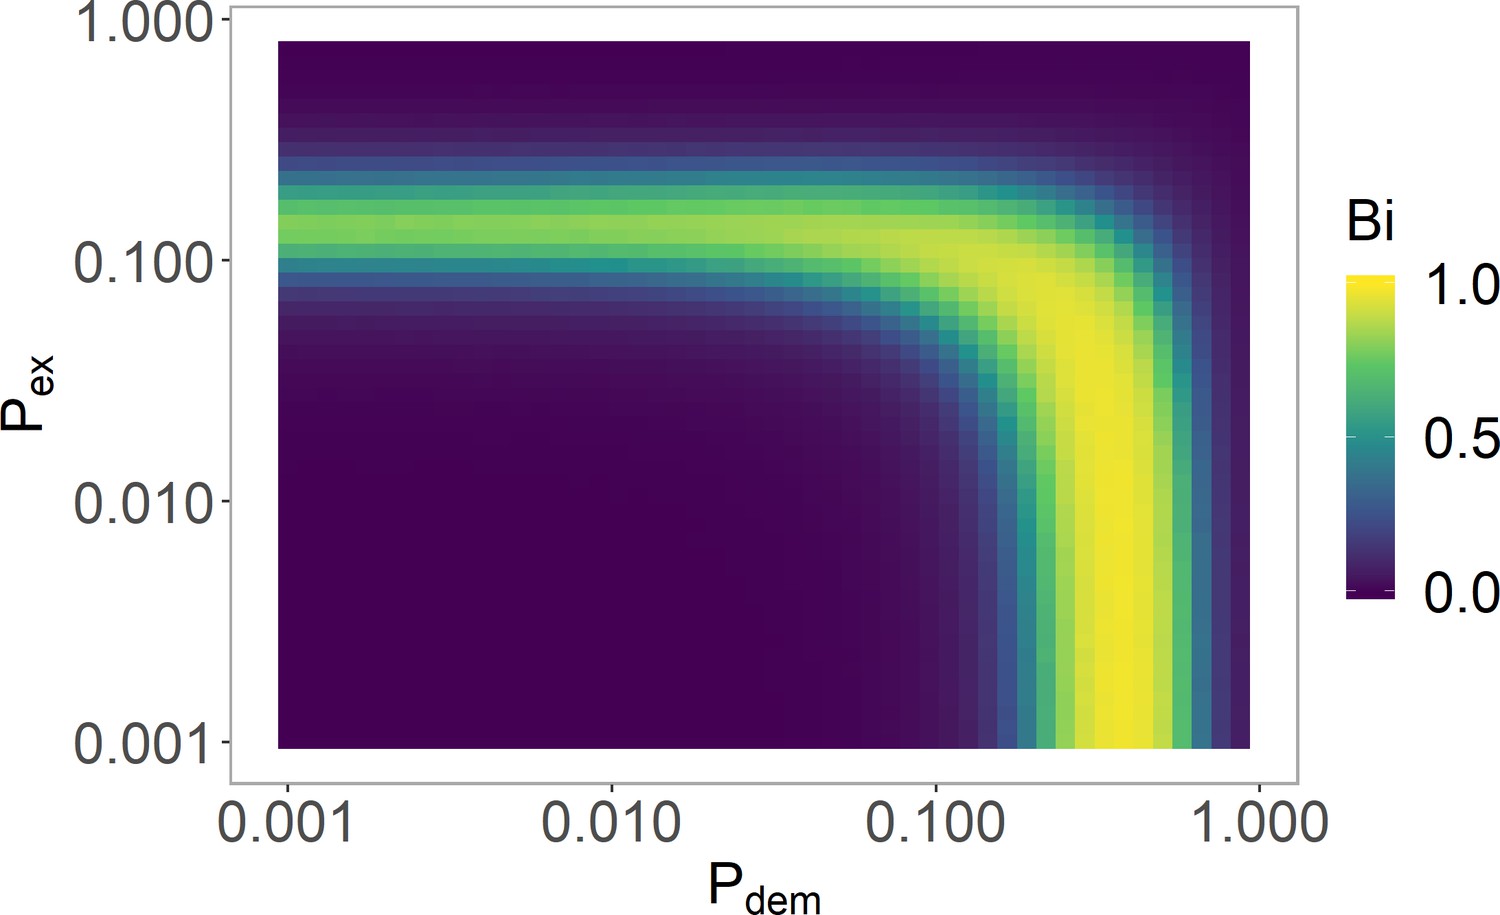
Varying and in the histone-feedback only model to find a bistable region.
The and values justified in Table 5 are used with (Table 6). See 'Model parameters and initial conditions' section for definition and explanation of , where strong bistability corresponds to . Simulations averaged over 4000 realisations.
Figure 3
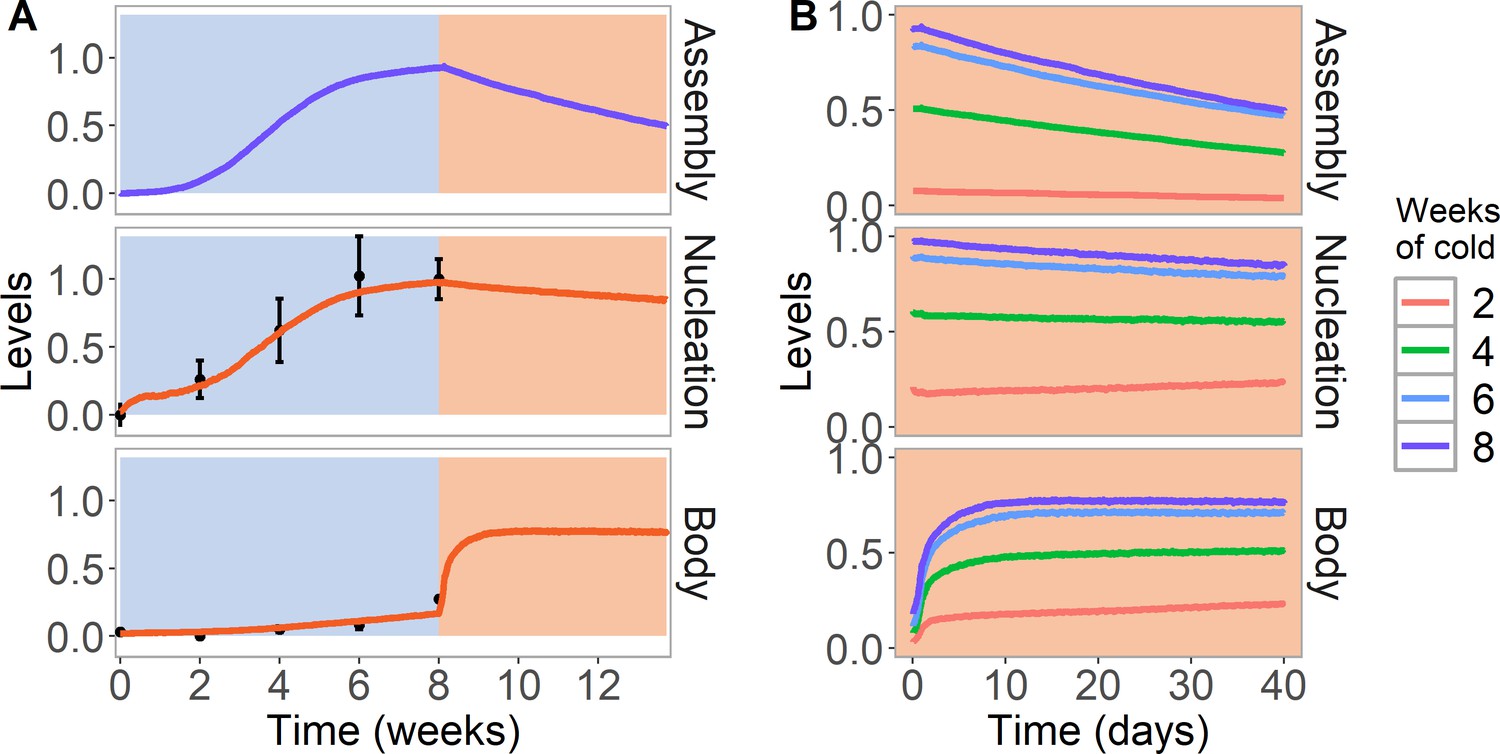
Simulation of cold treatment followed by warm conditions in model with assembly positive feedback, including both nucleation region and gene body.
Simulated dynamics (lines) for assembly, as well as nucleation and body region H3K27me3 levels, for wild-type ColFRI. (A) Cold treatment (blue background) is followed by warm conditions (red background). Simulated H3K27me3 nucleation levels in cold same as Figure 2C. Experimental H3K27me3 ChIP data (black circles, error bars: sem) (Yang et al., 2014). (B) Simulated dynamics in the warm, after 2, 4, 6, or 8 weeks of cold treatment. The 8 week data in the warm is the same as in (A). Simulated assembly and H3K27me3 levels are fraction of maximum possible occupancy in relevant region, each averaged over 4000 realisations.
Figure 4 with 1 supplement

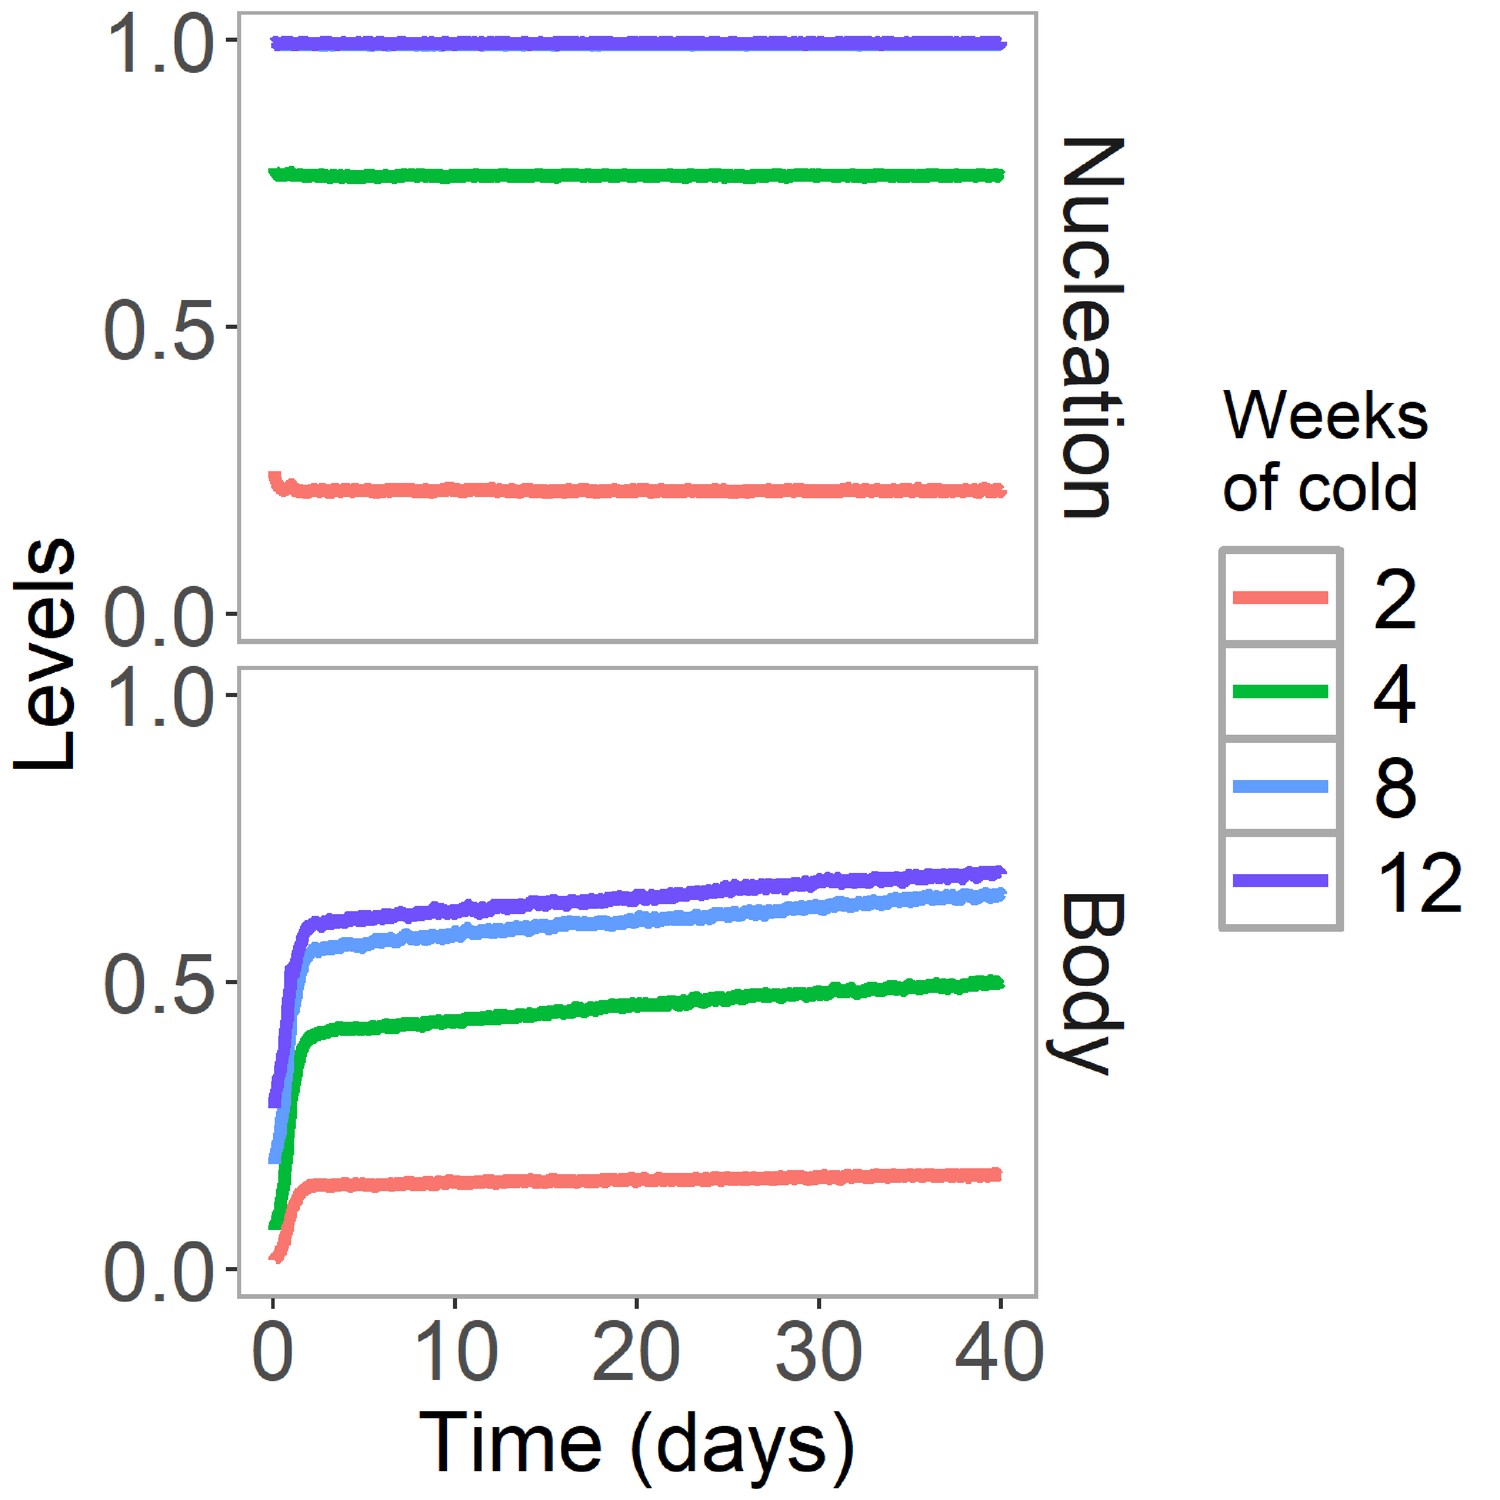
PRE excision simulation and simulated reactivation in Lov-1 accession.
(A) H3K27me3 levels over the entire FLC locus in a simulated PRE excision experiment. A fully spread state is simulated; the nucleation region (with any assembly elements) is removed (at day 11 in the simulations), thereby interrupting the looping reactions and compromising the spread state. Varying levels of PRC2 feedbacks (, right) are simulated in the body region when the nucleation region is removed, with each level averaged over 4000 realisations. (B,C) Simulated dynamics (lines) of assembly, as well as nucleation and body region H3K27me3 levels, for Lov-1 accession. Lov-1 is simulated with the parameter for transcription activation (α) in the warm higher than in ColFRI (specified in Materials and methods). (B) Cold treatment (blue background) is followed by warm conditions (red background). Experimental H3K27me3 ChIP data (black circles, error bars: sem) (Qüesta et al., 2020). (C) Simulated dynamics in the warm after 2, 4, 8, or 12 weeks of cold treatment. The 12-week data in the warm is the same as in (B). Simulated assembly and H3K27me3 levels are fraction of maximum possible occupancy in relevant region, each averaged over 4000 realisations. In Figure 4—figure supplement 1, non-replicating Lov-1 cells are simulated.
Figure 4—figure supplement 1
H3K27me3 levels are stable after cold in Lov-1 in simulated non-replicating cells.
Simulated dynamics of hybrid assembly/histone modification model for nucleation region and body H3K27me3 in Lov-1 in the warm after 2, 4, 8, or 12 weeks of cold treatment. As in Figure 4B,C, but here replication is suspended in the warm. Simulated H3K27me3 levels are fraction of maximum possible occupancy in relevant region, each averaged over 4000 realisations.
Figure 5

Schematic of nucleation, spreading, and maintenance at FLC.
First, stochastic nucleation of an assembly occurs in the cold and permits the de-novo addition of nucleation region H3K27me3. On return to warm, a long-range looping interaction mediates spreading of H3K27me3 across the locus. Eventually, the assembly memory storage elements at the locus are lost, but H3K27me3 is in most cases maintained at the locus, but can eventually be lost if the transcriptional push is high enough (e.g. in Lov-1 variety).
Tables
Key resources table
| Reagent type (species) or resource | Designation | Source or reference | Identifiers | Additional information |
|---|---|---|---|---|
| Gene (Arabidopsis thaliana) | FLC | TAIR | AT5G10140 | |
| Strain, strain background (Arabidopsis thaliana, Columbia-0) | ‘Col-FRI; Col-FRIsf2’ | Yang et al., 2017 DOI:10.1126/science.aan1121 | Columbia-0 background with active FRI | |
| Strain, strain background (Arabidopsis thaliana, Columbia-0) | lhp1-3 FRIsf2 FLC-Venus | Yang et al., 2017 DOI: 10.1126/science.aan1121 | lhp1 mutant in Columbia-0 background with active FRI, a mutated FLC and complementing FLC-Venus transgene | |
| Antibody | anti-H3 (rabbit polyclonal) | Abcam | Cat# ab1791, RRID:AB_302613 | ‘3 µg/IP’ |
| Antibody | anti-H3K27me3 (rabbit, polyclonal) | Millipore | Cat# 07–449, RRID:AB_310624 | ‘4 µg/IP’ |
| Sequence-based reagent | −86 | This study | MN-ChIP primers | F: CACTCTCGTTTACCCCCAAA R: TCCTTTTCTCGCTTTATTTCTTTC |
| Sequence-based reagent | −49 | This study and Yang et al., 2017 DOI: 10.1126/science.aan1121 FLC_−49_F | MN-ChIP primers | F: GCCCGACGAAGAAAAAGTAG R: TTCAAGTCGCCGGAGATACT |
| Sequence-based reagent | 67 | This study | MN-ChIP primers | F: AGGATCAAATTAGGGCACAAA R: TCAATTCGCTTGATTTCTAGTTTTTT |
| Sequence-based reagent | 98 | This study | MN-ChIP primers | F: GAGAGAAGCCATGGGAAGAA R: AGCTGACGAGCTTTCTCTCGAT |
| Sequence-based reagent | 117 | This study | MN-ChIP primers | F: AAAAAACTAGAAATCAAGCGAATTGA R: CTTTCTCGATGAGACCGTT |
| Sequence-based reagent | 348 | This study | MN-ChIP primers | F: GTGCTCTTTTACTTTTCTGAG R: AGAGATCCGCCGGAAAAA |
| Sequence-based reagent | 415 | This study and Yang et al., 2017 DOI:10.1126/science.aan1121 FLC_416_F | MN-ChIP primers | F: GGCGGATCTCTTGTTGTTTC R: TTCTTCACGACATTGTTCTTCC |
| Sequence-based reagent | 581 | This study | MN-ChIP primers | F: TGCATGGATTTCATTATTTCCT R: TCACTCAACAACATCGAGCA |
| Sequence-based reagent | 651 | Yang et al., 2017 DOI: 10.1126/science.aan1121 FLC_652_F FLC_809_R | MN-ChIP primers | F: CGTGCTCGATGTTGTTGAGT R: TCCCGTAAGTGCATTGCATA |
| Sequence-based reagent | 785 | This study | MN-ChIP primers | F: TCATTGGATCTCTCGGATTTG R: AGGTCCACAGCAAAGATAGGAA |
| Sequence-based reagent | 923 | This study | MN-ChIP primers | F: TTCCTATCTTTGCTGTGGACCT R: GAATCGCAATCGATAACCAGA |
| Chemical compound, drug | Protease inhibitor cocktail, cOmplete | Sigma- Aldrich | Cat#5056489001 | |
| Chemical compound, drug | Micrococcal nuclease | Takara Bio | Cat#2910A | 200 U/ml |
| Software, algorithm | ImageJ | https://imagej.nih.gov/ij/ | Fiji, RRID:SCR_002285 | |
| Software, algorithm | Image analysis pipeline | This study Yang et al., 2017 | (with modifications) | https://github.com/JIC-Image-Analysis/lhp1-analysis |
| Other | Propidium iodide stain (PI) | Sigma-Aldrich | Cat# P4864 | 2 µg/mL |
Table 1
Definitions of the simulated system, the histones, and the protein assembly at FLC.
| Definitions of the simulated system | |
|---|---|
| Type | Status |
| Protein assembly occupancy | |
| Histones | |
| Regions of histones | |
Table 2
Definitions and functions used in the propensity functions in Table 3.
| Definitions | |
|---|---|
| The Kronecker delta | |
| Neighbour effect | |
| Neighbouring set | |
| Fraction of histones in me3 or me2 | |
| Sum of bound proteins | |
| Protein feedback | |
| Spontaneous protein binding | |
Table 3
Propensity functions used in the simulations.
| Propensities | |
|---|---|
| Non-assembly methylation propensity | |
| Demethylation propensity | |
| Transcription | |
| Protein binding propensity | |
| Protein unbinding propensity | |
| Total methylation propensity | |
Table 4
Specification of parameters for different conditions.
Post-cold, a time lag of 1 day without replication is first simulated with new, post-cold values of the parameters specified, with the exception of , which is changed to its post-cold value after that time lag.
| Pre-cold | Cold | Post-cold | |
|---|---|---|---|
| Cell cycle length | |||
| Trans-acting gene activation () | |||
| PRC2-mediated methylation rate () at i-th histone | |||
| Spontaneous protein binding | 0 | 0 | |
| Simulated number of cell cycles | 10.9 |
Table 5
Fixed parameters with references justifying values used.
| Parameter | Description | Value | Justification |
|---|---|---|---|
| Number of histones | 60 | Berry et al., 2017a | |
| PRC2-mediated methylation rate (me0 to me1) (histone−1 s−1) | |||
| PRC2-mediated methylation rate (me1 to me2) (histone−1 s−1) | |||
| PRC2-mediated methylation rate (me2 to me3) (histone−1 s−1) | |||
| Noisy methylation rate (me2 to me3) (histone−1 s−1) | |||
| Noisy methylation rate (me1 to me2) (histone−1 s−1) | |||
| Noisy methylation rate (me0 to me1) (histone−1 s−1) | |||
| Relative local PRC2-activity | 1 | ||
| Relative activation of PRC2 by H3K27me2 | 0.1 | ||
| Noisy demethylation rate (histone−1 s−1) | |||
| Limit on maximum transcription initiation (s−1) | 1/60 | ||
| PT | Threshold for full repression of transcription | 1/3 | Hepworth et al., 2018; Jadhav et al., 2020 |
| Minimum transcription initiation rate (s−1) | Yang et al., 2014 | ||
| Maximum transcription initiation rate (s−1) | Yang et al., 2014; Ietswaart et al., 2017 | ||
| Demethylation probability (histone−1 transcription−1) | 0.17 | Figure 2—figure supplement 2 | |
| Histone exchange probability (histone−1 transcription−1) | |||
| Cell cycle length in warm (22°C) conditions (h) | 22 | Rahni and Birnbaum, 2019; Zhao et al., 2020 | |
| Cell cycle length in cold (5°C) conditions (h) | 154 |
Table 6
Free parameters and their values used in the simulations.
| Parameter | Description | Value |
|---|---|---|
| Number of histones in nucleation region | 6 | |
| Maximum number of proteins in assembly | 17 | |
| | Number of cell cycles in cold conditions Number of cell cycles post cold | 8.7 43.6 |
| | PRC2-mediated methylation rate (me2 to me3) High rate (histone−1 s−1) Low rate (histone−1 s−1) | |
| Assembly-mediated methylation rate (histone−1 s−1) | 0.01 | |
| Noisy addition of protein to the assembly (s−1) | ||
| Timescale for VIN3 binding saturation in weeks | 3 | |
| Protein feedback rate (s−1) | 0.05 | |
| Noisy unbinding of proteins from the assembly (protein−1 s−1) | 10-3 | |
| Number of proteins in assembly required for protein feedback | 4 | |
| = = | Trans-acting gene activation warm conditions Trans-acting gene activation cold conditions | 1 0.75 |
Table 7
Additional parameters and equations.
Pr in the definitions of POFF and PON refer to the proportion of time (see ‘Model parameters’ section), relevant for Figure 2—figure supplement 2.
| Parameter | Description | Value |
|---|---|---|
| Number of simulations for a gene | 4000 | |
| Time step for time course averaging (h) | 1 | |
| Definition | Reference | |
| Berry et al., 2017a | ||
| Sneppen and Dodd, 2012; Berry et al., 2017a |
Table 8
Additional details for simulations of PRE excision in Figure 4A.
Values for specified in figure.
| Default | Change in simulation | Condition |
|---|---|---|
| After 11 days in warm, post-cold. |
Table 9
Summary of other figure specific parameters.
| Figure | Parameter | Value |
|---|---|---|
| 1C, 2D, Figure 1—figure supplements 2 and 3 | FLC-ON cell | |
| 1C, Figure 1—figure supplement 3 | | 0 (s−1) 1/6 0 (histone−1 s−1) |
| Figure 1—figure supplement 2A | | 0 (s−1) 1/3 0 (histone−1 s−1) |
| Figure 1—figure supplement 2B | Regular nucleosome distribution to daughter strands | 0 (s−1) 1/6 0 (histone−1 s−1) N/A |
| Figure 1—figure supplement 2C | Regular nucleosome distribution to daughter strands | 0 (s−1) 1/3 0 (histone−1 s−1) N/A (protein−1 s−1) |
| 2C | | 1/3 (histone−1 s−1) |
| 2D | | 0 (s−1) 1/3 0 (histone−1 s−1) |
| 4 B,C | | (s−1) 13.1 2 (histone−1 s−1) |
| Figure 4—figure supplement 1 | As 4B,C but no replication in warm after cold | N/A |
Table 10
Primers used to define nucleation and body region in ChIP data for Lov-1 (Qüesta et al., 2020) and ColFRI (Yang et al., 2014).
| Lov-1 | Col-FRI | |
|---|---|---|
| Nucleation region | 157_F 314_R 416_F 502_R | 157_F 314_R 416_F 502_R |
| Body | 2465_F 2560_R 3197_F 3333_R 4322_F 4469_R 5139_F 5244_R | 1933_F 2171_R 2465_F 2560_R 3197_F 3333_R 3998_F 4178_R 4322_F 4469_R 5139_F 5244_R |
Table 11
Summary of experimental details for lhp1 imaging and MN-ChIP.
| lhp1 imaging | MN-ChIP | |
|---|---|---|
| Plant material | FRI lhp1-3 FLC-Venus | ColFRI |
| Growth media | MS-GLU (MS without glucose) | MS-GLU (MS without glucose) |
| Plates | Vertical | Horizontal |
| Pre-growth | 7 days | 14 days |
Table 12
Summary statistics for quantitative image analysis of lhp1.
| Days after cold treatment | Number of roots imaged | Number of cells quantified |
|---|---|---|
| T7 | 11 | 1696 |
| T10 | 17 | 3598 |
| T14 | 10 | 2648 |
Additional files
Download links
A two-part list of links to download the article, or parts of the article, in various formats.
Downloads (link to download the article as PDF)
Open citations (links to open the citations from this article in various online reference manager services)
Cite this article (links to download the citations from this article in formats compatible with various reference manager tools)
Hybrid protein assembly-histone modification mechanism for PRC2-based epigenetic switching and memory
eLife 10:e66454.
https://doi.org/10.7554/eLife.66454


