The genetic organization of longitudinal subcortical volumetric change is stable throughout the lifespan
- Center for Lifespan Changes in Brain and Cognition, Department of Psychology, University of Oslo, Norway
- Department of Radiology and Nuclear Medicine, Oslo University Hospital, Norway
- Departament de Medicina, Facultat de Medicina i Ciències de la Salut, Universitat de Barcelona, and Institut de Neurociències, Universitat de Barcelona, Spain
- Center for Lifespan Psychology, Max Planck Institute for Human Development, Germany
- Max Planck UCL Centre for Computational Psychiatry and Ageing Research, Germany
- Center for Behavioral Genomics Twin Research Laboratory, University of California, San Diego, United States
- Department of Radiology and Nuclear Medicine, St. Olavs Hospital, Trondheim University Hospital, Norway
- Department of Neuromedicine and Movement Science, Faculty of Medicine and Health Sciences, Norwegian University of Science and Technology (NTNU), Norway
- MRC Cognition and Brain Sciences Unit, University of Cambridge, United Kingdom
- Donders Institute for Brain, Cognition and Behaviour, Radboud University, Netherlands
- Center of Excellence for Stress and Mental Health, VA San Diego Healthcare System, United States
- Lise Meitner Group for Environmental Neuroscience, Max Planck Institute for Human Development, Germany
- Department of Radiation Sciences, Umeå Center for Functional Brain Imaging, Umeå University, Sweden
- Department of Psychiatry, University of California, San Diego, United States
Figures
Figure 1
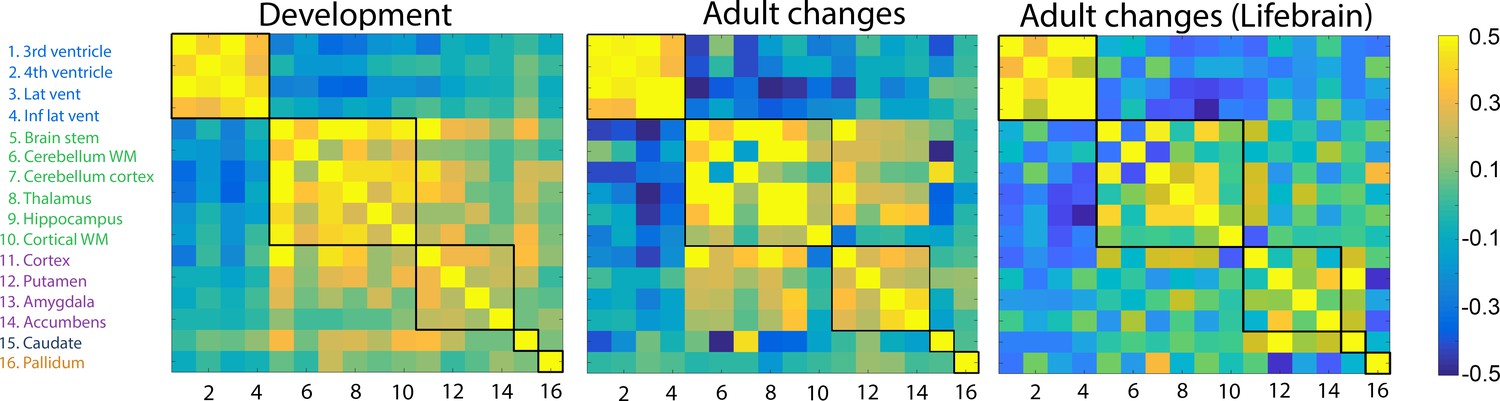
Volumetric change–change relationships.
Heatmaps represent pairwise correlation coefficients between volume change (annualized percent change) of the brain structures in development in the LCBC sample (left), aging in the LCBC sample (middle), and aging in the Lifebrain replication sample (right). The five clusters, delineated by the black lines, were derived from the developmental sample.
Figure 2
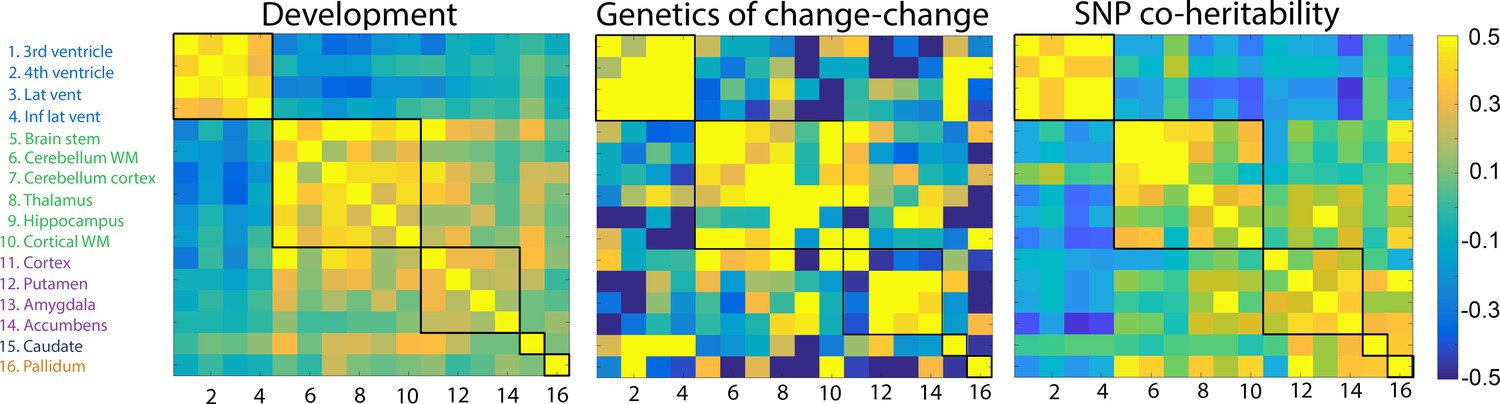
Genetic correlations.
Left: Change–change correlations in development used to generate clusters. Middle: Genetic change–change correlations, i.e.the genetic contribution to the relationships between change among any two structures, based on twin analysis (VETSA). Right: SNP genetic correlations from the UKB cross-sectional data. The five clusters, delineated by the black lines, were derived from the developmental sample.
Figure 3
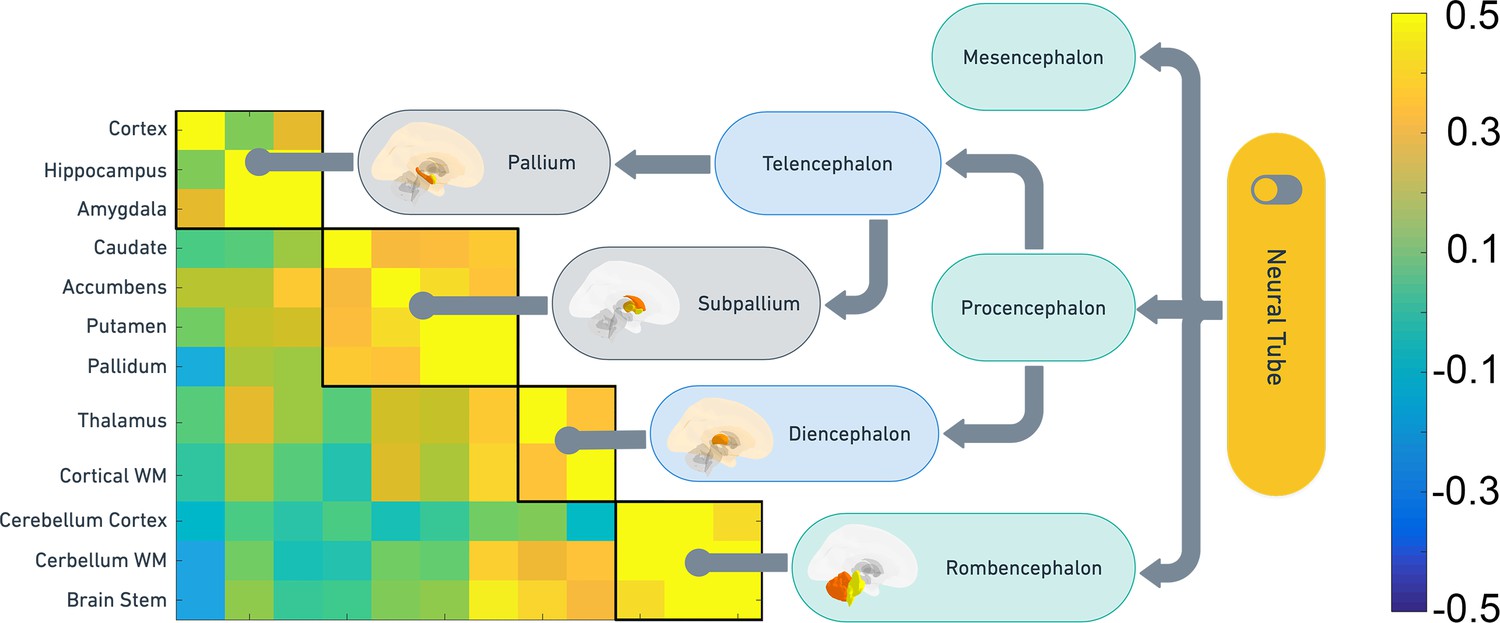
Correspondence between SNP heritability and embryonic brain development.
Clustering of the non-ventricular structures was used to test how shared genetic variance were organized in the UKB sample, and the clusters were compared to the main organization of embryonic brain development. The heatmap shows the pairwise genetic correlations. The flow chart shows the main features of embryonic brain development and how the genetic clusters obtained from middle-aged and older adults follow the same organization.
Figure 4
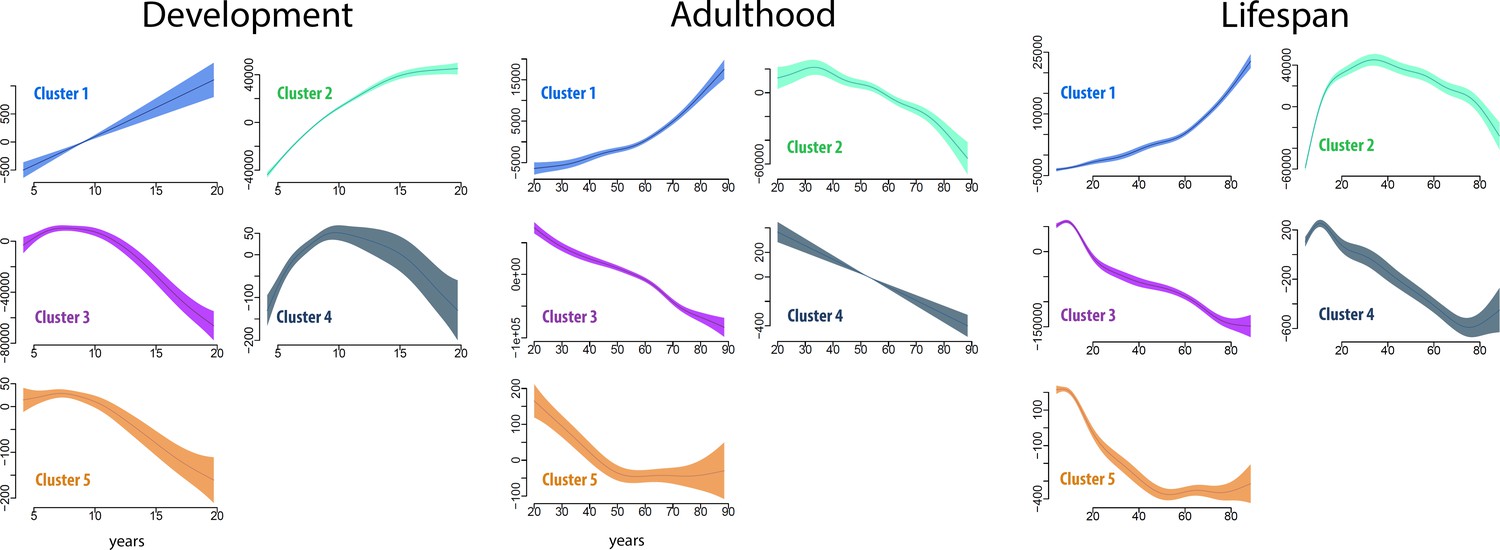
Cluster age trajectories for each cluster, for development (left), adulthood (middle), and the full lifespan (right).
The trajectories are fitted with GAMM, and the shaded areas represent 95% CI. Note that the y-axes scales vary for easier viewing. The trajectories were estimated for development and adulthood separately to ensure that the analyses were fully independent.
Figure 5
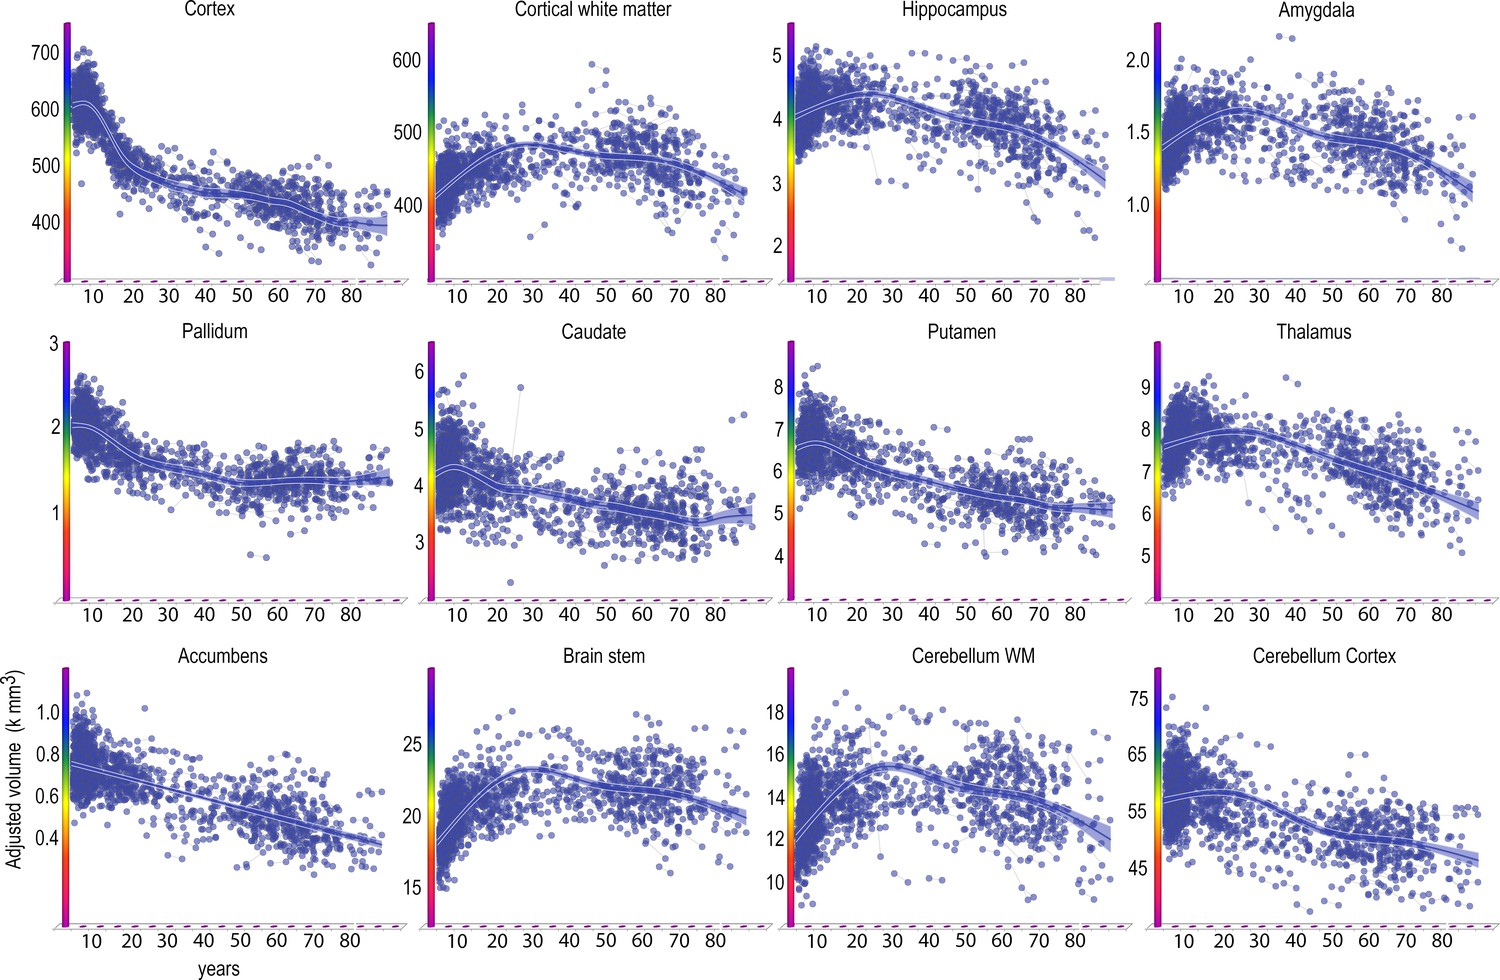
Lifespan trajectories of brain volumes.
Age on the x-axis, volume in units of milliliters on the y-axis. The trajectories are fitted with GAMM, using both longitudinal and cross-sectional data, and the shaded areas represent 95% CI. Y-axis is in units of 1000 mm3. Ventricular volumes not shown.
Tables
Table 1
Sample overview.
| Sample | N | N longitudinal | Observations | Age Mean (range) | Sex Female/Male | Interval years Mean (range) |
|---|---|---|---|---|---|---|
| LCBC | 974 | 635 | 1633 | 25.8 (4.1–88.5) | 508/466 | 2.3 (0.2–6.6) |
| VETSA* | 331 | 331 | 662 | 56.3 (2.6) | 0/331 | 5.5 (0.5) |
| Lifebrainx | 756 | 756 | 1512 | 59.0 (19.3–89.0) | 330/426 | 2.2 (0.3–4.6) |
| UKB | 38,127 | na | 38,127 | 63.6 (44–81) | 20,026/18,101 | na |
| UKB long | 1337 | 1337 | 2674 | 62.5 (46–80) | 663/674 | 2.3 (2–3) |
-
*75 complete monozygote (MZ)/53 complete dizygote (DZ) pairs of male twins.
xNot including LCBC.
Table 2
The embryonic origins of the clusters and placement along the cranial vertical axis.
| Brain structure | Cluster | Embryonic development | Cranial vertical axis | ||
|---|---|---|---|---|---|
| Third ventricle | 1 | Prosencephalon (posterior) | Diencephalon | ||
| Fourth ventricle | 1 | Rhombencephalon | |||
| Lat ventricle | 1 | Prosencephalon (anterior) | Telencephalon | ||
| Inf lateral ventricle | 1 | ||||
| Brainstem (medulla oblongata) | 2 | Rhombencephalon | Myelencephalon | 0 | |
| Cerebellum cortex | 2 | Rhombencephalon | Metencephalon | 1 | |
| Cerebellum WM | 2 | Rhombencephalon | Metencephalon | 1 | |
| Thalamus | 2 | Prosencephalon (posterior) | Diencephalon | 2 | |
| Hippocampus | 2 | Prosencephalon (anterior) | Telencephalon (dorsal) | Pallium (medial) | 4 |
| Cortical WM | 2 | Prosencephalon (anterior) | Forebrain WM | ||
| Caudate | 4 | Prosencephalon (anterior) | Telencephalon (ventral) | Subpallium | 3 |
| Pallidum | 5 | Prosencephalon (anterior) | Telencephalon (ventral) | Subpallium | 3 |
| Putamen | 3 | Prosencephalon (anterior) | Telencephalon (ventral) | Subpallium | 3 |
| Accumbens | 3 | Prosencephalon (anterior) | Telencephalon (ventral) | Subpallium | 3 |
| Amygdala | 3 | Prosencephalon (anterior) | Telencephalon (dorsal) | Pallium (lateral) | 4 |
| Cortex | 3 | Prosencephalon (anterior) | Telencephalon (dorsal) | Pallium (dorsal) | 4 |
Table 3
Cluster age trajectories.
Numeric results for the trajectory analyses in Figure 4. Edf: effective degrees of freedom (signifying the complexity of the trajectory, where the value two approximates a quadratic shape, 3 a cubic shape, etc). The p-value is associated with the null hypothesis that there is no relationship to age.
| Development | Adulthood and aging | Lifespan | |||||||
|---|---|---|---|---|---|---|---|---|---|
| Edf | F | p | Edf | F | p | Edf | F | p | |
| Cluster 1 | 1.1 | 51.0 | 0.23e−12 | 6.0 | 67.1 | 2e−16 | 7.5 | 176.6 | 2e−16 |
| Cluster 2 | 6.5 | 363.5 | 2e−16 | 6.8 | 16.0 | 2e−16 | 8.7 | 214.3 | 2e−16 |
| Cluster 3 | 5.4 | 37.4 | 2e−16 | 6.7 | 85.5 | 2e−16 | 8.6 | 206.7 | 2e−16 |
| Cluster 4 | 5.7 | 18.1 | 2e−16 | 1.0 | 79.4 | 2e−16 | 8.3 | 45.9 | 2e−16 |
| Cluster 5 | 3.7 | 16.9 | 3.33e−12 | 3.8 | 15.8 | 1.23e−11 | 7.9 | 171.0 | 2e−16 |
Table 4
Generalized additive mixed model fits LCBC lifespan.
Generalized additive mixed models (GAMM) were run with each neuroanatomical volume as dependent variable, and age, estimated total intracranial volume, and sex as covariates. Separate models were run with a linear age (age) term or a slope function (s(Age)). Except for cortex and caudate, the slope function yielded the lowest IC values. GM: Gray matter. WM: White matter. AIC: Akaike information criterion. BIC: Bayesian information criterion.
| AIC | BIC | Effect of sex | |||
|---|---|---|---|---|---|
| Age | S(Age) | Age | S(Age) | p | |
| Accumbens | 18,324 | 18,335 | 18,357 | 18,367 | 0.57 |
| Amygdala | 20,360 | 20,048 | 20,392 | 20,081 | 0.13 |
| Brainstem | 27,514 | 26,805 | 27,546 | 26,837 | 0.11 |
| Caudate | 22,636 | 23,558 | 22,669 | 23,591 | 0.75 |
| Cerebellum cortex | 30,079 | 29,946 | 30,111 | 29,979 | 0.94 |
| Cerebellum WM | 27,430 | 27,017 | 27,463 | 27,050 | 0.16 |
| Cortex | 37,525 | 37,895 | 37,557 | 37,927 | 0.72 |
| Cortical WM | 36847 | 36,258 | 36,879 | 36,290 | 0.31 |
| Hippocampus | 22,494 | 22,235 | 22,526 | 22,268 | 0.22 |
| Pallidum | 20,937 | 20,741 | 20,969 | 20,774 | 0.17 |
| Thalamus | 23,841 | 23,669 | 23,874 | 23,701 | 0.06 |
| Total GM | 38,130 | 37,849 | 38,163 | 37,881 | 0.78 |
| Lateral ventricles | 30,276 | 30,147 | 30,308 | 30,174 | 0.33 |
| In flat vent | 21,081 | 20,931 | 21,113 | 20,964 | 0.23 |
Table 5
Within- vs. outside cluster correlations.
Two-sample Student’s t-tests were run to test whether the mean correlation within the developmentally defined clusters (ri) was larger than the mean correlation between the variables in the cluster and the variables outside the cluster (re). Note that the clusters were defined in the developmental sample, which is independent from the other four samples.
| Cluster 1 | Cluster 2 | Cluster 3 | |||||||
|---|---|---|---|---|---|---|---|---|---|
| Dataset | ri | re | p< | ri | re | p< | ri | re | p< |
| UKB cross-sectional | 0.52 | −0.10 | 1e−8 | 0.30 | 0.05 | 1e−7 | 0.28 | 0.06 | 9e−7 |
| VETSA (TWIN heritability) | 0.57 | −0.11 | 1e−8 | 0.40 | −0.05 | 3e−7 | 0.16 | −0.02 | 0.17 |
| Lifebrain (Aging) | 0.47 | −0.16 | 1e−8 | 0.14 | −0.05 | 0.0002 | 0.14 | −0.01 | 0.004 |
| LCBC (Aging) | 0.45 | −0.20 | 1e−8 | 0.30 | −0.06 | 1e−8 | 0.28 | 0.05 | 1e−7 |
-
ri: intra-cluster correlation. re: extra-cluster correlation.
Table 6
Scanner and acquisition parameters.
| Sample | Scanner | Field strength (Tesla) | Sequence parameters |
|---|---|---|---|
| LCBC | Avanto Siemens | 1.5 | TR: 2400 ms, TE: 3.61 ms, TI: 1000 ms, flip angle: 8°, slice thickness: 1.2 mm, FoV: 240 × 240 m, 160 slices, iPat = 2 |
| Avanto Siemens | 1.5 | TR: 2400 ms, TE = 3.79 ms, TI = 1000 ms, flip angle = 8, slice thickness: 1.2 mm, FoV: 240 × 240 mm, 160 slices | |
| Barcelona | Tim Trio Siemens | 3.0 | TR: 2300 ms, TE: 2.98, TI: 900 ms, slice thickness 1 mm, flip angle: 9°, FoV: 256 × 256 mm, 240 slices |
| BASE-II | Tim Trio Siemens | 3.0 | TR: 2500 ms, TE: 4.77 ms, TI: 1100 ms, flip angle: 7°, slice thickness: 1.0 mm, FoV: 256 × 256 mm, 176 slices |
| Betula | Discovery GE | 3.0 | TR: 8.19 ms, TE: 3.2 ms, TI: 450 ms, flip angle: 12°, slice thickness: 1 mm, FoV: 250 × 250 mm, 180 slices |
| Cam-CAN | Tim Trio Siemens | 3.0 | TR: 2250 ms, TE: 2.98 ms, TI: 900 ms, flip angle: 9°, slice thickness 1 mm, FoV: 256 × 240 mm, 192 slices |
| UKB | Skyra Siemens | 3.0 | TR: 2000 ms, TI: 880 ms, slice thickness: 1 mm, FoV: 208 × 256 mm, 256 slices, iPAT = 2 |
| VETSA baseline | Siemens | 1.5 | TR = 2730ms, TI = 1000 ms, TE = 3.31ms, slice thickness = 1.33 mm, flip angle = 7°, voxel size 1.3 × 1.0 × 1.3 mm. Acquisition in Boston and San Diego. |
| VETSA follow-up (Boston) | Siemens Tim Trio | 3.0 | TE = 4.33 ms, TR = 2170 ms, TI = 1100 ms, flip angle = 7°, pixel bandwidth = 140, number of slices = 160, slice thickness = 1.2 mm. Acquisition in Boston. |
| VETSA follow-up (San Diego) | GE Discovery 750x | 3.0 | TE = 3.164 ms, TR = 8.084 ms, TI = 600 ms, flip angle = 8°, pixel bandwidth = 244.141, FoV = 24 cm, frequency = 256, phase = 192, number of slices = 172, slice thickness = 1.2 mm. Acquisition in San Diego. |
-
TR: Repetition time, TE: Echo time, TI: Inversion time, FoV: Field of View, iPat: in-plane acceleration.
Additional files
-
Source code 1
Statistical source code.
- https://cdn.elifesciences.org/articles/66466/elife-66466-code1-v2.zip
-
Supplementary file 1
Supplementary results.
- https://cdn.elifesciences.org/articles/66466/elife-66466-supp1-v2.docx
-
Transparent reporting form
- https://cdn.elifesciences.org/articles/66466/elife-66466-transrepform-v2.docx
Download links
A two-part list of links to download the article, or parts of the article, in various formats.
Downloads (link to download the article as PDF)
Open citations (links to open the citations from this article in various online reference manager services)
Cite this article (links to download the citations from this article in formats compatible with various reference manager tools)
The genetic organization of longitudinal subcortical volumetric change is stable throughout the lifespan
eLife 10:e66466.
https://doi.org/10.7554/eLife.66466


