Ankyrin-R regulates fast-spiking interneuron excitability through perineuronal nets and Kv3.1b K+ channels
- Department of Neuroscience, Baylor College of Medicine, United States
- Program in Developmental Biology, Baylor College of Medicine, United States
- The Cain Foundation Laboratories, Jan and Dan Duncan Neurological Research Institute at Texas Children’s Hospital, United States
- Department of Pathology and Genomic Medicine, Houston Methodist Hospital, United States
- Department of Pharmaceutical Chemistry, University of California San Francisco, United States
- Department of Molecular and Human Genetics, Baylor College of Medicine, United States
Figures
Figure 1 with 1 supplement
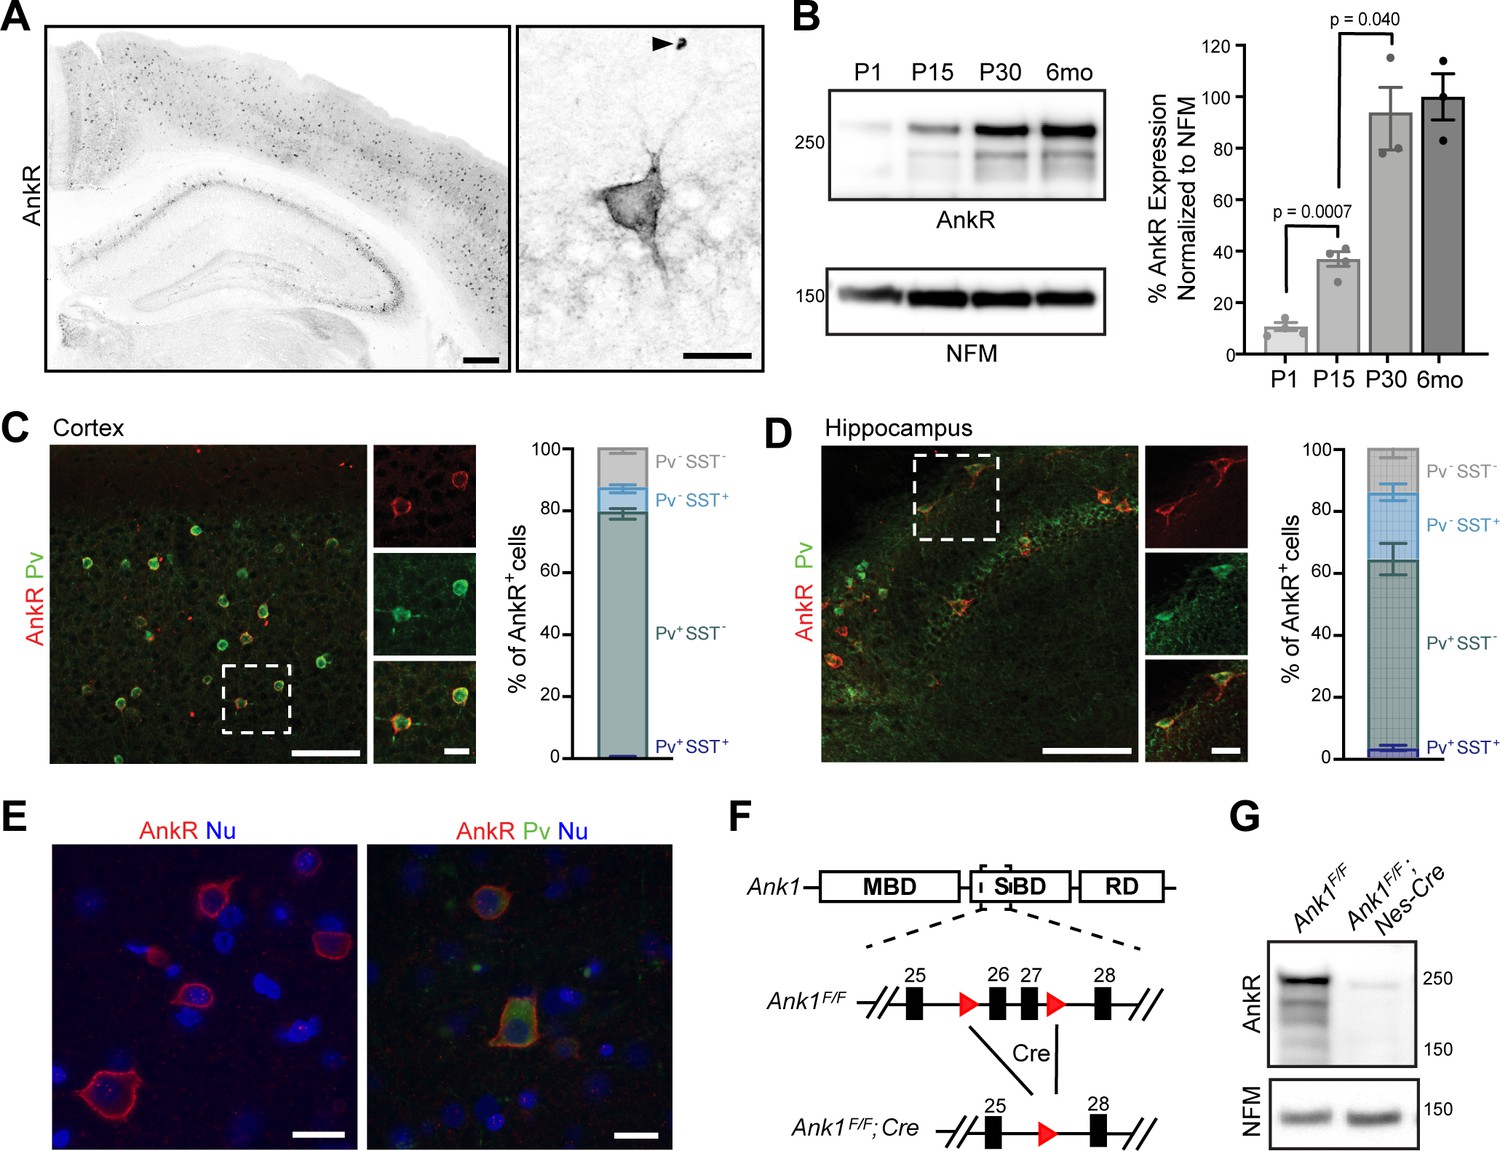
AnkR is expressed in select neurons in the cortex and hippocampus.
(A) Immunostaining of coronal mouse brain for AnkR. Arrowhead indicates a red blood cell. Scalebars, left, 250 μm, right, 20 µm. (B) Immunoblot of P1, P15, P30, and 6-month C57BL/6 brain homogenates for anti-AnkR and neurofilament-M (NFM). Quantification of immunoblot in ImageJ by comparison of AnkR to NFM loading control from three independent duplicate experiments; P1, P15 (N=four mice), P30, 6 months (N=three mice). Samples were normalized to NFM, then compared to 6-month animals. Statistical significance was determined by multiple unpaired t-tests with Welch correction and Holm-Šídák method for multiple comparisons. (C, D) Immunostaining for AnkR (red) and Parvalbumin (Pv, green) in 3-month cortex (C, N = three mice; n=923 cells) and hippocampus (D, N = three mice; n=342 cells). Scalebars, 50 µm; inset, 10 µm. (E) Immunostaining of human cortex for AnkR (red) and Parvalbumin (green). Nuclei are labeled using DAPI (blue). Scalebars, 20 µm. (F) Schematic of the Ank1 conditional allele. loxP sites (red triangles) flank exons 26 and 27 in the spectrin-binding domain (SBD), after the membrane-binding domain (MBD) and before the regulatory domain (RD). Cre-mediated recombination and removal of exons 26 and 27 generates a premature stop codon in exon 28. (G) Immunoblot of brain homogenates for anti-AnkR, and Neurofilament-M. Molecular weights are indicated at right in kDa. All error bars indicate mean ± SEM.
-
Figure 1—source data 1
Source data related to Figure 1 .
- https://cdn.elifesciences.org/articles/66491/elife-66491-fig1-data1-v2.xlsx
Figure 1—figure supplement 1
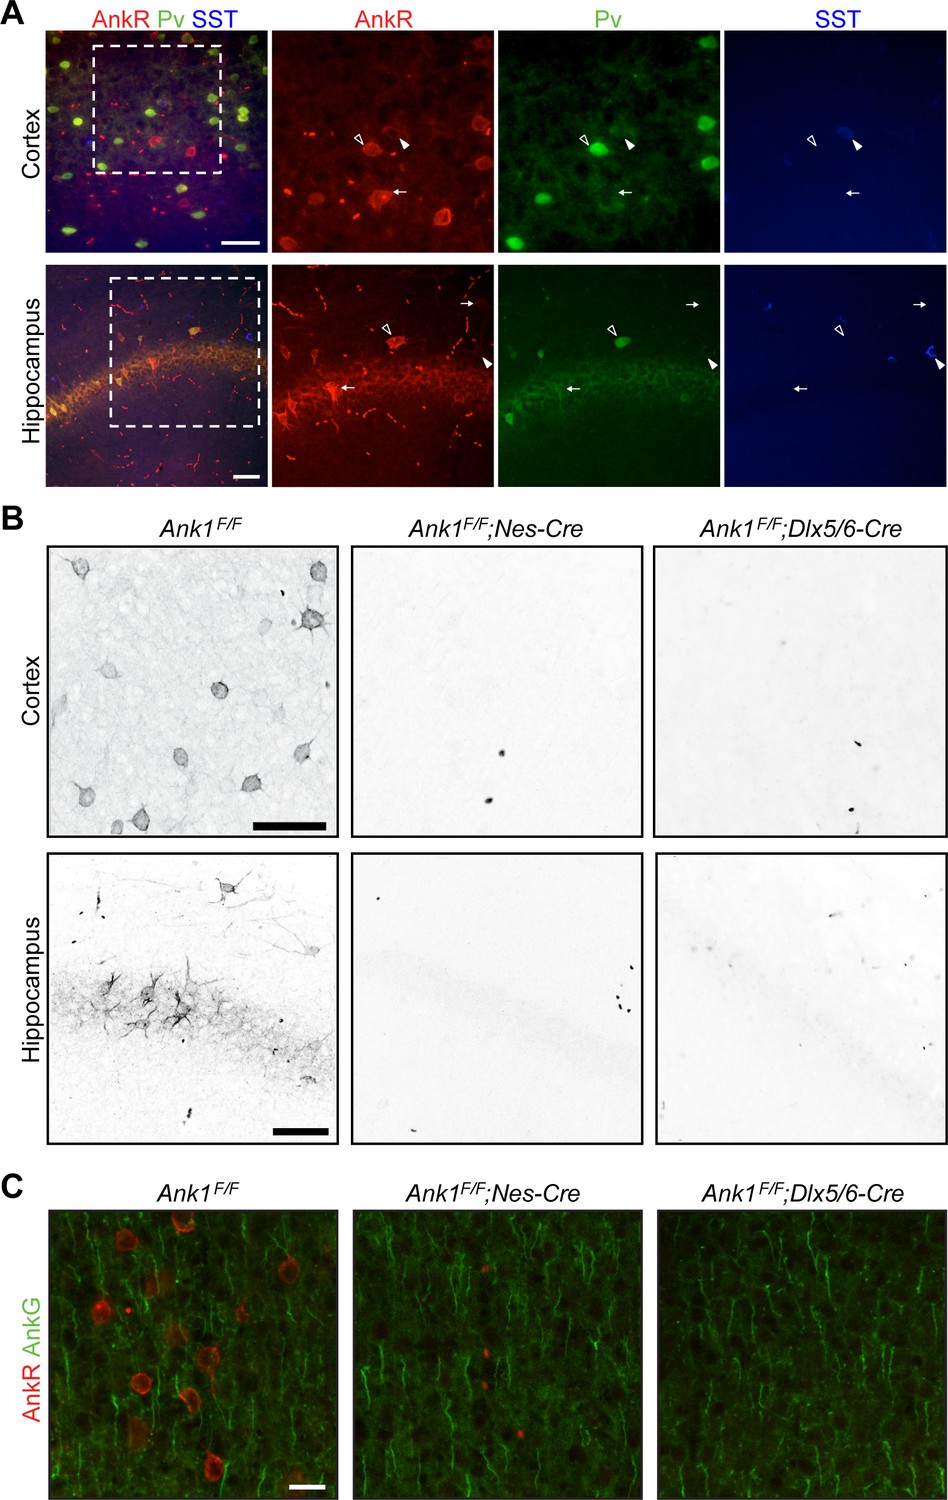
AnkR immunostaining in control and Ank1 conditional knockout mice.
(A) Immunostaining of cortex (top) and hippocampus (bottom) for AnkR (red), Parvalbumin (Pv, green), and Somatostatin (SST, blue). Outlined arrowheads illustrate AnkR+Pv+ cells, solid arrowheads illustrate AnkR+SST+ cells, and white arrows show AnkR+Pv-SST- cells. Scalebars, 50 µm. (B) Immunostaining of cortex (top) and hippocampus (bottom) in mice with the indicated genotypes. Scalebars, 50 µm. (C) Immunostaining of cortex for AnkR (red) and AnkG (green) in the indicated genotypes. Scalebars, 20 µm.
Figure 2 with 1 supplement
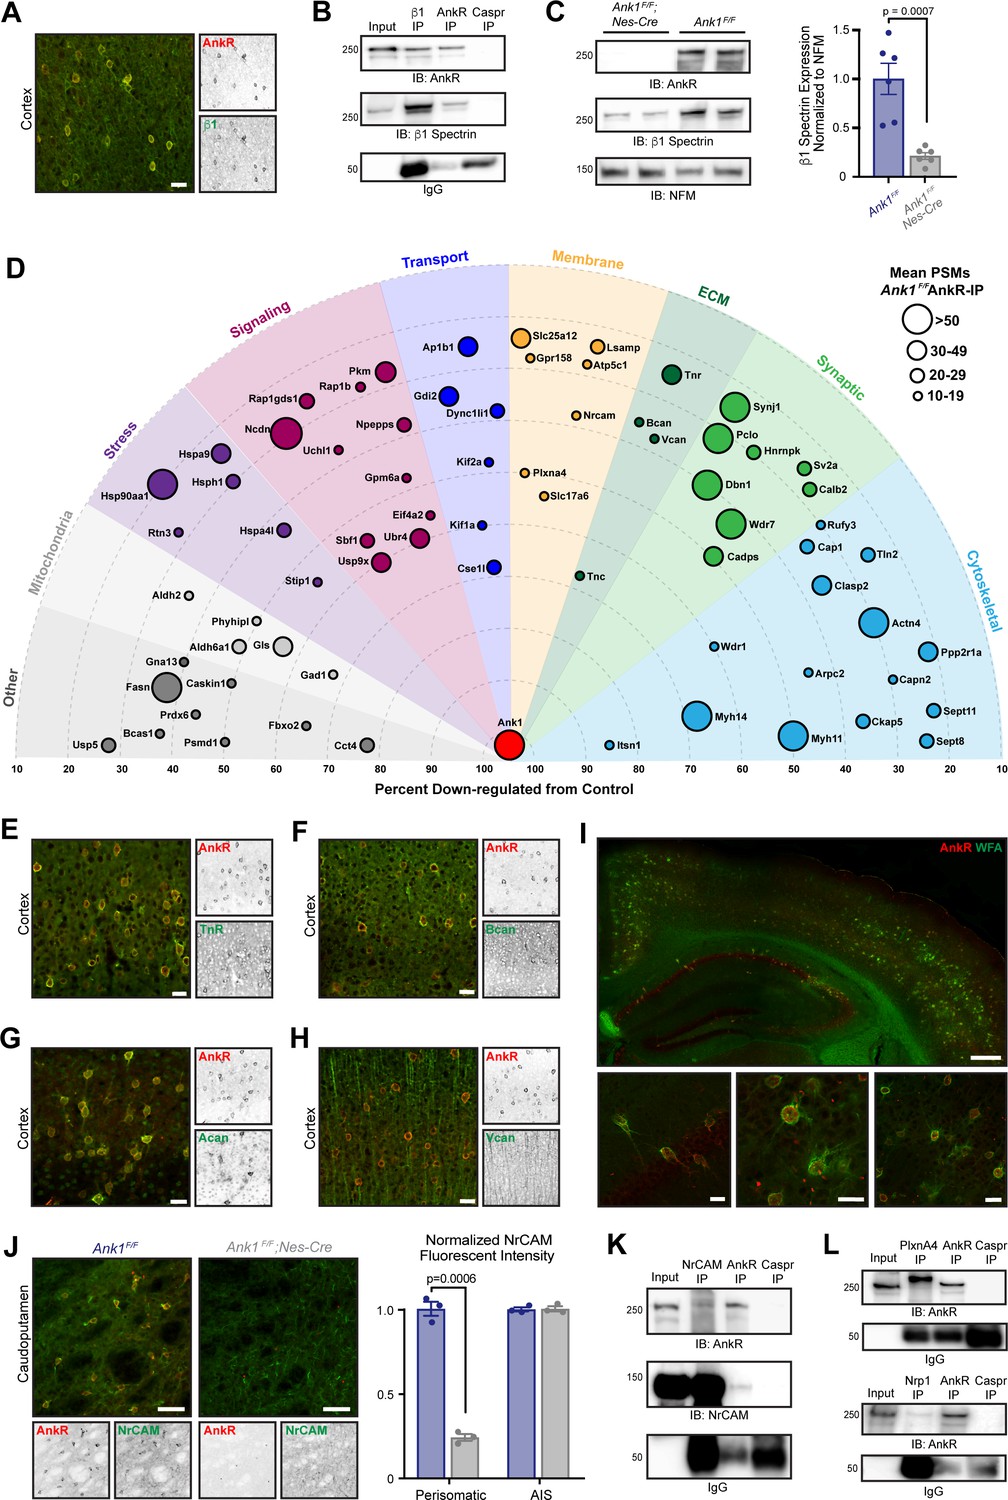
AnkR interacting proteins.
(A) Immunostaining of mouse cortex using antibodies against AnkR (red) and β1 spectrin (green). Scalebar, 20 µm. (B) Immunoblot of β1 spectrin, AnkR, and IgG immunoprecipitation reactions using antibodies against AnkR and β1 spectrin. IP, immunoprecipitation; IB, immunoblot. (C) Immunoblot of control and AnkR-deficient mouse brains using antibodies against β1 spectrin, AnkR, and neurofilament-M (NFM). Quantification of the β1 spectrin immunoblots normalized to NFM. Error bars indicate mean ± SEM. N=6. (D) Top AnkR-interacting candidates. Circle size corresponds to the mean PSM from IP mass spectrometry. Concentric circles radiating from Ank1 correspond to % reduction in PSMs from AnkR knockout mouse compared to control. Identified proteins are organized according to their putative functions. (E–H) Immunostaining of mouse cortex using antibodies against AnkR (red) and TnR (green, E), Bcan (green, F), Acan (green, G), and Vcan (green, H). Scalebars, 20 μm. (I) Immunostaining of mouse cortex and hippocampus using antibodies against AnkR (red) and fluorescent-labeled WFA (green). Scalebars, 250 µm (top) and 20 µm (bottom). (J) Immunostaining of control (left) and AnkR-deficient mouse brain (right) using antibodies against AnkR (red) and NrCAM (green). Scalebars, 50 µm. Normalized fluorescence intensity of perisomatic and axon initial segment (AIS) NrCAM in Ank1F/F (blue) and Ank1F/F;Nes-Cre (gray). Error bars indicate mean ± SEM. N=3. (K) Immunoblot of NrCAM, AnkR, and IgG immunoprecipitation reactions using antibodies against AnkR (top) and NrCAM (bottom). (L) Immunoblot of PlexinA4, AnkR, and IgG immunoprecipitation reactions using antibodies against AnkR (top). Immunoblot of Nrp1, AnkR, and IgG immunoprecipitation reactions using antibodies against AnkR (bottom).
-
Figure 2—source data 1
Source data realted to Figure 2 .
- https://cdn.elifesciences.org/articles/66491/elife-66491-fig2-data1-v2.xlsx
Figure 2—figure supplement 1
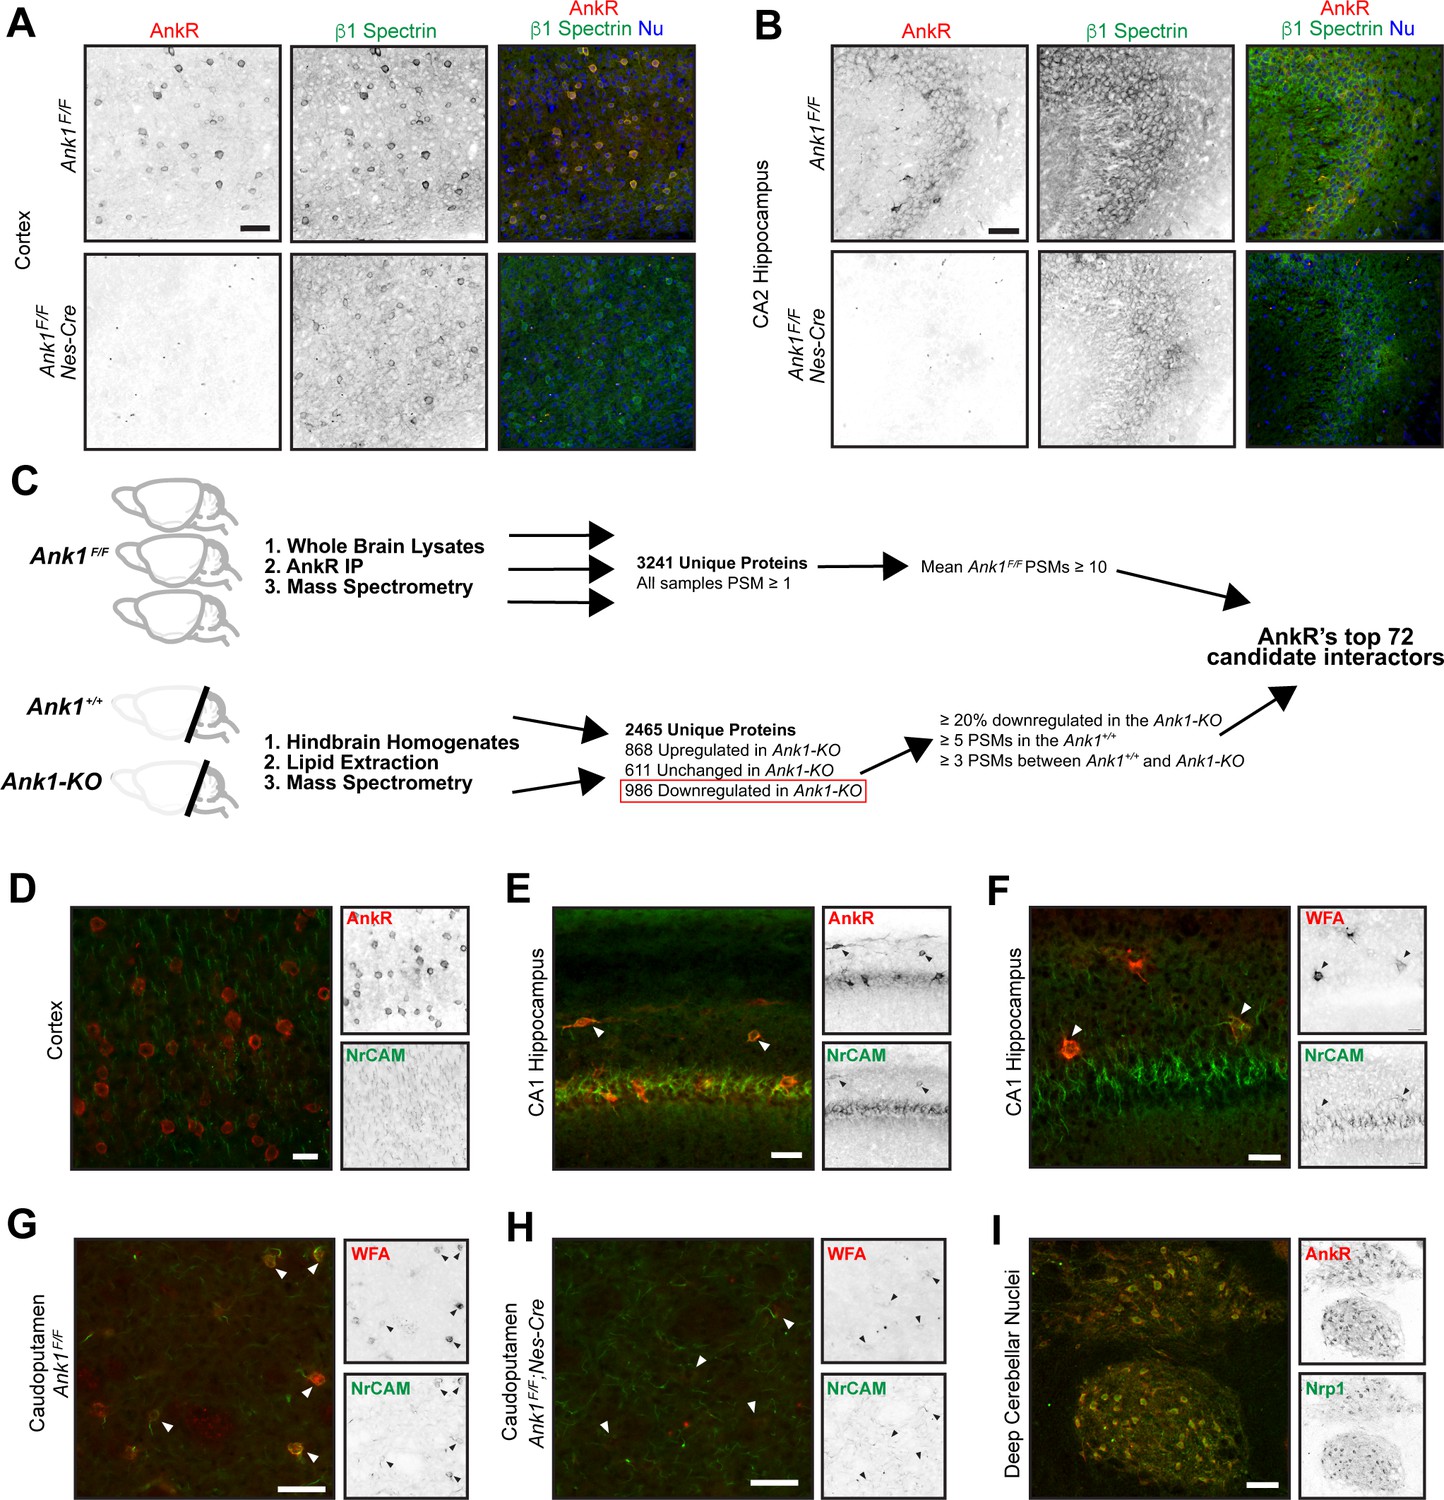
AnkR interacting proteins.
(A, B) Immunostaining of cortex (A) and hippocampus (B) in control and AnkR-deficient mouse brain using antibodies against AnkR (red), β1 spectrin (green), and the nuclear marker Hoechst. Scale bars, 50 µm. (C) Proteomics strategy to identify AnkR-interacting proteins. PSM, peptide spectral match. (D, E) Immunostaining of cortex (D) and hippocampus (E) using antibodies against AnkR (red) and NrCAM (green). Arrowheads in (E) indicate AnkR+/NrCAM+ neurons. Scalebars, 20 µm (D), 50 μm (E). (F) Immunofluorescence of hippocampus using fluorescent WFA (red) and antibodies against NrCAM (green). Arrowheads indicate WFA+ neurons. Scalebar, 25 µm. (G, H) Immunostaining of caudoputamen in control and AnkR-deficient mouse brain using fluorescent WFA (red) and antibodies against NrCAM (green). Arrowheads indicate WFA+ neurons. Scalebars, 50 µm. (I) Staining of deep cerebellar nuclei using antibodies against Nrp1 (green) and AnkR (red). Scalebar, 100 µm.
Figure 3 with 2 supplements
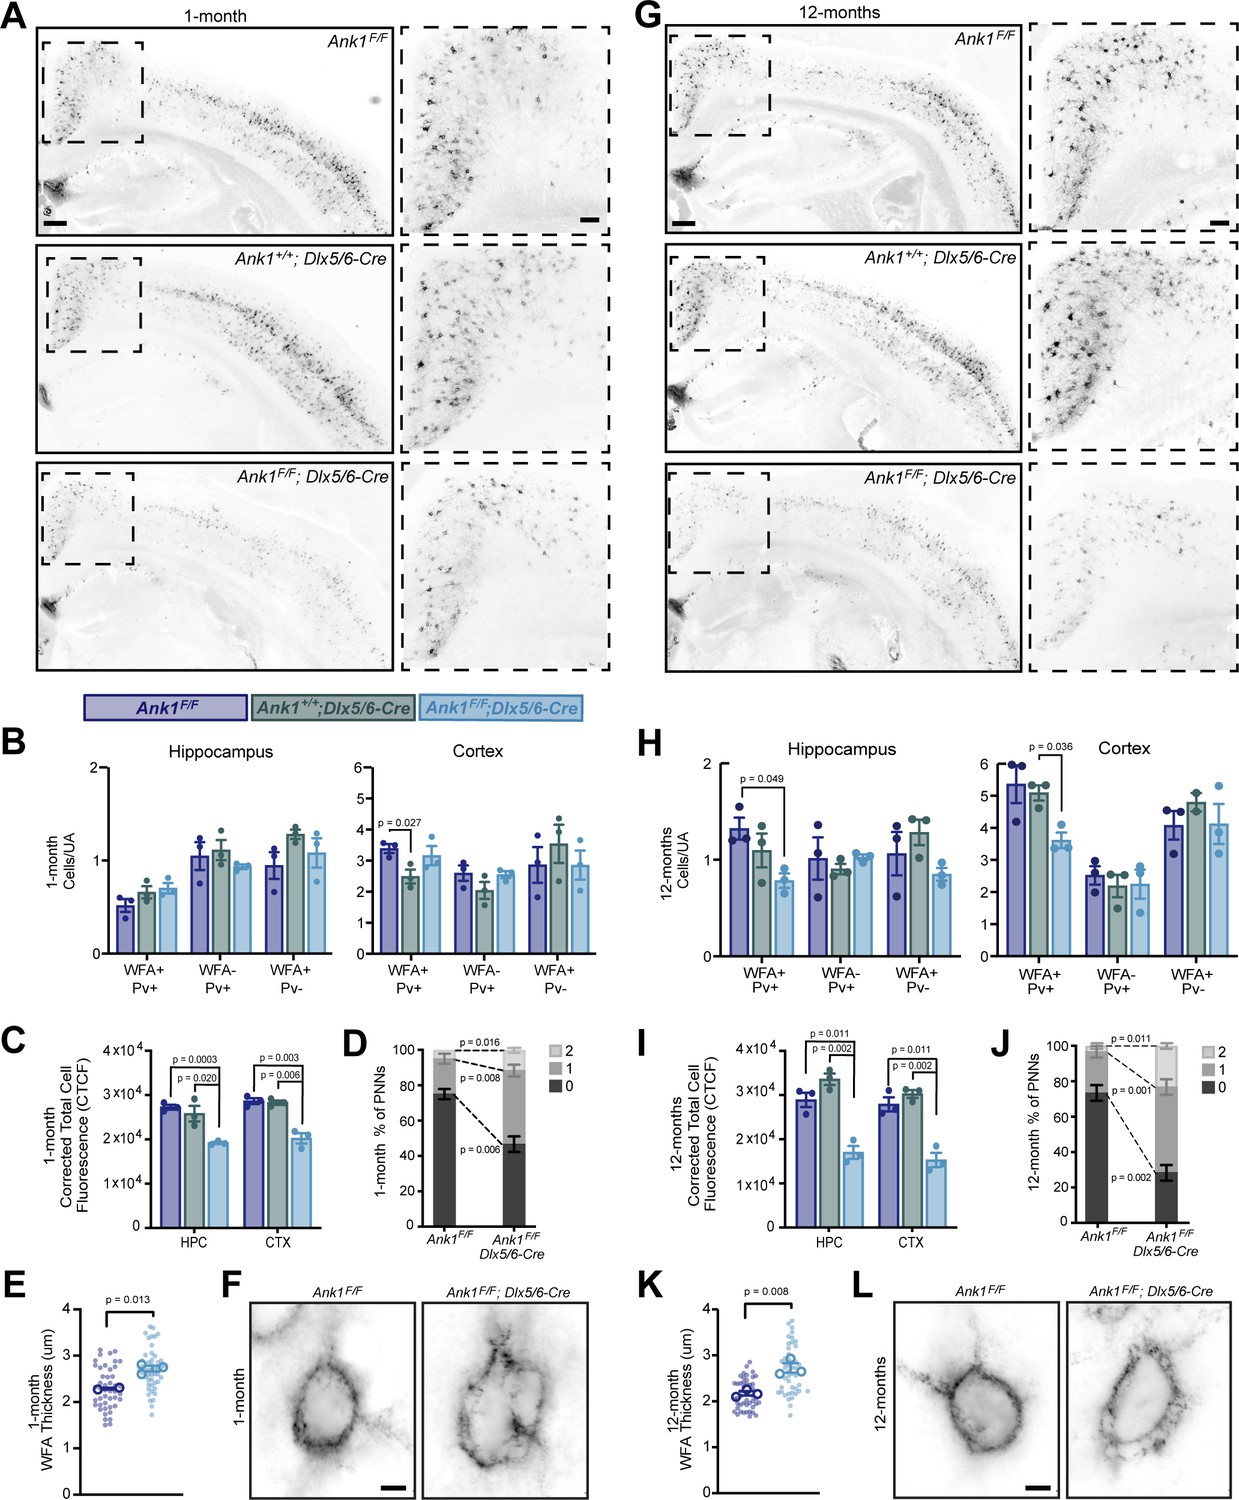
AnkR maintains perineuronal net density and structure.
(A) Fluorescent WFA labeling of PNNs in coronal sections of cortex and hippocampus in one-month-old mice. Genotypes of the respective mice are indicated. Boxed regions are shown to the right. Scalebars, 250 µm and 100 µm. (B) Quantification of colocalization between WFA and Pv labeling per unit area (UA) in hippocampus and cortex. N=three mice/group. (C) Corrected total cell fluorescence (CTCF) in hippocampus (HPC) and cortex (CTX). N=three mice/group, n=230 cells/animal. (D) Semi-quantitative analysis of high magnification WFA showing increased hole size and disruption of PNNs in retrosplenial (RSP) cortex of 1-month mice. N=three mice/group, n=20 cells/animal. (E) Analysis of high-magnification WFA showing increased thickness of WFA and disruption of PNNs in somatosensory cortex of 1-month mice; Ank1F/F (N=two mice; n=45 cells), Ank1F/F; Dlx5/6-Cre (N=three mice; n=51 cells). Small solid dots indicate individual cells, large open dots indicate animal means. Error bars indicate mean ± SEM. (F) Fluorescent WFA label of PNNs in RSP cortex of 1-month-old mice. Genotypes of the respective mice are indicated. Scalebars, 5 µm. (G) Fluorescent WFA labeling of PNNs in coronal sections of cortex and hippocampus in 12-month-old mice. Genotypes of the respective mice are indicated. Boxed regions are shown to the right. Scalebars, 250 µm and 100 µm. (H) Quantification of colocalization between WFA and Pv labeling per unit area (UA) in hippocampus and cortex. N=three mice/group. (I) CTCF in HPC and CTX. N=three mice/group, n=230 cells/animal. (J) Semi-quantitative analysis of high magnification WFA showing increased hole size and disruption of PNNs in RSP cortex of 12-month mice. N=three mice/group, n=20 cells/animal. (K) Analysis of high-magnification WFA showing increased thickness of WFA and disruption of PNNs in somatosensory cortex of 12 month mice; Ank1F/F (N=three mice; n=46 cells), Ank1F/F; Dlx5/6-Cre (N=three mice; n=45 cells). Small solid dots indicate individual cells, large open dots indicate animal means. Error bars indicate mean ± SEM. (L) Fluorescent WFA label of PNNs in RSP cortex of 12-month-old mice. Genotypes of the respective mice are indicated. Scalebars, 5 µm. Error bars indicate mean ± SEM. N=3/group.
-
Figure 3—source data 1
Source data related to Figure 3 .
- https://cdn.elifesciences.org/articles/66491/elife-66491-fig3-data1-v2.xlsx
Figure 3—figure supplement 1
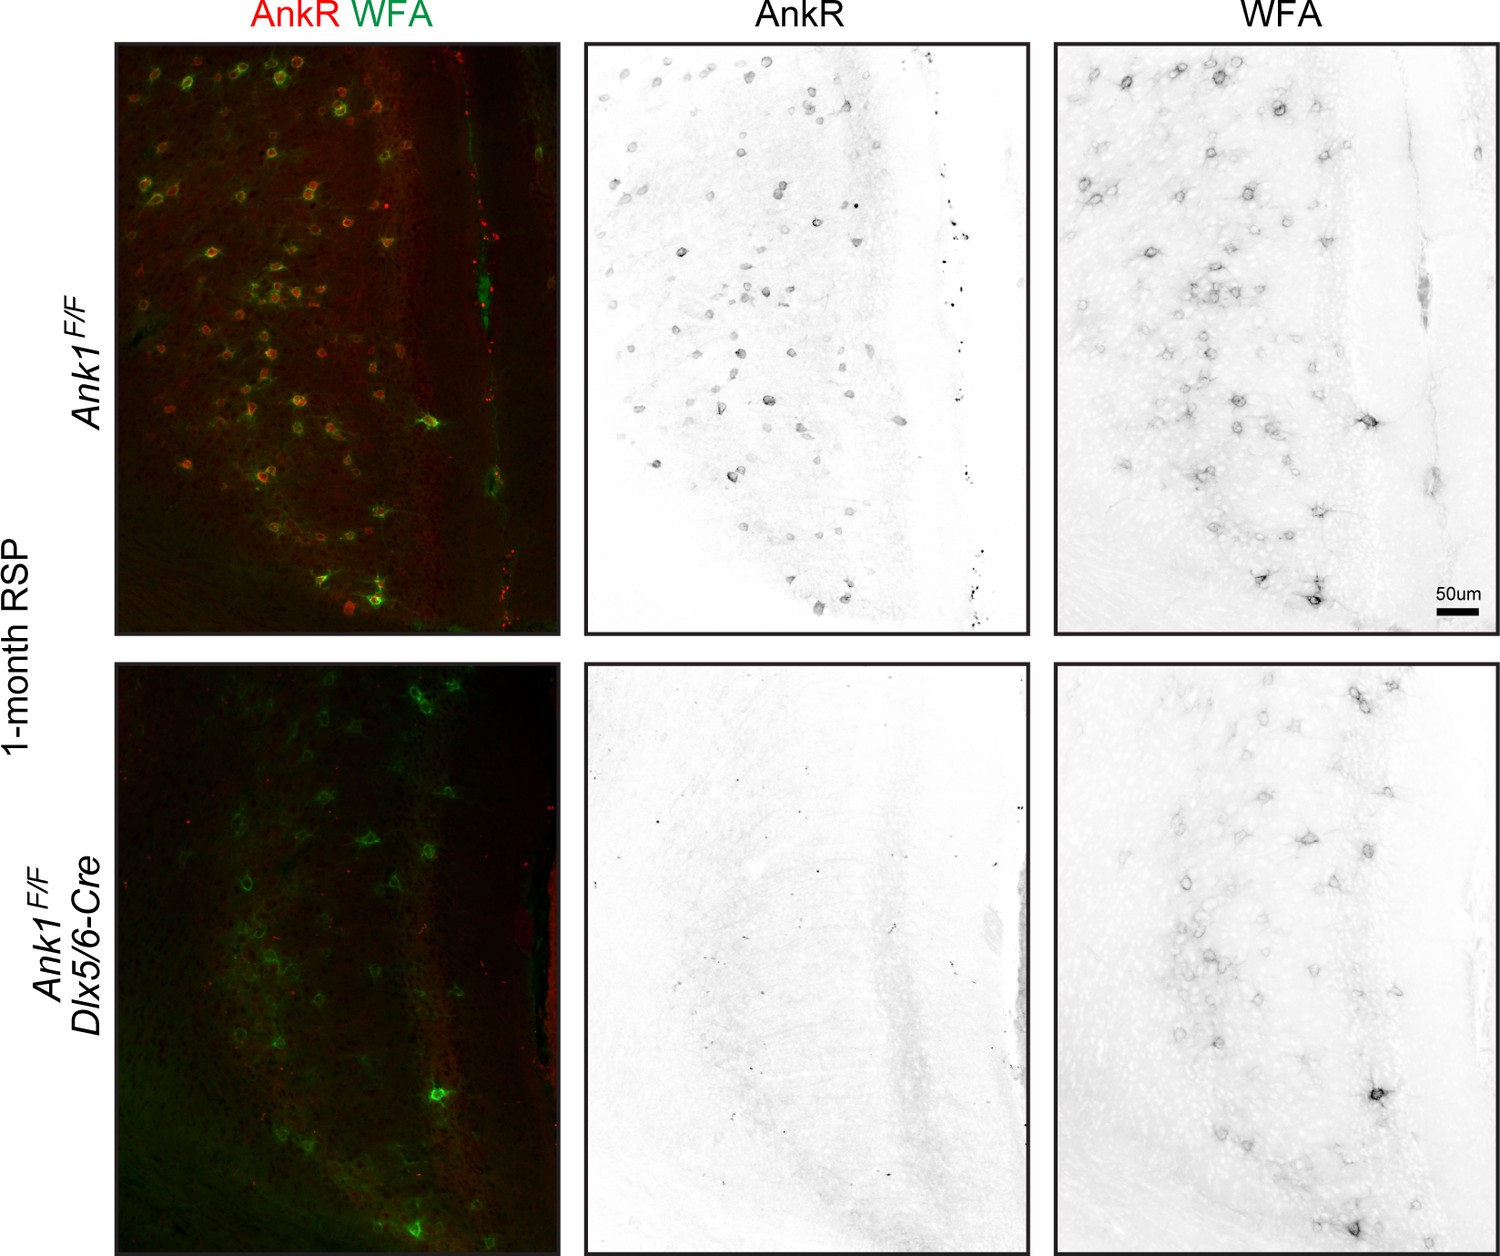
Labeling of control and AnkR cKO neurons in cortex using fluorescent WFA and antibodies against AnkR.
Scalebar, 50 μm.
Figure 3—figure supplement 2
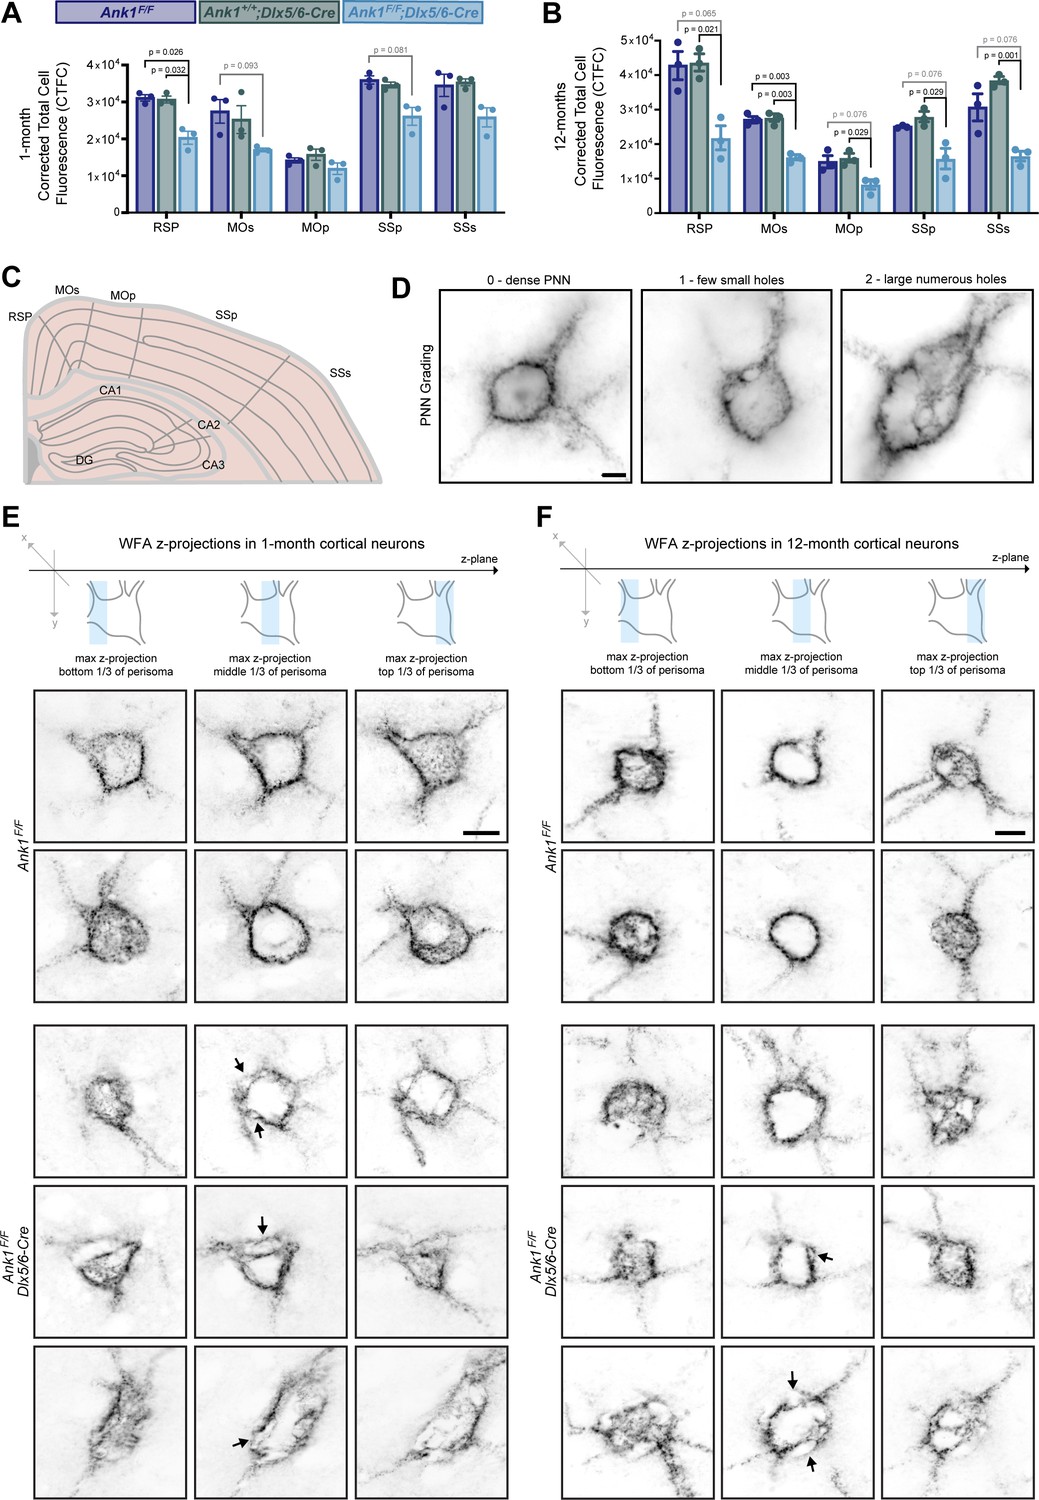
WFA labeling is reduced across cortical regions.
(A, B) Corrected Total Cell Fluorescence (CTCF) across cortical regions at one- and 12 months of age. RSP, retrosplenial cortex; MOp, primary motor cortex; MOs, secondary motor cortex; SSp, primary somatosensory cortex; SSs, secondary somatosensory cortex. Error bars indicate mean ± SEM. N=3/group. (C) Schematic of cortical regions where CTCF was measured. (D) WFA labeling of PNNs showing grading scale used for analysis in Figure 3D and J. Scalebar, 5 µm. (E) WFA labeling of PNNs in somatosensory cortex of 1-month mice. Scalebar, 10 um. (F) WFA labeling of PNNs in somatosensory cortex of 12-month mice. Scalebar, 10 um.
-
Figure 3—figure supplement 2—source data 1
Source data related to Figure 3—figure supplement 2 .
- https://cdn.elifesciences.org/articles/66491/elife-66491-fig3-figsupp2-data1-v2.xlsx
Figure 4 with 1 supplement
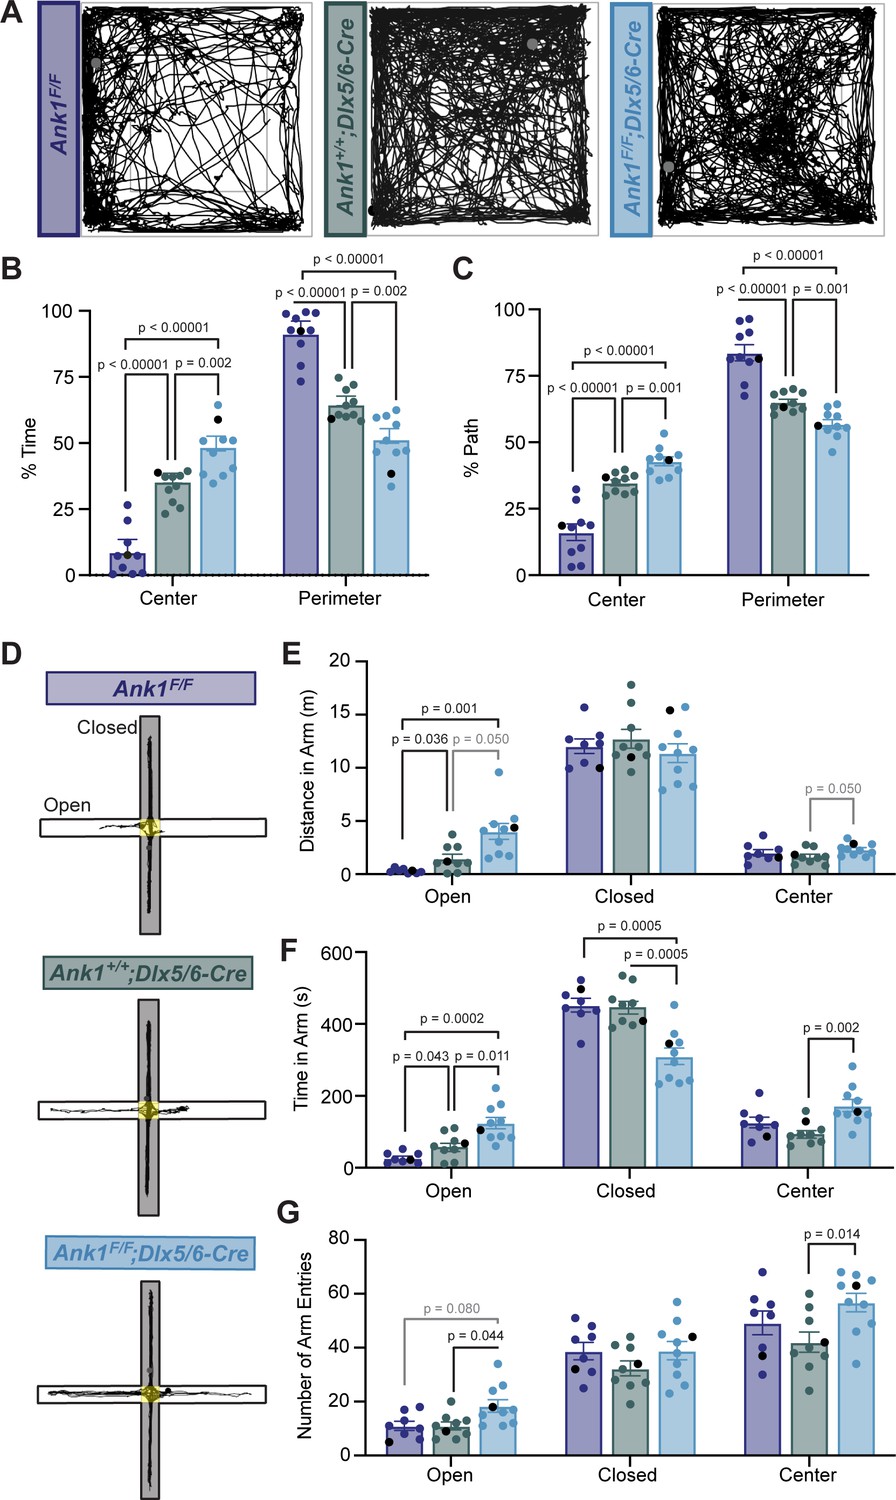
Mice lacking AnkR in GABAergic forebrain interneurons have reduced anxiety.
(A) Thirty min-long recordings of mouse trajectories in the open-field assay. Genotypes are indicated. (B) The percent of time spent in the center or perimeter of the open field. (C) The percent of the total path spent in the center or perimeter of the open field. (D) 10 minute-long recordings of mouse trajectories in the elevated plus maze. (E) The distance traveled in the open arm, closed arm, or the center of the elevated plus maze. (F) The time spent in the open arm, closed arm, or the center of the elevated plus maze. (G) The number of entries into the open arm, closed arm, or center of the elevated plus maze. In all panels, error bars indicate mean ± SEM. Black circles indicate the animals corresponding to the representative traces.
Figure 4—figure supplement 1
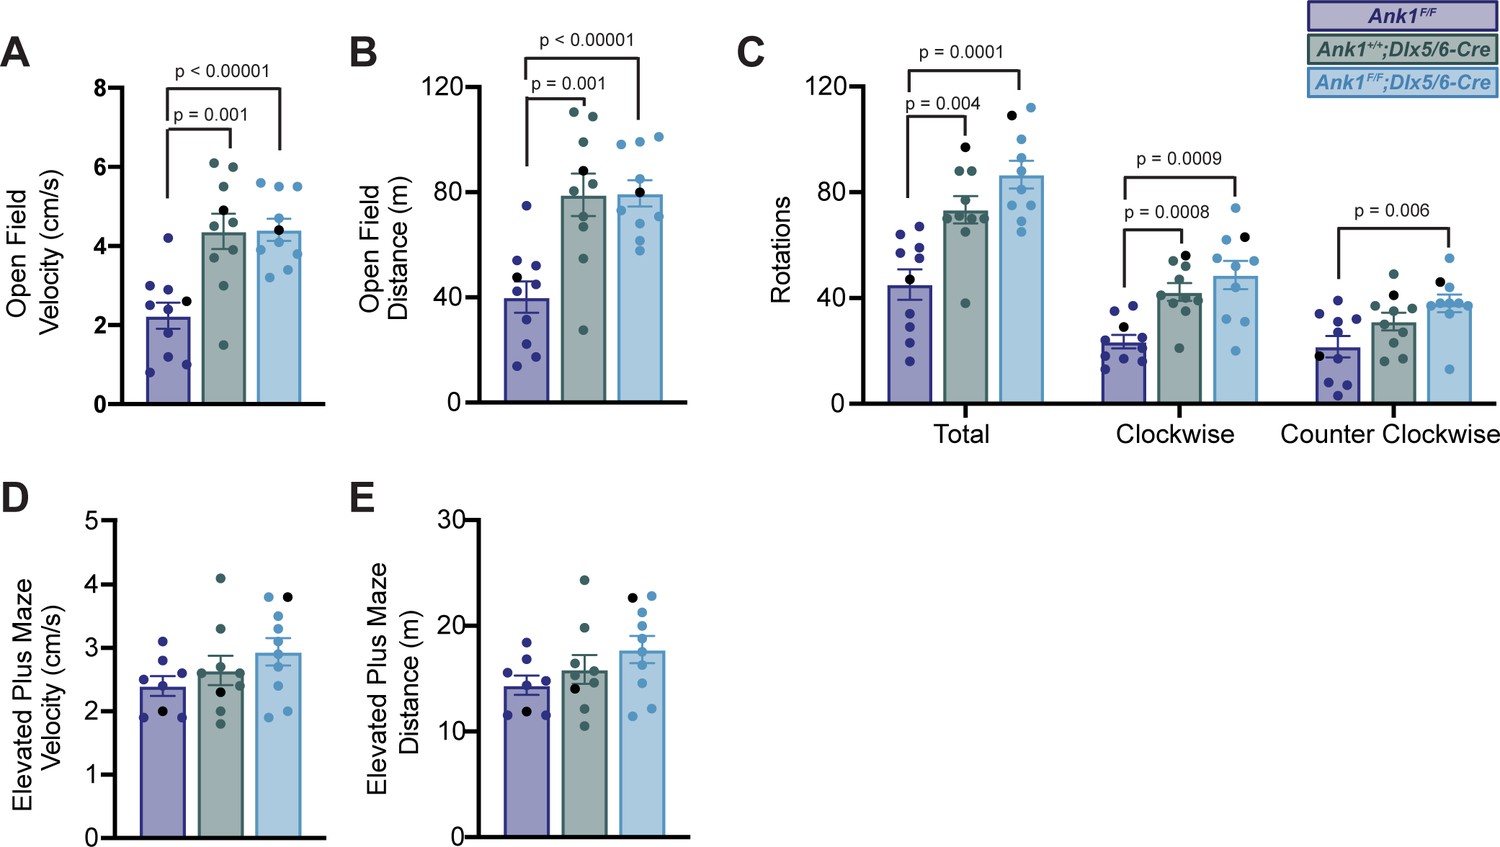
Quantification of open field and elevated plus maze assays.
(A–C) Measurements of velocity (A), distance traveled (B), and rotations (C) in the open field test. (D, E) Measurements of velocity (D) and distance (E) in the elevated plus maze assay. In all panels, error bars indicate mean ± SEM. Black circles indicate the animals corresponding to the representative traces in Figure 4.
Figure 5 with 2 supplements
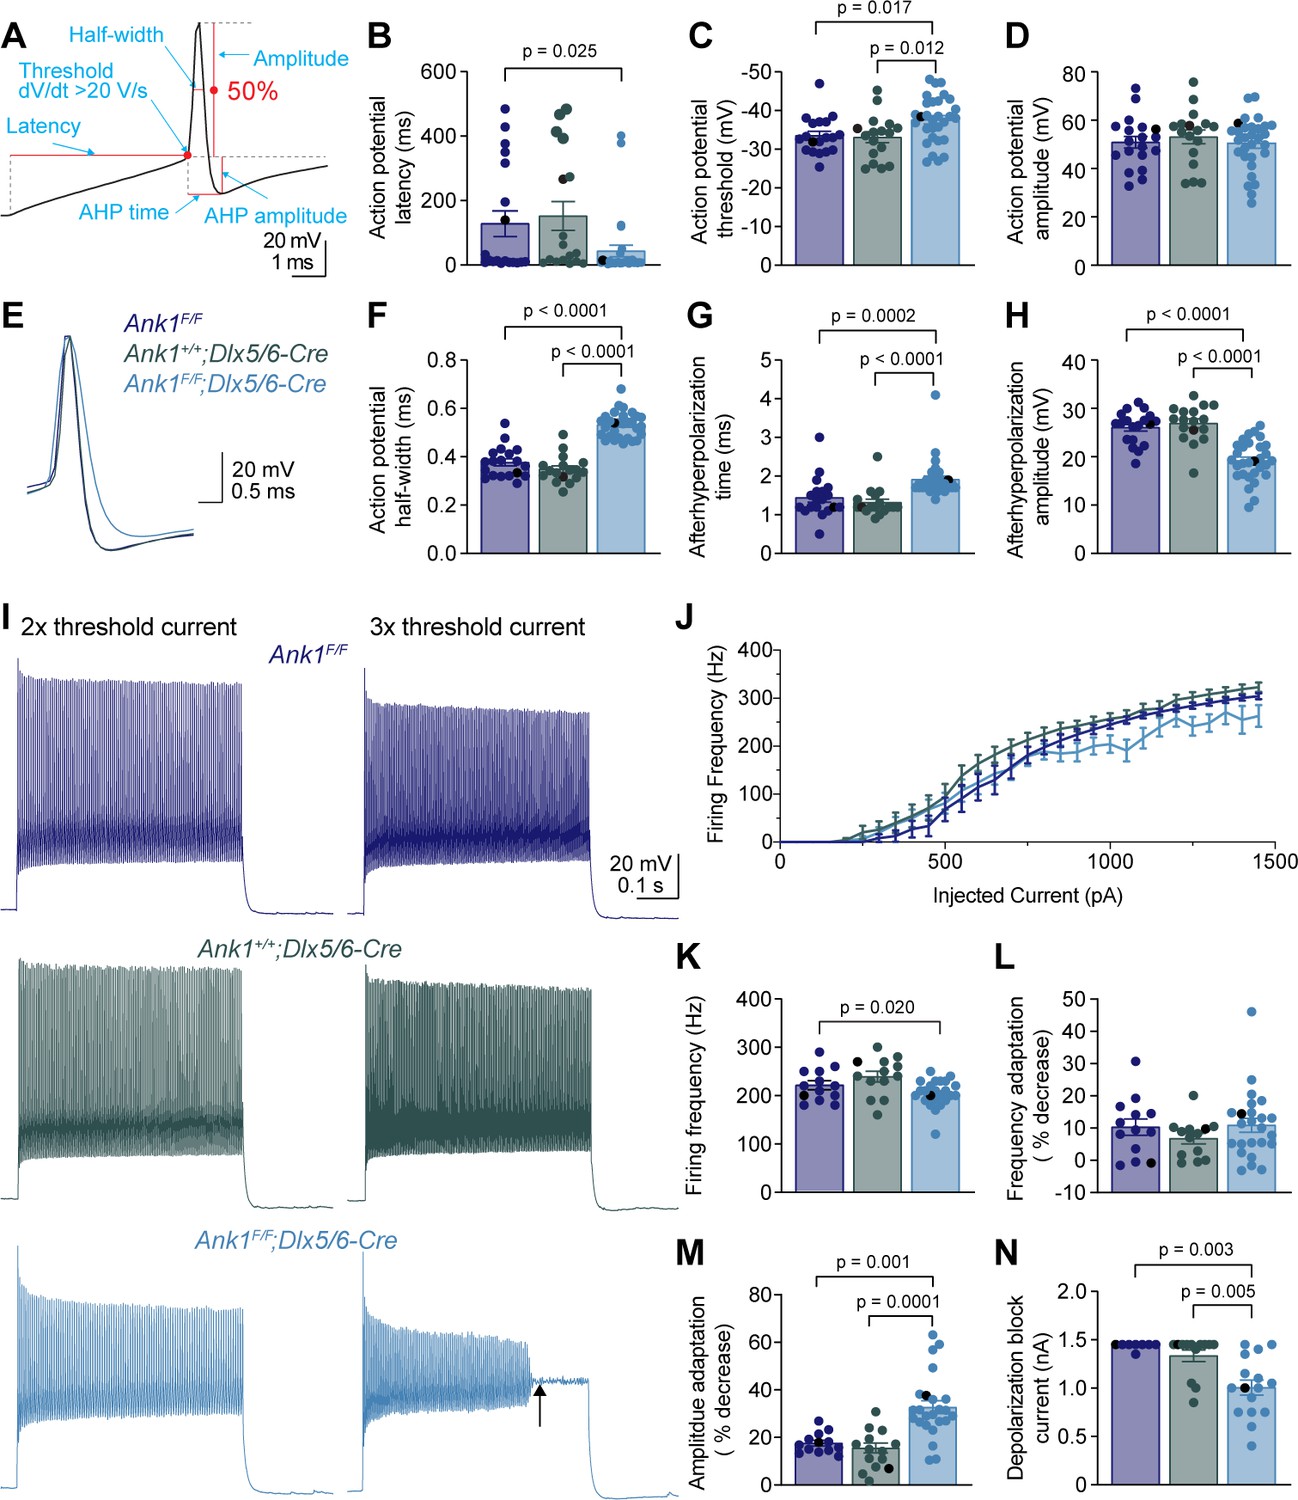
WFA+ neurons in Ank1F/F;Dlx5/6-Cre mice have abnormal action potentials and spike train characteristics.
(A) A representative action potential illustrating the measurement of action potential parameters. AHP, afterhyperpolarization. (B–D) Summary data showing the action potential latency (B), action potential threshold (C), and action potential amplitude (D) from the single action potential evoked by rheobase current. (E) Representative single action potentials evoked by rheobase currents from Ank1F/F, Ank1+/+;Dlx5/6-Cre, and Ank1F/F;Dlx5/6-Cre cells. Action potentials are aligned at 50% of the rising phase on X axis and peak on Y axis. Note the wider action potential with shallower and delayed afterhyperpolarization in Ank1F/F;Dlx5/6-Cre cell. (F–H) Summary data showing the action potential half-width (F), afterhyperpolarization time (G), and afterhyperpolarization amplitude (H) from the single action potentials evoked by rheobase currents. (I) Representative spike trains from Ank1f/f, Ank1+/+;Dlx5/6-Cre, and Ank1F/F;Dlx5/6-Cre cells in response to 500 ms current injection. Left and right traces show the spike trains evoked by currents that are two and three times of the action potential threshold currents, respectively. Note the strong amplitude adaptation and premature depolarization block indicated by the arrow in the right trace of Ank1F/F;Dlx5/6-Cre cell. (J) The average firing frequency during 500 ms current injection as a function of injected currents. Note, recording was stopped at maximal 1450 pA current or when cells reached depolarization block. Since 13 out of 15 Ank1f/f;Dlx5/6-Cre+ cells reached depolarization block prior to 1450 pA current while only 3 out of 19 control cells reached depolarization block prior to 1450 pA, the firing frequency is overestimated in the high current range for Ank1F/F;Dlx5/6-Cre neurons. (K–M) Summary data showing the average firing frequency during the first 100 ms (K), spike frequency adaptation (L), and amplitude adaptation (M) from the spike trains evoked by currents that are two times of the action potential threshold currents. (N) Summary data showing the minimal currents that caused the cells to enter depolarization block. If the maximal injected current (1450 pA) did not cause depolarization block then 1450 pA was recorded as the result. For all panels, each circle represents one neuron and the black circles indicate the representative cells in (E and I). Bar graphs represent mean ± SEM. Statistical significance was determined by one-way ANOVA or Kruskal-Wallis test with multiple comparisons.
Figure 5—figure supplement 1
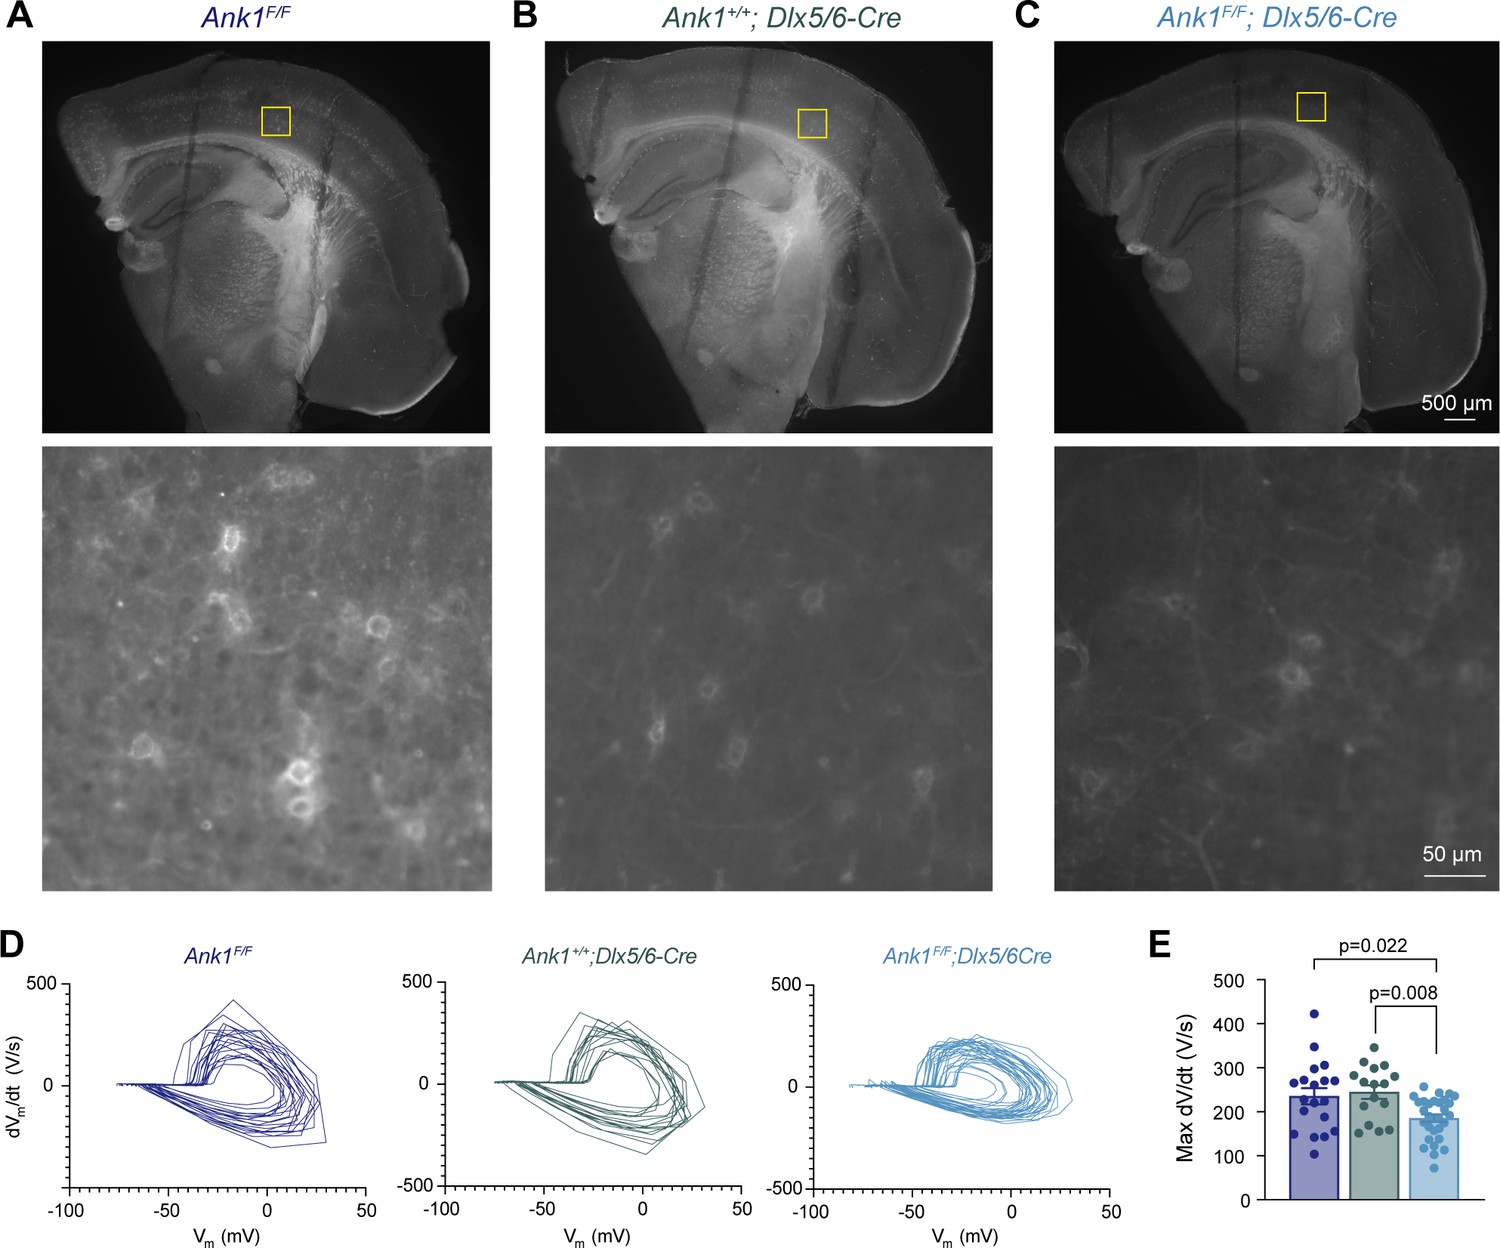
Flourescein-WFA labeling of perineuronal nets in live slices for electrophysiology.
(A) Top: low-magnification image of a coronal slice from the left hemisphere of an Ank1f/f mouse after recording. Lines on the brain slice are the indentations resulted from the mesh used to hold the slice in place during recording. Bottom: high-magnification image of the somatosensory cortex layer five within the boxed region in the low-magnification image where recording was performed. (B, C) Same as in (A) except for Ank1+/+;Dlx5/6-Cre (B) and Ank1F/F;Dlx5/6-Cre (C). (D) Phase plane plots of action potentials from Ank1F/F, Ank1+/+;Dlx5/6-Cre, and Ank1F/F;Dlx5/6-Cre cells. (E) Summary data of maximum dV/dt Error bars indicate mean ± SEM. Statistical significance was determined by one-way ANOVA.
-
Figure 5—figure supplement 1—source data 1
Source data related to Figure 5—figure supplement 1 .
- https://cdn.elifesciences.org/articles/66491/elife-66491-fig5-figsupp1-data1-v2.xlsx
Figure 5—figure supplement 2
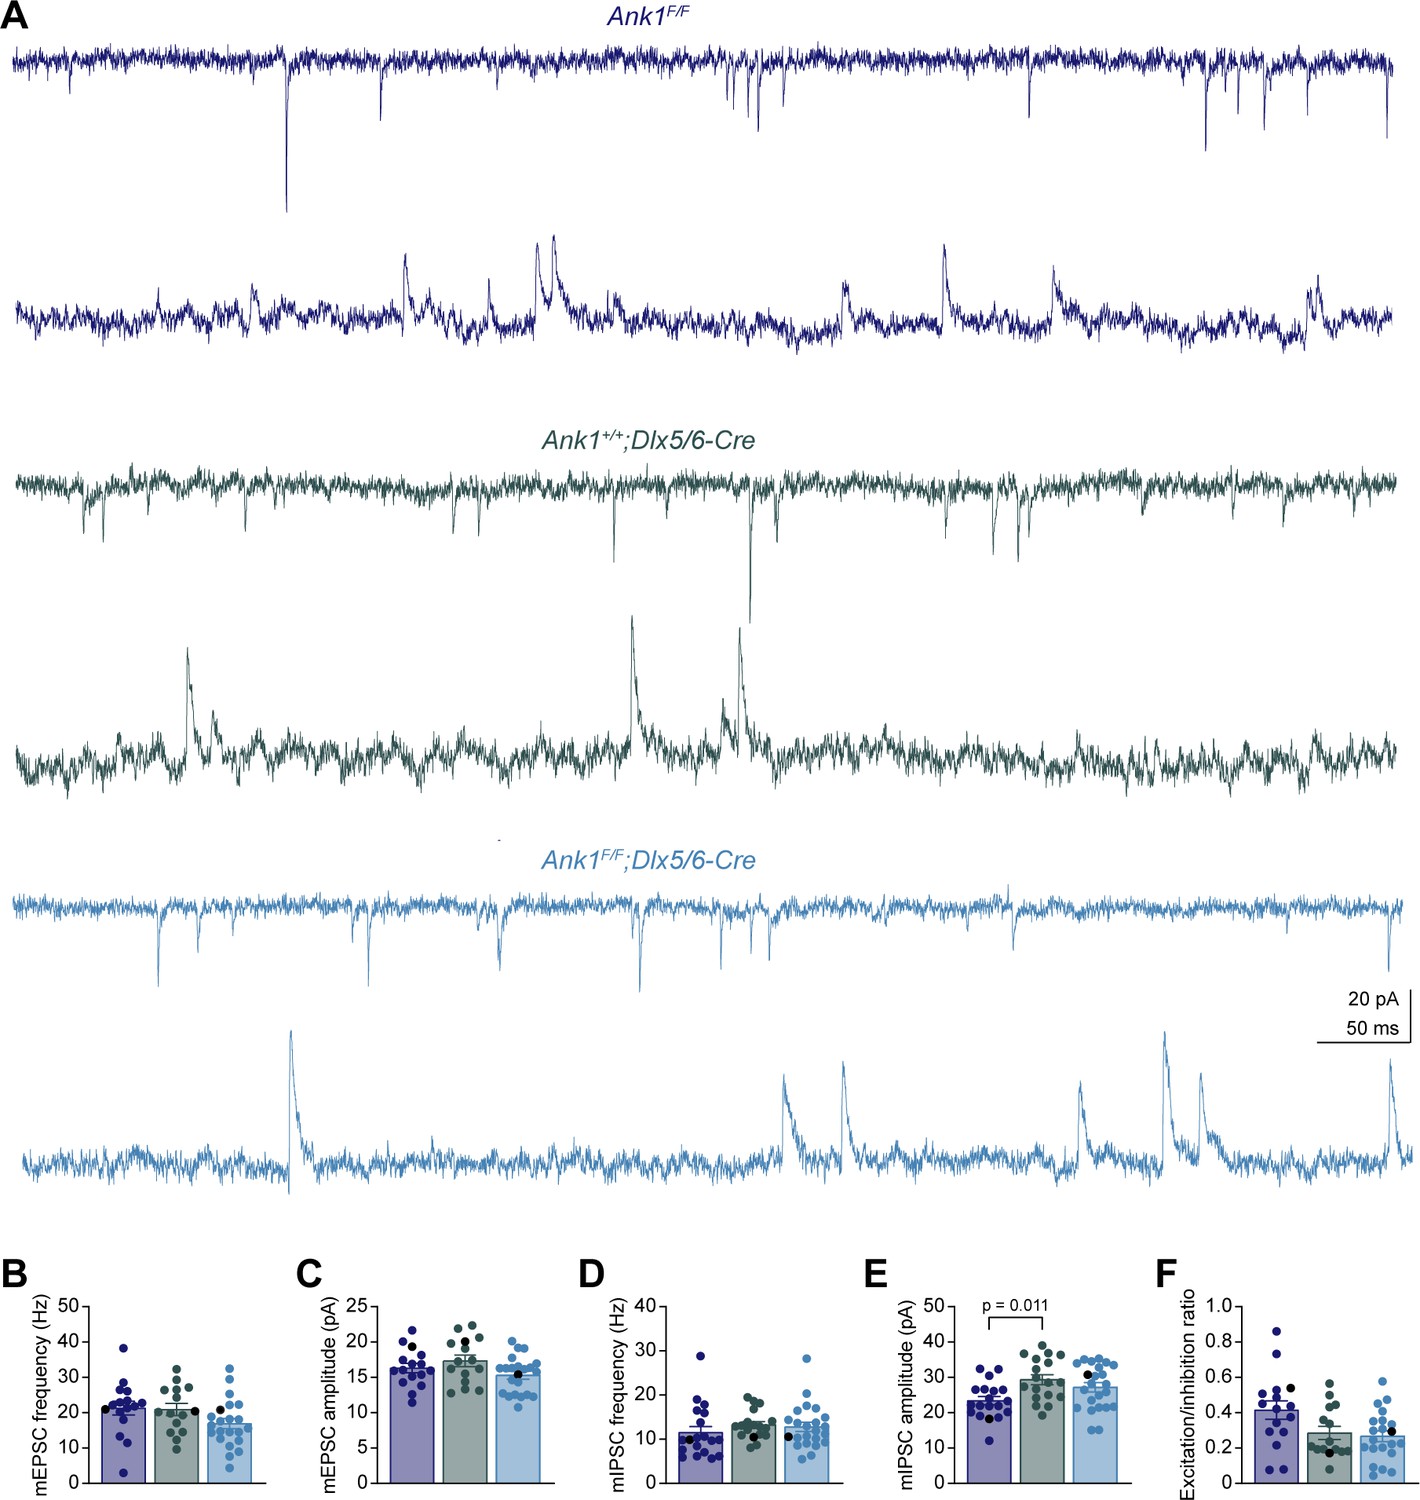
Analysis of miniature excitatory postsynaptic currents.
(A) Representative traces of miniature excitatory postsynaptic currents (mEPSCs) recorded at –70 mV (top) and miniature inhibitory postsynaptic currents (mIPSCs) recorded at +10 mV (bottom) from Ank1F/F, Ank1+/+;Dlx5/6-Cre, and Ank1F/F;Dlx5/6-Cre cells. (B, C) Summary data of mEPSC frequency (B) and amplitude (C). (D, E) Summary data of mIPSC frequency (D) and amplitude (E). (F) Summary data of excitation/inhibition ratio that is the ratio between the integrated mEPSC charge per unit time and integrated mIPSC charge per unit time. Each circle represents one neuron and the black circles indicate the representative cells in (D). Error bars indicate mean ± SEM. Statistical significance was determined by one-way ANOVA or Kruskal-Wallis test with multiple comparisons.
-
Figure 5—figure supplement 2—source data 1
Source data related to Figure 5—figure supplement 2 .
- https://cdn.elifesciences.org/articles/66491/elife-66491-fig5-figsupp2-data1-v2.xlsx
Figure 6 with 1 supplement
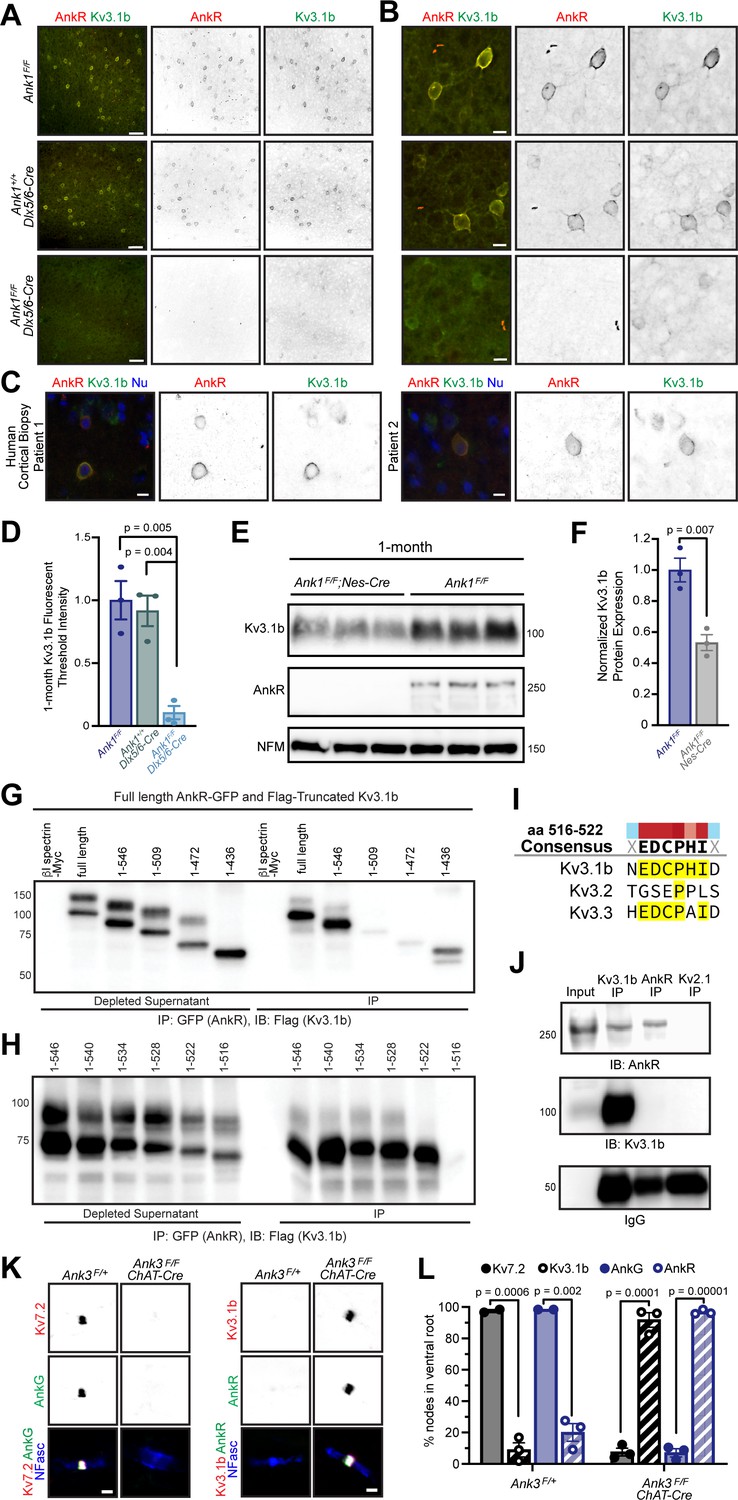
AnkR binds to Kv3.1b K+ channels and is both necessary and sufficient for its membrane localization and clustering.
(A, B) Immunostaining of 1-month-old somatosensory cortex for AnkR (red) and Kv3.1b (green). Low-magnification images are shown in (A) and high-magnification images in (B). The genotypes analyzed are shown. Scalebars, 50 µm in (A) and 10 µm in (B). (C) Immunostaining of human cortical biopsies from two separate patients using antibodies against AnkR (red) and Kv3.1b (green), and DAPI (blue) to label nuclei (Nu). Scalebars, 10 µm. (D) Quantification of Kv3.1b immunofluorescence intensity in control and Ank1F/F;Dlx5/6-Cre mice. Error bars indicate mean ± SEM. N=3/group. (E) Immunoblots of brain homogenates from three one-month-old control and three 1-month-old AnkR-deficient brains using antibodies against Kv3.1b, AnkR, and NFM. (F) Quantification of Kv3.1b protein normalized to NFM. (G, H). Immunoblots of AnkR-GFP immunoprecipitations in cells co-expressing AnkR-GFP with Myc-tagged β1 spectrin, full length Flag-tagged Kv3.1b, or truncated versions of Flag-tagged Kv3.1b. The amino acids included in the Flag-tagged Kv3.1b truncation mutants are indicated. (I) The consensus AnkR-binding motif present in Kv3.1b and Kv3.3, but not Kv3.2. (J) Immunoblots of Kv3.1b, AnkR, and IgG immunoprecipitation reactions using antibodies against AnkR and Kv3.1b. (K) Immunostaining of ventral root nodes of Ranvier in Ank3F/+ and Ank3F/F;Chat-Cre mice using antibodies against AnkG (green), Kv7.2 (red), and neurofascin (NFasc, blue) on the left, and AnkR (green), Kv3.1b (red), and NFasc (blue) on the right. Scalebars, 1 μm. (L) Quantification of the percentage of nodes of Ranvier labeled for Kv7.2, Kv3.1b, AnkG, and AnkR in Ank3F/+ and Ank3F/F;Chat-Cre mice. Ank3F/+ - Kv7 (N=two mice; n=217 nodes), Kv3.1b (N=three mice; n=301 nodes), AnkG (N=two mice; n=222 nodes), AnkR (N=three mice; n=286 nodes). Ank3F/F; Chat-Cre - Kv7 (N=three mice; n=252 nodes), Kv3.1b (N=three mice; n=244 nodes), AnkG (N=three mice; n=251 nodes), AnkR (N=three mice; n=249 nodes). Error bars indicate mean ± SEM.
Figure 6—figure supplement 1
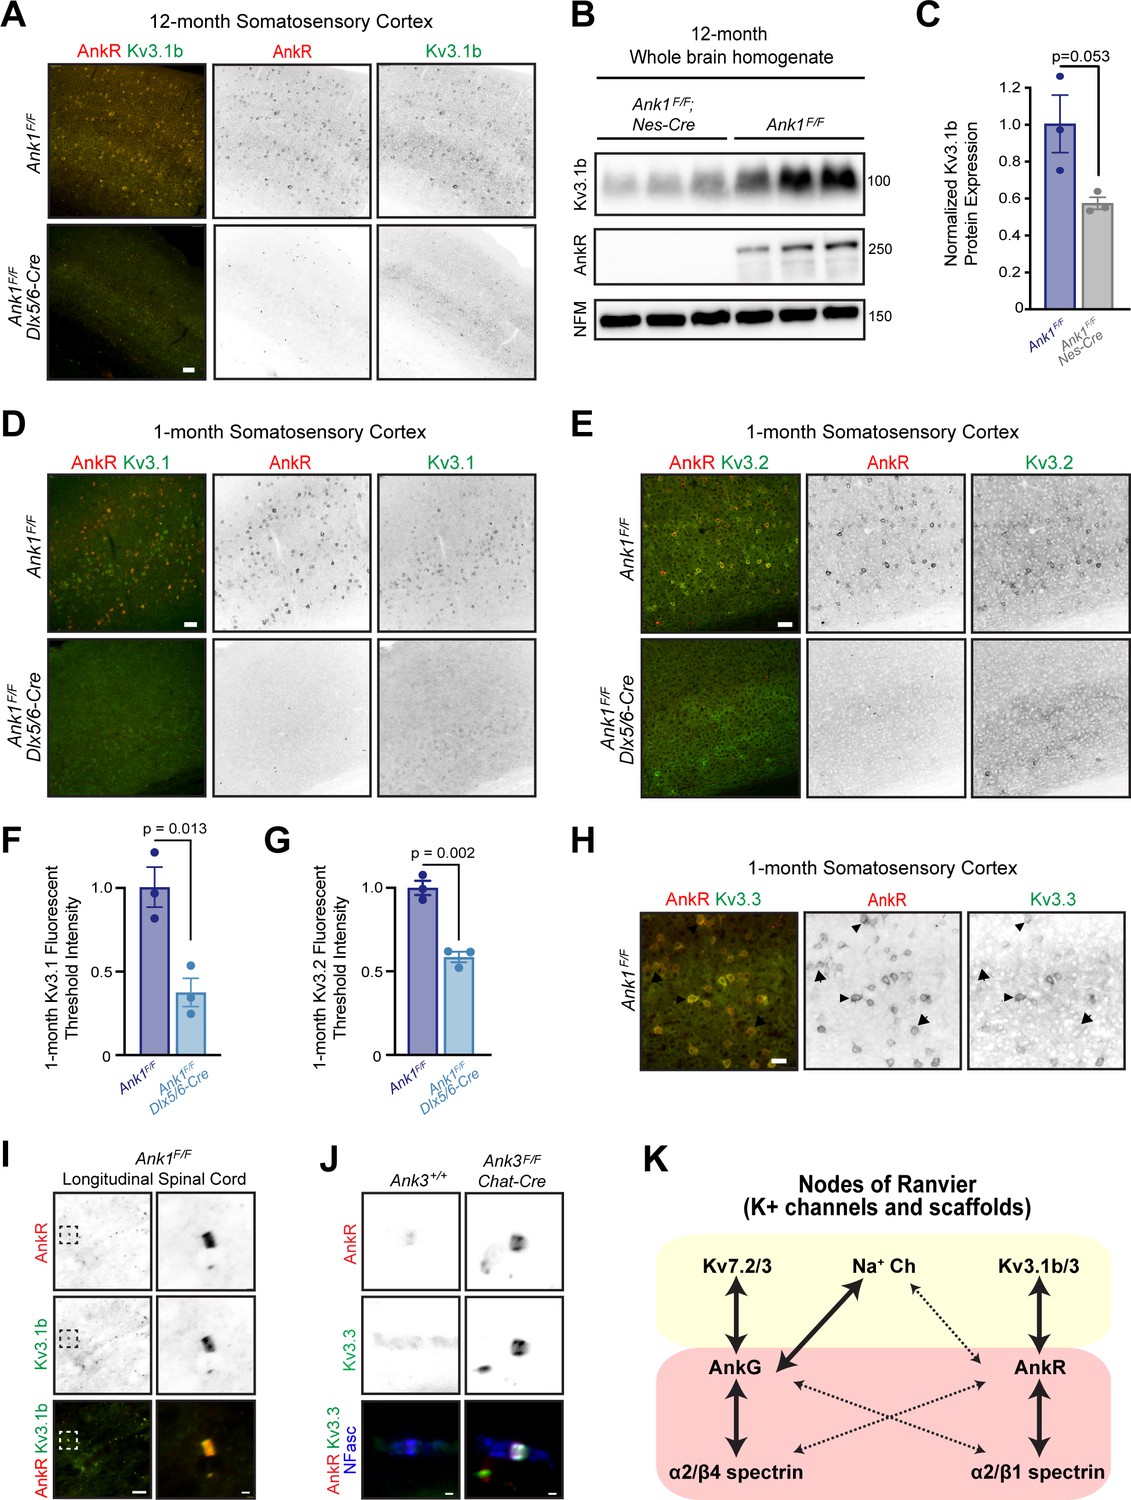
Kv3.1b membrane localization requires AnkR.
(A) Immunolabeling of 12-month-old somatosensory cortex from Ank1F/F and Ank1F/F;Dlx5/6-Cre mice using antibodies against AnkR (red) and Kv3.1b (green). Scalebar, 50 μm. (B) Immunoblots of brain homogenates from three 12-month-old control and three 12-month-old AnkR-deficient brains using antibodies against Kv3.1b, AnkR, and NFM. (C) Quantification of Kv3.1b protein normalized to NFM. Error bars indicate mean ± SEM. N=3/group. (D) Immunolabeling of 1-month-old somatosensory cortex from Ank1F/F and Ank1F/F;Dlx5/6-Cre mice using antibodies against AnkR (red) and Kv3.1 (green). Scalebar, 50 μm. (E) Immunolabeling of 1-month-old somatosensory cortex from Ank1F/F and Ank1F/F;Dlx5/6-Cre mice using antibodies against AnkR (red) and Kv3.2 (green). Scalebar, 50 μm. (F) Quantification of Kv3.1 immunofluorescence intensity in somatosensory cortex of control and Ank1F/F;Dlx5/6-Cre mice. Error bars indicate mean ± SEM. N=3/group. (G) Quantification of Kv3.2 immunofluorescence intensity in somatosensory cortex of control and Ank1F/F;Dlx5/6-Cre mice. Error bars indicate mean ± SEM. N=3/group. (H) Immunolabeling of 1-month-old somatosensory cortex from Ank1F/F mice using antibodies against AnkR (red) and Kv3.3 (green). Scalebar, 25 μm. (I) Immunostaining of Ank1F/F spinal cord using antibodies against AnkR (red) and Kv3.1b (green). Scalebars, 10 μm and 1 μm. (J) Immunostaining of ventral root nodes of Ranvier in Ank3+/+ and Ank3F/F;Chat-Cre mice using antibodies against AnkR (red), Kv3.3 (green), and NFasc (blue). Scalebar, 1 μm. (K) The specific K+ channels and spectrins found at nodes of Ranvier is dictated by the Ankyrin scaffold to which they bind.
-
Figure 6—figure supplement 1—source data 1
Source data related to Figure 6—figure supplement 1 .
- https://cdn.elifesciences.org/articles/66491/elife-66491-fig6-figsupp1-data1-v2.xlsx
Figure 7
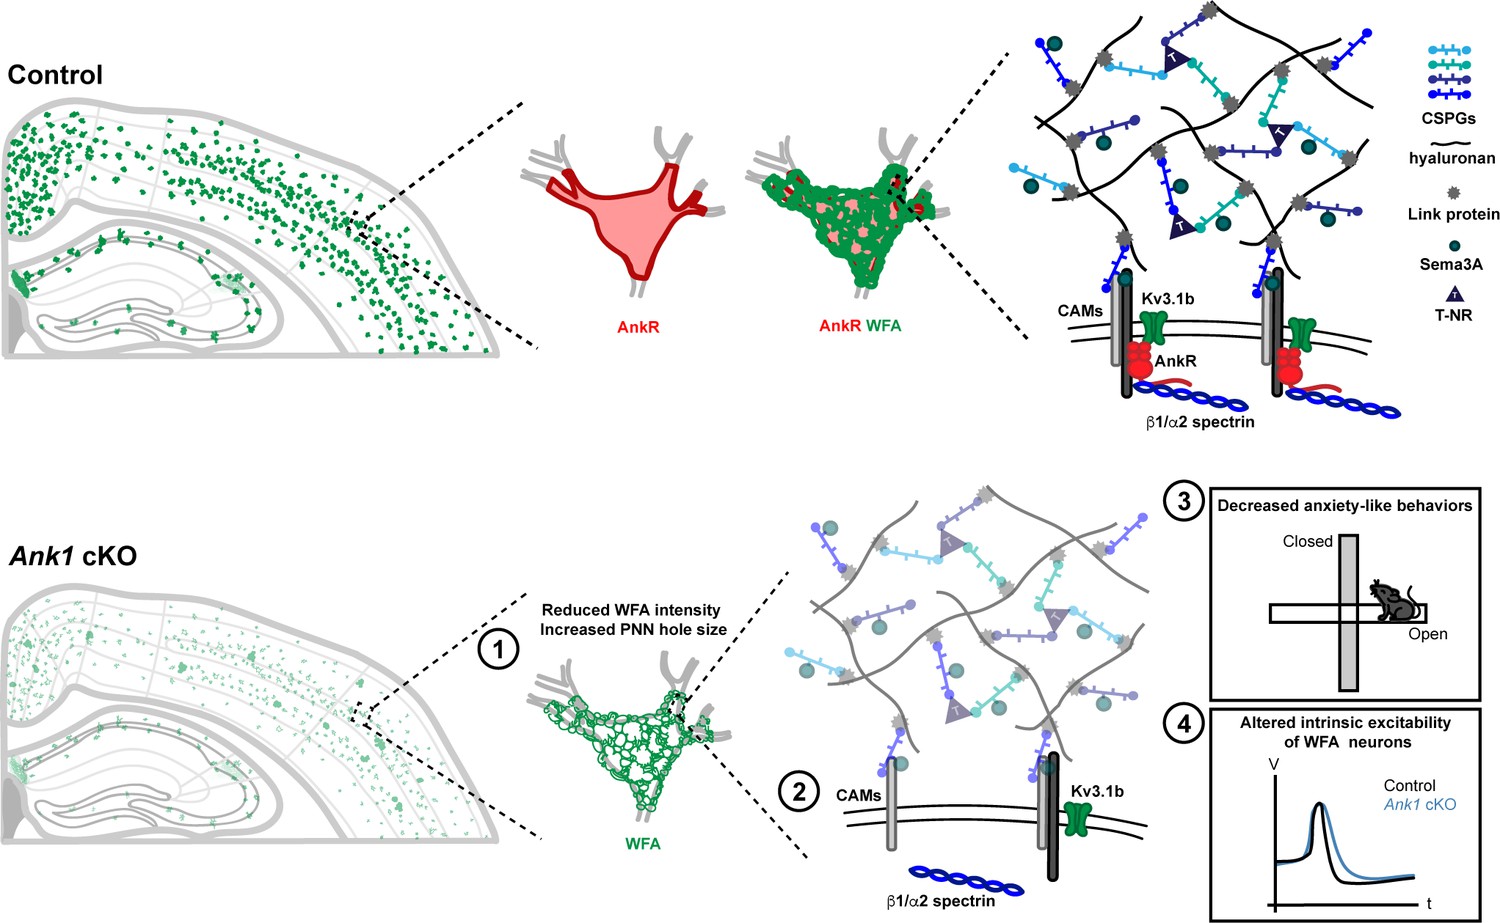
AnkR is highly expressed in the perisomatic region of Pv+ interneurons which are surrounded by PNNs, a specialized ECM structure.
AnkR is a scaffolding protein that binds to and stabilizes PNN-associated CAMs (including NrCAM and PlexinA4) and ion channels (including Kv3.1b) by linking them to the β1-α2 spectrin-based cytoskeleton. Loss of AnkR results in (1) altered PNN morphology including reduced WFA intensity and decreased compactness of the nets; (2) molecular changes including reduced β1 spectrin, PNN-associated NrCAM, and Kv3.1b; (3) behavioral changes including decreased anxiety-like behaviors in the open field and elevated plus maze; and (4) electrophysiological changes including decreased AP latency and threshold, broader APs with shallower and delayed AHP, and decreased firing rate during current injection.
Author response image 1
Videos
Video 1
WFA in 12-month Ank1F/F.
Scalebar, 5 µm.
Video 2
WFA in 12-month Ank1F/F;Dlx5/6-Cre.
Scalebar, 5 µm.
Tables
Appendix 1—key resources table
| Reagent type (species) or resource | Designation | Source or reference | Identifiers | Additional information |
|---|---|---|---|---|
| gene (human) | ANK1 | NCBI.NLM.NIH.gov/gene | Gene ID: 286 HGNC:HGNC:492 | |
| gene (Mus musculus) | Ank1 | NCBI.NLM.NIH.gov/gene | Gene ID: 11733 MGI:MGI:88024 | |
| Strain, strain background (Mus musculus, male and female) | C57BL/6J, Wild type, WT | The Jackson Laboratory | JAX:000664 | See Materials and methods, Section Animals |
| Strain, strain background (Mus musculus, female) | Nestin-Cre, Nes-Cre | The Jackson Laboratory | JAX:003771 | See Materials and methods, Section Animals |
| Strain, strain background (Mus musculus, male) | Dlx5/6-Cre | The Jackson Laboratory | JAX:008199 | See Materials and methods, Section Animals |
| Strain, strain background (Mus musculus, male) | Chat-Cre ChAT-Cre | The Jackson Laboratory | JAX:006410 | See Materials and methods, Section Animals |
| Strain, strain background (Mus musculus, male and female) | Ank1pale/pale Ank1-KO | The Jackson Laboratory | JAX:009157 | See Materials and methods, Section Animals |
| Strain, strain background (Mus musculus, male and female) | Ank1F/F | This paper | JAX:036512 | See Materials and methods, Section Animals Dr. Matthew Rasband (Baylor College of Medicine) |
| Strain, strain background (Mus musculus, male and female) | Ank3F/F | The Jackson Laboratory | JAX:029797 | See Materials and methods, Section Animals |
| Sequence-based reagent | Genotyping primer for Ank1F/F mouse (sense) | This paper | See Materials and methods, Section Animals 5’-GGGAAACTCCACAGAGCCTGACGGGTCAGT-3’ | |
| Sequence-based reagent | Genotyping primer for Ank1F/F mouse (missense) | This paper | See Materials and methods, Section Animals 5’- GGC GTC CCTATGTTC CATCCTATA GATGACT-3’ | |
| Transfected construct (M. musculus) | Full-length AnkR-GFP | Ho et al., 2014 | See Materials and methods, Section Plasmids | |
| Transfected construct (M. musculus) | β1 spectrin-Myc | Ho et al., 2014 | See Materials and methods, Section Plasmids | |
| Transfected construct (M. musculus) | Full-length Kv3.1b | Dr. James Trimmer (University of California at Davis) | See Materials and methods, Section Plasmids | |
| Transfected construct (M. musculus) | Full-length Kv3.1b-Flag | This paper | See Materials and methods, Section Plasmids p3XFLAG-CMV-7.1 vector | |
| Transfected construct (M. musculus) | Truncated Kv3.1b constructs | This paper | See Materials and methods, Section Plasmids p3XFLAG-CMV-7.1 vector | |
| cell line (Homo-sapiens) | HEK293T | ATCC | See Materials and methods, Section Immunoprecipitation | |
| Antibody | Ankyrin-R AnkR (mouse monoclonal) | UC Davis/NIH NeuroMab Facility Cat# 75–380 | RRID:AB_2491109 | IF (1:250) IB (1:500) IP (5 ul) |
| Antibody | β1 spectrin (mouse monoclonal) | UC Davis/NIH NeuroMab Facility Cat# 73–374 | RRID:AB_2315814 | IF (1:250) IB (1:1000) IP (5 ul) |
| Antibody | Ankyrin-G AnkG (mouse monoclonal) | UC Davis/NIH NeuroMab Facility Cat# 73–146 | RRID:AB_10697718 | IF (1:500) |
| Antibody | Parvalbumin Pv (mouse monoclonal) | UC Davis/NIH NeuroMab Facility Cat# 73–455 | RRID:AB_2629420 | IF (1:250) |
| Antibody | Actin (mouse monoclonal) | Millipore Cat# MAB1501 | RRID:AB_2223041 | IB (1:1000) |
| Antibody | Tenascin-R TnR (mouse monoclonal) | R and D Systems Cat# MAB1624 | RRID:AB_2207001 | IF (1:500) |
| Antibody | Aggrecan ACAN Acan (mouse monoclonal) | Millipore Cat# AB1031 | RRID:AB_90460 | IF (1:500) |
| Antibody | Brevican BCAN Bcan (mouse monoclonal) | UC Davis/NIH NeuroMab Facility Cat# 75–294 | RRID:AB_2315824 | IF (1:500) |
| Antibody | NrCAM (mouse monoclonal) | R and D Systems Cat# MAB2034 | RRID:AB_2267411 | IF (1:500) IB (1:1000) IP (5 ul) |
| Antibody | Kv3.1b (mouse monoclonal) | UC Davis/NIH NeuroMab Facility Cat# N16B/8 | RRID:AB_2750730 | IF (1:500) IB (1:1000) IP (5 ul) |
| Antibody | Kv3.2 (mouse monoclonal) | UC Davis/NIH NeuroMab Facility Cat# N410/17 | RRID:AB_2877619 | IF (1:250) |
| Antibody | Kv3.3 (mouse monoclonal) | Antibodies-Online Cat# ABIN572016 | RRID:AB_10782137 | IF (1:500) |
| Antibody | Kv7.2 (mouse monoclonal) | UC Davis/NIH NeuroMab Facility Cat# N26A/23 | RRID:AB_2750761 | IF (1:500) |
| Antibody | Pan sodium channel PanNav (mouse monoclonal) | UC Davis/NIH NeuroMab Facility Cat# N419/78 | RRID:AB_2877588 | IF (1:250) |
| Antibody | Flag-tag or DDDDK-tag (mouse monoclonal) | MBL International Cat# M185-3L | RRID:AB_11123930 | IB (1:1000) |
| Antibody | Ankyrin-R AnkR (rabbit polyclonal) | Ho et al., 2014 | RRID:AB_2833096 | IF (1:500) IB (1:1000) IP (5 ul) |
| Antibody | Ankyrin-R, AnkR, Ank1 (rabbit polyclonal) | Thermo Fisher Scientific Cat# PA5-63372 | RRID:AB_2638015 | IF (1:500) IB (1:1000) |
| Antibody | Neurofilament M, NFM (rabbit polyclonal) | Millipore Cat# AB1987 | RRID:AB_91201 | IB (1:2000) |
| Antibody | Somatostatin, SST (rabbit polyclonal) | Peninsula Laboratories Cat# T-4103.0050 | RRID:AB_518614 | IF (1:3000) |
| Antibody | Parvalbumin Pv (rabbit polyclonal) | Novus Cat# NB120-11427 | RRID:AB_791498 | IF (1:500) |
| Antibody | Versican, VCAN (rabbit polyclonal) | Millipore Cat# AB1032 | RRID:AB_11213831 | IF (1:500) |
| Antibody | PlexinA4, PlxnA4 (rabbit polyclonal) | Abcam Cat# ab39350 | RRID:AB_944890 | IF (1:500) IB (1:1000) IP (5 ul) |
| Antibody | Neruropilin-1, Nrp1 (rabbit polyclonal) | GeneTex Cat# GTX16786 | RRID:AB_422398 | IF (1:500) IB (1:1000) IP (5 ul) |
| Antibody | Kv3.1 (rabbit polyclonal) | LSBio (LifeSpan) Cat#LS-C322374-200 | RRID:AB_2891125 | IF (1:100) |
| Antibody | Kv3.1b (rabbit polyclonal) | Alomone Labs Cat# APC-014 | RRID:AB_2040166 | IF (1:500) IB (1:1000) IP (5 ul) |
| Antibody | Kv3.3 (rabbit polyclonal) | Alomone Labs Cat# APC-102 | RRID:AB_2040170 | IF (1:500) |
| Antibody | GFP (rabbit polyclonal) | Thermo Fisher Scientific, Cat# A-11122 | RRID:AB_221569 | IB (1:1000) |
| Antibody | Neurofascin, NF, NF186 (chicken polyclonal) | R and D Systems Cat# AF3235 | RRID:AB_10890736 | IF (1:500) |
| Other | Fluorescein WFA, Wisteria floribunda agglutinin | Vector Laboratories Cat# FL-1351 | RRID:AB_2336875 | Lectin IF (1:250) |
| Other | Fluorescein WFA, Wisteria floribunda agglutinin | Bioworld Cat# 21761065–1 | RRID:AB_2833087 | Lectin IF (1:100) |
| Other | Texas-Red WFA, Wisteria floribunda agglutinin | EY Laboratories Cat# F-3101–1 | RRID:AB_2315605 | Lectin IF (1:250) |
| Software, algorithm | Fiji, Image J | NIH | RRID:SCR_002285 | |
| Software, algorithm | Prism | Graph Pad | RRID:SCR_011323 |
-
IF: Immunofluorescence; IB: Immunoblot; IP:Immunoprecipitation
Additional files
-
Supplementary file 1
Intrinsic properties of WFA+ cells in Ank1F/F, Ank1+/+;Dlx5/6-Cre, and Ank1F/F;Dlx5/6-Cre mice.
Data are from 3 Ank1F/F, 2 Ank1+/+;Dlx5/6-Cre, and 4 Ank1F/F;Dlx5/6-Cre mice, and are reported as mean ± SEM (number of cells). Bolded p values indicate significance.
- https://cdn.elifesciences.org/articles/66491/elife-66491-supp1-v2.docx
-
Supplementary file 2
Abbreviations used throughout the paper.
- https://cdn.elifesciences.org/articles/66491/elife-66491-supp2-v2.docx
-
Transparent reporting form
- https://cdn.elifesciences.org/articles/66491/elife-66491-transrepform-v2.docx
Download links
A two-part list of links to download the article, or parts of the article, in various formats.
Downloads (link to download the article as PDF)
Open citations (links to open the citations from this article in various online reference manager services)
Cite this article (links to download the citations from this article in formats compatible with various reference manager tools)
Ankyrin-R regulates fast-spiking interneuron excitability through perineuronal nets and Kv3.1b K+ channels
eLife 10:e66491.
https://doi.org/10.7554/eLife.66491


