The molecular basis of coupling between poly(A)-tail length and translational efficiency
- Howard Hughes Medical Institute, United States
- Whitehead Institute for Biomedical Research, United States
- Department of Biology, Massachusetts Institute of Technology, United States
Figures
Figure 1 with 2 supplements
PABPC overexpression uncouples poly(A)-tail length and TE in frog oocytes.
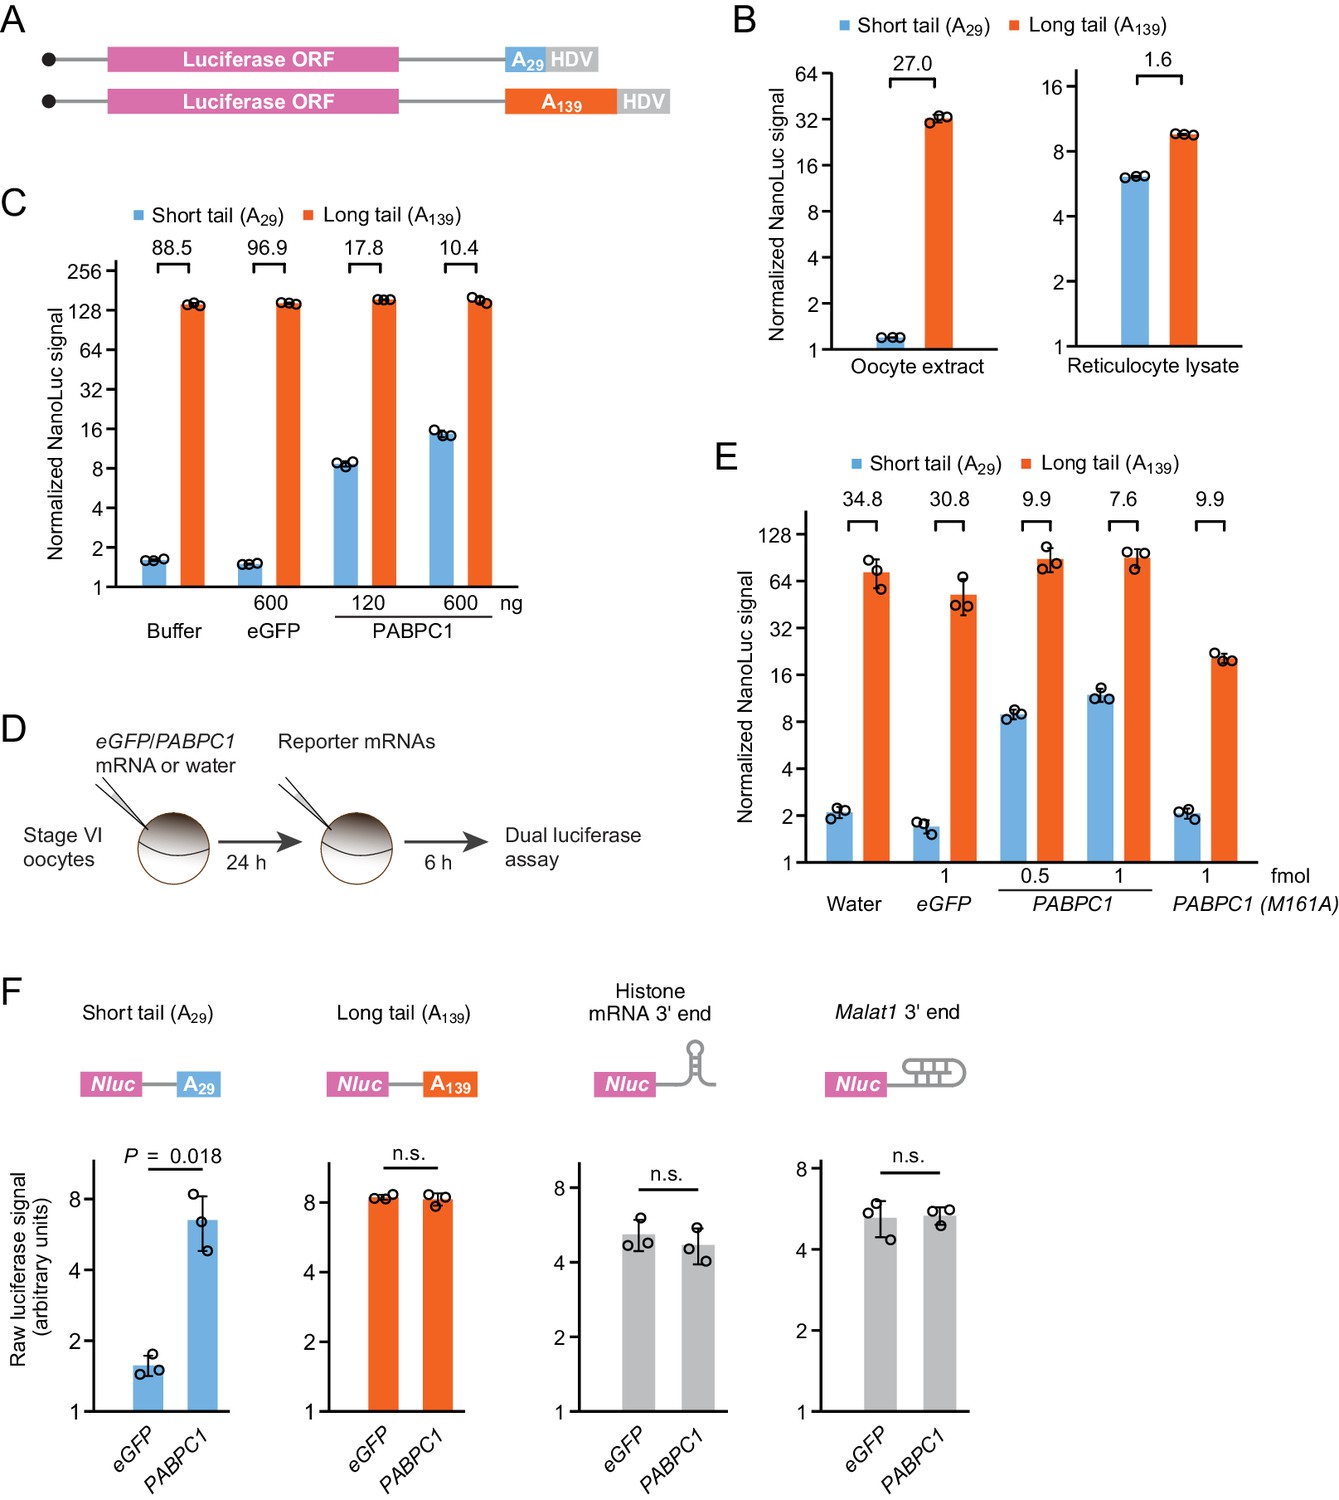
(A) Schematic of capped T7 transcripts with two different tail lengths, which were used as reporter mRNAs. Additional sequences beyond the HDV sequence are not depicted. (B) The effect of tail length on relative yields of in vitro translation of short- and long-tailed Nluc reporter mRNAs, in either frog oocyte extract (left) or rabbit reticulocyte lysate (right). The number above each bracket indicates the fold difference of the mean normalized luciferase signal (error bars, standard deviation from three technical replicates). (C) The effect of purified PABPC1 on relative yields of in vitro translation of short- and long-tailed Nluc reporter mRNAs in frog oocyte extract. Purified eGFP and PABPC1 were each added as indicated. Otherwise, this panel is as in (B). (D) Experimental scheme for serial-injection of mRNAs into frog oocytes. (E) The effect of overexpressing PAPBC1 and a PABPC1 M161A mutant on relative translation of Nluc reporter mRNAs in frog oocytes. Differential PABPC1 expression was achieved by injecting the indicated amount of mRNA in the first injection (error bars, standard deviation from three biological replicates). Otherwise, this panel is as in (B). (F) The effect of PAPBC1 overexpression on translation of reporter mRNAs with different 3′-end structures in frog oocytes. Shown are raw luciferase yields from Nluc reporters that have either a short poly(A) tail, a long poly(A) tail, a histone mRNA 3′-end stem-loop, or a Malat1 triple-helix 3′-end in oocytes overexpressing either eGFP or PABPC1 (error bars, standard deviations from three biological replicates). p values are from one-sided t-tests (n.s., not significant). For overexpression, 2.4 fmol mRNA was injected per oocyte.
-
Figure 1—source data 1
Source data for luciferase values shown in Figure 1 and Figure 1—figure supplement 2.
- https://cdn.elifesciences.org/articles/66493/elife-66493-fig1-data1-v1.xlsx
Figure 1—figure supplement 1
Supporting data for reporter experiments examining the effect of PAPBC levels on coupling between tail length and translation.
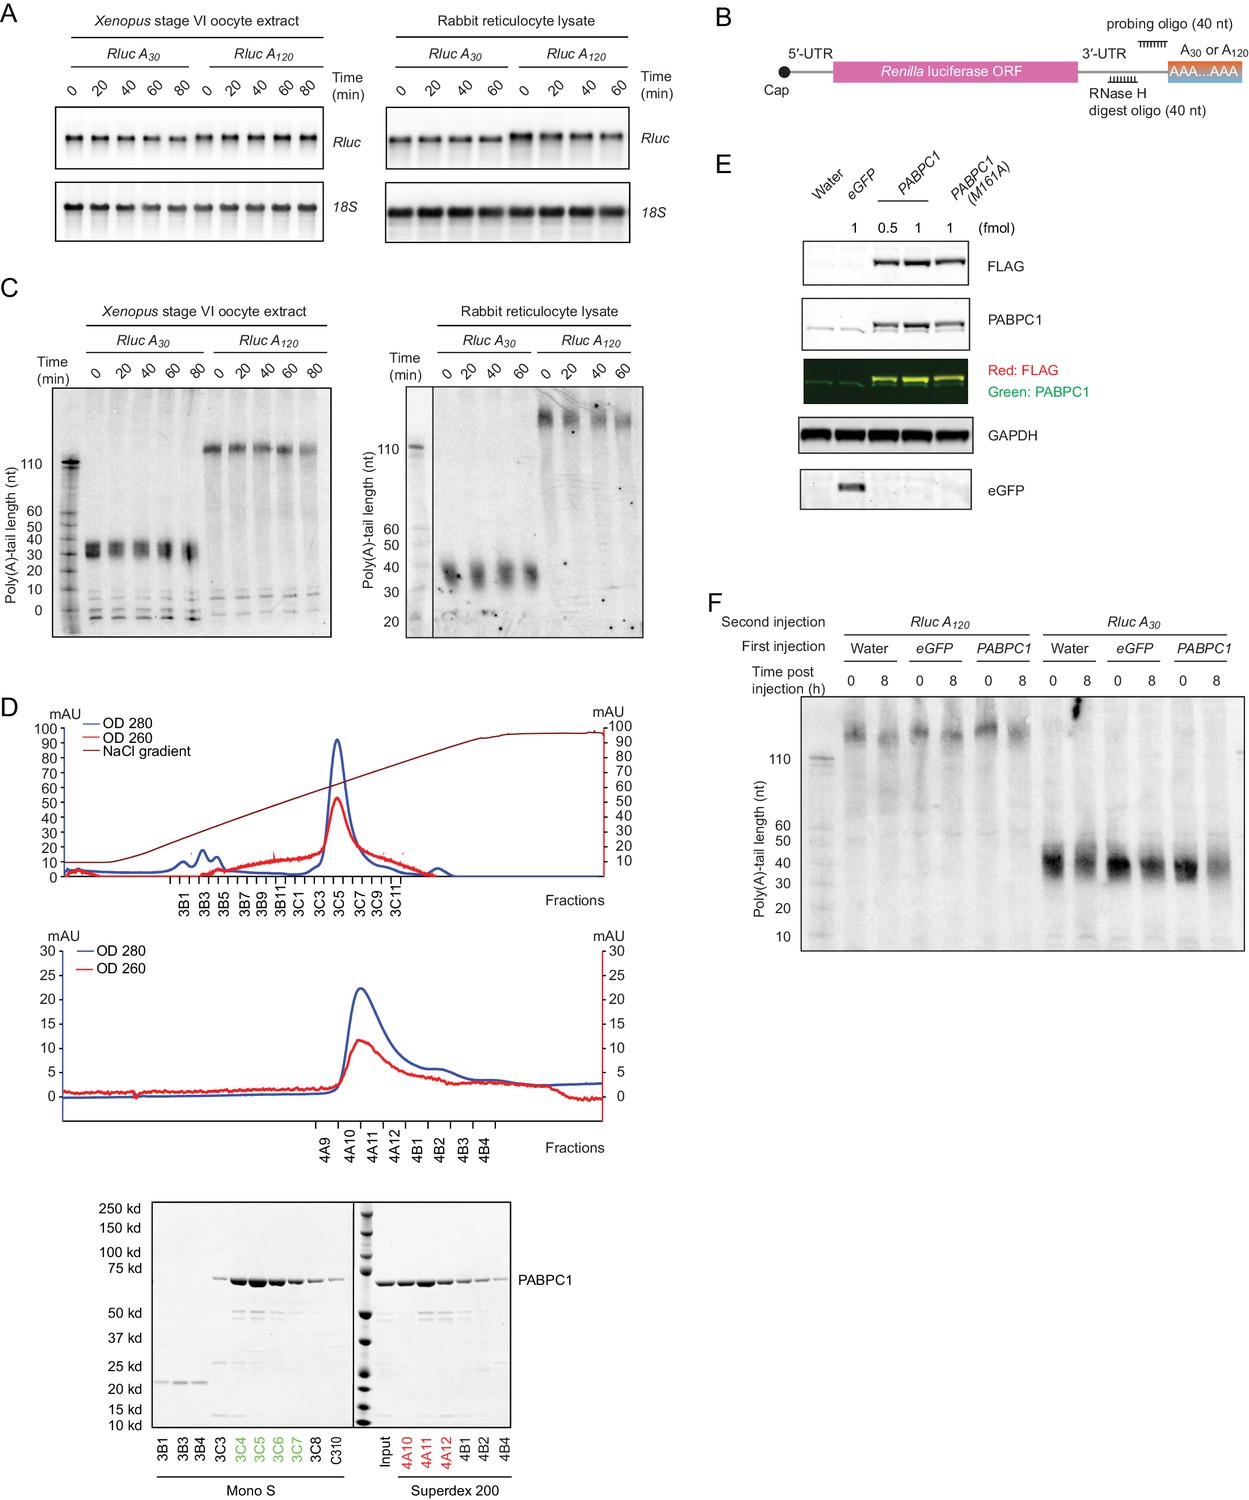
(A) The stability of reporters during in vitro translation. Shown are mRNA northern blots monitoring reporter mRNA levels over the course of the indicated in vitro translation reactions. (B) Schematic of mRNA cleavage and probing strategy used in RNase H northern blots, which were used to examine tail lengths. A DNA oligonucleotide complimentary to the 3′-UTR was used to direct cleavage of the target mRNA by RNase H, leaving a 40-nt fragment of the 3′-UTR appended to the poly(A) tail, which was resolved on a denaturing gel and detected by a radiolabeled probe. (C) The integrity of reporter poly(A) tails during in vitro translation. Shown are RNase H northern blots monitoring poly(A)-tail lengths of reporter mRNAs in in vitro translation reactions, as illustrated in (B). Reference tail lengths are inferred from lengths of size markers. (D) Purification of PABPC1. At the top is a chromatogram of cation exchange after nickel affinity columns. In the middle is a chromatogram of gel filtration after the cation exchange. At the bottom are Coomassie-stained SDS-PAGE gels monitoring fractions collected during the cation exchange (Mono S) and the gel filtration (Superdex 200). Green fractions were pooled after the cation-exchange step, and red fractions were pooled after the gel-filtration step. (E) Expression of proteins from mRNAs injected into frog oocytes. Shown is a western blot detecting proteins from frog oocytes in which mRNAs were injected for expressing the indicated proteins. (F) The integrity of reporter tail lengths after injection into oocytes. Shown is an RNase H northern blot monitoring poly(A)-tail lengths of reporter mRNAs injected into oocytes. Otherwise this panel is as in (C).
Figure 1—figure supplement 2
Additional reporter assays examining the effect of PAPBC levels on coupling between tail length and translation.
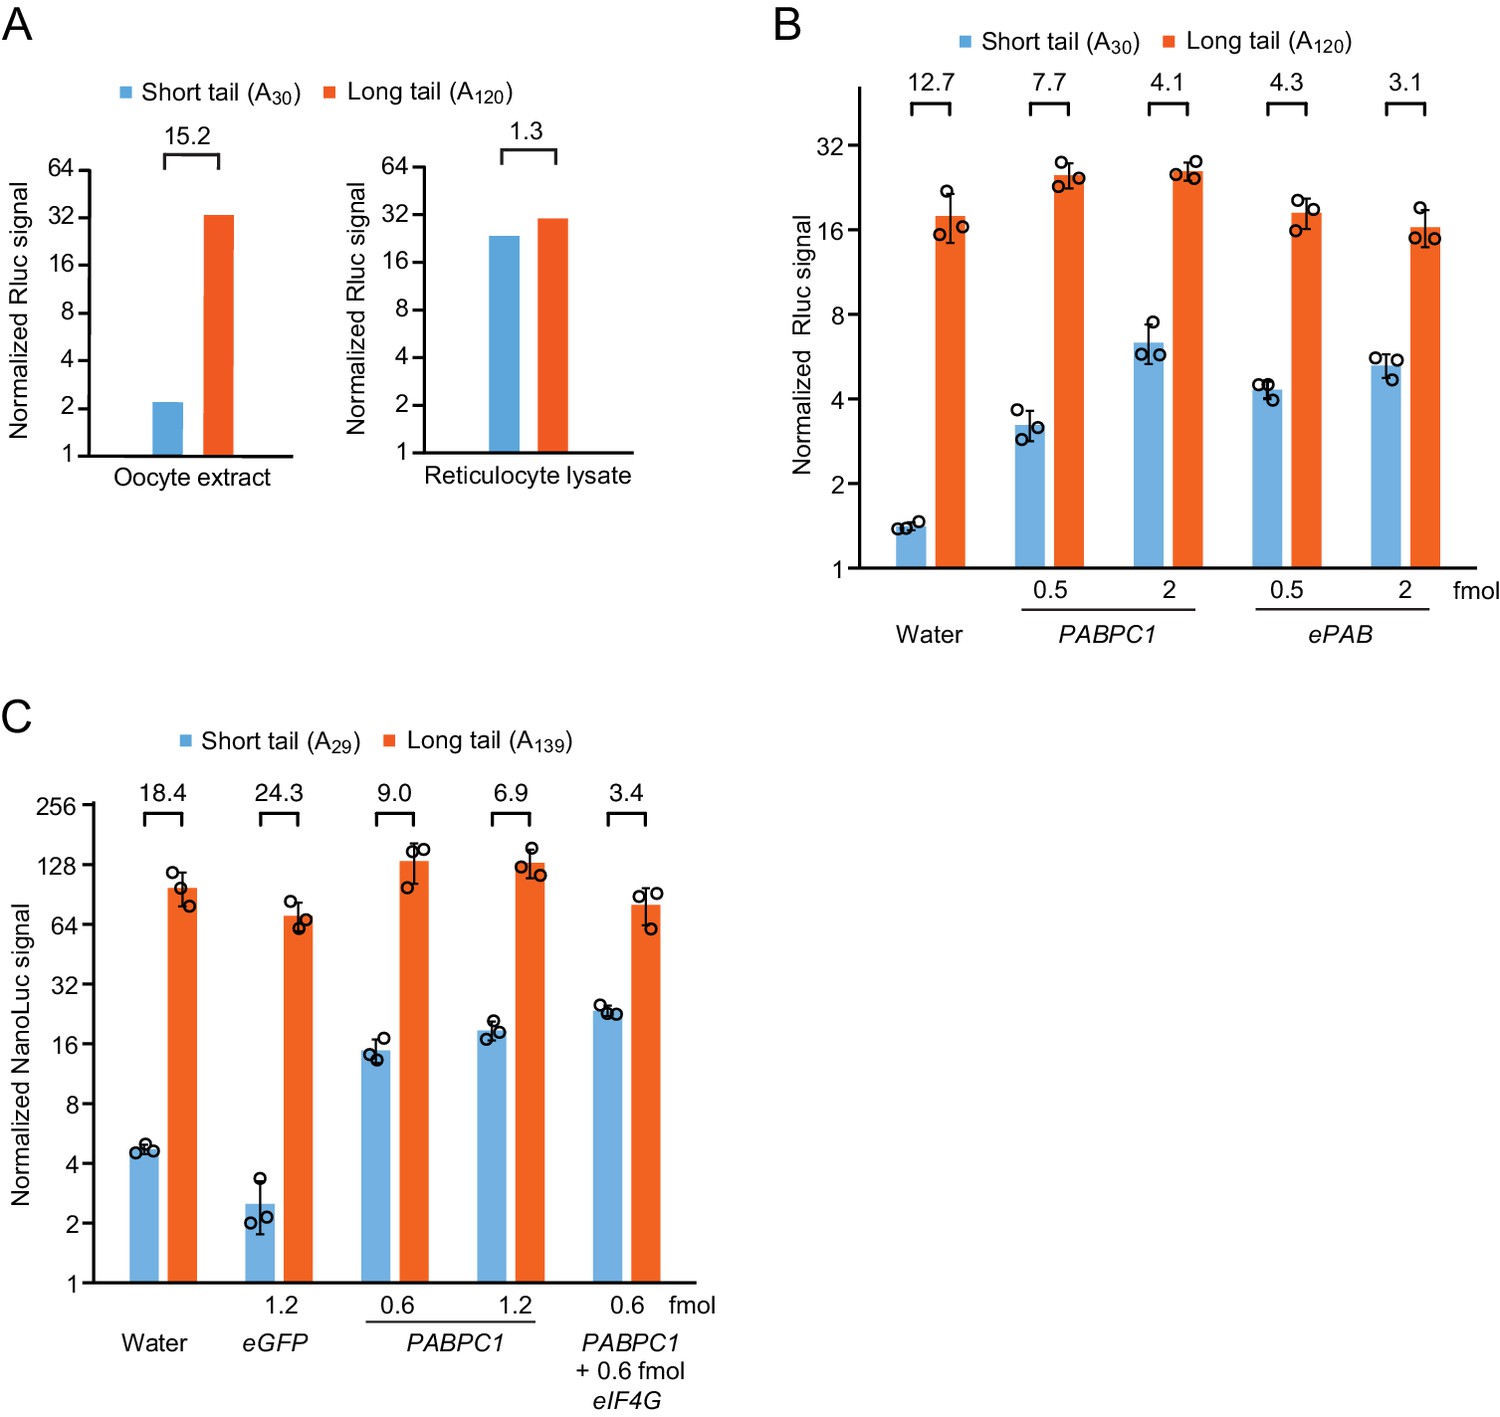
(A) The effect of tail length on reporter translation in vitro. This panel is as in Figure 1B, but uses Rluc reporters instead of Nluc reporters and shows the results of one replicate. (B) The effect of PABPC1 or ePAB overexpression on relative translation of short- and long-tailed reporter mRNAs in frog oocytes. This panel is as in Figure 1E but uses Rluc reporters instead of Nluc reporters. (C) The effect of PABPC1 and eIF4G overexpression on translation of Nluc reporter mRNAs in frog oocytes. Expression of different proteins was achieved by injecting the indicated amount of mRNA in the first injection. Otherwise, this panel is as in (B).
Figure 2 with 1 supplement

Increased PABPC promotes translation of endogenous short-tailed mRNAs, thereby diminishing coupling between tail length and TE.
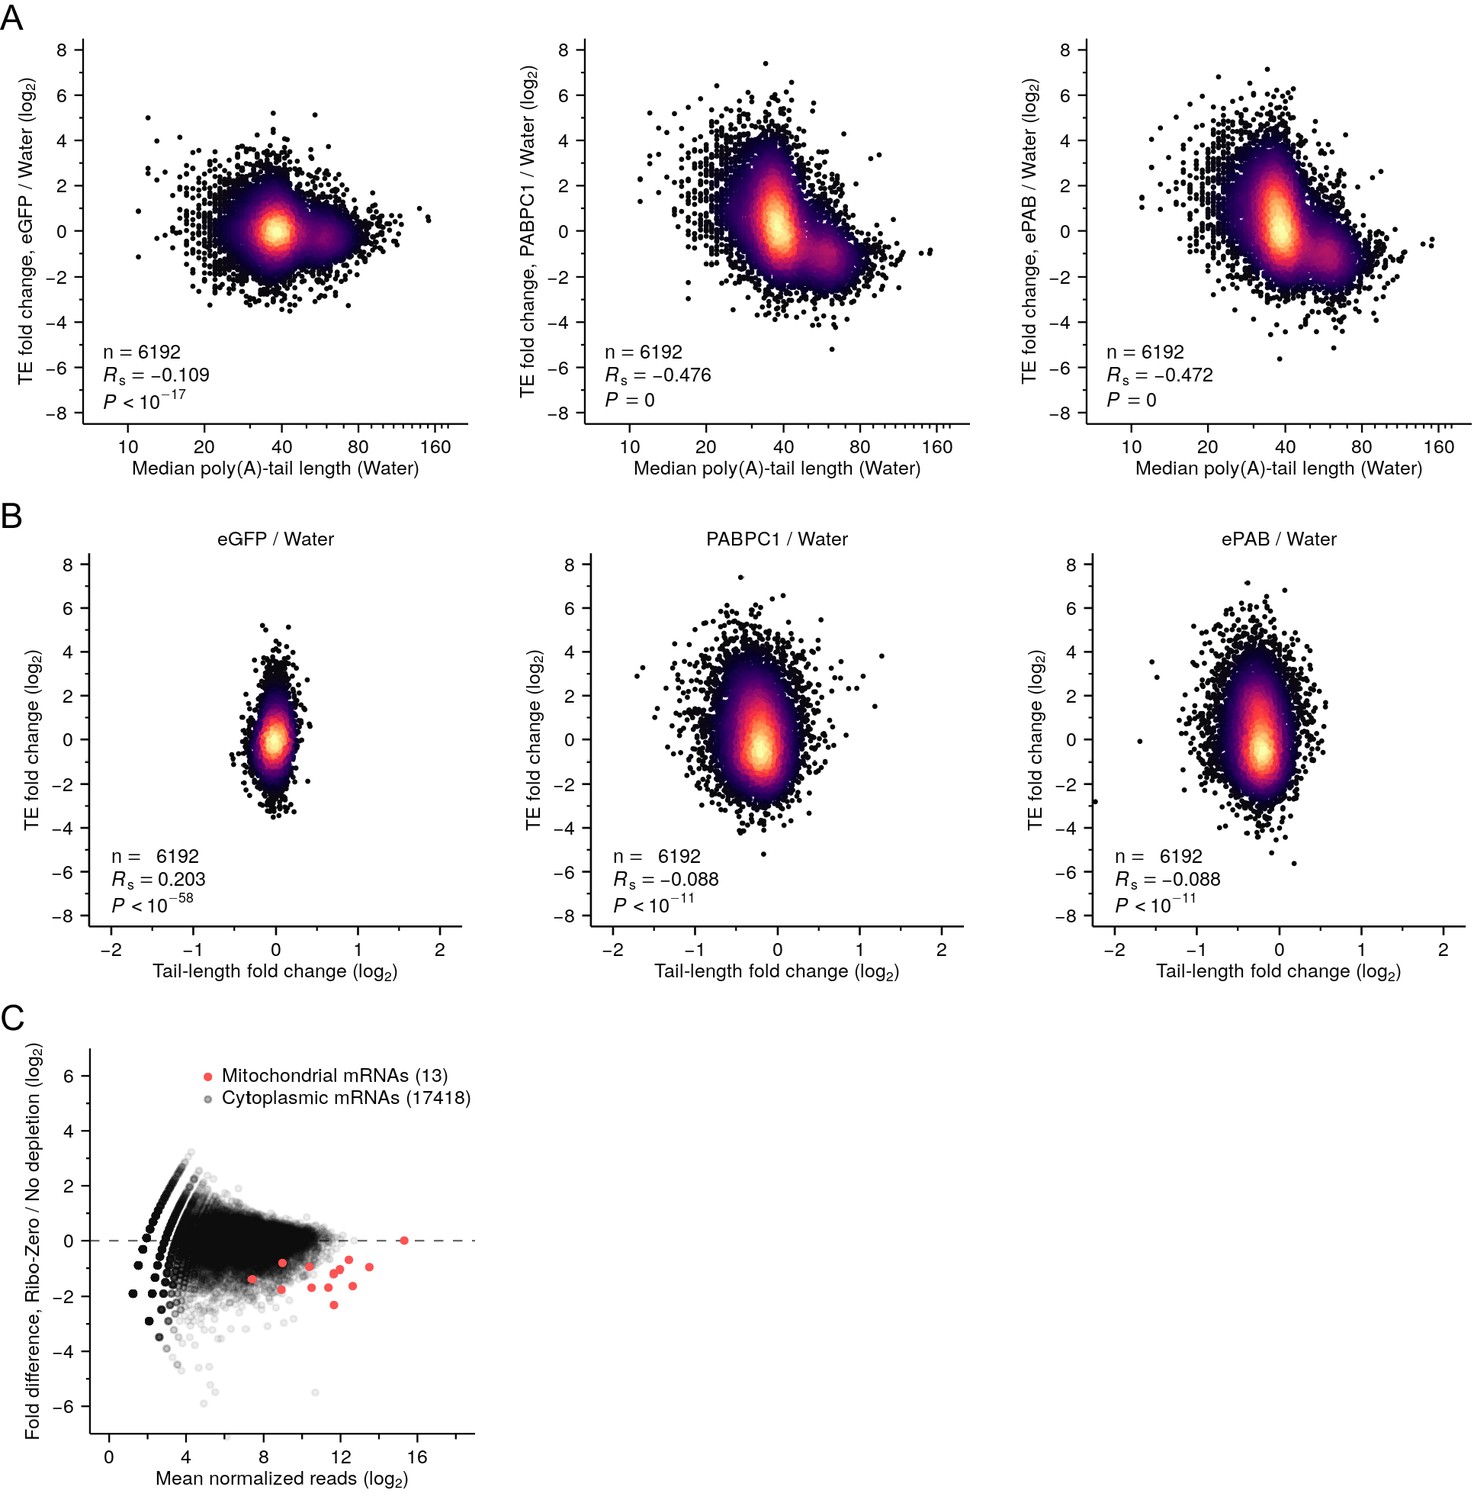
(A) The effect of PABPC on coupling between tail length and TE in frog oocytes. Shown is the relationship between TE and median poly(A)-tail length in oocytes injected with either water or mRNAs encoding either eGFP, PABPC1, or ePAB (injecting 16 fmol mRNA per oocyte). Results are shown for mRNAs from genes with ≥100 poly(A) tags. Each poly(A) tag represents a pair of sequencing reads that identify the mRNA and its poly(A) tail length. Rs is the Spearman’s correlation coefficient. (B) A global increase in TE observed upon overexpressing ePAB. TE in ePAB-overexpressing oocytes is compared with TE in eGFP-expressing oocytes. Experiment was as in A, except rRNAs were not depleted, and TE values are normalized to those of mitochondrial mRNAs. Also shown are results from a co-injected short-tailed Nluc reporter and a long-tailed Fluc reporter. (C) Effect of expressing PABPC1 on protein synthesis in oocytes. At the left is a gel showing total protein after injection of either water or the indicated mRNA (injecting 4 fmol mRNA per oocyte), with or without treatment with cycloheximide (CHX), as visualized by Coomassie staining. At the right is the same gel showing protein synthesis, as visualized by incorporation of 35S-methionine and 35S-cysteine. Prominent bands presumably represent PABPC1, eGFP, and a not fully denatured form of eGFP (asterisk) expressed from injected mRNAs. (D) Quantification of the effect of expressing PABPC1 on protein synthesis in oocytes, as measured in (C) and two additional biological replicates. Only regions above the PABPC1 band, and between the PABPC1 band and the top eGFP band, were used for quantification. Values were normalized to that of the mean value from water-injected oocytes (error bars, standard deviation; p values, one-sided t-tests; n.s., not significant). (E) The preferential effect of overexpressing ePAB on the TE of short-tailed mRNAs. TE fold changes observed between ePAB-overexpressing and eGFP-expressing oocytes are plotted as a function of median tail length in eGFP-expressing oocytes. TE and tail-length values were obtained from different batches of oocytes; results are shown for mRNAs from genes with ≥100 poly(A) tags. TE values are normalized to those of mitochondrial mRNAs. (F) Effect of overexpressing ePAB on the distribution of TE values observed in frog oocytes. Shown is the TE distribution observed in ePAB-overexpressing oocytes and that observed in eGFP-expressing oocytes. Tail-length measurements in this figure were obtained using TAIL-seq.
-
Figure 2—source data 1
Source data for values shown in Figure 2D.
- https://cdn.elifesciences.org/articles/66493/elife-66493-fig2-data1-v1.xlsx
Figure 2—figure supplement 1
Increased PABPC increases translation of endogenous short-tailed mRNAs in frog oocytes.
(A) Increased relative translation of short-tailed mRNAs after overexpressing PABPC in oocytes. Shown for each gene with ≥100 poly(A) tags is the change in relative TE observed after overexpressing either eGFP, PABPC1 or ePAB, plotted as a function of median poly(A)-tail length in water-injected oocytes. (B) Poor correspondence between TE changes and tail-length changes after overexpressing PABPC in oocytes. TE changes of (A) are plotted as a function of median poly(A) tail-length changes. (C) Depletion of frog mitochondrial mRNAs by the Illumina Ribo-Zero Gold kit. Tail-length measurements in this figure were obtained using TAIL-seq.
Figure 3 with 1 supplement
Limiting PABPC is required for intragenic coupling between poly(A)-tail length and TE.
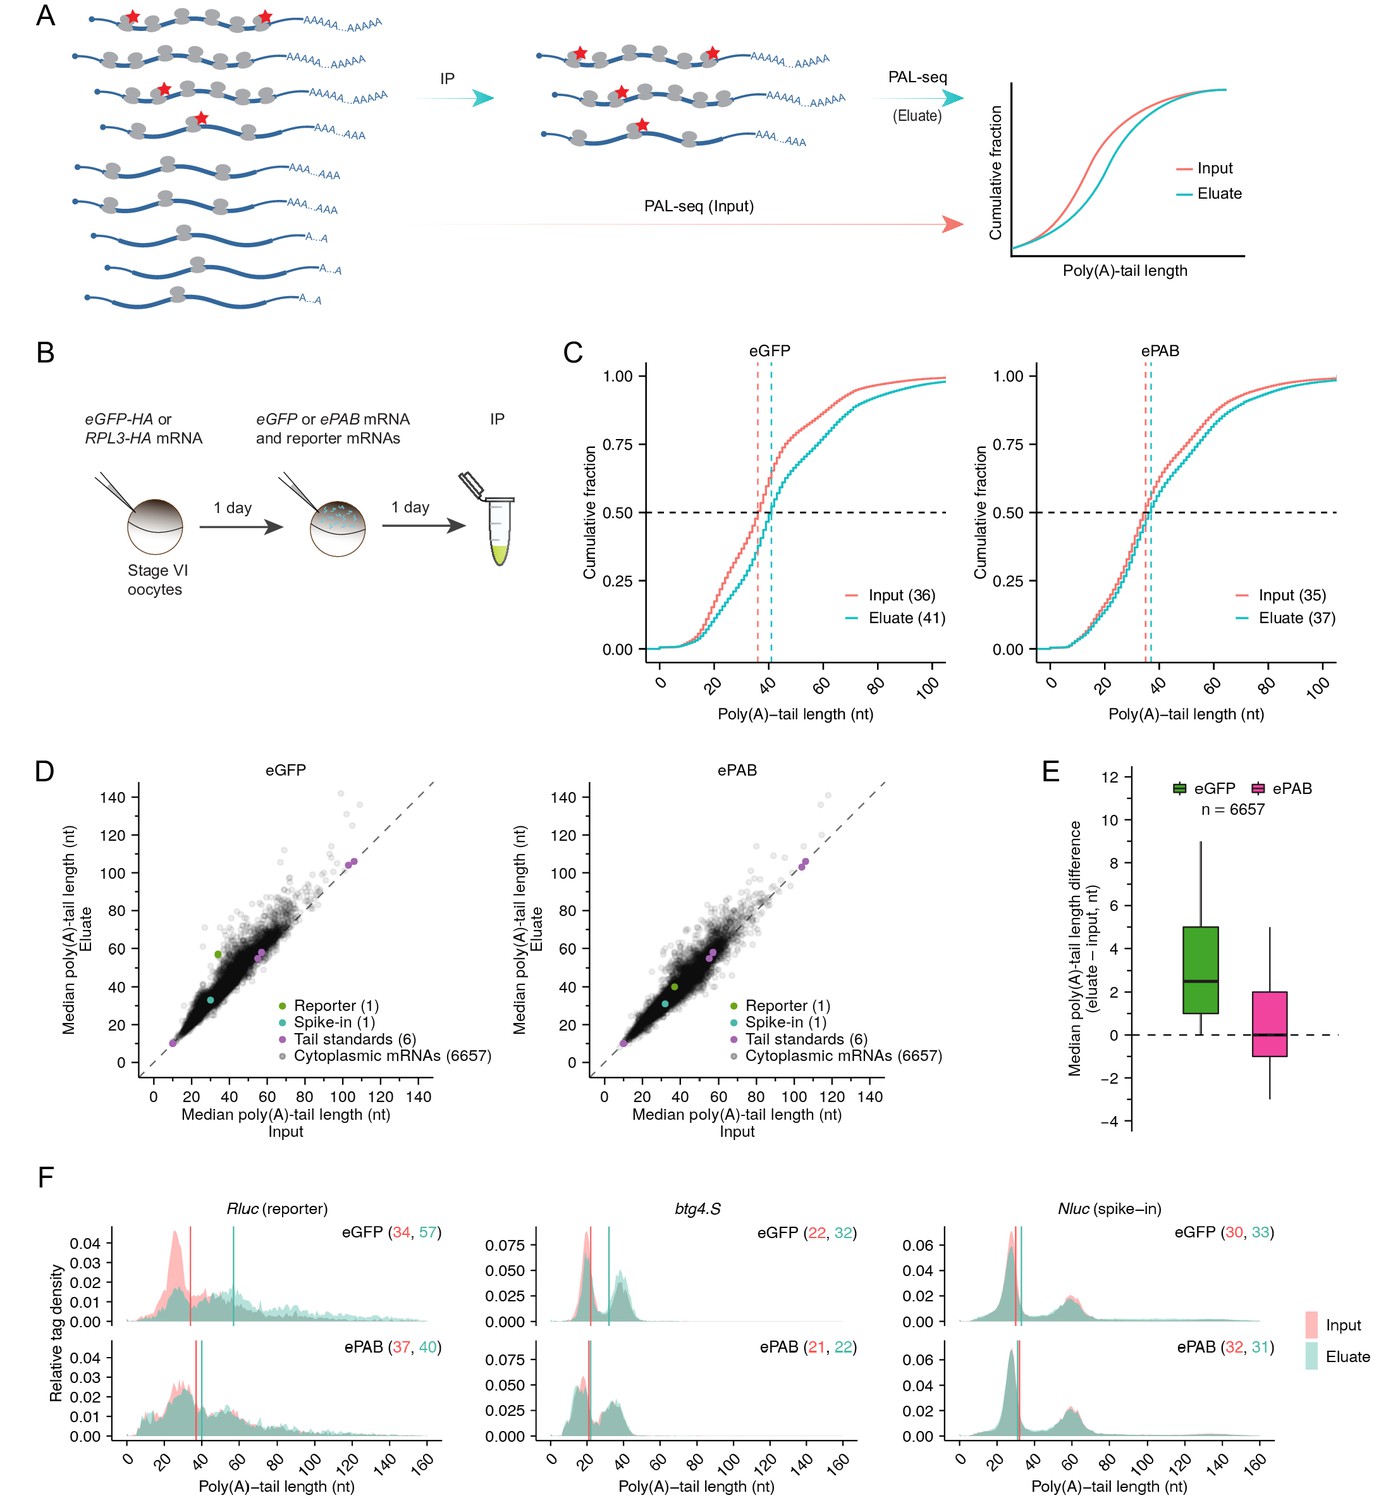
(A) The PAL-TRAP method for measuring intragenic effects of tail length on TE. Ribosomes are sparsely tagged (red stars) so that highly translated mRNAs are more likely to contain tagged ribosomes and thus be enriched in the immunoprecipitation (IP) eluate. Tail lengths of both input and eluate mRNAs were measured and compared for mRNAs of each gene. The depicted enrichment of long-tailed isoforms in the eluate indicates that poly(A)-tail length and TE are coupled, whereas no enrichment would indicate otherwise. (B) The experimental scheme of PAL-TRAP in frog oocytes. See Figure 3—figure supplement 1B–C for results from pulldowns using the eGFP-HA control. (C) Effect of overexpressing ePAB on coupling between tail length and TE, as detected after pooling PAL-TRAP results for mRNAs from different genes. Plotted are cumulative distributions of poly(A)-tail lengths in the PAL-TRAP input and eluate obtained after expressing either eGFP (left) or ePAB (right) in oocytes (injecting 4 fmol mRNA per oocyte). Median values are indicated (dashed lines) and listed in parentheses. (D) The effect of overexpressing ePAB on intragenic coupling between tail length and TE. Plotted for each mRNA isoform is the median poly(A)-tail length of mRNAs in the PAL-TRAP eluate compared to that in the input. Shown are results for mRNAs from oocytes either expressing eGFP or overexpressing ePAB (left and right, respectively). Each point represents an mRNA isoform with a unique 3′ end represented by ≥100 poly(A) tags in both input and eluate. Also indicated are results for (1) an Rluc reporter mRNA possessing a variable-length tail (reporter), which was co-injected with mRNAs expressing either eGFP or ePAB, (2) an mRNA with a variable-length tail, which was spiked into the lysate immediately before IP (spike-in), and (3) synthetic RNAs with defined tail lengths added to samples prior to library preparation (tail standards). Points for eight standards with longer tails fell outside the plot areas, as did a point representing the mRNA 3′-end from one gene (uqcrb.S) in the ePAB sample. (E) Summary of differences in median tail lengths observed between the eluate and the input of mRNA isoforms shown in (D). Box and whiskers indicate the 10th, 25th, 50th, 75th, and 90th percentiles. (F) Effect of overexpressing ePAB on intragenic tail-length distributions in frog oocytes. Shown are tail-length distributions of the reporter Rluc (left), an endogenous oocyte mRNA btg4.S (middle), and the spike-in mRNA Nluc (right) in eGFP-expressing (top) or ePAB-overexpressing (bottom) oocytes. Median tail-length values are indicated (vertical lines) and listed in parentheses. Tail-length measurements in this figure were obtained using PAL-seq v3.
Figure 3—figure supplement 1
Supporting data for PAL-TRAP analyses in frog oocytes.
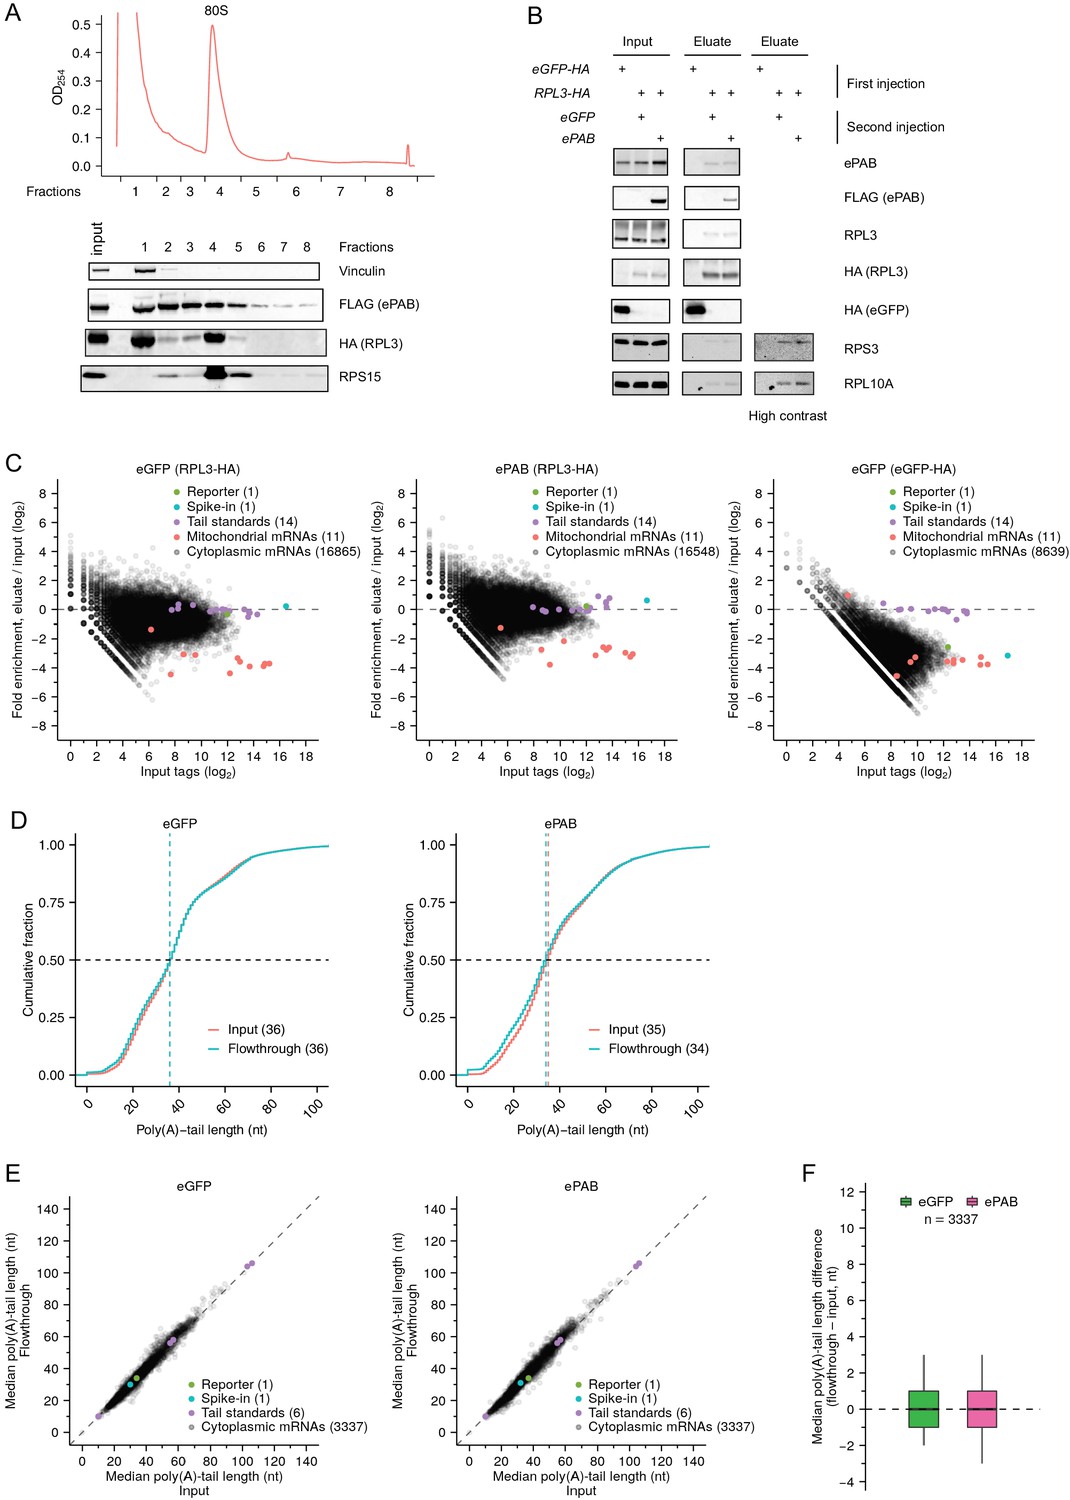
(A) Incorporation of HA-tagged RPL3 into ribosomes. At the top is a sucrose-gradient polysome profile from frog oocytes injected with mRNAs encoding HA-tagged RPL3 and FLAG-tagged ePAB. At the bottom is a western blot of fractions collected from the polysome profile and probed for the indicated proteins. (B) Western-blot analysis of proteins in the input and eluate of PAL-TRAP experiments. Labels at the top show mRNAs that were injected into oocytes to overexpress the indicated proteins. (C) Fold enrichment in the PAL-TRAP analysis (eluate over input) as a function of expression (tags in the input) for each mRNA isoform with a unique 3′ end. Poly(A) tags were normalized to the spike-in tail-length standards. Poly(A) tags for bicistronic mitochondrial mRNAs (mt-atp6 and mt-atp8, and mt-nd4 and mt-nd4l) were merged. Also shown are results from a co-injected reporter mRNA, a spike-in mRNA, and tail-length standards, as in Figure 3D. Cytoplasmic mRNAs were enriched by HA-IP in RPL3-HA-expressing oocytes, as shown by relative depletion of mitochondrial mRNAs, which are not translated by cytoplasmic ribosomes. In contrast, almost all cytoplasmic mRNAs were depleted by HA-IP in eGFP-HA-expressing oocytes. (D) The similarity of PAL-TRAP results for input and flowthrough when pooling data for all mRNA isoforms. Otherwise, this panel is as in Figure 3C. (E) The similarity of PAL-TRAP results for input and flowthrough when examining data for individual mRNA isoforms. Otherwise, this panel is as in Figure 3D. (F) Summary of differences in median tail lengths observed between the flowthrough and the input for mRNA isoforms represented in (E). Otherwise this panel is as in Figure 3E. Tail-length measurements in this figure were obtained using PAL-seq v3.
Figure 4 with 3 supplements
PABPC depletion causes premature decay of shorter-tail cytoplasmic mRNAs in HeLa cells.
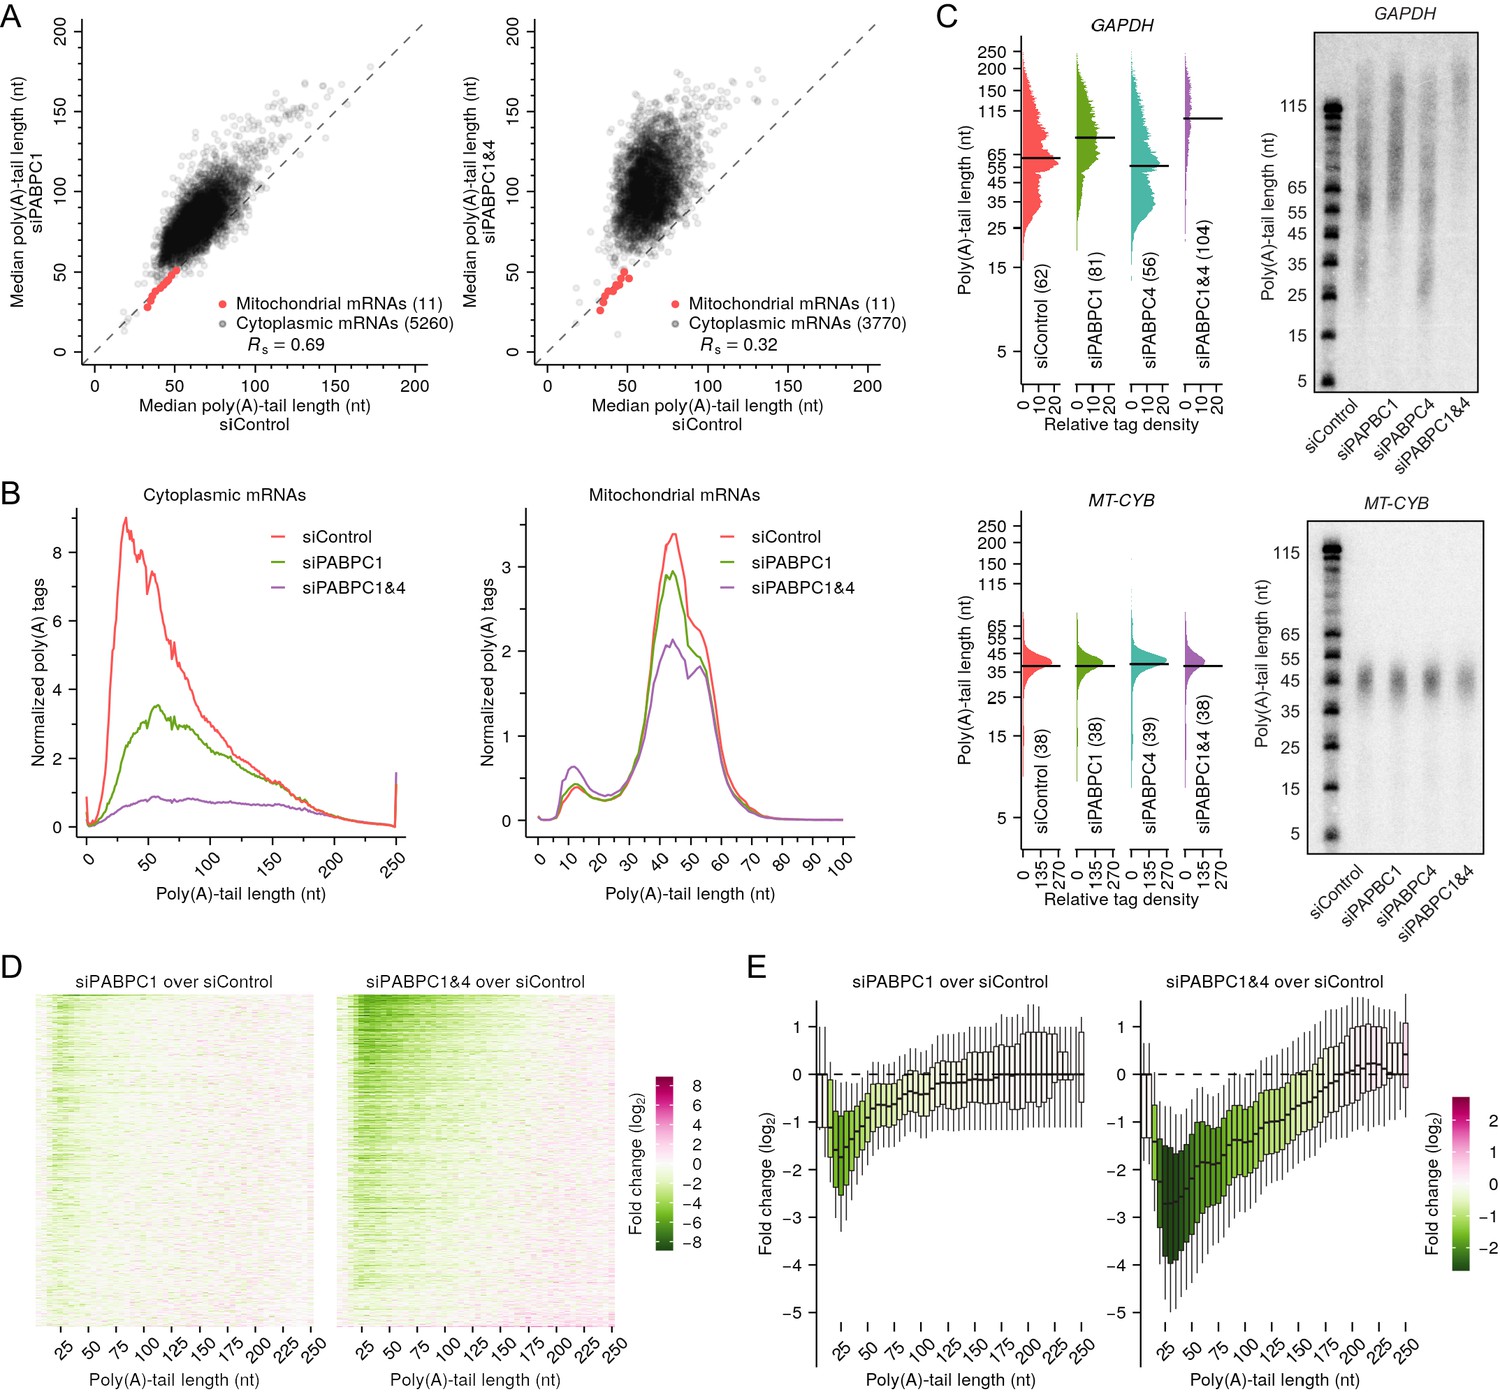
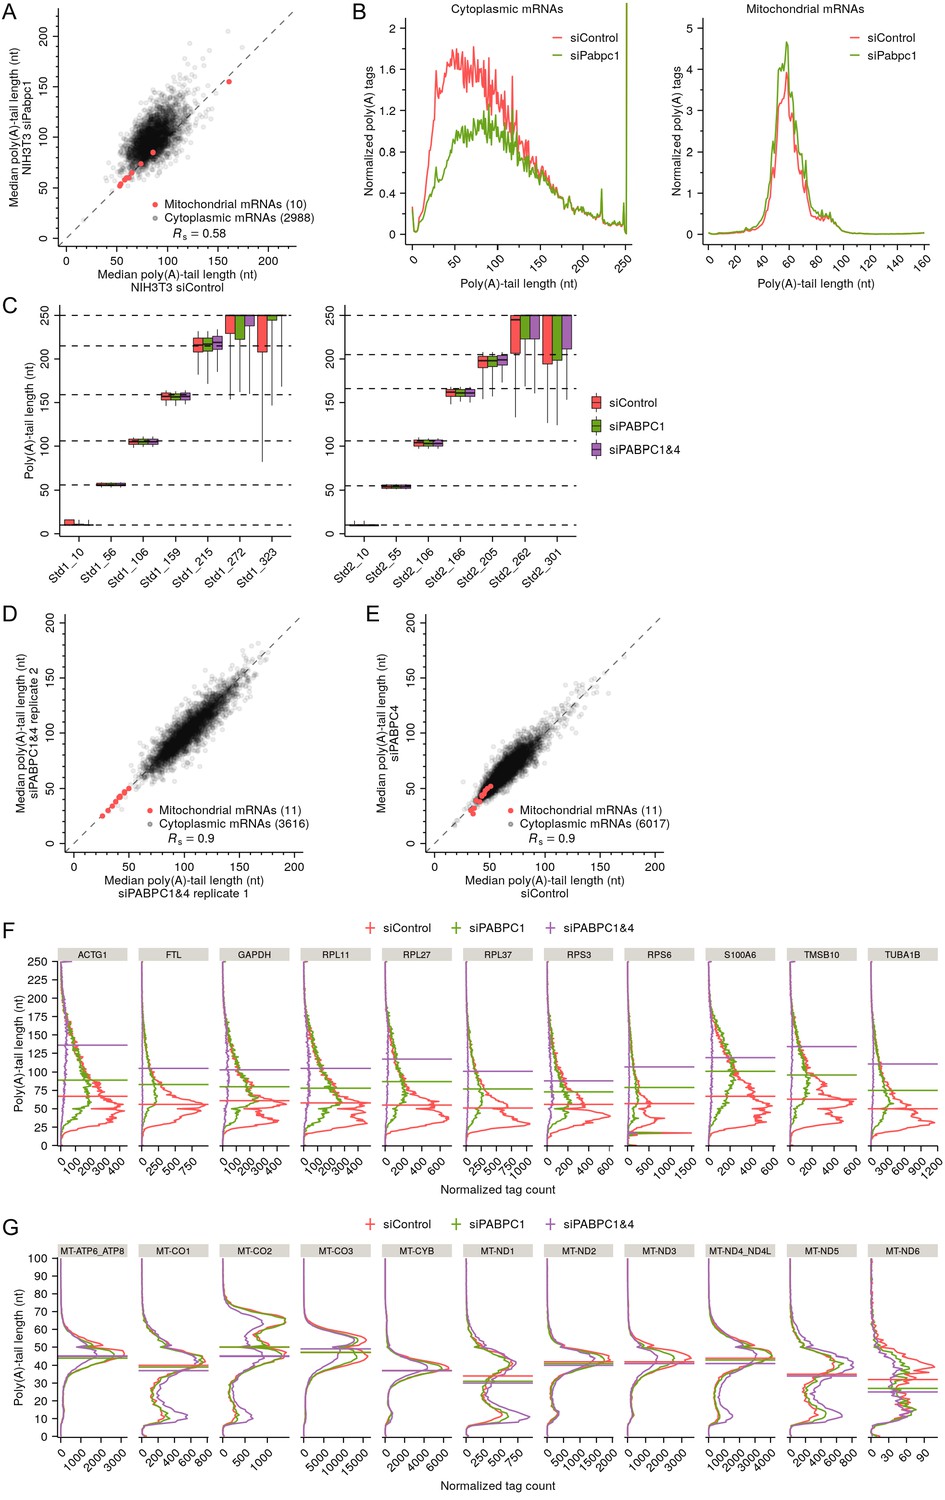
(A) The effect of PABPC knockdown on poly(A)-tail length. The plots compare median poly(A)-tail lengths in either PABPC1-knockdown cells (left) or PABPC1 and PABPC4 double-knockdown cells (right) to those in control cells. Results are shown for cytoplasmic mRNAs with ≥100 poly(A) tags (gray) and for mitochondrial mRNAs (red), merging data for MT-ATP6 and MT-ATP8 and for MT-ND4 and MT-ND4L, which are bicistronic mitochondrial mRNAs. (B) The effect of PABPC knockdown on the abundance of mRNAs with different tail lengths. Shown are tail-length distributions of all cytoplasmic (left) and mitochondrial (right) mRNA poly(A) tags in control, PABPC1-knockdown, and double-knockdown cells. For each distribution, the abundance of tags was normalized to that of the spike-in tail-length standards. Due to depletion of tail-length calling at position 50, which was associated with a change in laser intensity at the next sequencing cycle, the values at this tail length were replaced with the average of values at tail lengths 49 and 51 nt. (C) The effect of PABPC knockdown on the abundance of mRNAs with different tail lengths, comparing tail-lengths measured by sequencing (left) with those observed on RNase H northern blots (right). Results are shown for a cytoplasmic mRNA GAPDH (top) and a mitochondrial mRNA MT-CYB (bottom). Relative tag density was calculated by log-transforming linear tag density using normalized poly(A) tag counts. Median tail-length values are indicated (horizontal lines) and listed in parentheses. For RNase H northern blots, a DNA oligonucleotide complimentary to the 3′-UTR was used to direct cleavage of the target mRNA by RNase H, leaving a 35-nt fragment of the 3′-UTR appended to the poly(A) tail, which was resolved on a denaturing gel and detected by a radiolabeled probe. Tail lengths indicated along the left side of each gel are inferred from lengths of size markers. (D) The effect of PABPC knockdown on the abundance of mRNAs with different tail lengths, extending the intragenic analysis to tail-length distributions from thousands of genes. Heat maps compare poly(A)-tag levels in PABPC1-knockdown (left) or double-knockdown (right) cells to those in control cells, after normalizing to spike-in tail-length standards, as measured using tail-length sequencing. Each row represents mRNAs from a different gene, and rows are sorted based on fold change of mRNA abundance measured using RNA-seq. Only genes with ≥100 poly(A) tags in each of two samples being compared were included in the analyses (n = 5504). Columns represent values from 5-nt tail-length bins ranging from 0 to 244 nt and a 6-nt bin ranging from 245 to 250 nt. Tile color indicates the fold change of normalized tag counts (key). (E) The effect of PABPC knockdown on the abundance of mRNAs with different tail lengths, reanalyzing data from (D) to show distributions of poly(A)-tag changes observed at different tail-lengths. Each box-whisker shows the 10th, 25th, 50th, 75th, and 90th percentile of fold changes in normalized poly(A)-tag counts observed for each tail-length bin of (D). The color of each box indicates the median value (key). Tail-length measurements in this figure were obtained using TAIL-seq.
Figure 4—figure supplement 1
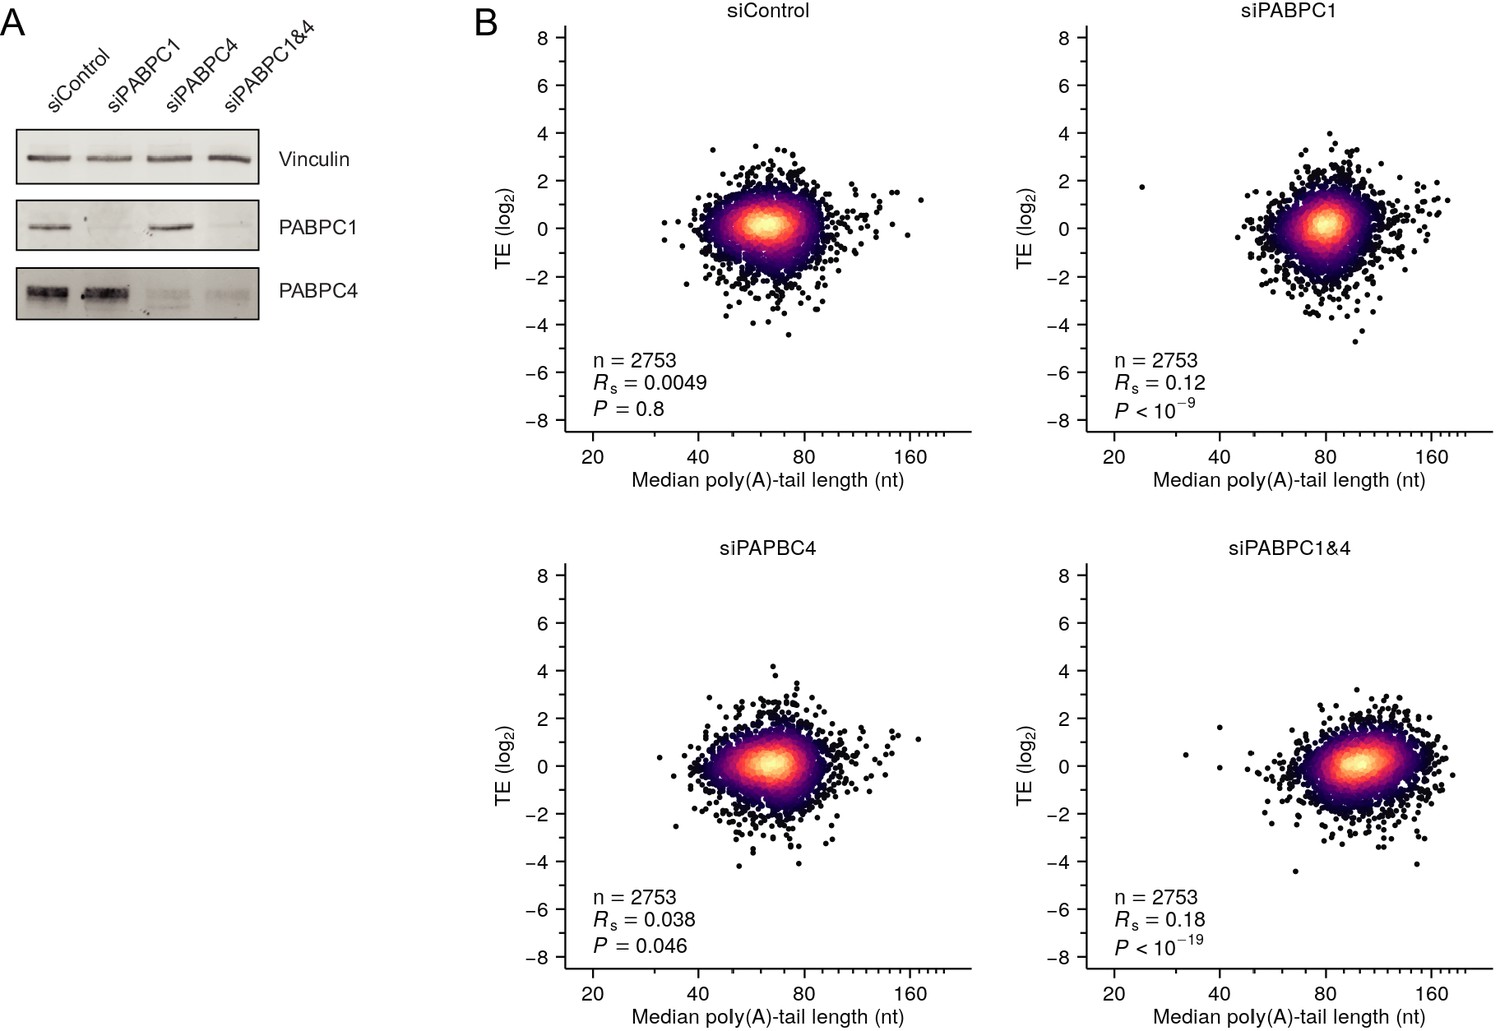
PABPC depletion is not sufficient to establish strong coupling between poly(A)-tail length and TE in HeLa cells.
(A) Western blot showing siRNA-mediated depletion of PABPC1 and PABPC4 in HeLa cells. (B) The effect of depleting PABPC on coupling between tail length and TE in HeLa cells. Shown is the relationship between TE and median poly(A)-tail length after transfecting HeLa cells with the indicated siRNAs. A point representing the mRNA from one gene (SPECC1) fell outside the plot area in the PABPC1 and PABPC4 double-knockdown sample. Otherwise, this panel is as in Figure 2A. Tail-length measurements were obtained using TAIL-seq.
Figure 4—figure supplement 2
Support and extension of experiments showing that PABPC depletion causes premature decay of short-tailed mRNAs in HeLa cells.
(A) The effect of PABPC knockdown on poly(A)-tail length in NIH3T3 cells. The plot compares median poly(A)-tail length in PABPC1-knockdown cells to that in control cells. Results are shown for mRNAs with ≥100 poly(A) tags (gray) and for mitochondrial mRNAs (red), merging data for Mt-atp6 and Mt-atp8 and for Mt-nd4 and Mt-nd4l, which are bicistronic mitochondrial mRNAs, and excluding data for Mt-nd6, which does not have a poly(A) tail. (B) The effect of PABPC knockdown on the abundance of mRNAs with different tail lengths in NIH3T3 cells. Shown are tail-length distributions of all cytoplasmic (left) and mitochondrial (right) mRNA poly(A) tags in control and PABPC1-knockdown cells. For each distribution, the abundance of tags was normalized to that of the spike-in tail-length standards. (C) The quality of the tail-length measurements, as determined using internal tail-length standards. Boxplots summarizing poly(A) tail-length distributions of two sets of tail-length standards spiked into total RNA samples obtained from HeLa cells transfected with the indicated siRNAs. Each box-whisker shows the 10th, 25th, 50th, 75th, and 90th percentile of poly(A)-tail lengths. The dashed horizontal lines represent median tail lengths of individual standards, as determined by mobility in denaturing gels (Subtelny et al., 2014). (D) Reproducibility of tail-length measurements. The plot compares median poly(A)-tail lengths from two replicates of the double-knockdown HeLa cells, merging data for MT-ATP6 and MT-ATP8 and for MT-ND4 and MT-ND4L, which are bicistronic mitochondrial mRNAs. (E) The effect of PABPC4 knockdown on poly(A)-tail length in HeLa cells. The plot compares median poly(A)-tail length in PABPC4-knockdown cells to that in control cells. Results are shown for mRNAs with ≥100 poly(A) tags (gray) and for mitochondrial mRNAs (red), merging data for MT-ATP6 and MT-ATP8 and for MT-ND4 and MT-ND4L, which are bicistronic mitochondrial mRNAs. (F) The effect of PABPC knockdown on the tail-length distributions of top-expressed cytoplasmic mRNAs in HeLa cells. Plotted for mRNAs from each of the indicated genes are tail-length distributions in control, PABPC1- and double-knockdown cells, indicating median values with horizontal lines. For each distribution, the abundance of tags was normalized to that of the spike-in tail-length standards. (G) The effect of PABPC knockdown on the tail-length distributions of mitochondrial mRNAs in HeLa cells. Data were merged for MT-ATP6 and MT-ATP8 and for MT-ND4 and MT-ND4L, which are bicistronic mitochondrial mRNAs. Otherwise, this panel is as in (F). In this figure, tail-length measurements were obtained using PAL-seq v3 (A–B) and TAIL-seq (C–G).
Figure 4—figure supplement 3
Measurements of mRNA half-lives in PABPC-depleted HeLa cells.
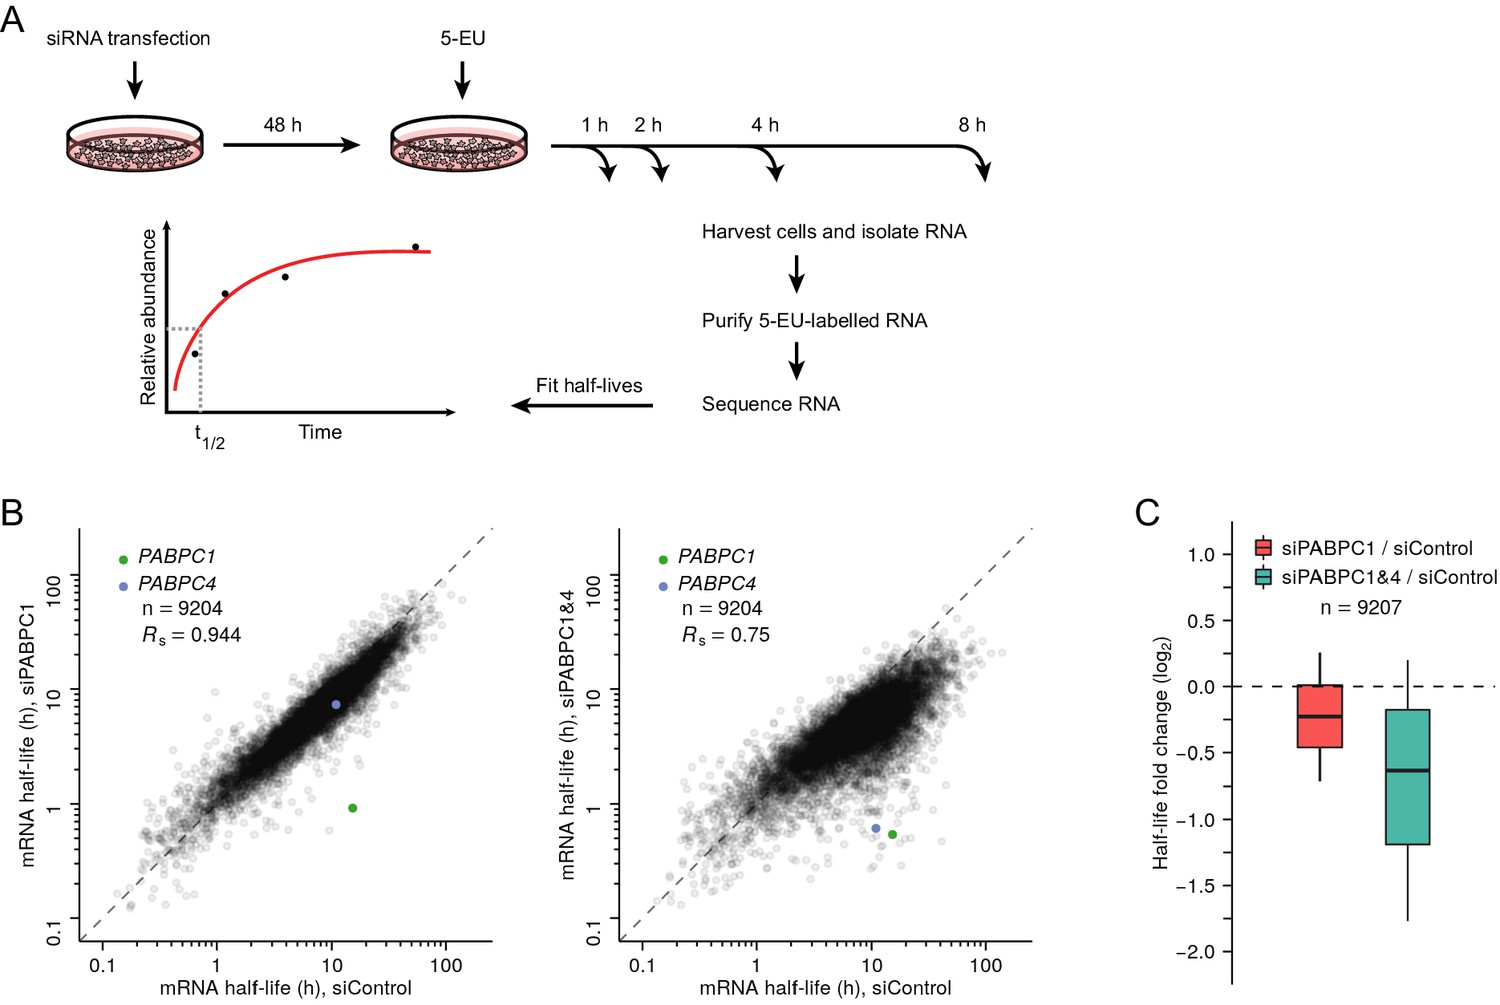
(A) Experimental scheme for measuring mRNA half-lives in HeLa cells. siRNA-transfected cells were incubated with 5-ethynyl uridine (5-EU), and cytoplasmic mRNA was harvested at the indicated time points. 5-EU-labeled RNA was biotinylated, isolated, and sequenced, using spike-in standards to normalize results from different time points. For labeled mRNA isolated from each gene, the approach to equilibrium was then fit to obtain its half-life. (B) The effect of PABPC knockdown on cytoplasmic mRNA half-lives in HeLa cells. For each gene, the mRNA half-life in PABPC1-knockdown cells (left) or in double-knockdown cells (right) is compared to that in control cells. Points representing mRNAs from three genes RHOB, TSC22D3, PLEKHO2 fell outside the plot areas. (C) Distribution of the effects of PABPC knockdown on mRNA stability. Boxplots summarize the fold differences of mRNA half-lives observed in (B) (including three genes that fell outside the plot areas) when comparing PABPC1-knockdown or double-knockdown cells with control cells. Each box-whisker shows the 10th, 25th, 50th, 75th, and 90th percentile.
-
Figure 4—figure supplement 3—source data 1
Source data for mRNA half-life values shown in Figure 4—figure supplement 3B–C.
- https://cdn.elifesciences.org/articles/66493/elife-66493-fig4-figsupp3-data1-v1.xlsx
Figure 5 with 1 supplement
Depletion of TUT4 and TUT7 attenuates premature decay of mRNA caused by PABPC depletion.
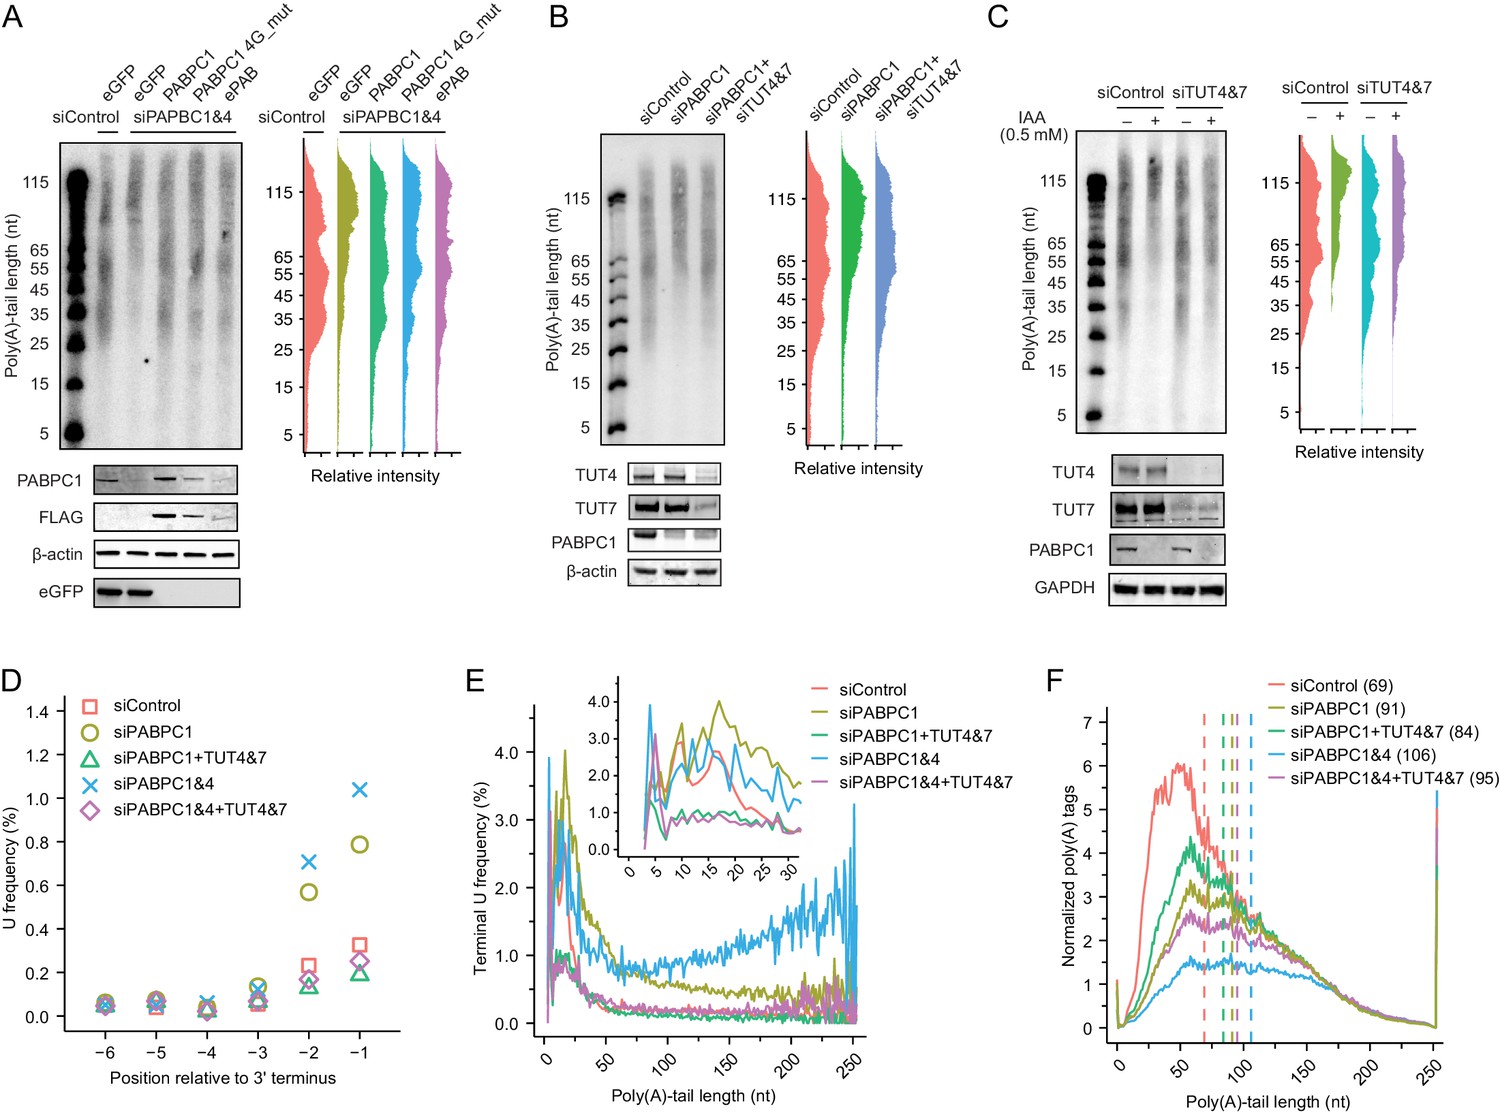
(A) Rescue of loss of shorter-tail mRNAs in PABPC-depleted HeLa cells by expressing either an siRNA-resistant human PABPC1, an siRNA-resistant PABPC1 coding for a mutant that does not bind eIF4G (4G_mut), or an siRNA-resistant frog ePAB. At the top left is an RNase H northern blot probed for GAPDH, as in Figure 4C. At the top right are the intensity levels quantified from the blot. At the bottom is a western blot probed for the indicated proteins or the FLAG tag appended to the C terminus of each of the expressed PABPC proteins. (B) Partial rescue of loss of shorter-tail mRNAs in PABPC-depleted HeLa cells by knocking down TUT4 and TUT7. At the top left is an RNase H northern blot probed for GAPDH, as in Figure 4C. At the top right are the intensity levels quantified from the blot. At the bottom is a western blot probed for the indicated proteins. (C) Partial rescue of loss of shorter-tail mRNAs in PABPC-depleted HCT116 cells by knocking down TUT4 and TUT7. Endogenous PABPC1 was tagged with AID, and IAA was added for 24 hr to target the fusion protein for degradation. Otherwise, this panel is as in (B). (D) The effect of PABPC knockdown and TUT knockdown on terminal uridylation. Plotted is the fraction of uridines near the termini of cytoplasmic mRNAs in HeLa cells transfected with the indicated siRNAs, as measured using tail-length sequencing. (E) The effect of PABPC knockdown and TUT knockdown on terminal uridylation of tails with different lengths. Shown is terminal uridylation frequency of cytoplasmic mRNAs as a function of poly(A)-tail length in HeLa cells transfected with the indicated siRNAs, as measured using tail-length sequencing. The inset shows a higher-resolution view of the short-tail region. (F) Partial rescue of loss of shorter-tail cytoplasmic mRNAs in PABPC-depleted HeLa cells by knocking down TUT4 and TUT7, extending the analysis to all poly(A) tags. Plotted are tail-length distributions from HeLa cells transfected with the indicated siRNAs. For each distribution, tag counts were normalized to spike-in tail-length standards. Median values are indicated (dashed lines) and listed in parentheses. Tail-length measurements were obtained using PAL-seq v3.
Figure 5—figure supplement 1
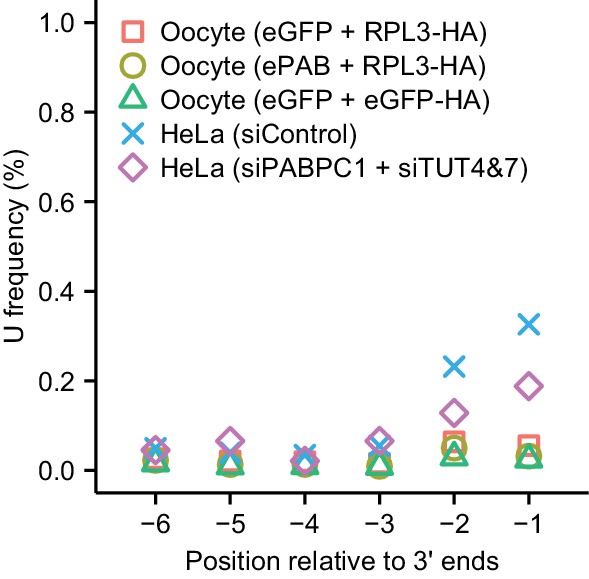
Minimal terminal uridylation activity in frog oocytes.
Plotted are the fractions of cytoplasmic mRNAs containing uridines near their termini, as detected in frog oocytes injected with mRNAs overexpressing the indicated proteins using tail-length sequencing. For comparison, results from HeLa cells transfected with the indicated siRNAs are replotted from Figure 5D.
Figure 6 with 2 supplements
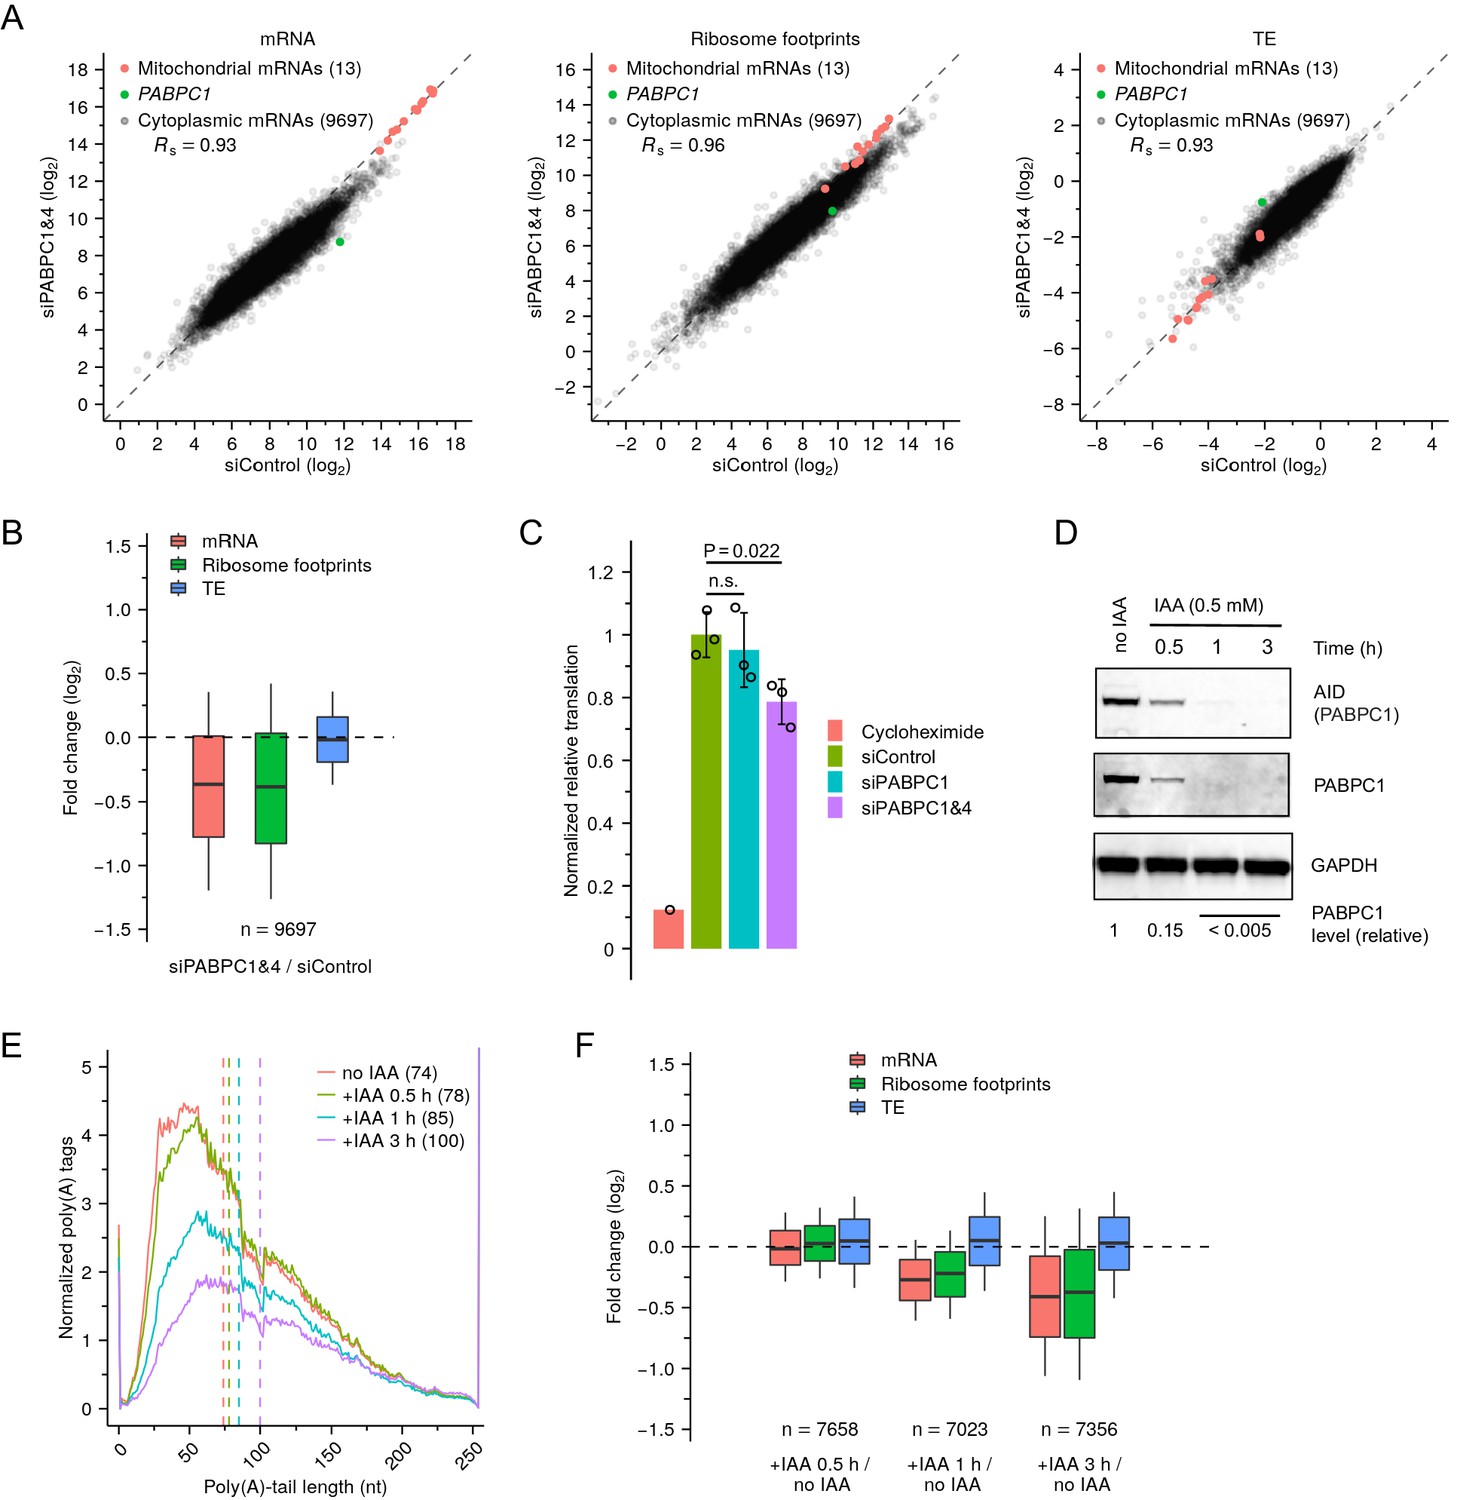
Depletion of PABPC in mammalian cell lines has minimal effect on TE.
(A) Effect of PABPC knockdown on mRNA abundance (left), ribosome-footprint abundance (middle) and TE (right) in HeLa cells, comparing values in double-knockdown cells to those in control cells. For each gene, values for mRNA and ribosome-footprint reads per kilobase are plotted after normalizing to measurements for mitochondrial mRNAs. (B) Distributions of the effects of PABPC double knockdown on mRNA abundance, ribosome-footprint abundance and TE. Each box-whisker shows the 10th, 25th, 50th, 75th, and 90th percentile of the fold changes observed in (A). (C) Effect of PABPC knockdown on protein synthesis in HeLa cells. Plotted are relative levels of protein synthesis measured by pulse puromycin incorporation 48 hr after transfection with the indicated siRNAs (Figure 6—figure supplement 1A; error bars, standard deviation of three biological replicates; p values, one-sided t-tests; n.s., not significant). (D) Western blot showing rapid degradation of PABPC1-AID fusion protein after adding IAA to genome-engineered HCT116 cells. PABPC1 protein levels were quantified by averaging signals for AID and PABPC1, after normalizing to that for GAPDH. (E) Effect of PABPC1 depletion on abundance of mRNAs with different tail lengths. Shown are tail-length distributions of all poly(A) tags obtained from cytoplasmic mRNAs of HCT116 PABPC1-AID cells after treatment with IAA for the indicated time. For each distribution, the abundance of tags was normalized to that of the spike-in tail-length standards. Median values are indicated (dashed lines) and listed in parentheses. Due to depletion of 101-nt tail lengths, which was associated with a change in laser intensity at the next sequencing cycle, the values at this length were replaced with the average of values at tail lengths 100 and 102 nt. (F) Summary of the effects of rapid PABPC1 depletion. For each gene, at each time point after adding IAA to HCT116 PABPC1-AID cells, values for mRNA abundance, ribosome-footprint abundance and TE were each compared to the value observed in cells not treated with IAA (Figure 6—figure supplement 1C), and the distribution of fold changes is plotted. Each box-whisker shows the 10th, 25th, 50th, 75th, and 90th percentile. Tail-length measurements were obtained using PAL-seq v4.
-
Figure 6—source data 1
- https://cdn.elifesciences.org/articles/66493/elife-66493-fig6-data1-v1.xlsx
Figure 6—figure supplement 1
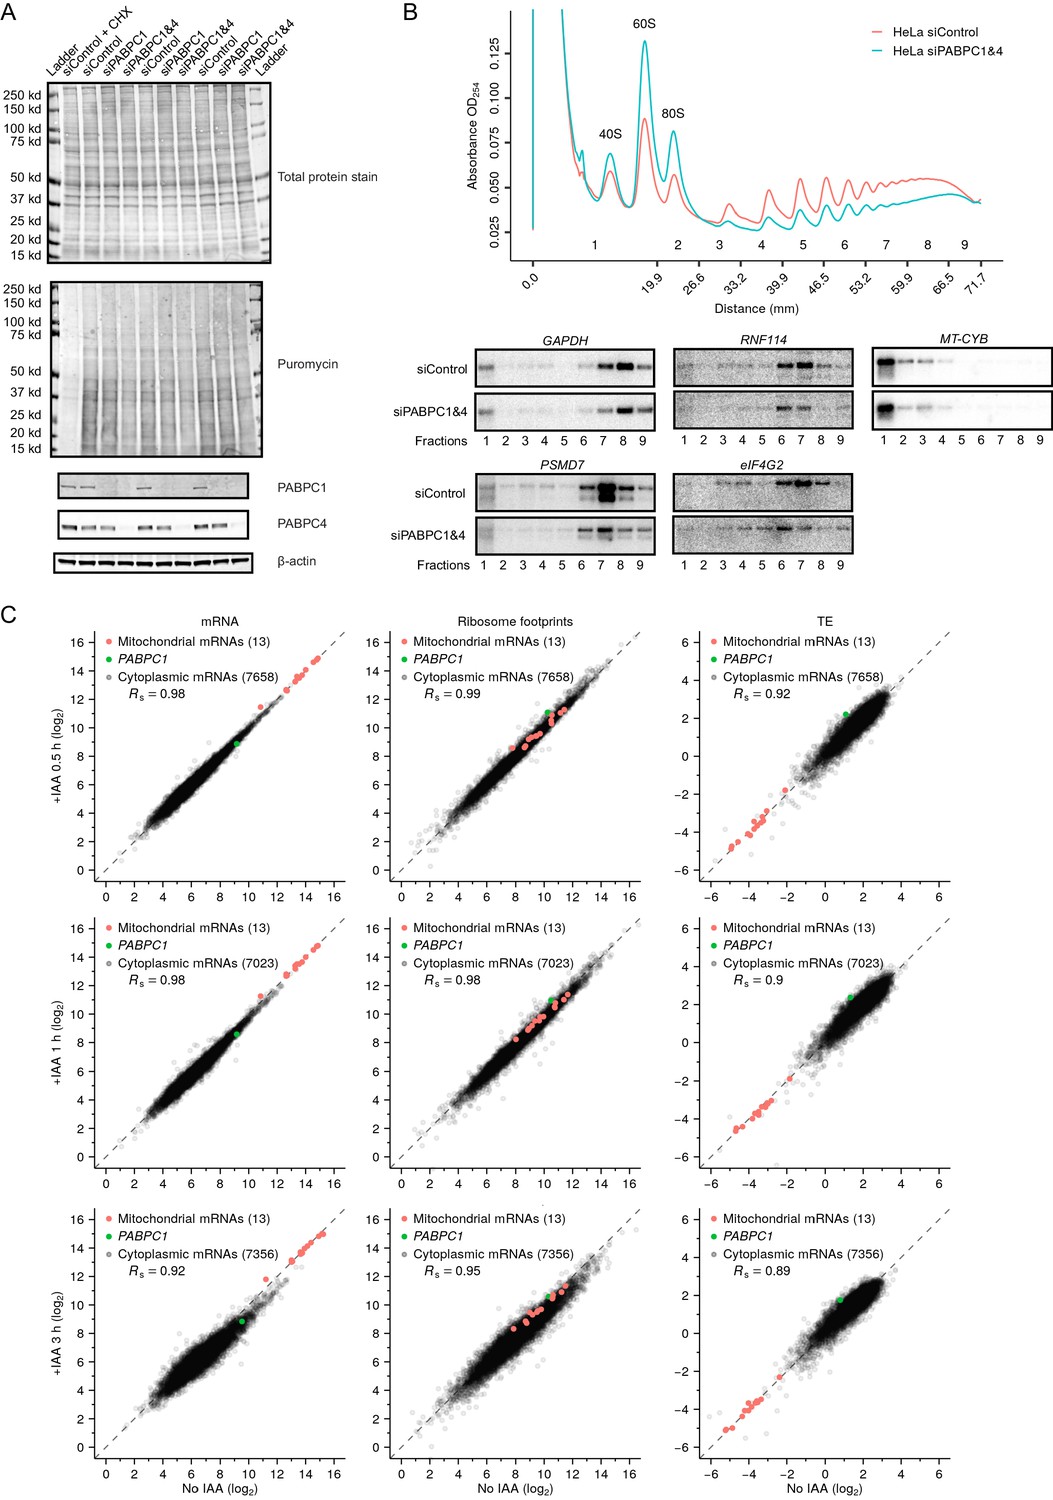
Depletion of PABPC in mammalian cell lines has minimal effect on TE.
(A) The effect of PABPC knockdown on protein synthesis in HeLa cells. Cells transfected with the indicated siRNAs were cultured for 48 hr, then treated with puromycin before harvesting for western-blot analysis. In a control sample, cycloheximide (CHX) was added prior to puromycin treatment. At the top is the membrane showing total protein levels. In the middle is the same membrane probed for puromycin to detect nascent protein synthesis. At the bottom are the results of the same membrane probed for the indicated proteins. (B) The effect of PABPC knockdown on polysomes in HeLa cells. At the top are polysome-gradient profiles from HeLa cells transfected with either control siRNAs or siRNAs targeting PABPC1 and PABPC4. At the bottom are northern blots analyzing RNA collected from gradient fractions shown at the top, probing for four cytoplasmic mRNAs and one mitochondrial mRNA (MT-CYB). (C) The early effects of rapid PABPC1 degradation on mRNA abundance (left), ribosome-footprint abundance (middle) and TE (right) in HCT116 PABPC1-AID cells. At the top, values from cells treated with IAA for 0.5 hr are compared to those from cells not treated with IAA. In the middle, values from cells treated with IAA for 1 hr are compared to those from cells not treated with IAA. At the bottom, values from cells treated with IAA for 3 hr are compared to those from cells not treated with IAA. For each gene, values for mRNA and ribosome-footprint reads per kilobase are plotted after normalizing to values for mitochondrial mRNAs. These results are summarized Figure 6F.
Figure 6—figure supplement 2
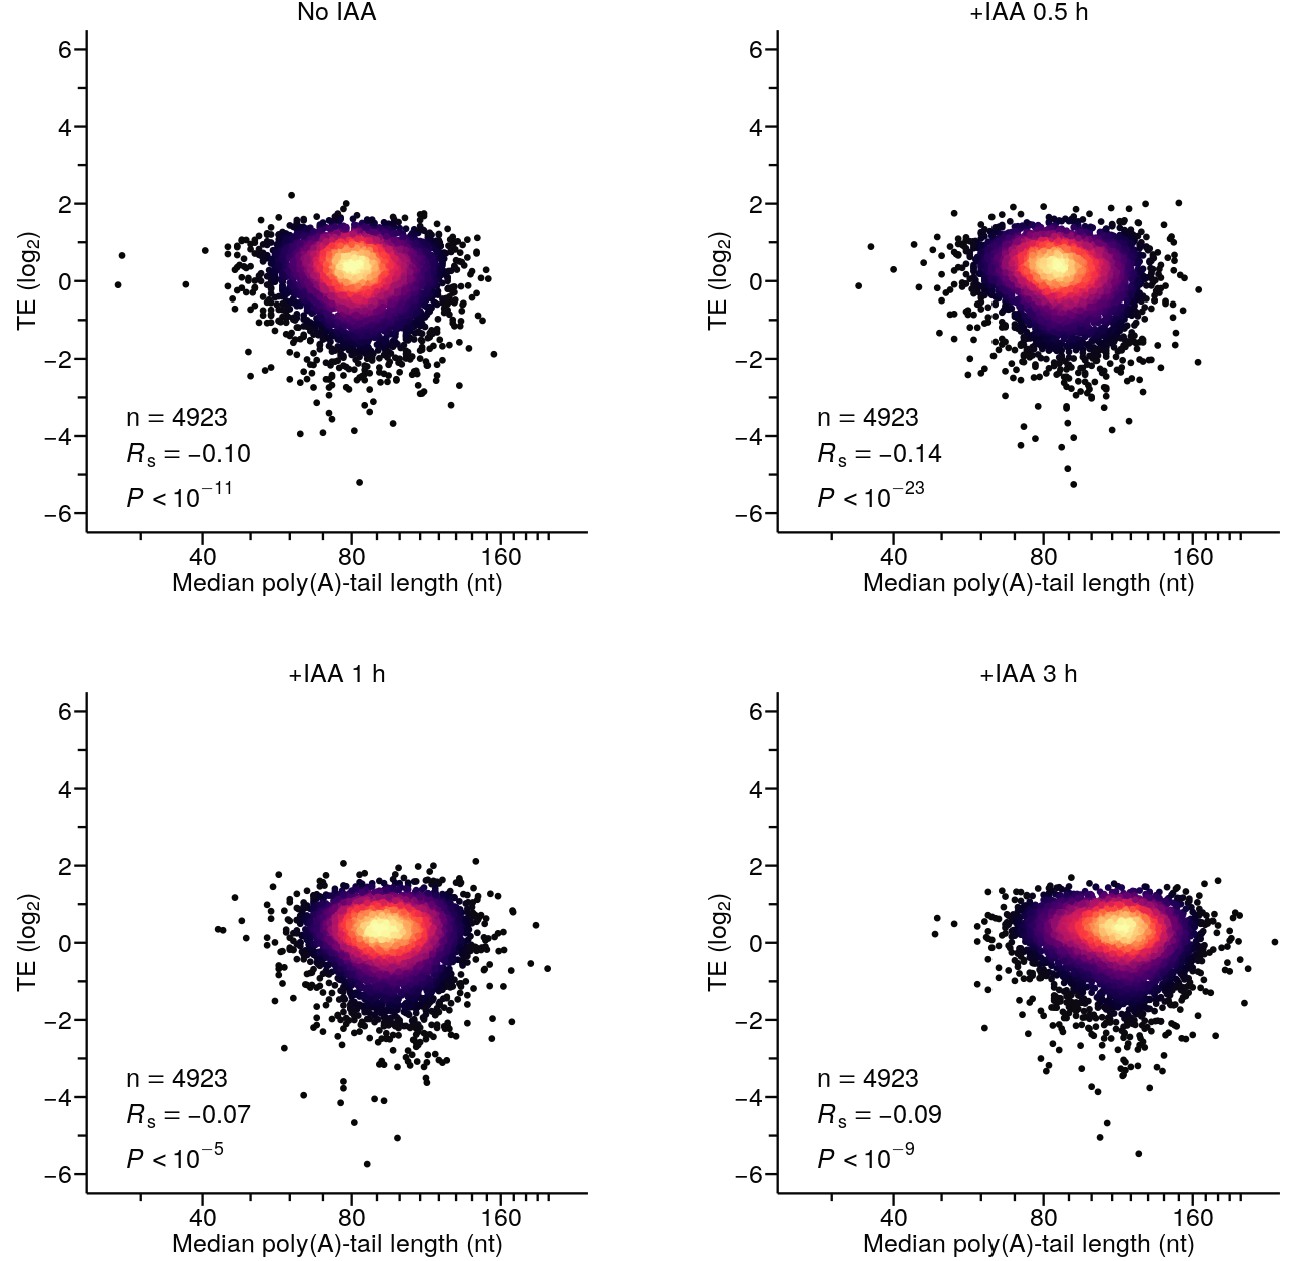
Rapid depletion of PABPC1 is not sufficient to establish detectable coupling between poly(A)-tail length and TE in HCT116 cells.
Shown is the relationship between TE and median poly(A)-tail length in cells that were either not treated with IAA, or treated with IAA and collected at the indicated time. Otherwise, this panel is as in Figure 2A. Tail-length measurements were obtained using PAL-seq v4.
Figure 7
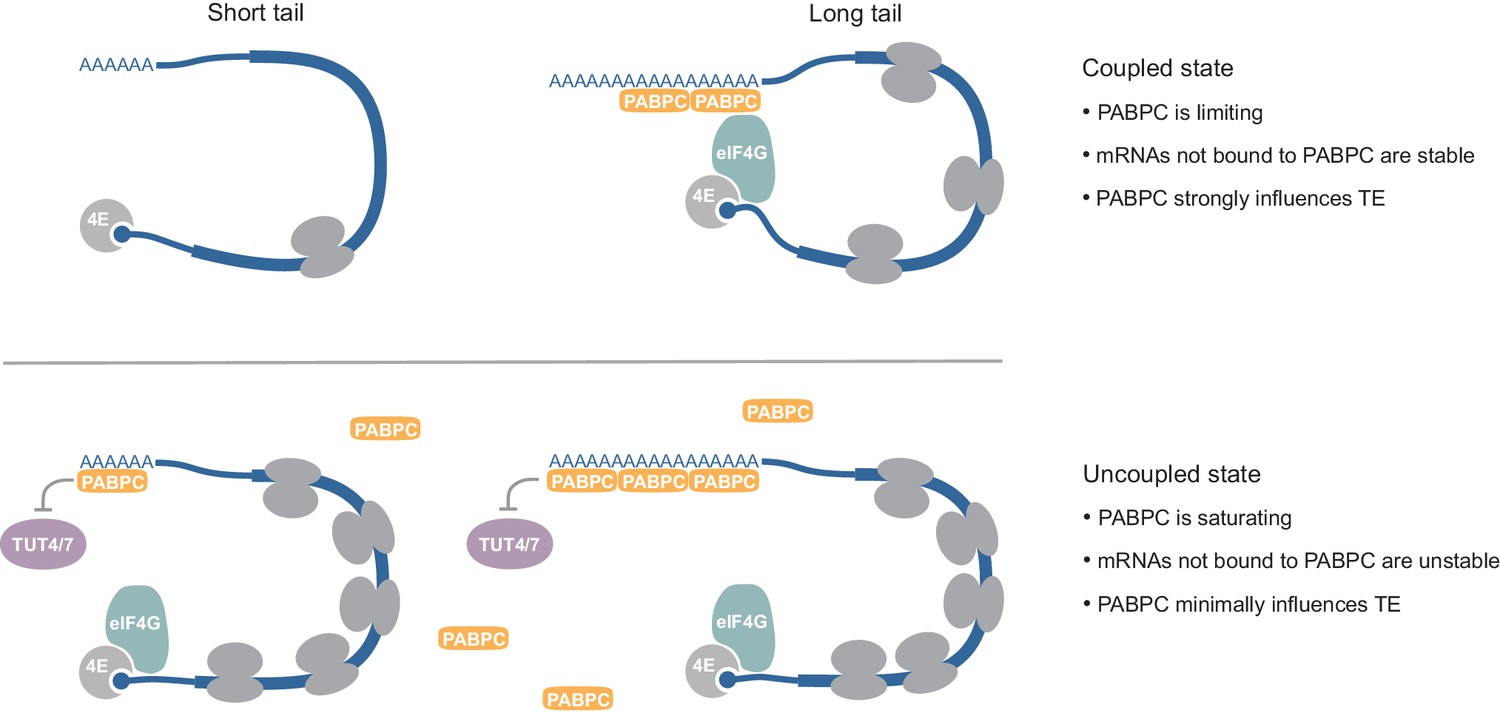
Model for coupling between poly(A)-tail length and TE, and context-dependent roles of PABPC.
See text for details.
Tables
Key resources table
| Reagent type (species) or resource | Designation | Source or reference | Identifiers | Additional information |
|---|---|---|---|---|
| Cell line (human) | HCT116 PABPC1-AID (sC152-C16) | This study | sC152-C16 | See Materials and methods for details |
| Cell line (human) | HCT116 PABPC1-AID (sC278-C2) | This study | sC278-C2 | See Materials and methods for details |
| Cell line (human) | HCT116 OsTIR | Natsume et al., 2016 | ||
| Cell line (human) | HeLa | Nam et al., 2014 | ||
| Cell line (human) | HeLa RPL3-3xHA (sC262-4) | This study | sC262-4 | See Materials and methods for details |
| Cell line (mouse) | NIH3T3 | Eisen et al., 2020 | ||
| Cell line (zebrafish) | ZF4 | ATCC (CRL-2050) | ||
| Antibody | Anti-β-actin (Rabbit monoclonal) | Cell Signalling Technology (D6A8) | 1:1000 dilution | |
| Antibody | Anti-AID (Mouse monoclonal) | MBL International (M214-3) | 1:1000 dilution | |
| Antibody | Anti-ePAB (Rabbit polyclonal) | Wilkie et al., 2005 | 1:2000 dilution | |
| Antibody | Anti-GFP (Mouse monoclonal) | Cell Signalling Technology (2955) | 1:1000 dilution | |
| Antibody | Anti-FLAG (Mouse monoclonal) | MilliporeSigma (F9291) | 1:1000 dilution | |
| Antibody | Anti-GAPDH (Mouse monoclonal) | Proteintech (60004) | 1:1000 dilution | |
| Antibody | Anti-HA (Mouse monoclonal) | Cell Signalling Technology (6E2) | 1:1000 dilution | |
| Antibody | Anti-PABPC1 (Rabbit polyclonal) | Cell Signalling Technology (4992S) | 1:1000 dilution | |
| Antibody | Anti-PABPC4 (Rabbit polyclonal) | Novus Biologicals (NB100-74594) | 1:1000 dilution | |
| Antibody | Anti-puromycin (Mouse monoclonal) | MilliporeSigma (MABE343) | 1:1000 dilution | |
| Antibody | Anti-RPL3 (Rabbit polyclonal) | Abcam (ab154882) | 1:1000 dilution | |
| Antibody | Anti-RPS15 (Rabbit polyclonal) | Proteintech (14957–1-AP) | 1:1000 dilution | |
| Antibody | Anti-RPS3 (Rabbit monoclonal) | Cell Signalling Technology (D50G7) | 1:1000 dilution | |
| Antibody | Anti-TUT4 (Rabbit polyclonal) | ABclonal (A5972) | 1:1000 dilution | |
| Antibody | Anti-TUT7 (Rabbit polyclonal) | Proteintech (25196–1-AP) | 1:1000 dilution | |
| Antibody | Anti-Vinculin (Mouse monoclonal) | Proteintech (66305) | 1:1000 dilution | |
| Antibody | IRDye 800CW Goat anti-Rabbit IgG (H + L) | LI-COR (926–32211) | 1:10,000 dilution | |
| Antibody | IRDye 680RD Goat anti-Mouse IgG | LI-COR (926–68070) | 1:10,000 dilution | |
| Sequence based reagent | All oligos | Supplementary file 1 | ||
| Recombinant DNA reagent | All plasmids | Supplementary file 2 | ||
| Other | Reference sequences | Supplementary file 3 | ||
| Other | Masked mitochondrial pseudogenes | Supplementary file 4 | ||
| Other | mRNA 3′-end annotations | Supplementary file 5 |
Additional files
-
Supplementary file 1
Oligonucleotides used in this study.
- https://cdn.elifesciences.org/articles/66493/elife-66493-supp1-v1.xlsx
-
Supplementary file 2
Plasmids used in this study.
- https://cdn.elifesciences.org/articles/66493/elife-66493-supp2-v1.xlsx
-
Supplementary file 3
Reference sequences.
- https://cdn.elifesciences.org/articles/66493/elife-66493-supp3-v1.xlsx
-
Supplementary file 4
Masked mitochondrial pseudogenes.
- https://cdn.elifesciences.org/articles/66493/elife-66493-supp4-v1.xlsx
-
Supplementary file 5
mRNA 3′-end annotations.
- https://cdn.elifesciences.org/articles/66493/elife-66493-supp5-v1.xlsx
-
Transparent reporting form
- https://cdn.elifesciences.org/articles/66493/elife-66493-transrepform-v1.docx
Download links
A two-part list of links to download the article, or parts of the article, in various formats.
Downloads (link to download the article as PDF)
Open citations (links to open the citations from this article in various online reference manager services)
Cite this article (links to download the citations from this article in formats compatible with various reference manager tools)
The molecular basis of coupling between poly(A)-tail length and translational efficiency
eLife 10:e66493.
https://doi.org/10.7554/eLife.66493


