Parathyroid hormone attenuates osteoarthritis pain by remodeling subchondral bone in mice
- Department of Orthopaedic Surgery, Institute of Cell Engineering, The Johns Hopkins University School of Medicine, United States
- Department of Orthopaedics, Shanghai Tenth People's Hospital, School of Medicine, Tongji University, China
- Department of Anesthesiology and Critical Care Medicine, The Johns Hopkins University School of Medicine, United States
- Department of Neuroscience, The Johns Hopkins University School of Medicine, Howard Hughes Medical Institute, United States
- Department of Neurosurgery, The Johns Hopkins University School of Medicine, Howard Hughes Medical Institute, United States
- Department of Dermatology, The Johns Hopkins University School of Medicine, Howard Hughes Medical Institute, United States
- Center of Sensory Biology, The Johns Hopkins University School of Medicine, Howard Hughes Medical Institute, United States
- Department of Biomedical Engineering, The Johns Hopkins University School of Medicine, United States
Figures
Figure 1
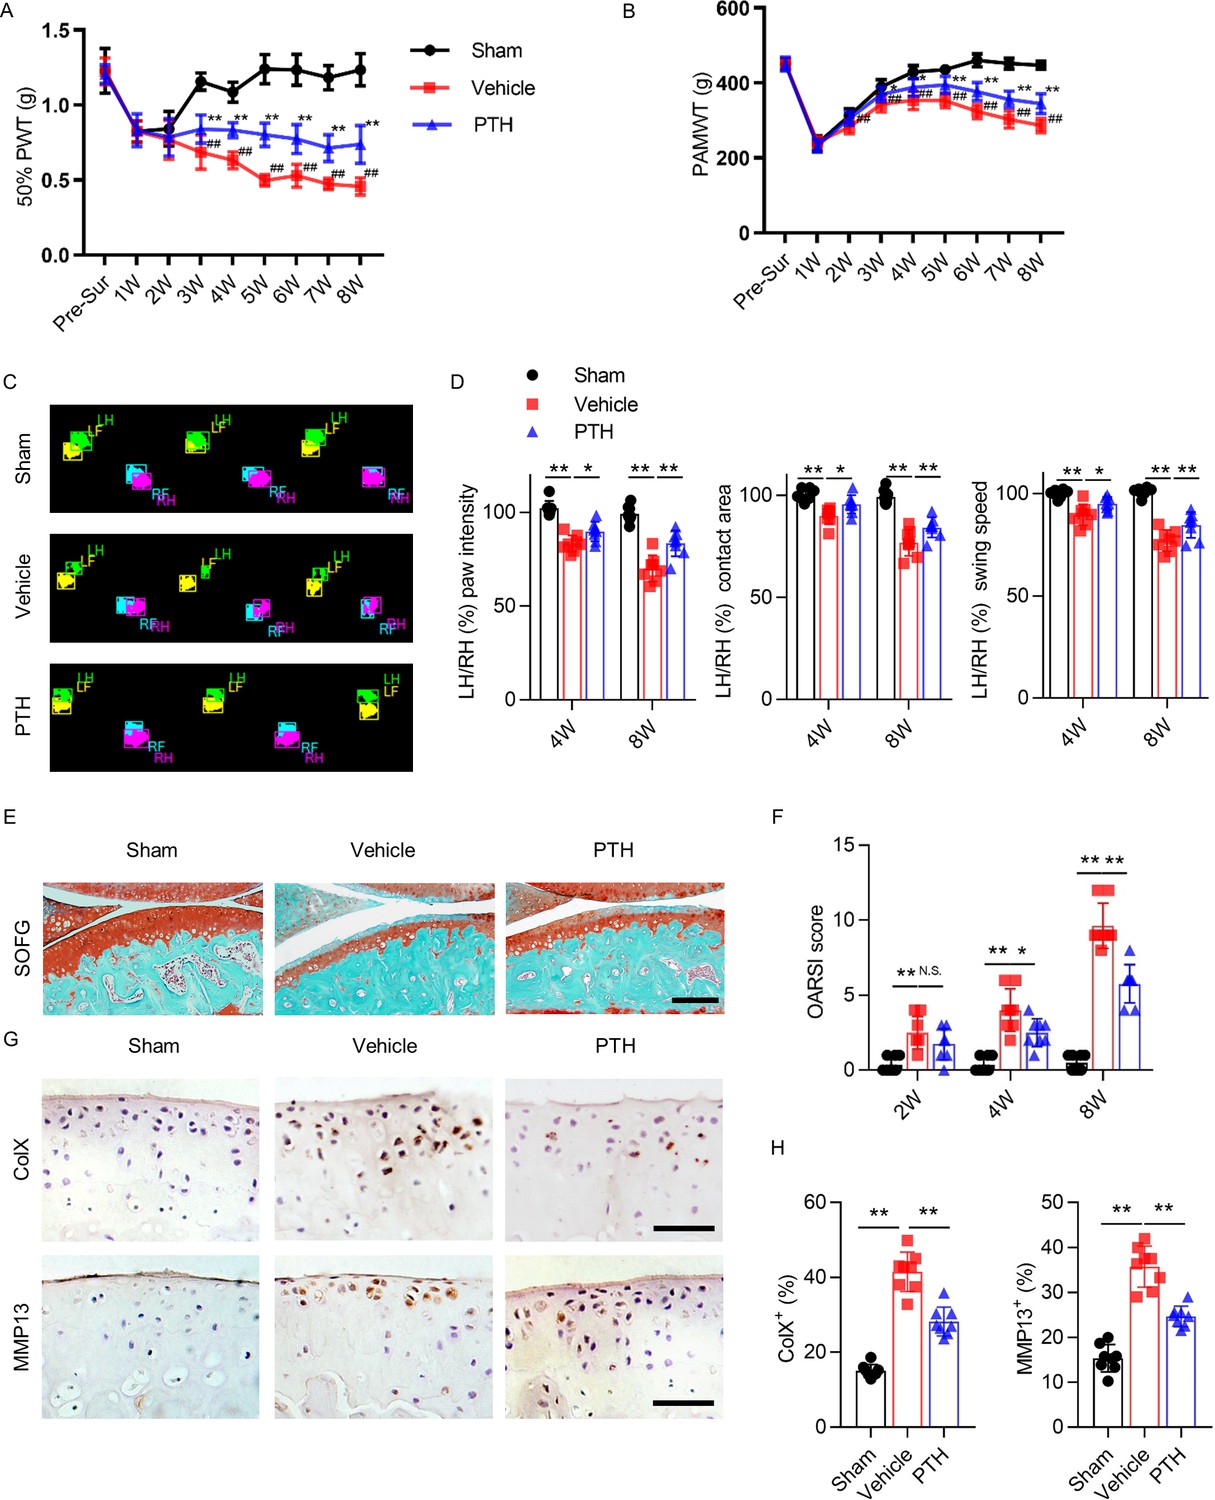
Parathyroid hormone (PTH) improves osteoarthritis pain and joint degeneration after DMM surgery.
(A) 50% paw withdrawal threshold (50% PWT) was tested in the left hind paw of sham-operated, PTH-treated, destabilized medial meniscus (DMM), and vehicle-treated DMM mice at different time points (n = 8/group). #, ##Vehicle-treated DMM mice compared with sham mice; *,**Vehicle-treated DMM mice compared with PTH-treated DMM mice. (B) Withdrawal threshold measured by pain application measurement (PAMWT) at the left knee of sham-operated, PTH-treated DMM, and vehicle-treated DMM mice (n = 8/group). #, ##Vehicle-treated DMM mice compared with sham mice; *,**Vehicle-treated DMM mice compared with PTH-treated DMM mice. (C) Representative images of gait analysis of sham-operated, PTH-treated DMM. and vehicle-treated DMM mice. RH = right hind paw (pink), LH = left hind paw (green), RF = right front paw (blue), LF = left front paw (yellow). (D) Quantitative analysis of LH intensity, LH area, and LH swing speed compared with the RH at week 8 after sham or DMM surgery (n = 8/group). (E) Safranin O/fast green (SOFG) staining of sagittal sections of the tibial medial compartment, proteoglycan (red) and bone (green) at week 8 after sham or DMM surgery. Age of mice used for sections: 18 weeks old. Scale bar: 250 μm. (F) Osteoarthritis Research Society International (OARSI) scores at weeks 2, 4, and 8 after surgery (n = 8/group). (G) Immunohistochemical analysis of matrix metalloproteinase 13+ (MMP13+, brown) and type X collagen+ (ColX+, brown) in articular cartilage at week 8 after sham or DMM surgery. Age of mice used for sections: 18 weeks old. Scale bar: 50 μm. (H) Quantitative analysis of MMP13+ and ColX+ cells in articular cartilage. All data are shown as means ± standard deviations (n = 8/group). *,#p<0.05, **,##p<0.01. NS, no significant difference.
-
Figure 1—source data 1
Raw data of PAMWT, 50% PWT, catwalk analysis, OARSI, MMP13+ staining, and ColX+ staining.
- https://cdn.elifesciences.org/articles/66532/elife-66532-fig1-data1-v2.xlsx
Figure 2 with 1 supplement

Sensory nerve innervation in subchondral bone decreased with PTH treatment.
(A) Immunofluorescence analysis of calcitonin gene-related peptide+ (CGRP+) (green) sensory nerve fibers in subchondral bone of sham-operated, PTH-treated DMM, and vehicle-treated DMM mice at week 8 after surgery. DAPI stains nuclei blue. Upper: low-magnification images (orange dotted line outlines the contour of the tibial subchondral bone), scale bar: 300 μm; bottom: high-magnification images. Scale bar: 50 μm. (B) Quantitative analysis of the density of CGRP+ sensory nerve fibers in tibial subchondral bone at week 8 after sham or DMM surgery (n = 8/group). (C, D) Immunofluorescence and quantitative analysis of substance P+ (SP+) (red) nerve fibers in subchondral bone at week 8 after sham or DMM surgery (n = 8/group). DAPI stains nuclei blue. Scale bar: 50 μm. (E, F) Representative images of immunofluorescence co-staining and quantitative analysis of the CGRP+ sensory nerves (green) and endomucin+ (EMUN) vessel (red) in the subchondral bone at week 8 after sham or DMM surgery (n = 8/group). Scale bar: 50 μm. (G, H) Immunofluorescence and quantitative analysis of CGRP+ (green) nerve fibers in synovium at week 8 after sham or DMM surgery. DAPI stains nuclei blue. Scale bar: 50 μm. n = 8/group. (I) μCT images of the tibial subchondral bone medial compartment (coronal) at week 8 after sham or DMM surgery. Arrowhead indicates the osteophyte. Scale bar: 500 μm. (J) Total volume measurement of osteophytes from the tibial plateau of sham-operated, PTH-treated DMM, and vehicle-treated DMM mice. (n = 8/group). (K) Immunohistochemical analysis of cyclooxygenase 2+ (COX2+) cells in the tibial subchondral bone at week 4 after DMM surgery. Arrowhead indicates the positive cells. Scale bar: 50 μm. (L) Quantitative analysis of COX2+ cells in mouse tibial subchondral bone (both bone marrow and subchondral bone matrix) (n = 8/group). (M) Quantitative analysis of PGE2 in subchondral bone determined by enzyme-linked immunosorbent assay (ELISA) (n = 8/group). *p<0.05, **p<0.01. NS, no significant difference.
-
Figure 2—source data 1
Raw data of CGRP staining, SP staining, EMUN staining, CGRP staining in synovium, quantification osteophyte volume, COX2 staining, and quantification of level of PGE2.
- https://cdn.elifesciences.org/articles/66532/elife-66532-fig2-data1-v2.xlsx
Figure 2—figure supplement 1
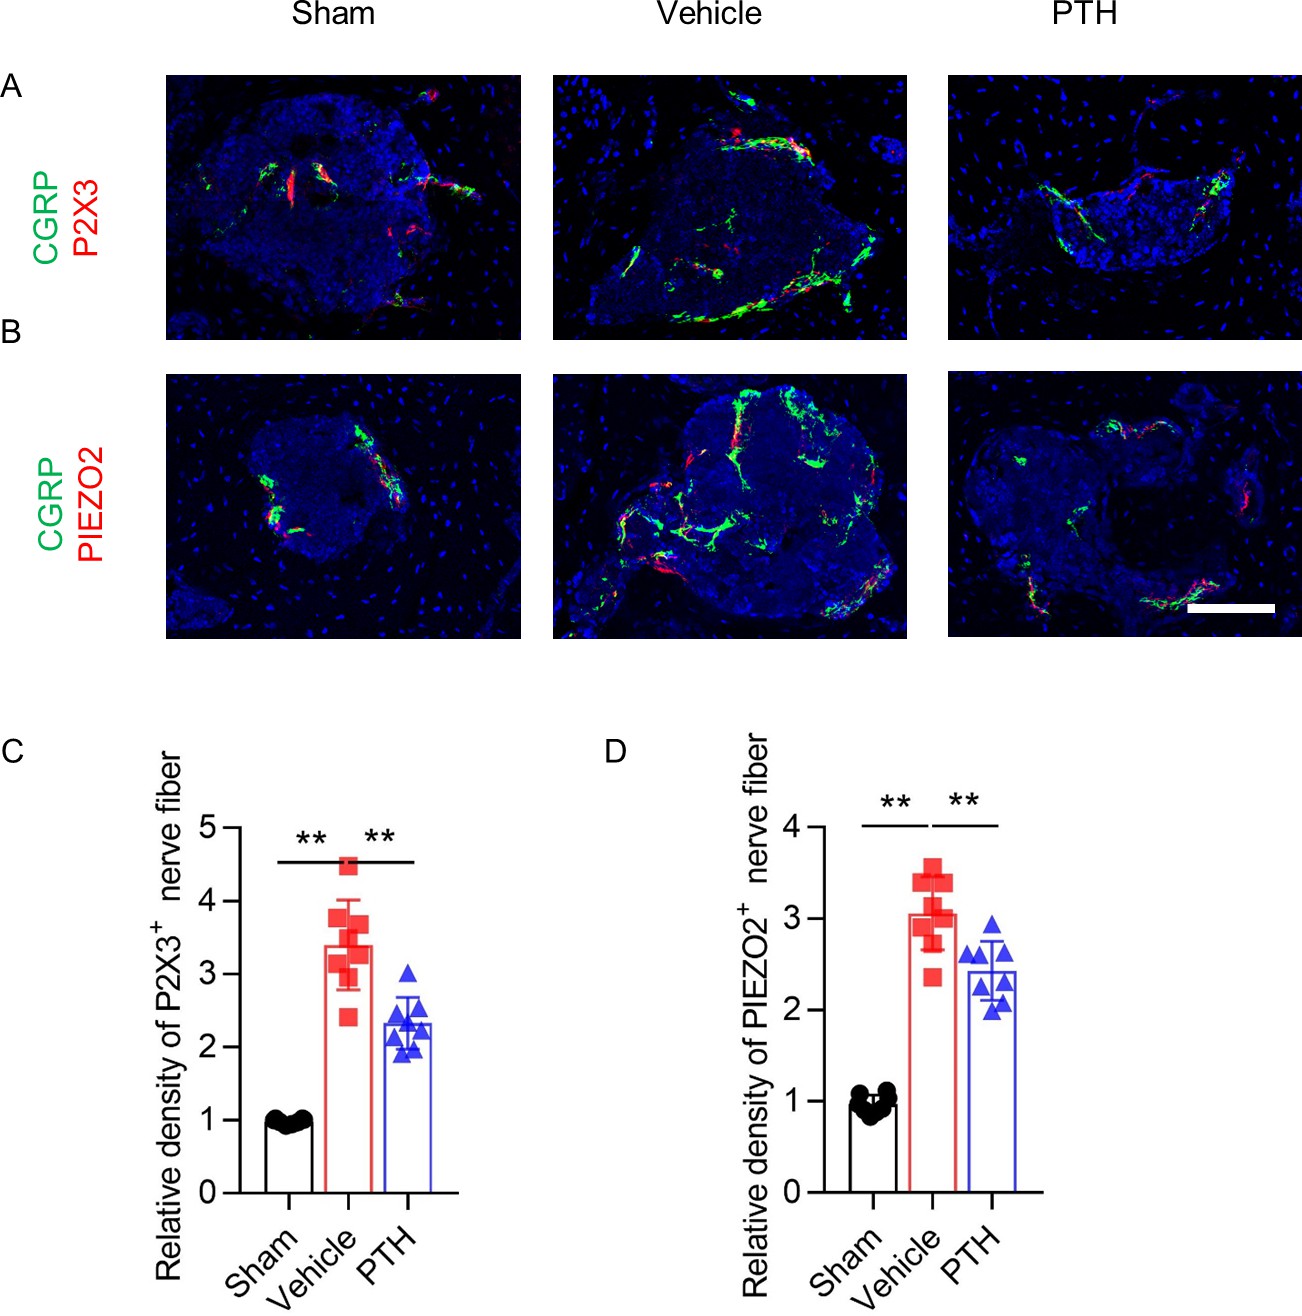
PTH treatment significantly reduced CGRP-positive nerve fibers in subchondral bone.
(A) Immunofluorescence analysis of co-staining of P2 × 3+ (red) and CGRP+ (green) nerve fibers in tibial subchondral bone at week 8 after sham or DMM surgery. DAPI stains nuclei blue. Scale bar: 50 μm. (B) Immunofluorescence analysis of co-staining of PIEZO2+ (red) and CGRP+ (green) nerve fibers in tibial subchondral bone at week 8 after sham or DMM surgery. DAPI stains nuclei blue. Scale bar: 50 μm. (C–D) Quantitative analysis of the density of P2 × 3+ and PIEZO2+ nerve fibers in tibial subchondral bone at week 8 after sham or DMM surgery (n = 8/group).
-
Figure 2—figure supplement 1—source data 1
Raw data of P2 × 3 staining and PIEZO2 staining.
- https://cdn.elifesciences.org/articles/66532/elife-66532-fig2-figsupp1-data1-v2.xlsx
Figure 3
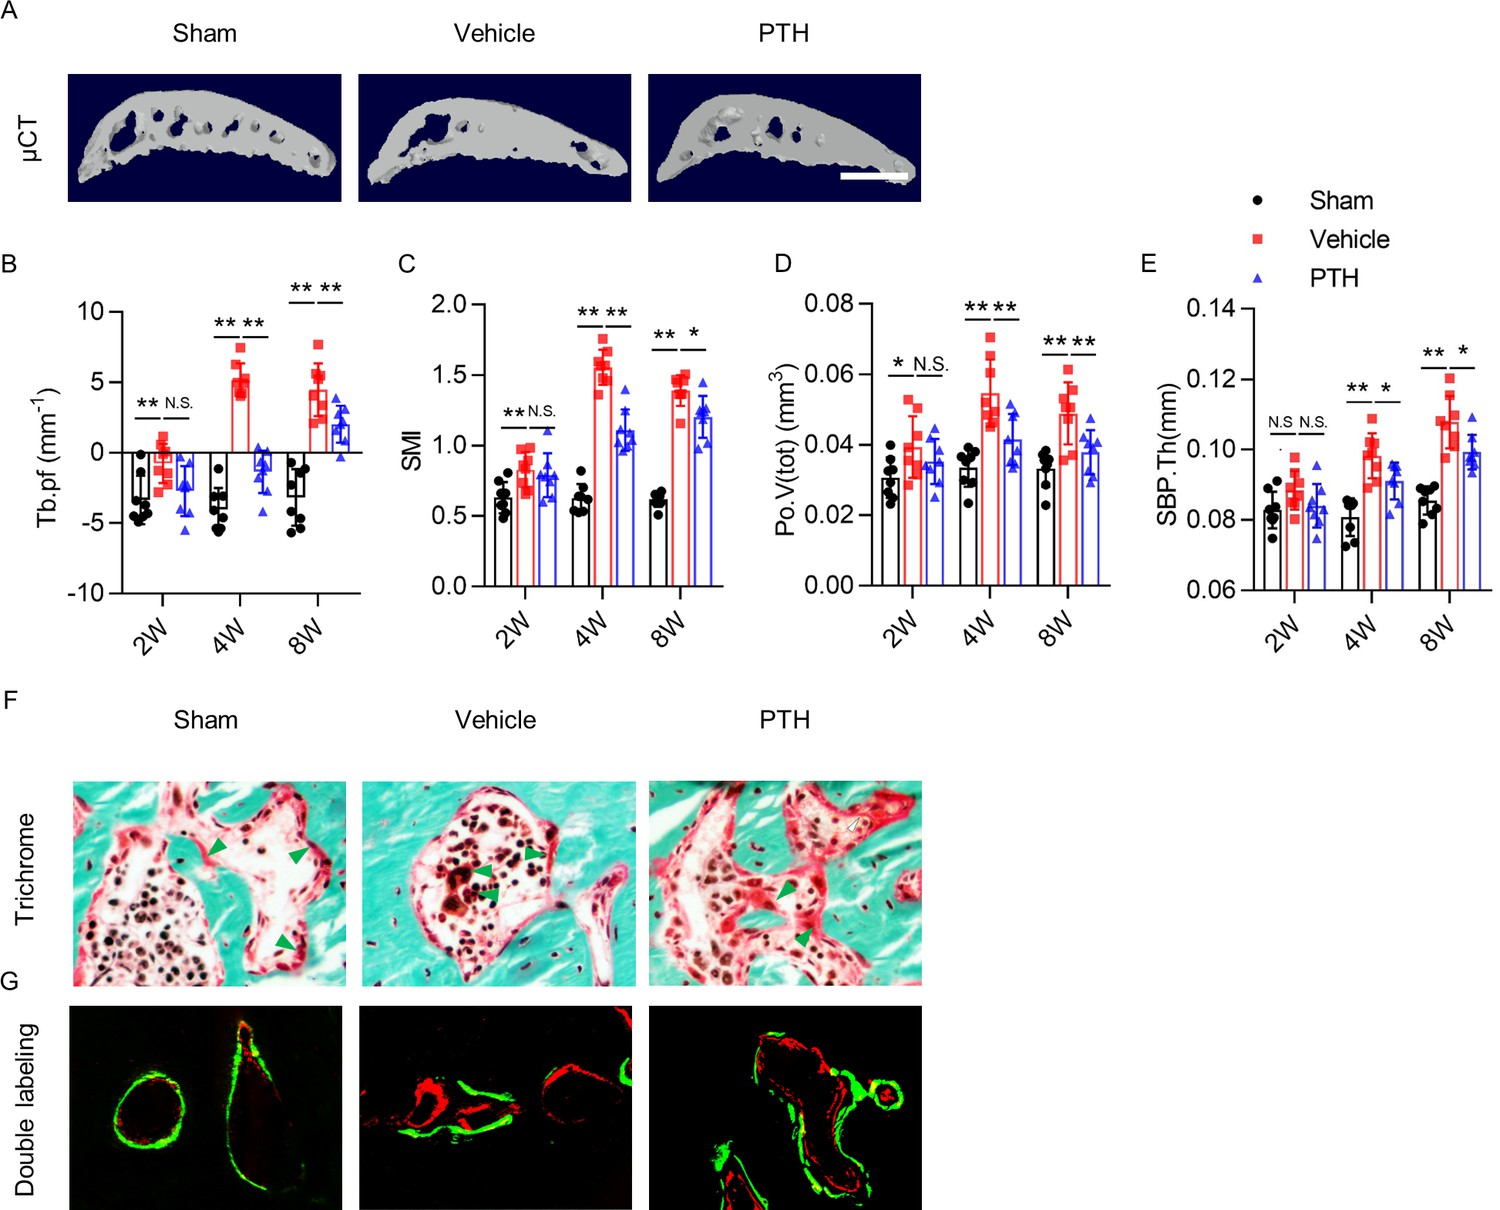
PTH sustains subchondral bone microarchitecture by remodeling.
(A) 3-D, high-resolution microcomputed tomography (μCT) images of the tibial subchondral bone medial compartment (sagittal view) at week 8 after sham or DMM surgery. Scale bar: 500 μm (B–E) Quantitative analysis of structural parameters of subchondral bone by μCT analysis: trabecular pattern factor (Tb.pf), structure model index (SMI), total volume of pore space (Po.V(tot)), and thickness of subchondral bone plates (SBP.Th). (n = 8/group). (F) Trichrome staining in the tibial subchondral bone sections at week 8 after sham or DMM surgery. Arrowhead indicating the osteoid. Scale bar: 50 μm. (G) Calcein (green) and Alizarin (red) fluorescent double labeling of the subchondral bone at week 8 after sham or DMM surgery. Scale bar: 50 μm. *p<0.05, **p<0.01.
-
Figure 3—source data 1
Raw data of microCT data.
- https://cdn.elifesciences.org/articles/66532/elife-66532-fig3-data1-v2.xlsx
Figure 4
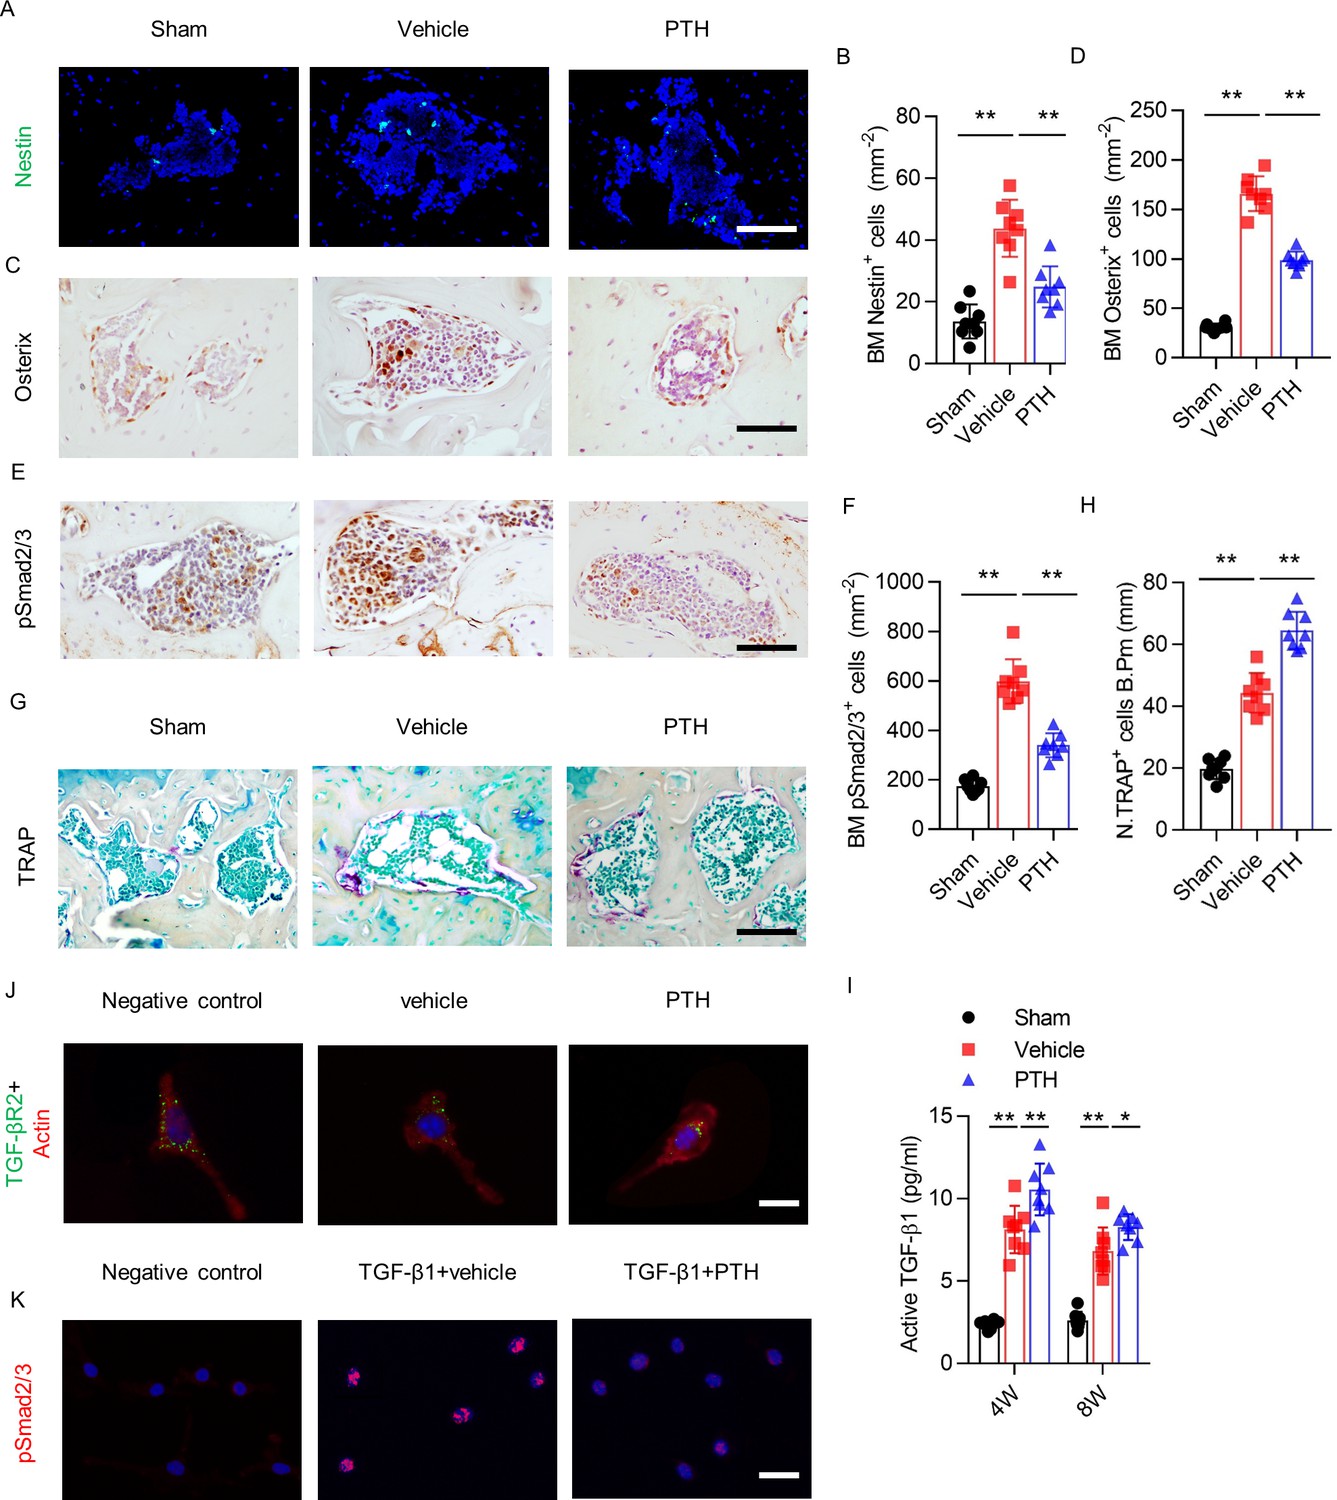
PTH sustains subchondral bone remodeling by endocytosis of TβRII.
(A, B) Immunofluorescence analysis and quantification of Nestin+ cells (green) in tibial subchondral bone at week 4 after sham or DMM surgery. Scale bar: 50 μm (n = 8/group). (C, D) Immunohistochemical analysis and quantification Osterix+ cells (brown) in tibial subchondral bone in different groups at week 4 after sham or DMM surgery. Scale bar: 50 μm (n = 8/group). (E, F) Immunohistochemical analysis and quantification of pSmad2/3+ cells (brown) in tibial subchondral bone at week 4 after sham or DMM surgery. Scale bar: 50 μm (n = 8/group). (G, H) Tartrate-resistant acid phosphatase (TRAP) staining (pink) and quantitative analysis of TRAP+ cells in tibial subchondral bone at week 4 after sham or DMM surgery. Scale bar: 100 μm (n = 8/group). (I) Quantitative analysis of active TGF-β in serum of mice at week 4 after sham or DMM surgery, determined by ELISA (n = 8/group). (J) Immunofluorescent analysis of TβRII (green) distribution on mouse bone marrow MSCs. Actin (red); DAPI stains nuclei blue. Scale bar: 10 μm. (K) Immunofluorescent analysis of pSmad2/3+ on mouse bone marrow MSCs. Scale bar: 25 μm. DAPI stains nuclei blue. *p<0.05, **p<0.01.
-
Figure 4—source data 1
Raw data of nestin staining, osterix staining, psmad2/3 staining, TRAP staining, and level of active TGF-β.
- https://cdn.elifesciences.org/articles/66532/elife-66532-fig4-data1-v2.xlsx
Figure 5
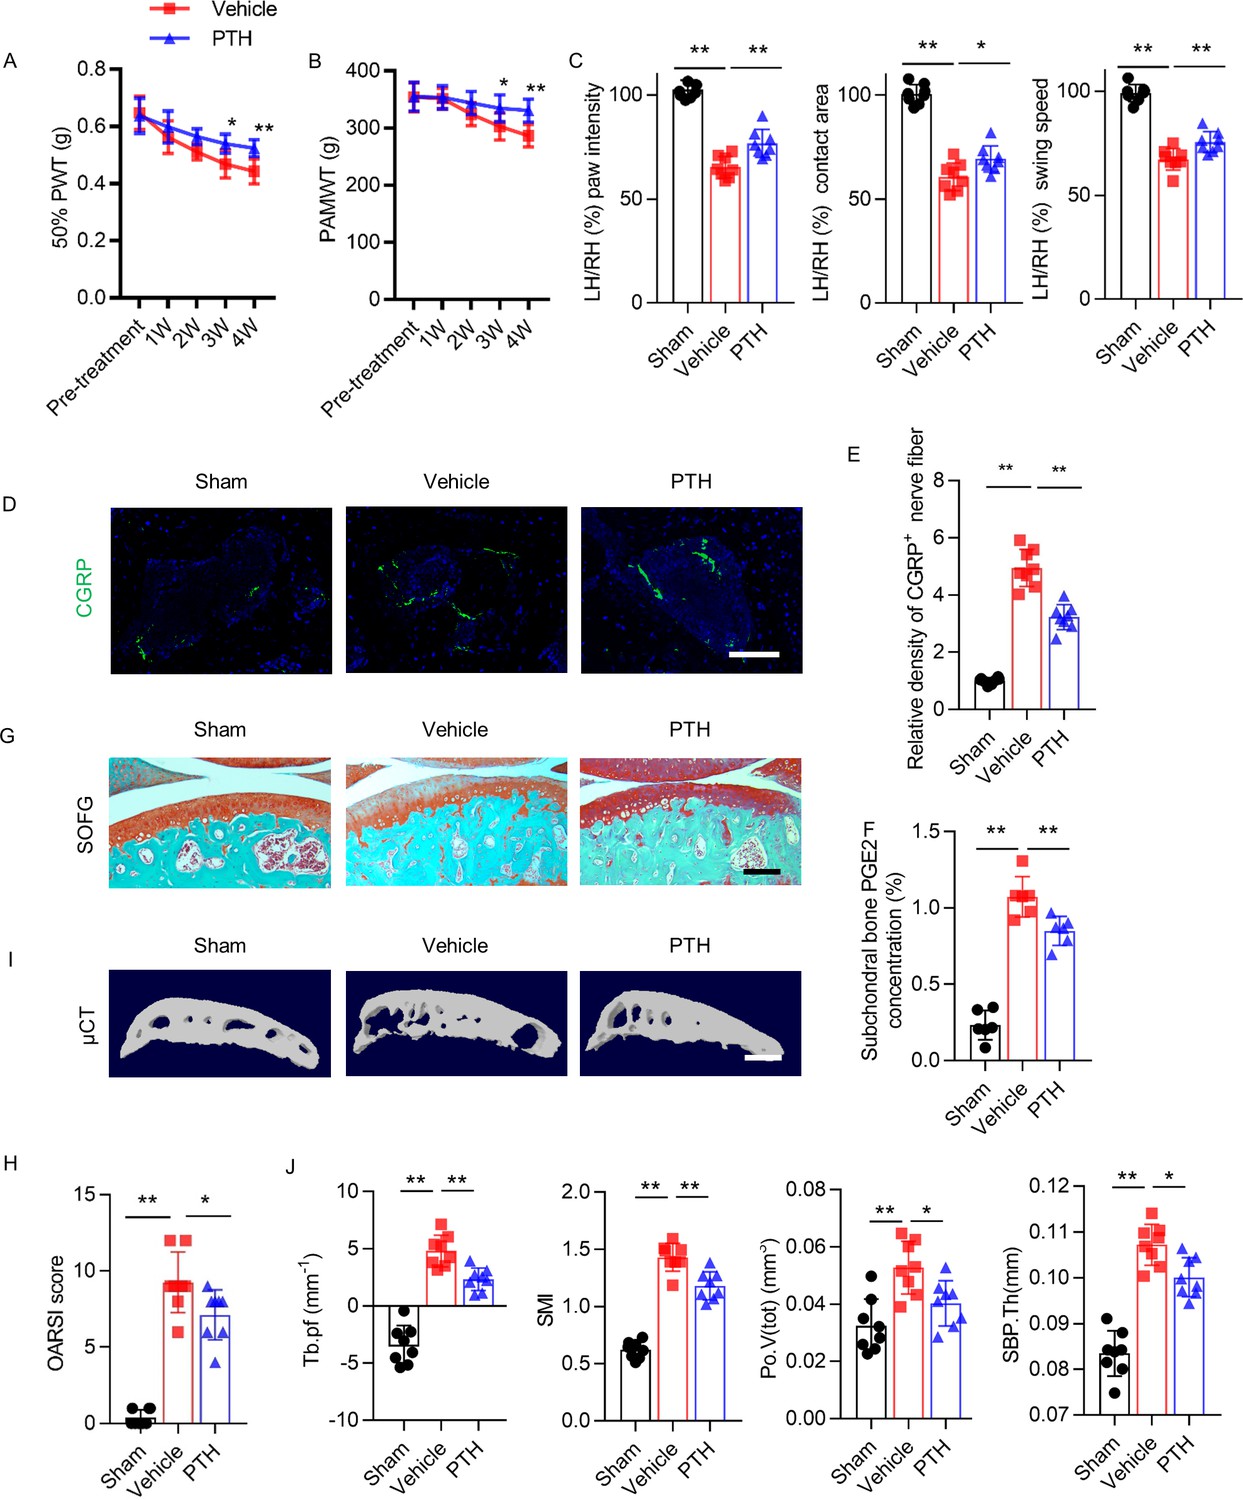
Delayed PTH attenuates progressive osteoarthritis pain and joint degeneration in DMM model mice.
(A, B) 50% PWT at the left hind paw (LH) and PAMWT at the left knee in PTH-treated DMM and vehicle-treated DMM mice, starting from week 4 to week 8 after DMM surgery (n = 8/group). *, **Vehicle-treated DMM mice compared with PTH-treated DMM mice. (C) Quantitative analysis of LH intensity, LH area, and LH swing speed compared with RH, based on catwalk analysis (n = 8/group). (D) Immunofluorescent analysis of the density of CGRP+ (green) sensory nerve fibers in tibial subchondral bone of sham-operated, PTH-treated DMM, and vehicle-treated mice at week 8 after sham or DMM surgery. DAPI stains nuclei blue. Scale bar: 50 μm. (E) Quantitative analysis of the density of CGRP+ sensory nerve fibers in tibial subchondral bone after DMM surgery (n = 8/group). (F) Quantitative analysis of PGE2 in subchondral bone determined by ELISA (n = 8/group). (G) SOFG staining of sagittal sections of the tibia medial compartment, proteoglycan (red) and bone (green) at week 8 after sham or DMM surgery. Scale bar: 250 μm (n = 8/group). (H) OARSI scores (n = 8/group). (I) 3-D, high-resolution μCT images of the tibial subchondral bone medial compartment (sagittal view) at week 8 after sham or DMM surgery. Scale bar: 500 μm. (J) Quantitative analysis of structural parameters of subchondral bone by μCT analysis: Tb.pf, SMI, Po.V(tot), and SBP.Th (n = 8/group). *p<0.05, **p<0.01.
-
Figure 5—source data 1
Raw data of PAMWT, 50% PWT, catwalk analysis, CGRP staining, quantification of level of PGE2, OARSI, and microCT data.
- https://cdn.elifesciences.org/articles/66532/elife-66532-fig5-data1-v2.xlsx
Figure 6 with 1 supplement
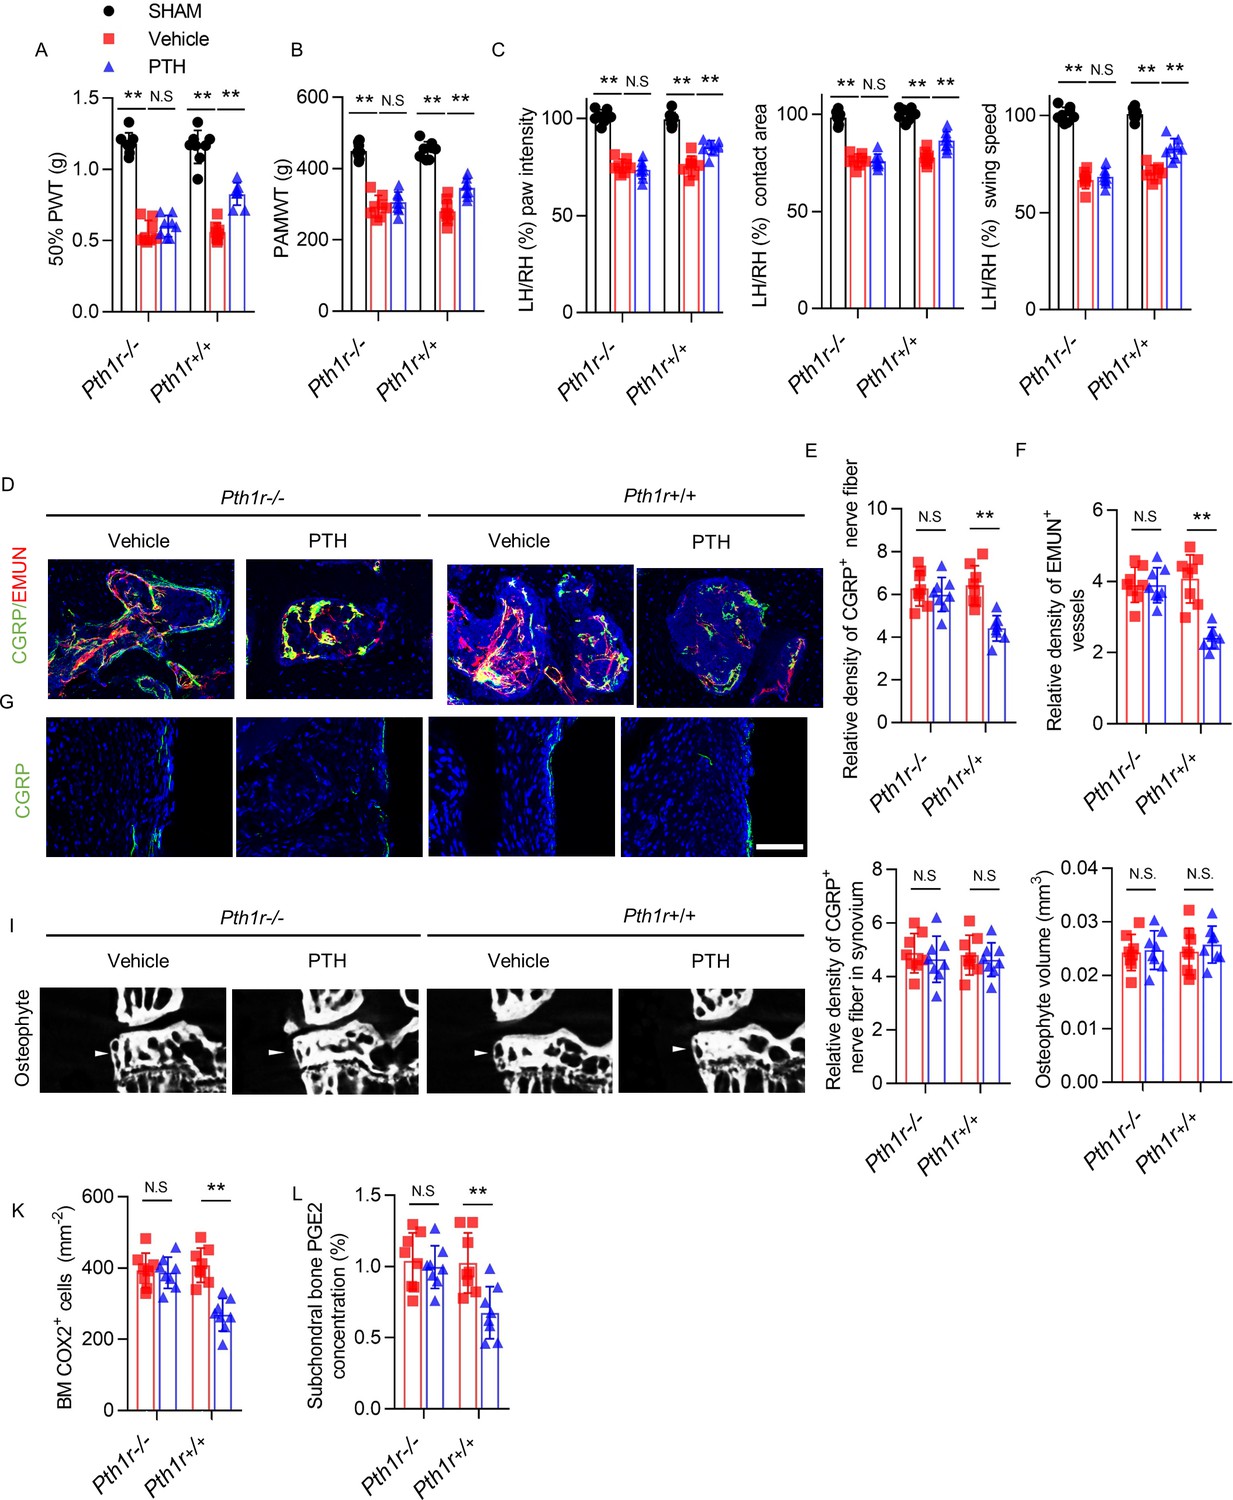
PTH-induced osteoarthritis pain relief is inhibited by PTH type one receptor knockout on Nestin+ MSCs.
(A, B) 50% PWT at the LH and PAMWT at the left knee in sham-operated, PTH-treated DMM, and vehicle-treated DMM PTH type one receptor−/− (Pth1r−/−) and Pth1r+/+ mice at week 8 after sham or DMM surgery (n = 8/group). (C) Quantitative analysis of LH intensity, LH area, and LH swing speed compared with the RH in sham-operated, PTH-treated DMM, and vehicle-treated DMM Pth1r−/− and Pth1r+/+ mice at week 8 after sham or DMM surgery, based on catwalk analysis (n = 8/group). (D–F) Immunofluorescent and quantitative analysis of CGRP+ (green) sensory nerve fibers and EMUN+ vessels (red) in tibial subchondral bone of PTH-treated or vehicle-treated Pth1r−/− and Pth1r+/+ mice at week 8 after DMM surgery (n = 8/group). Scale bar: 50 μm. (G, H) Immunofluorescent and quantitative analysis of CGRP+ (green) sensory nerve fibers in synovium of PTH-treated or vehicle-treated Pth1r−/− and Pth1r+/+ mice at week 8 after DMM surgery (n = 8/group). Scale bar: 50 μm. (I) μCT images of the tibial subchondral bone medial compartment (coronal) at week 8 after DMM surgery. Arrowhead indicates the osteophyte. Scale bar: 500 μm. (J) Total volume measurement of osteophytes from the tibial plateau of sham-operated, PTH-treated DMM, and vehicle-treated DMM Pth1r−/− and Pth1r+/+ mice (n = 8/group). (K) Immunohistochemical quantification of COX2+ cells in the tibial subchondral bone of mice at week 4 after DMM surgery (n = 8/group). (L) Quantitative analysis of PGE2 in subchondral bone determined by enzyme-linked immunosorbent assay (ELISA) (n = 8/group). *p<0.05, **p<0.01. NS, no significant difference.
-
Figure 6—source data 1
Raw data of PAMWT, 50% PWT, catwalk analysis, CGRP staining, EMUN staining, CGRP staining in synovium, quantification of osteophyte volume, and COX2 staining, and quantification of level of PGE2.
- https://cdn.elifesciences.org/articles/66532/elife-66532-fig6-data1-v2.xlsx
Figure 6—figure supplement 1
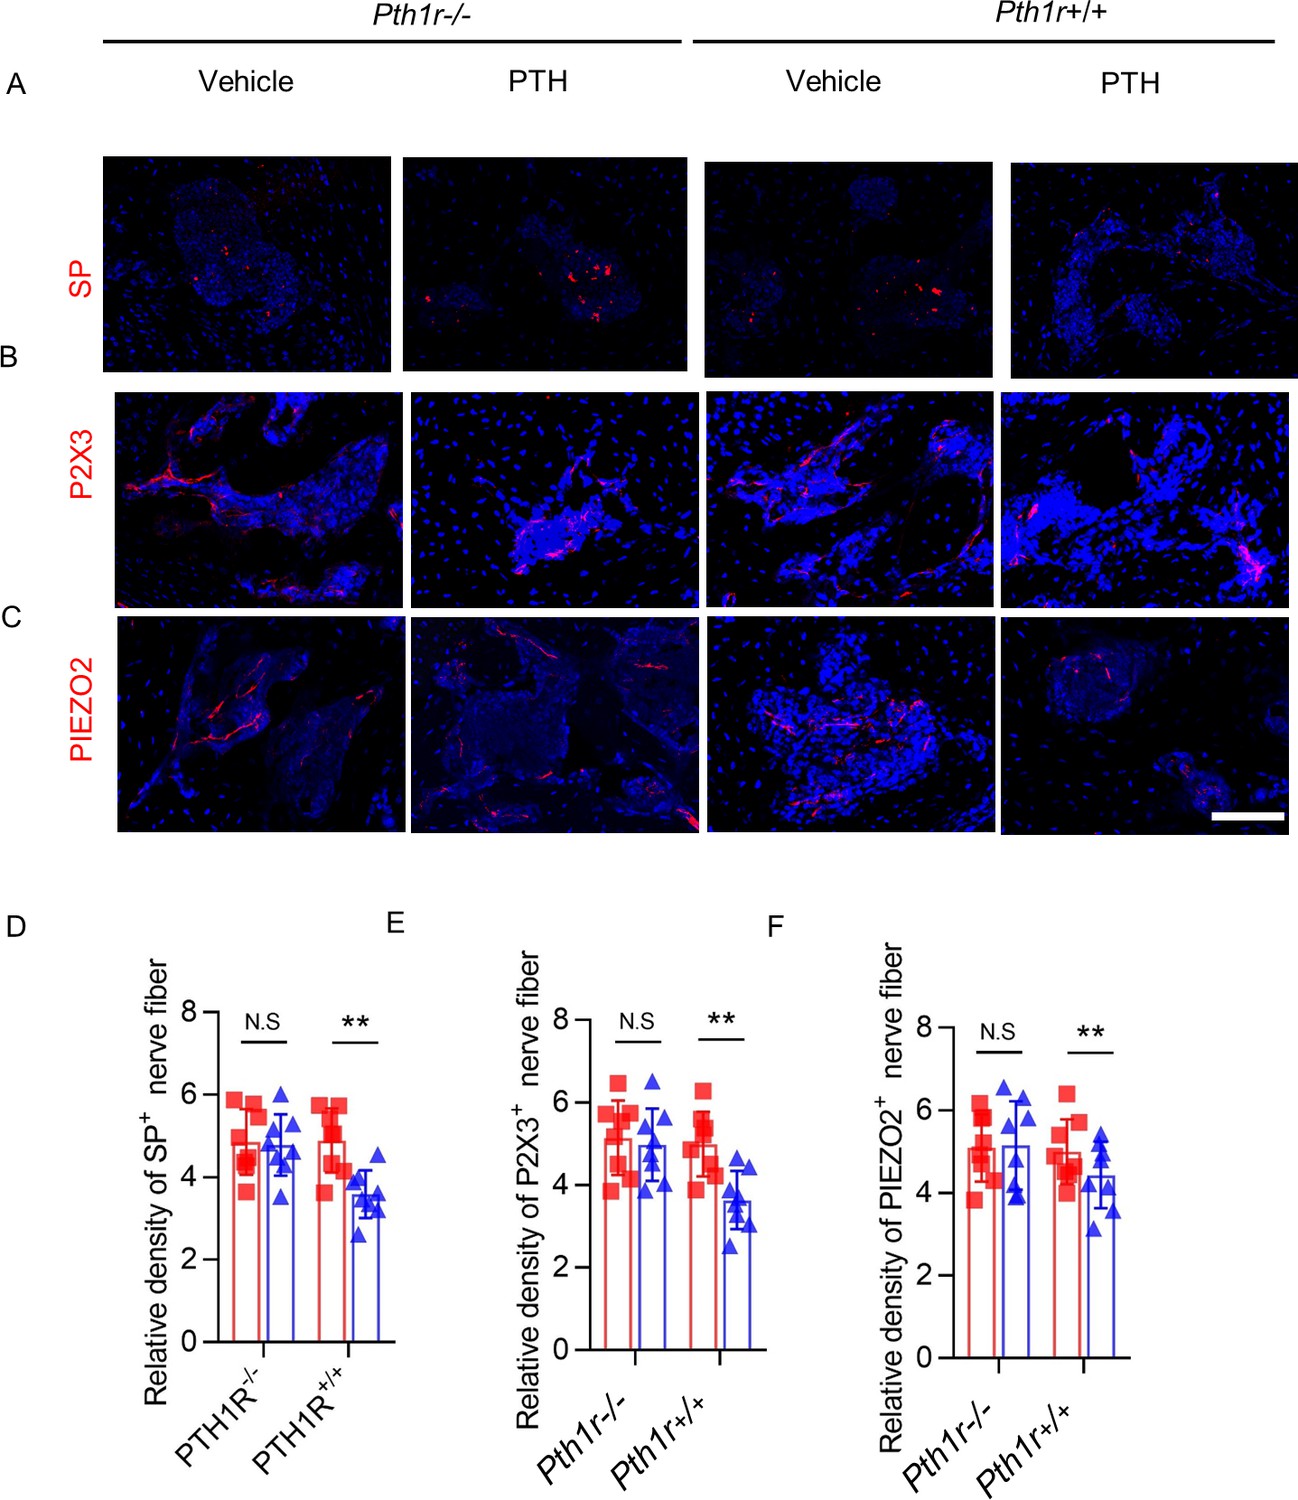
Expression levels of SP, P2X3 and PiEZO in nerve fibers were signigficantly decreased PTH1R knockout mice.
(A–C) Immunofluorescence analysis of Substance P+ (SP+) (red), P2 × 3+ (red), and PIEZO2+ (red) sensory nerve fibers in tibial subchondral bone of sham-operated, PTH-treated DMM, and vehicle-treated Pth1r−/− and Pth1r+/+ mice at week 8 after DMM surgery. DAPI stains nuclei blue. Scale bar: 50 μm. (D–F) Quantitative analysis of the density of SP+, P2 × 3+, and PIEZO2+ sensory nerve fibers in tibial subchondral bone at week 8 after DMM surgery (n = 8/group).
-
Figure 6—figure supplement 1—source data 1
Raw data of SP staining, P2 × 3 staining, and PIEZO2 staining.
- https://cdn.elifesciences.org/articles/66532/elife-66532-fig6-figsupp1-data1-v2.xlsx
Figure 7
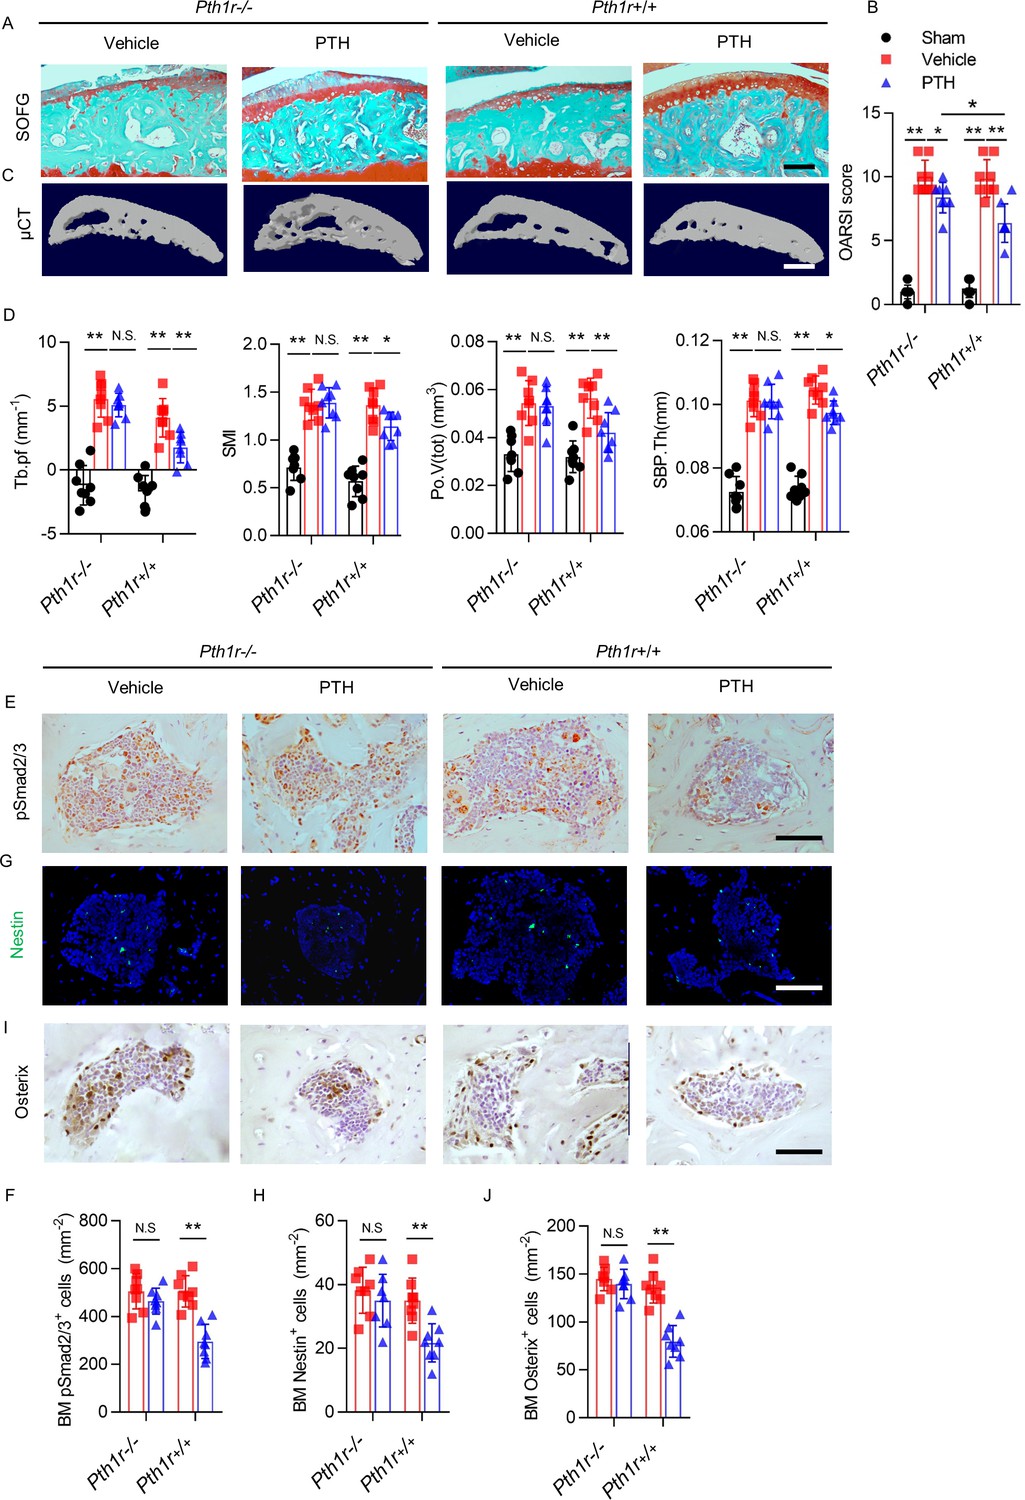
PTH-induced bone remodeling is inhibited by PTH1R knockout on Nestin+ MSCs.
(A) SOFG staining of sagittal sections of the tibial medial compartment, proteoglycan (red) and bone (green) at week 8 after DMM surgery. Scale bar: 250 μm. (B) OARSI score (n = 8/group). (C) 3-D, high-resolution μCT images of the tibial subchondral bone medial compartment at week 8 after DMM surgery. Scale bar: 500 μm. (D) Quantitative analysis of structural parameters of subchondral bone by μCT analysis: Tb.pf, SMI, Po.V (tot), and SBP.Th (n = 8/group). (E, F) Immunohistochemical analysis and quantification of pSmad2/3+ cells in subchondral bone marrow at week 4 after DMM surgery. Scale bar: 50 μm (n = 8/group). (G, H) Immunofluorescent analysis and quantification of Nestin+ cells (green) in tibial subchondral bone marrow at week 4 after DMM surgery. Scale bar: 50 μm; n = 8/group. (I, J) Immunohistochemical analysis and quantification of Osterix+ (brown) cells in tibial subchondral bone marrow at week 4 after DMM surgery. Scale bar: 50 μm; n = 8/group. *p<0.05, **p<0.01. NS, no significant difference.
-
Figure 7—source data 1
Raw data of OARSI, microCT, psmad2/3 staining, nestin staining, and osterix staining.
- https://cdn.elifesciences.org/articles/66532/elife-66532-fig7-data1-v2.xlsx
Figure 8
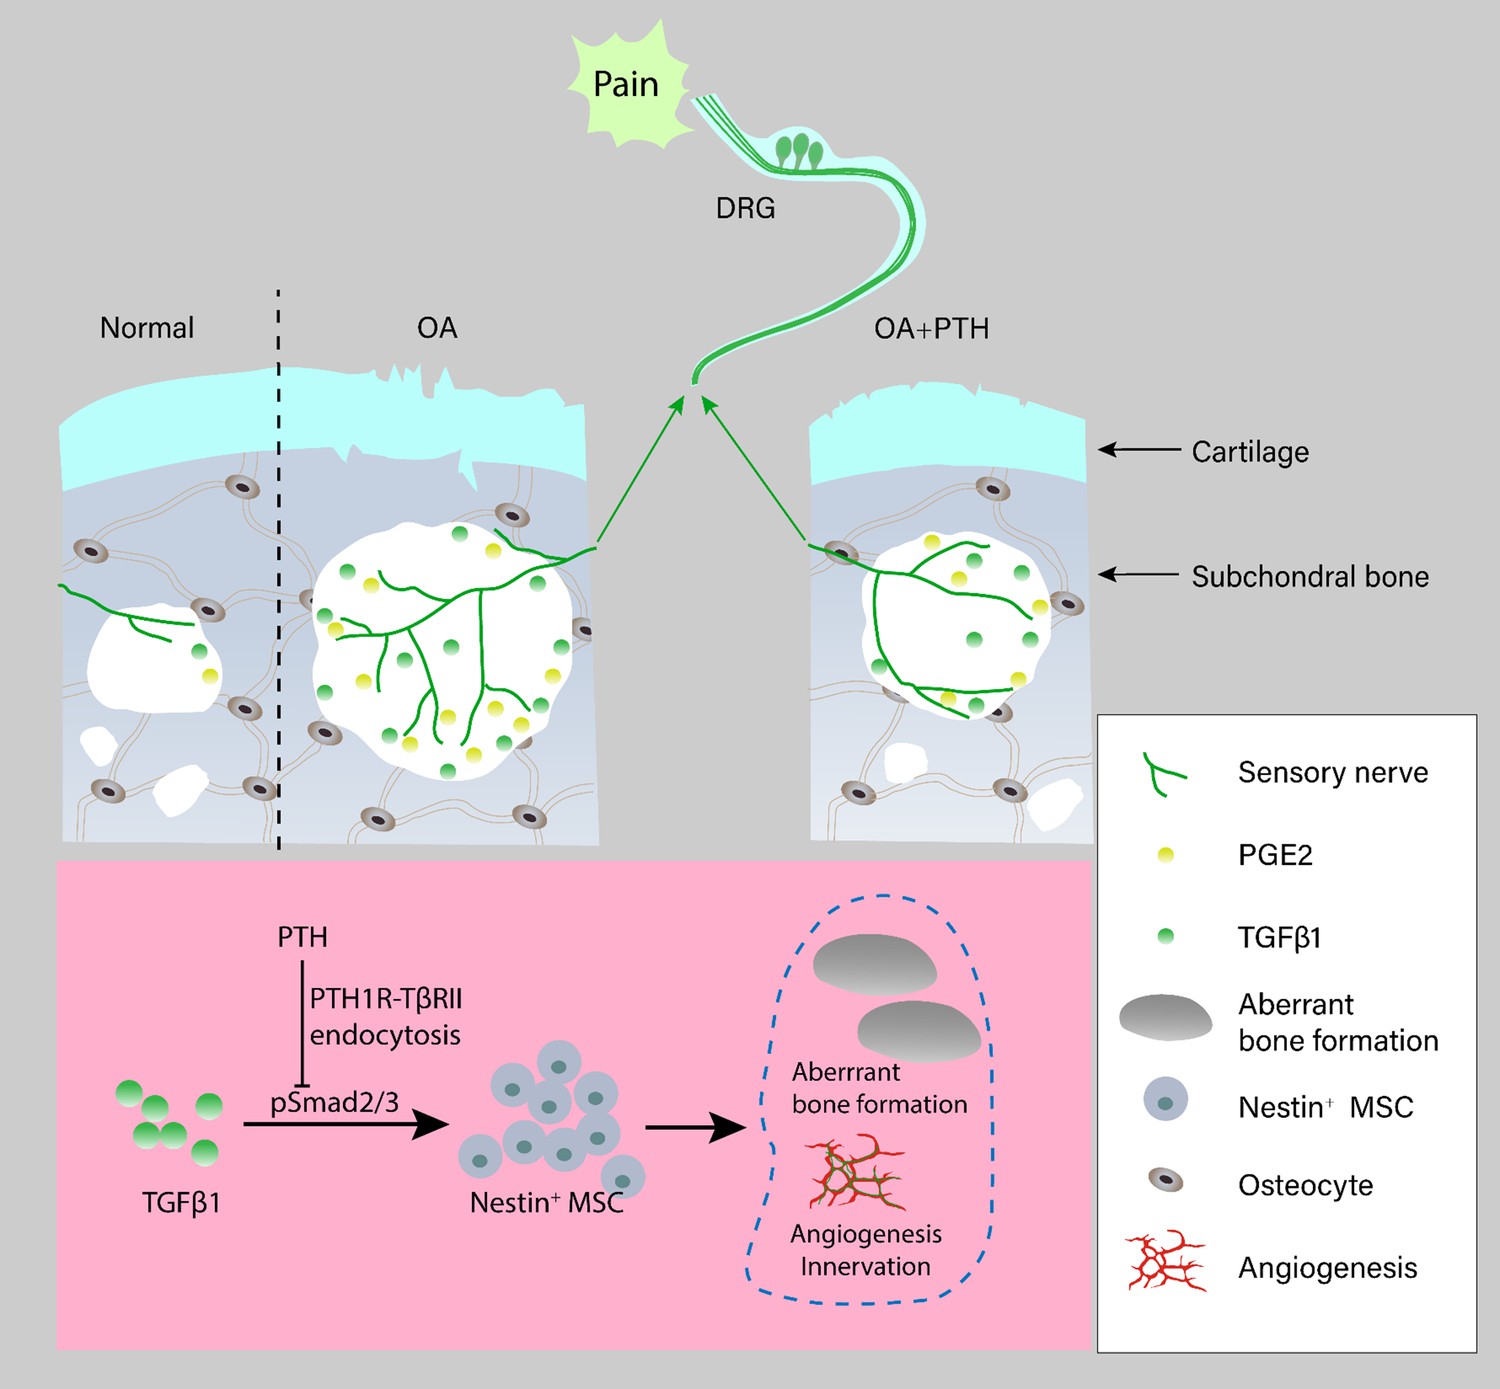
Schematic diagram of PTH-induced pain relief and attenuation of joint degeneration in osteoarthritis.
Aberrant mechanical stress induces uncoupled remodeling of subchondral bone due to excessive TGF-β at onset of osteoarthritis and subsequently generates a pathological microenvironment with significantly increased PGE2 level and other inflammatory factors when reaching a certain threshold. Additionally, aberrant microarchitecture is associated with increased wiring of sensory nerve fibers and vessels in the subchondral bone. PTH reduced sensory innervation, vessel wiring, and the level of PGE2 by maintaining the microarchitecture of subchondral bone through induction of endocytosis of PTH1R and TβRII.
Tables
Key resources table
| Reagent type (species) or resource | Designation | Source or reference | Identifiers | Additional information |
|---|---|---|---|---|
| Antibody | Rabbit polyclonal to pSmad2/3 | Santa Cruz | sc-11769 | 1:50 |
| Antibody | Rabbit polyclonal to Osterix | Abcam | ab22552 | 1:600 |
| Antibody | Rabbit polyclonal to TβRII | Abcam | ab186838 | 1:100 |
| Antibody | Mouse monoclonal to β-actin | Cell Signaling Technology | CST3700 | 1:3000 |
| Antibody | Rabbit polyclonal to COX2 | Abcam | ab15191 | 1:100 |
| Antibody | Rabbit polyclonal to MMP13 | Abcam | ab39012 | 1:200 |
| Antibody | Chicken polyclonal to Nestin | Aves Labs | NES0407 | 1:300 |
| Antibody | Mouse monoclonal to CGRP | Abcam | ab81887 | 1:200 |
| Antibody | Rat monoclonal to Substance P | Santa Cruz | sc-21715 | 1:200 |
| Antibody | Rat monoclonal to endomucin | Santa Cruz | sc-65495 | 1:50 |
| Antibody | Rabbit polyclonal to PIEZO2 | Abcam | ab243416 | 1:300 |
| Antibody | Rabbit polyclonal to P2 × 3 | Abcam | ab10269 | 1:500 |
| Strain, strain background (Mus musculus) | C57BL/6J mice | Charles River Laboratories | Strain Code: 27 | C57BL/6 background |
| Strain, strain background (Mus musculus) | Pth1rfl/fl | Kobayashi et al., 2002 | Charles River Laboratories | C57BL/6 background |
| Strain, strain background (Mus musculus) | Nestin-creERT2 | Stock No: 016261 | Jackson Laboratory | C57BL/6 background |
| Chemical compound, drug | human PTH (1-34) | Sigma-Aldrich | P3796 | N/A |
| Sequence- based reagent | Nestin-creERT2 forward | N/A | PCR Primer | 5′−3′: ACCAGAGACGGAAATCCATCGCTC |
| Sequence-based reagent | Nestin-creERT2 reverse | N/A | PCR Primer | 5′−3′: TGCCACGACCAAGTGACAGCAATG |
| Sequence-based reagent | Pth1r loxP allele forward | N/A | PCR Primer | 5′−3′: TGGACGCAGACGATGTCTTTACCA |
| Sequence-based reagent | Pth1r loxP allele reverse | N/A | PCR Primer | 5′−3′: ACATGGCCATGCCTGGGTCTGAGA |
| Software, algorithm | Graphpad 8.0 | N/A | Statistical Analysis | Graph preparation |
| Software, algorithm | SPSS, 15.0 | N/A | Statistical Analysis | Statistical analysis |
Additional files
Download links
A two-part list of links to download the article, or parts of the article, in various formats.
Downloads (link to download the article as PDF)
Open citations (links to open the citations from this article in various online reference manager services)
Cite this article (links to download the citations from this article in formats compatible with various reference manager tools)
Parathyroid hormone attenuates osteoarthritis pain by remodeling subchondral bone in mice
eLife 10:e66532.
https://doi.org/10.7554/eLife.66532


