Age-dependent changes in protein incorporation into collagen-rich tissues of mice by in vivo pulsed SILAC labelling
- Kennedy Institute of Rheumatology, Arthritis Research UK Centre for OA Pathogenesis, University of Oxford, United Kingdom
- Big Data Institute, Li-Ka Shing Centre for Health Information and Discovery, University of Oxford, United Kingdom
- Center for Health Data Science, Faculty of Health Sciences, University of Copenhagen, United Kingdom
- Nuffield Department of Medicine, Target Discovery Institute, University of Oxford, United Kingdom
- Academic Endocrine Unit, OCDEM, Churchill Hospital, University of Oxford, United Kingdom
Figures
Figure 1
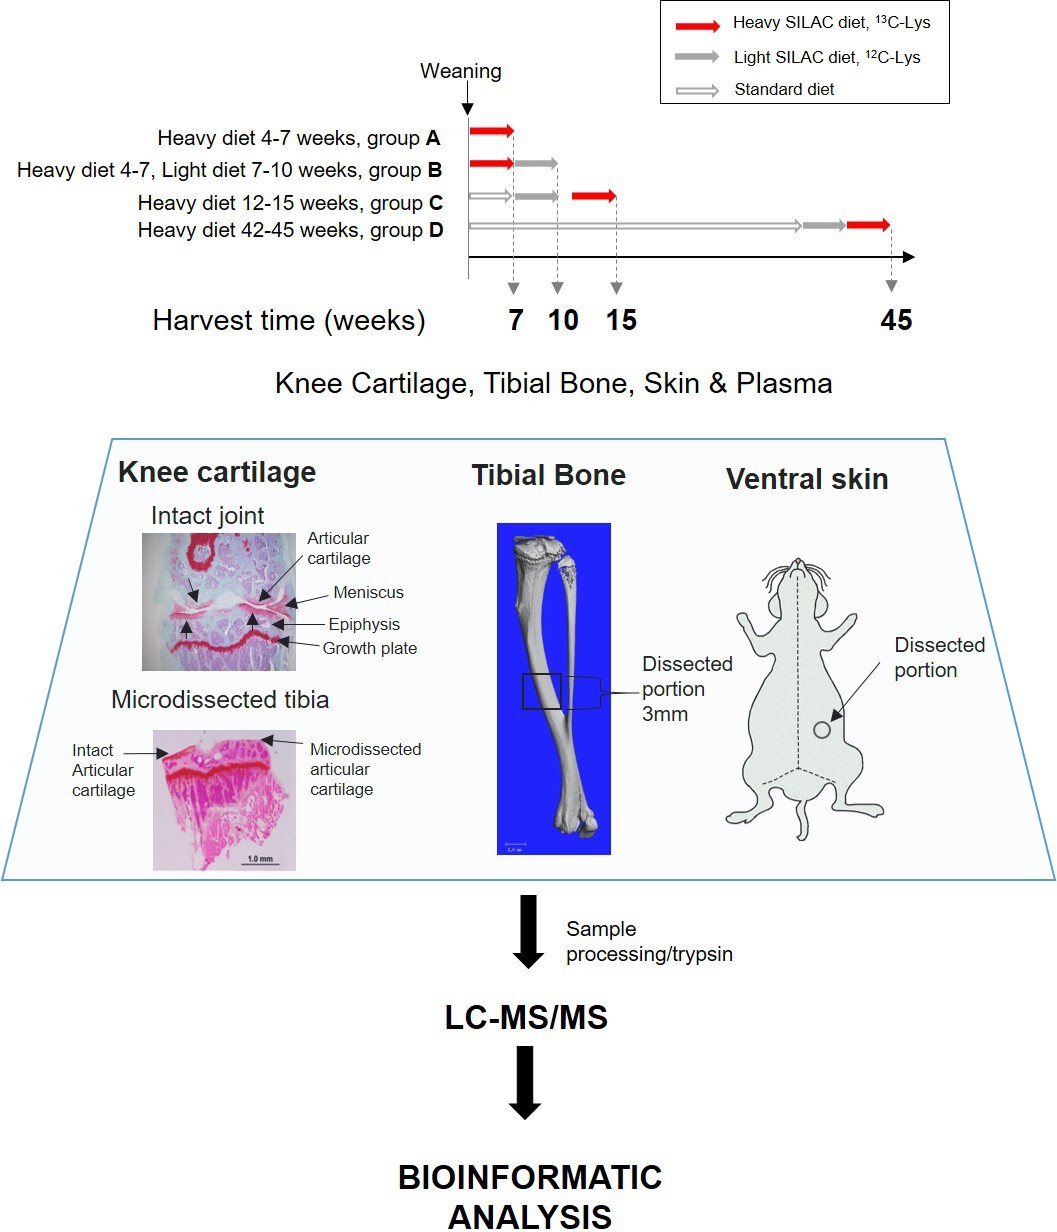
Experimental design.
Four groups of four C57BL/6 J male mice were fed with heavy SILAC diet (13C6-Lys) or light SILAC diet (12C6-Lys) for 3 weeks at different ages. Two groups of mice (A and B) were fed with the heavy diet from weeks 4 to 7. Group A was culled for tissue collection, and group B was switched to light diet from weeks 7 to 10, then culled for tissue collection. Groups C and D were fed with the heavy SILAC diet for 3 weeks until week 15 and week 45 respectively. Plasma, knee articular cartilage, tibial bone, and ventral skin were collected from fixed anatomical positions shown above. Left-hand panel shows Safranin O stained coronal sections of a murine knee joint before and after micro-dissection of the articular cartilage. Tissues were processed according to tissue specific protocols, trypsinised, and peptides analysed by liquid chromatography–tandem mass spectrometry. Peptides and protein identification and heavy/light (H/L) ratios were obtained by Maxquant software.
Figure 2 with 1 supplement

Synthesis rate and incorporation of protein in plasma, skin, bone, and articular cartilage during skeletal growth.
Each dot represents the mean of the percentage of incorporation of the heavy isotope for an individual protein, n = 4. The x axis represents percentage of the heavy isotope incorporation into proteins from weeks 4 to 7 of age (group A), and the y axis the heavy isotope subsequently lost during the light diet, weeks 7–10 (group B). Collagens are highlighted in red, proteoglycans in yellow, and glycoproteins in blue. The three most stable collagens, proteoglycans, and glycoproteins in each tissue are named. Percentage of stable (red hashed area) and fast turnover proteins (grey hashed areas) for each tissue are indicated.
-
Figure 2—source data 1
Full profile of incorporation rates (H/L), iBAQ L and iBAQ H values for plasma, skin, bone, and cartilage protein groups during skeletal growth.
Groups A and B shown in Figure 2. Values in red were imputed as follows, missing iBAQ light in >2 samples in group A was assumed to be a consequence of fully labelled protein while missing iBAQ heavy in group B >2 samples as a result of complete turnover. Missing iBAQ light was imputed with the maximum H/L value +0.1 in that column and missing iBAQ heavy with the minimum H/L value –0.01. Only proteins with lysine containing peptides were imputed.
- https://cdn.elifesciences.org/articles/66635/elife-66635-fig2-data1-v1.xlsx
Figure 2—figure supplement 1
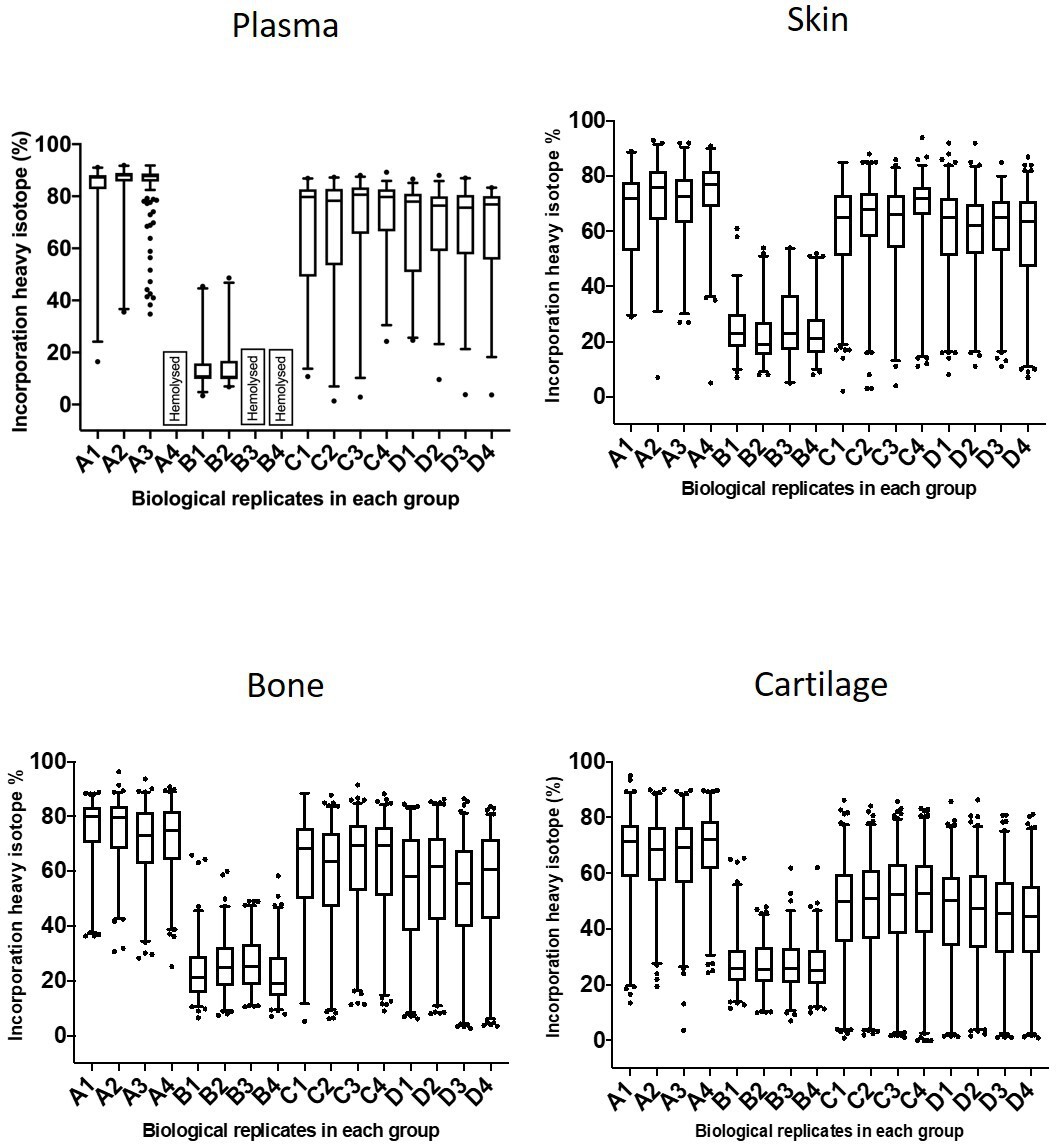
Incorporation of heavy isotope in plasma, skin, bone, and cartilage.
Data set of individual biological replicates for all four groups A–D (n = 2–4). The box extends from the 25th to 75th percentiles. The line in the middle of the box is plotted at the median, and the whiskers represent the 1 and 99 percentiles.
Figure 3
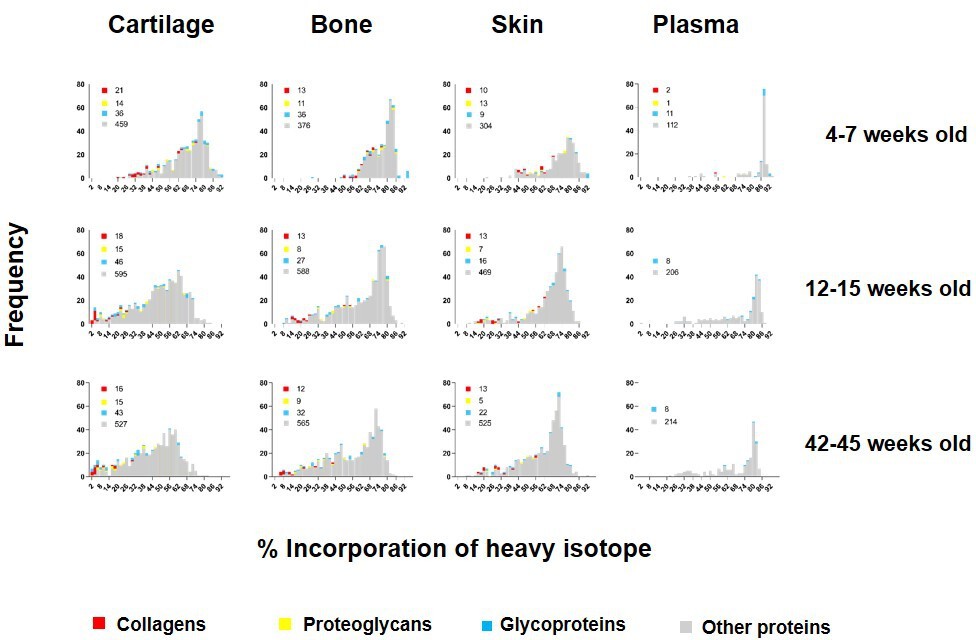
Percentage of incorporation of heavy isotope into newly synthesised proteins in plasma, ventral skin, knee articular cartilage, and tibial bone at different ages.
The percentage of newly synthesised proteins during each heavy diet period is reflected by the percentage of heavy isotope (13C6-Lys) incorporated into proteins. Collagens are labelled in red, proteoglycans in yellow, glycoproteins in blue, and other proteins in grey. Corresponding numbers of a chains are located next to each colour code in legends. New protein synthesis was significantly different between the four tissues and at all age groups, Kruskal–Wallis test, p<0.0001 for all comparisons.
Figure 4
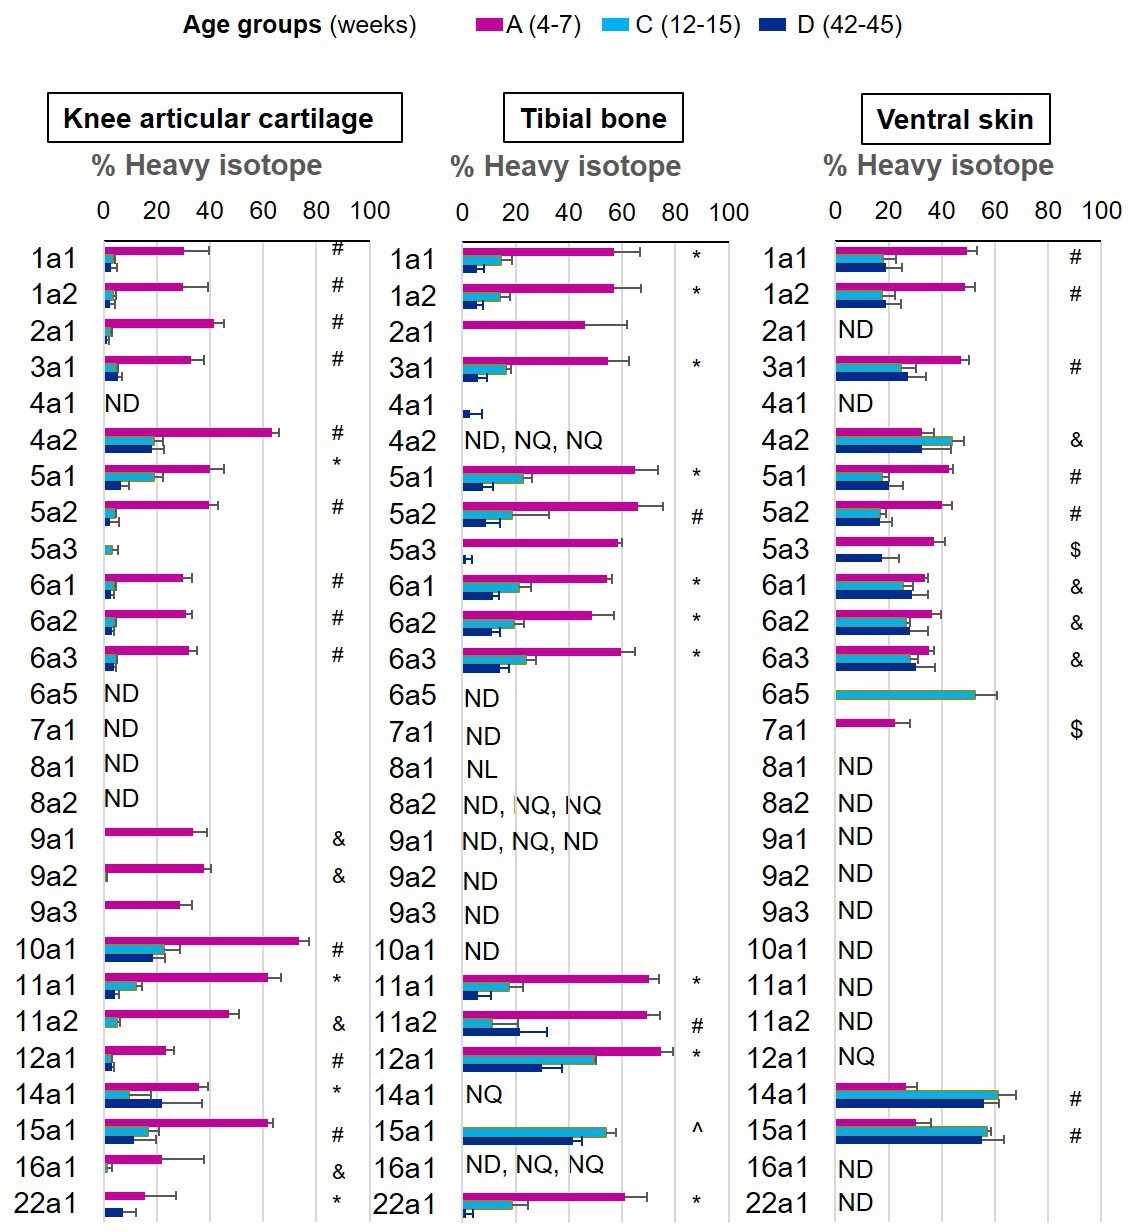
New collagen incorporation into different tissues during ageing.
The percentage of newly synthesised collagen incorporated into articular cartilage, tibial bone, and ventral skin is estimated by the incorporation of the heavy isotope (13C6-Lys) into proteins during the 3 weeks of heavy diet. The three periods of heavy diet were compared: skeletal growth (4–7 weeks old), young adults just after skeletal maturity (12–15 weeks old), and older adults (42–45 weeks old). Error bars represent the standard deviation (n = 4). ND = not detected, protein group not present in the group dataset. NQ = not quantified, protein group present, but with <2 samples quantified. NL = not labelled, protein group with only light isotope quantified. Statistical significance was determined by pairwise comparisons using Perseus software, Student’s t-test reporting Benjamini-Hochberg adjusted p<0.05. Statistically significant differences were denoted as follows: &between groups A and C, $between groups A and D, ^between groups C and D, #between groups A–C and A–D, *between all three groups.
-
Figure 4—source data 1
Data supporting Figure 5.
Percentage of new collagen incorporation in the three collagenous tissues. Cartilage, bone, and skin of skeletally growing mice (group A), young adults (group C), and older adults (group D). Mean ± SD, n = 4, Pairwise comparisons using Student’s t-test, p<0.05 significant.
- https://cdn.elifesciences.org/articles/66635/elife-66635-fig4-data1-v1.xlsx
Figure 5
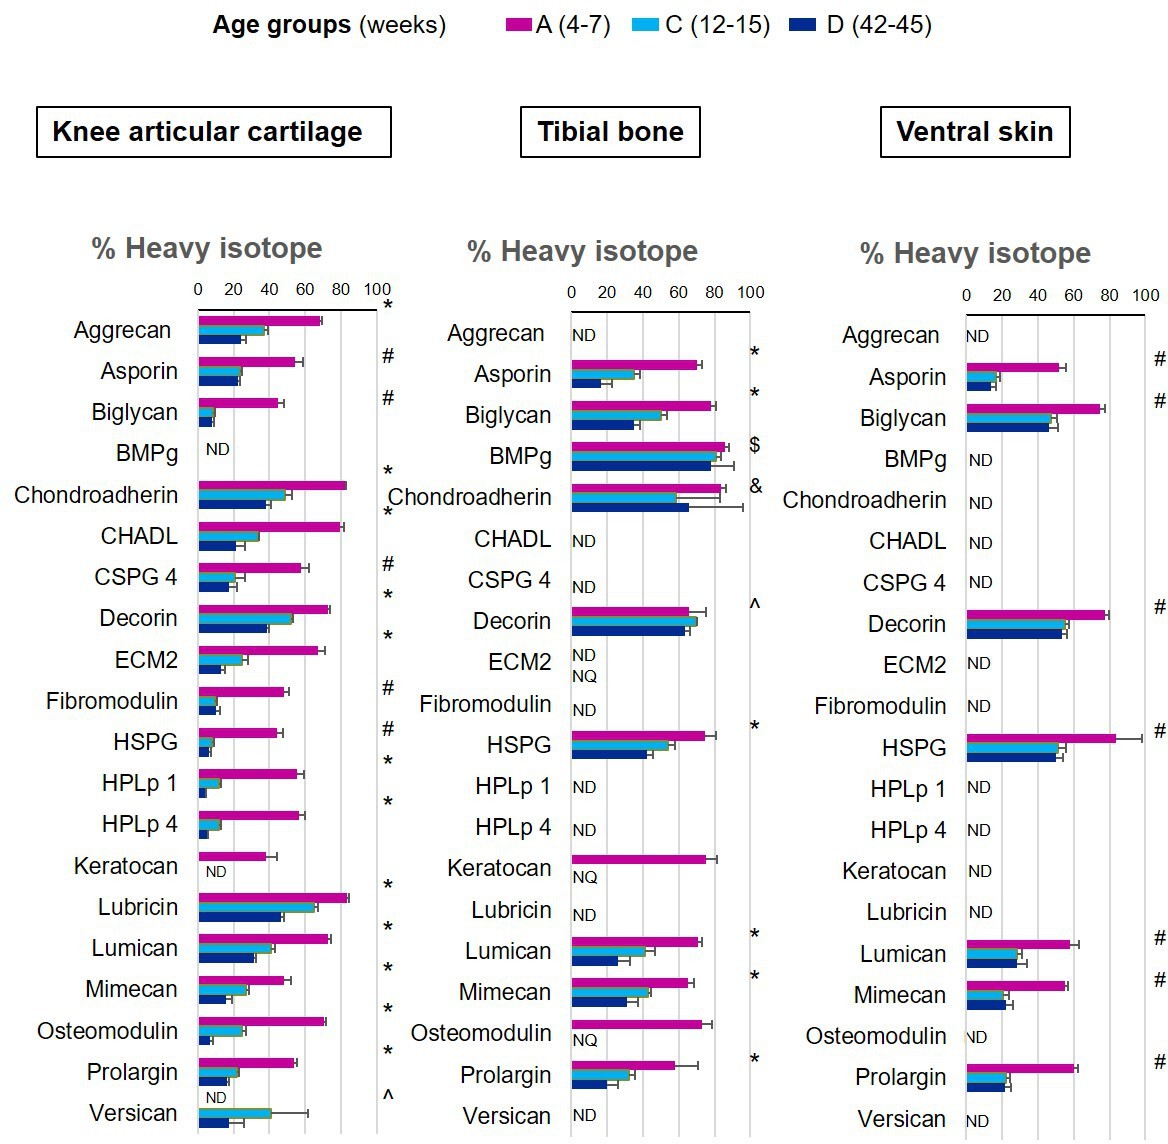
New proteoglycan incorporation rate into different tissues during ageing.
The percentage of newly synthesised proteoglycans incorporated into articular cartilage, tibial bone, and ventral skin is estimated by the percentage of incorporation of the heavy isotope (13C6-Lys) into the proteins during the 3 weeks of heavy diet. Protein synthesis and incorporation was estimated across the healthy life span, covering skeletal growth (4–7 weeks old), young adults just after skeletal maturity (12–15 weeks old), and older adults (42–45 weeks old). Error bars represent the standard deviation (n = 4). ND = not detected, protein group not present in the group dataset. NQ = not quantified, protein group present, but with <2 quantified samples. BMPg, bone marrow proteoglycan. Statistical significance was determined by pairwise comparisons using Perseus software, Student’s t-test reporting Benjamini-Hochberg adjusted p<0.05. Statistically significant differences were denoted as follows: &between groups A and C, $between groups A and D, ^between groups C and D, #between groups A–C and A–D, *between all three groups.
-
Figure 5—source data 1
Data supporting Figure 5.
Percentage of new proteoglycan incorporation in the three collagenous tissues. Cartilage, bone, and skin of skeletally growing mice (group A), young adults (group C), and older adults (group D). Mean ± SD, n = 4, Pairwise comparisons using Student’s t-test, p<0.05 significant.
- https://cdn.elifesciences.org/articles/66635/elife-66635-fig5-data1-v1.xlsx
Figure 6

Heatmap of new glycoproteins incorporation rates into different tissues during ageing.
The percentage of newly synthesised glycoproteins incorporated into articular cartilage, tibial bone, and ventral skin is estimated by the percentage of incorporation of the heavy isotope (13C6-Lys) into the proteins during the 3 weeks of heavy diet. Protein synthesis and incorporation was estimated across life, covering skeletal growth (4–7 weeks old), young adults just after skeletal maturity (12–15 weeks old), and older adults (42–45 weeks old).
-
Figure 6—source data 1
Data supporting Figure 6.
Percentage of new glycoprotein incorporation in the three collagenous tissues. Cartilage, bone, and skin of skeletally growing mice (group A), young adults (group C), and older adults (group D). Mean ± SD, n = 4, Pairwise comparisons using Student’s t-test, p<0.05 significant.
- https://cdn.elifesciences.org/articles/66635/elife-66635-fig6-data1-v1.xlsx
Figure 7 with 3 supplements
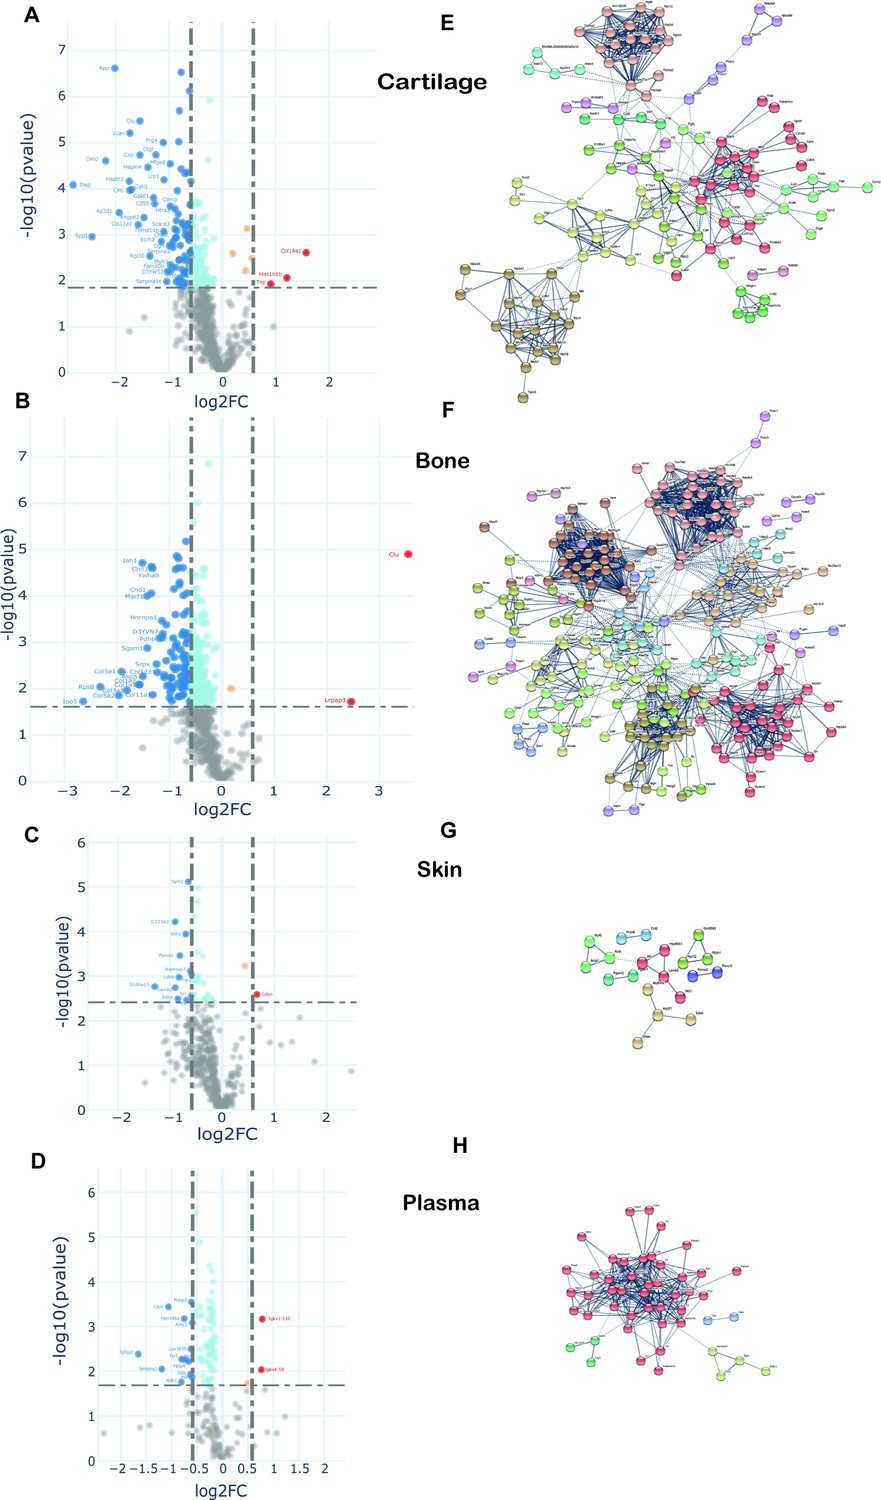
Changes in protein synthesis and incorporation rates during tissue remodelling.
(A–D) Differential protein incorporation rates in young (15 weeks) versus older (45 weeks) adult tissues. (A) Cartilage, (B) bone, (C) skin, and (D) plasma. Volcano plots, unpaired Student’s t-test with BH correction FDR < 0.05, FC > 1.5, n = 4. Full list of proteins available in Figure 7—source data 1. (E–H) STRING cluster analysis of differentially incorporated proteins in each tissue. (E) Cartilage, (F) bone, (G) skin, and (F) plasma. Edges show high confidence interaction score = 0.7. Networks clustered to MCL inflation parameter = 2. Cluster elements are listed in Figure 7—source data 2.
-
Figure 7—source data 1
Data supporting Figure 7A–D.
New protein incorporation across whole tissue proteomes with age. Unpaired Student's t-test statistics with BH corrected p values (p<0.05 significant) of all protein groups included in the volcano plots, plus list of proteins that were recovered using iBAQ heavy or light data.
- https://cdn.elifesciences.org/articles/66635/elife-66635-fig7-data1-v1.xlsx
-
Figure 7—source data 2
Data supporting Figure 7E–H.
STRING clusters with protein description. Proteins with statistically significant changes between groups C and D (unpaired Student's t-test BH corrected p>0.05) were clustered using STRING software. Networks were built with edges high confidence interaction score of 0.7 and clustered applying MCL algorithm with inflation parameter = 2.
- https://cdn.elifesciences.org/articles/66635/elife-66635-fig7-data2-v1.xlsx
Figure 7—figure supplement 1
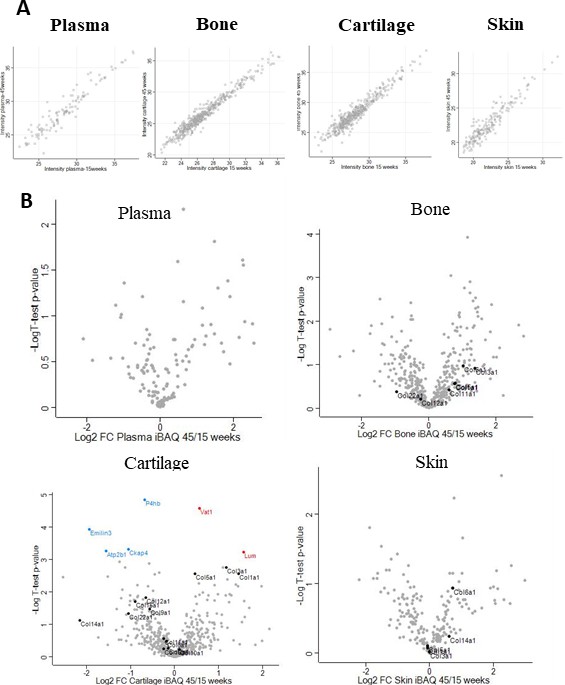
Changes in protein abundance from young to older adults.
(A) Comparison of raw intensities from young adults (15 weeks old) and older adults (45 weeks old) showing that the majority of protein intensities follow a 1:1 ratio. (B). Volcano plots comparing protein abundance based on total iBAQ intensities. Unpaired Student's t-test with BH correction FDR < 0.05, FC > 1.5, n = 4. Collagens are marked as references. In cartilage six proteins were significantly down- (blue) or up- (red) regulated.
Figure 7—figure supplement 2
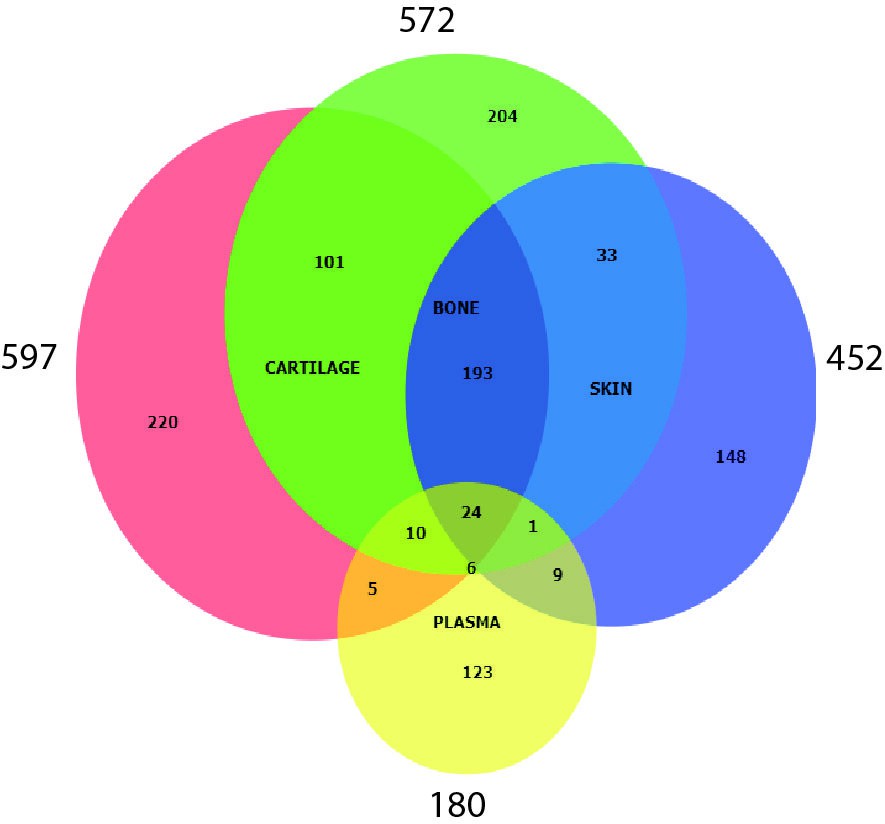
Protein overlap between the four tissues.
Values represent total number of protein groups quantified in each tissue, including those proteins recovered using iBAQ light and heavy data.
Figure 7—figure supplement 3
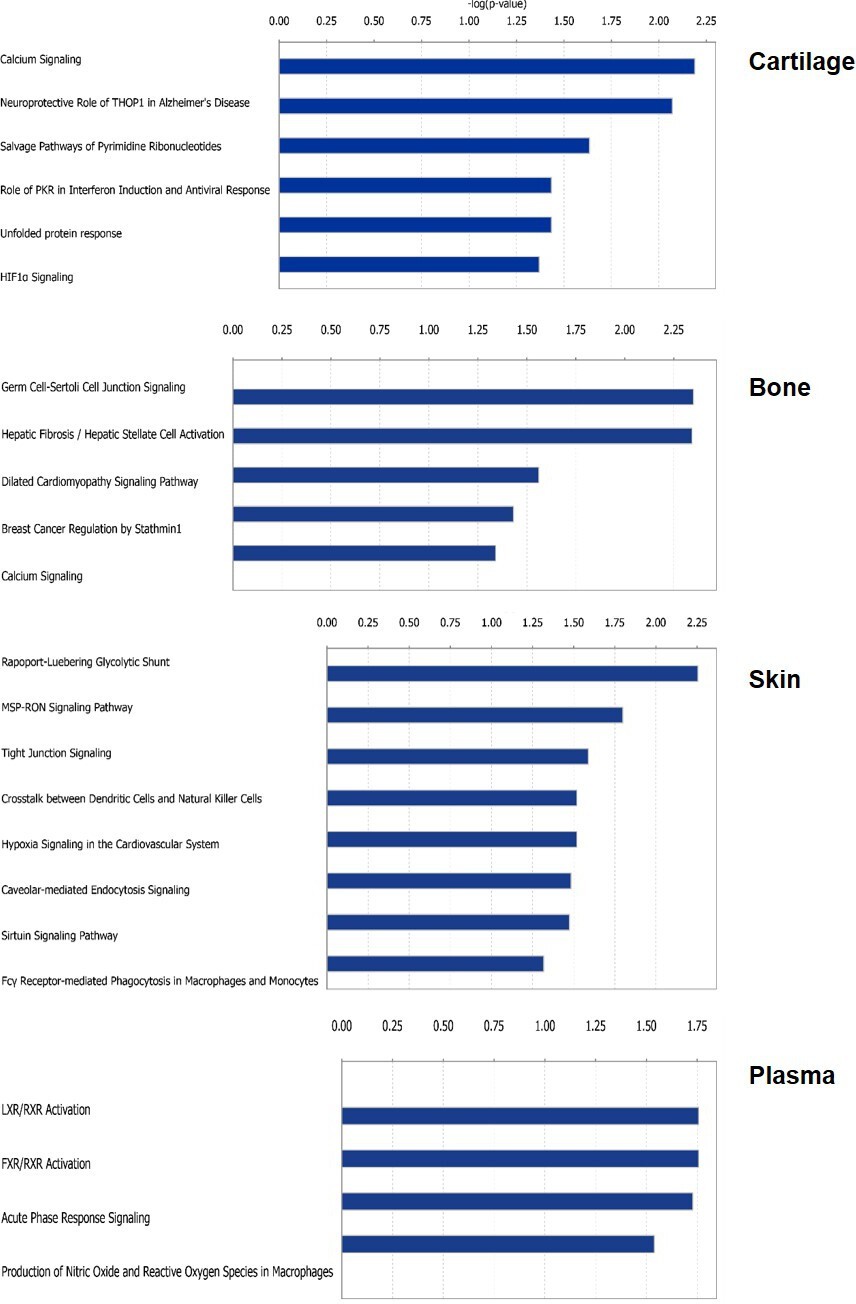
Pathway enrichment using by IPA for young versus older adult regulated protein profiles.
Canonical Pathway enrichment analysis was performed comparing groups C (young adult) and D (older adult) by IPA. Canonical pathways identified by IPA are shown for each tissue. Fisher exact test (p>0.05).
Author response image 1
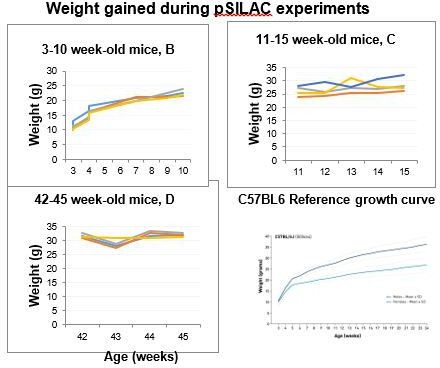
Weight gain for each of the experimental mice over the period of SILAC heavy diet (3-10 weeks, 11-15 weeks or 42-45 weeks).
These weight curves are consistent with reference growth curves in C57BL/6 mice.
Tables
Key resources table
| Reagent type (species) or resource | Designation | Source or reference | Identifiers | Additional information |
|---|---|---|---|---|
| C57BL/6 J (Mus musculus, male) | C57BL/6 J | 4 weeks old mice were from in house breeding colony and 11 and 41 weeks old from Charles rivers laboratories, Oxford, England | RRID:MGI:5655520 | Wild type |
| Chemical compound, drug | 13C6-Lysine-SILAC (97 % atom 13C) | SILANTES GmbH, Munich, Germany | 13C-aa-Lys(6)-SILAC-Mouse diet-252923926 | |
| Chemical compound, drug | 12C6-Lysine-SILAC diets | SILANTES GmbH, Munich, Germany | 12C-aa-Lys(0)-SILAC-Mouse diet-230004600 | |
| Software, algorithm | GraphPad Prism 7 | GraphPad Software Inc, San Diego, CA, USA | Prism: RRID:SCR_015807 | GraphPad Prism 7 |
| Software, algorithm | MaxQuant | MaxQuant | MaxQuant: RRID:SCR_014485 | MaxQuant v1.5.7.4 |
| Software, algorithm | Perseus | Perseus | Perseus: SCR_015753 | Perseus v1.6.1.1 |
| Software, algorithm | Clinical Knowledge Graph’s analytics core | CKG | ||
| Software, algorithm | STRING | STRING | STRING: SCR_005223 | STRING v11 |
| Software, algorithm | IPA | QIAGEN Inc | QIAGEN IPA: SCR_008653 | |
| Software, algorithm | The Database for Annotation, Visualization and Integrated Discovery (DAVID ) v6.8 | DAVID | DAVID v6.8 |
Additional files
Download links
A two-part list of links to download the article, or parts of the article, in various formats.
Downloads (link to download the article as PDF)
Open citations (links to open the citations from this article in various online reference manager services)
Cite this article (links to download the citations from this article in formats compatible with various reference manager tools)
Age-dependent changes in protein incorporation into collagen-rich tissues of mice by in vivo pulsed SILAC labelling
eLife 10:e66635.
https://doi.org/10.7554/eLife.66635


