Insula to mPFC reciprocal connectivity differentially underlies novel taste neophobic response and learning in mice
- Sagol Department of Neuroscience, University of Haifa, Israel
- Center for Gene Manipulation in the Brain, University of Haifa, Israel
Figures
Figure 1 with 1 supplement
Novel taste experience increases number of pERK+ cells in mPFC-projecting aIC neurons.
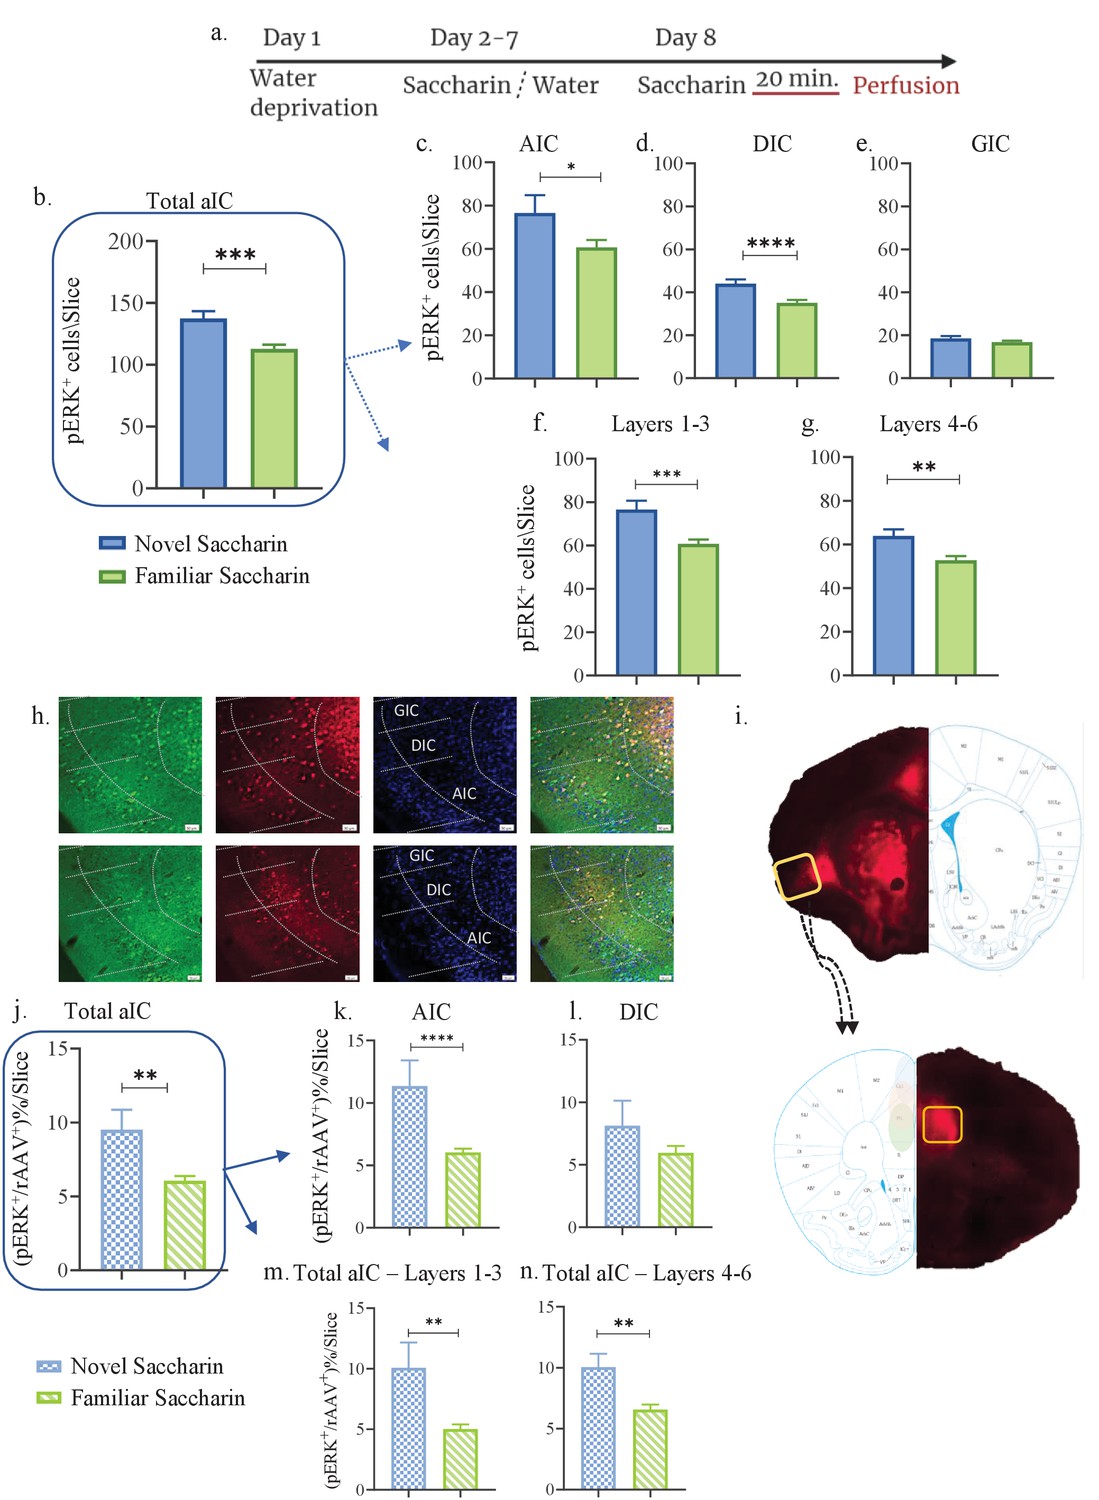
(a) Schematic representation of novel or familiar taste learning; animals were water restricted in the first day and administered with saccharin (familiar saccharin group) or water (novel saccharin group) in the following 6 days. In the last day, mice were presented with 1 ml of Saccharin 20 min prior to perfusion. Number of pERK+ neurons was quantified in the different subregions and layers of the IC. (b) Number of pERK+ neurons was significantly increased in the total IC following novel (137.4±5.876) compared to familiar (112.9±3.308) saccharin consumption. (c) Number of pERK+ neurons was significantly increased in the AIC following novel (76.6±8.201) compared to familiar (60.62±3.476) saccharin consumption. (d) Number of pERK+ neurons was significantly increased in the DIC following novel (44±1.996) compared to a familiar (35.13±1.270) saccharin consumption. (e) Number of pERK+ neurons was unchanged in the GIC following novel (18.5±1.096) and familiar (16.79±0.6797) saccharin consumption. (f) Number of pERK+ neurons was significantly increased in the outer layers of the IC following novel (76.58±4.103) compared to familiar (60.75±2.016) saccharin consumption. (g) Number of pERK+ neurons was significantly increased in the inner layers of the IC following novel (63.87±3.009) compared to familiar (52.76±1.868) saccharin consumption. (h) Representative coronal IC sections immunostained for pERK (green) and DAPI (blue) from mice injected with retroAAV at the mPFC (red) following novel (upper) and familiar (lower) saccharin. Scale bar, 50 µm, 20x. (i) Stereotaxic injection of rAAV-mCherry construct (red) at the mPFC and its subsequent labeling in the IC. Representative schematic overlays of the Cre-dependent expression of the chemogenetic receptors using the rAAV systems is shown, demonstrating the expressionto be restricted in the aIC and mPFC. Number of double-labeled (pERK+, rAAV+) neurons was calculated as a percentage of all rAAV+ neurons. (j) Percentage of double-labeled neurons of the IC was significantly higher following novel (9.517±1.337) compared to familiar (6.065 ± 0.313%) saccharin consumption. (k) Percentage of double-labeled neurons of the AIC was significantly higher following novel (11.36 ± 2.050%) compared to familiar (6.036±0.303) saccharin consumption. (l) Percentage of double-labeled neurons of the DIC was similar following novel (8.126 ± 2%) and familiar (5.956 ± 0.546%) saccharin consumption. (m) Percentage of double-labeled neurons of the outer layers of the IC was similar following novel (10.08 ± 2.079%) and familiar (5.02 ± 0.381%) saccharin consumption. (n) Percentage of double-labeled neurons of the inner layers of the IC was similar following novel (10.05 ± 1.089%) and familiar (6.562 ± 0.411%) saccharin consumption. Data are shown as mean ± SEM. *p<0.05, **p< 0.01, ***p<0.001, ****p<0.0001.
-
Figure 1—source data 1
Novel taste experience increases number of pERK cells in mPFC-projecting aIC neurons.
- https://cdn.elifesciences.org/articles/66686/elife-66686-fig1-data1-v2.xlsx
Figure 1—figure supplement 1
aIC-mPFC reciprocal connectivity is prominent in the AIC and DIC of the aIC and the prelimbic subregion of the mPFC.
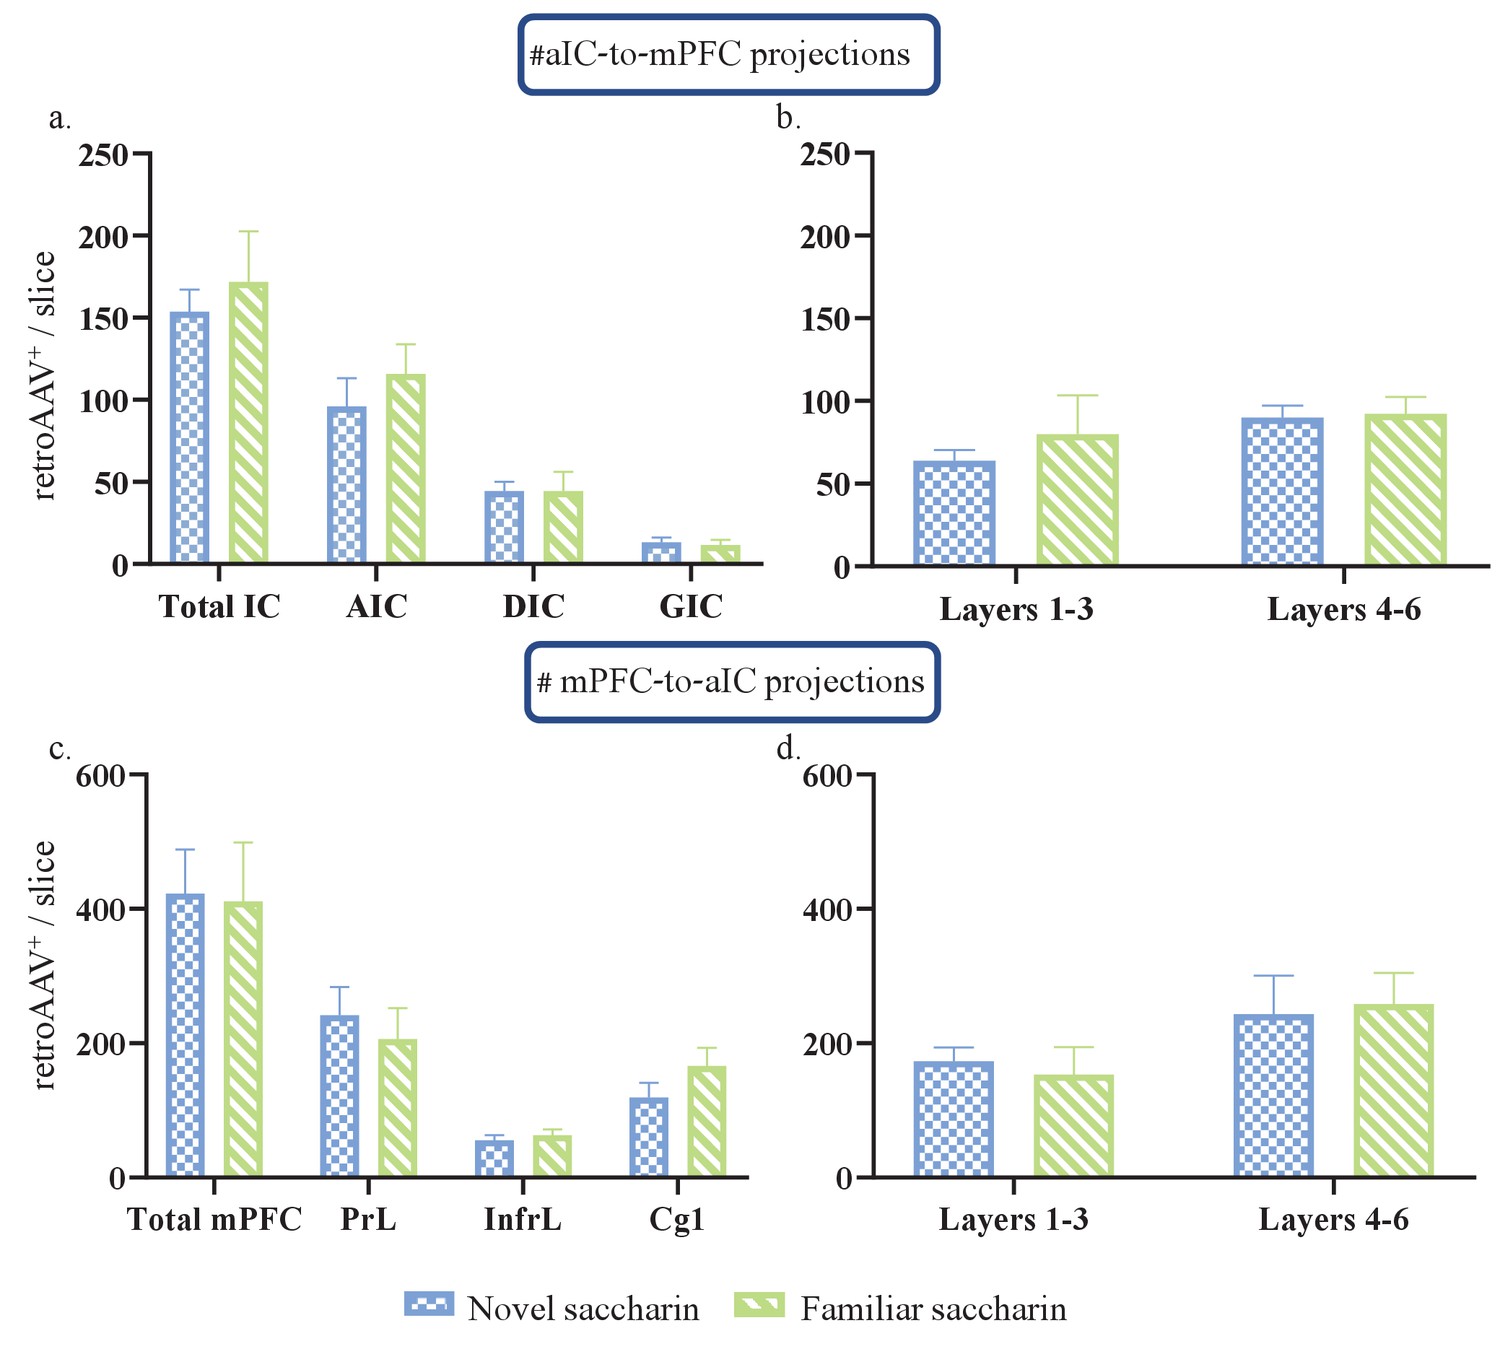
(a) Number of rAAV+ neurons of the total aIC (Novel:153.7±13.47, familiar: 171.8±3.09; t=0.4708, df=5), AIC (Novel: 96.03±17.24, familiar:115.7±18.11; t=0.7629, df=5), DIC (Novel: 44.57±5.445, familiar: 44.52±11.7; t=0.003, df=5) and the GIC (Novel: 13.15±2.924, familiar:11.49±3.191; t=0.3689, df=5), was similar between novel and familiar saccharin groups. (b) Number of rAAV+ neurons of the outer (novel: 63.77±6.471, familiar: 79.92±23.53; t=0.5693, df=5) and inner layers (novel: 89.97±7.159, familiar:92.15±10.28; t=0.1608, df=5) of the aIC was unchanged between novel and familiar saccharin groups. (c) Number of rAAV+ neurons of the total mPFC (novel: 422.7±65.71, familiar: 411.4±87.25; t=0.1035, df=4), prelimbic (novel: 241.9±41.83, familiar: 206.3±45.84; t=0.5744, df=4), infralimbic (55.51±7.743, 63.42±8.417; t=0.6703, df=4) and the Cg1(novel: 119.1±22.37, famililar: 166.2±27.08; t=1.343, df=4) was similar between novel and familiar saccharin groups. (d) Number of rAAV+ neurons of the outer (novel:173.4±20.33, familiar: 153.1±41.35; t=0.04402, df=4) and inner layers (novel: 243.1±57.88, familiar:258.2±46.44; t=0.2041, df=4) of the mPFC was unchanged between novel and familiar saccharin groups.
-
Figure 1—figure supplement 1—source data 1
aIC-mPFC reciprocal connectivity is prominent in the AIC and DIC of the aIC and the prelimbic subregion of the mPFC.
- https://cdn.elifesciences.org/articles/66686/elife-66686-fig1-figsupp1-data1-v2.xls
Figure 2 with 2 supplements
Novel taste exposure increases excitability of mPFC-projecting neurons of the inner insular layers.
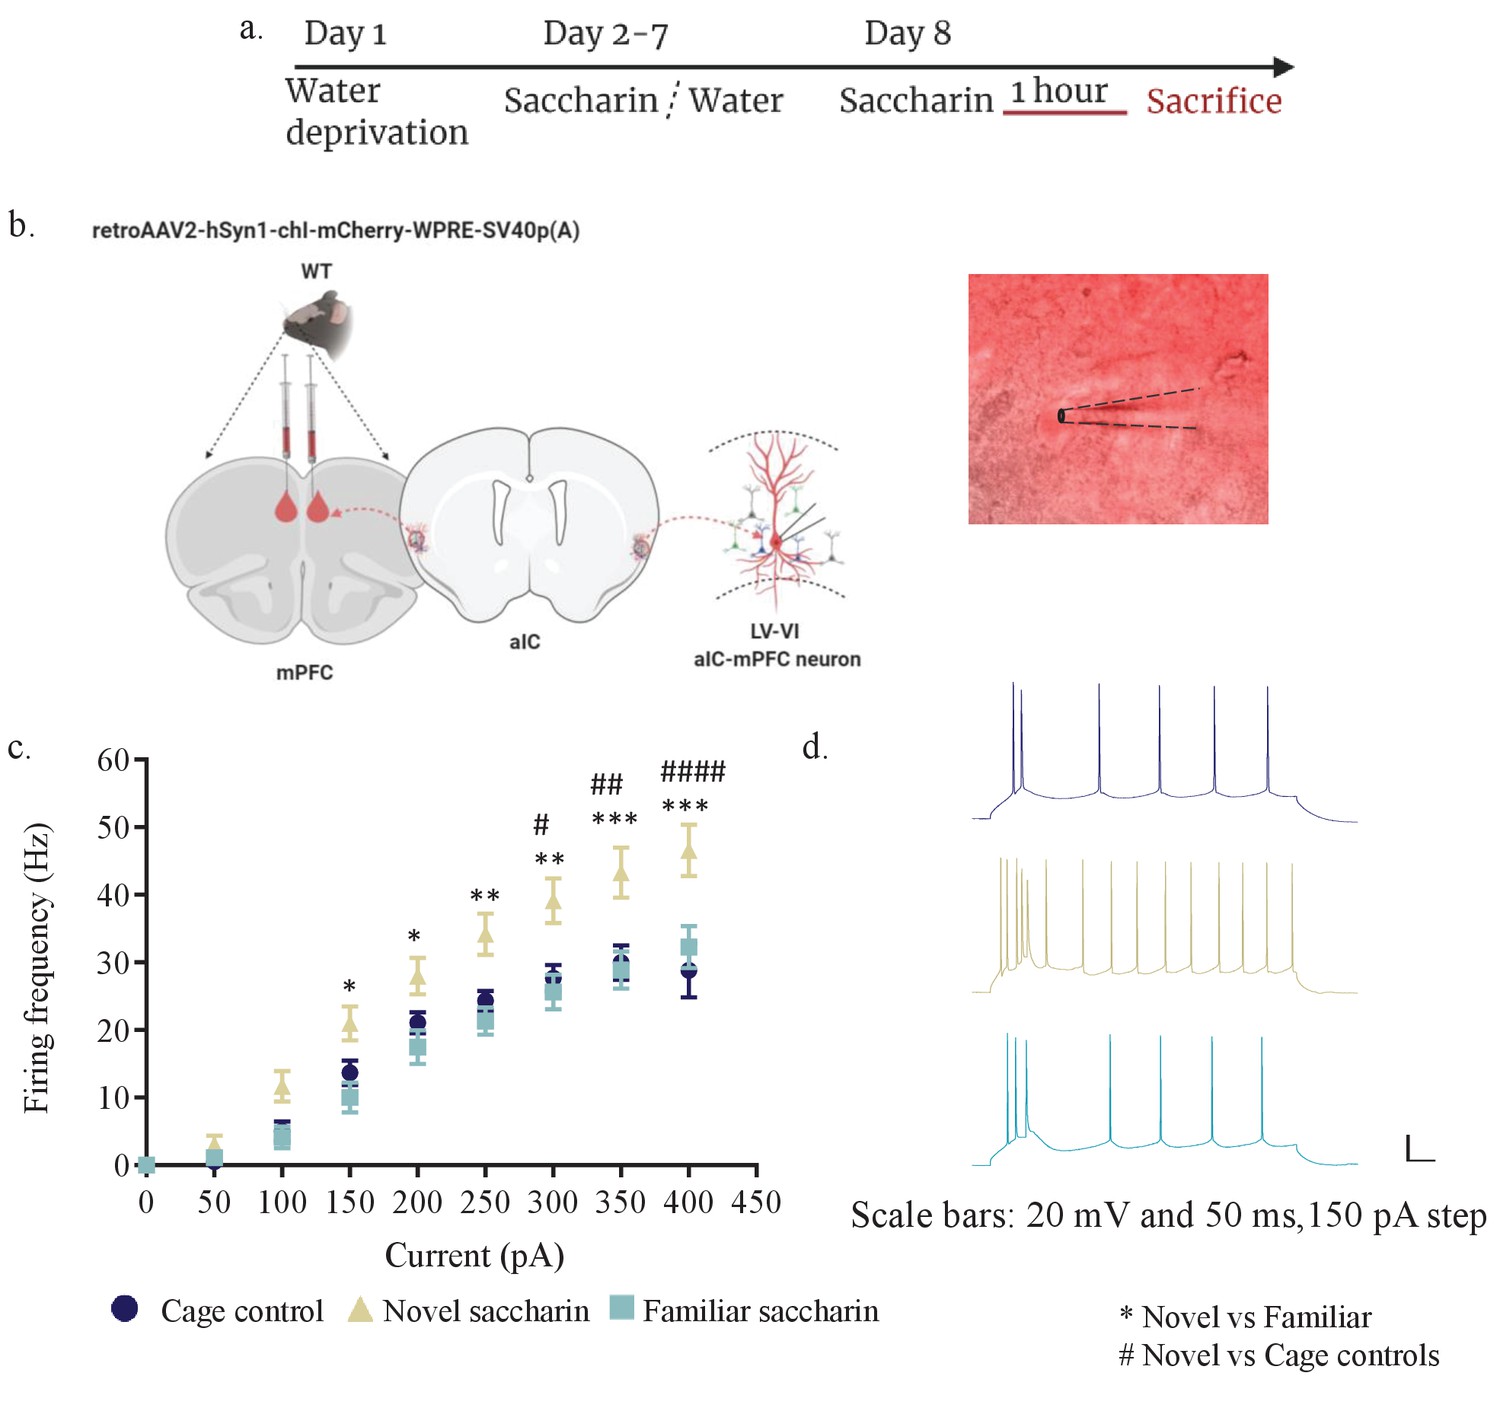
(a) Schematic representation of novel or familiar taste learning. Animals were water restricted in the first day and administered with saccharin (familiar saccharin group) or water (novel saccharin group) in the following 6 days. Mice were given novel or familiar saccharin and sacrificed 1 hr later. Intrinsic properties were measured in the different layers of the aIC. (b) Whole-cell current-clamp recordings of aIC neurons projecting to mPFC (red). (c, d) The dependence of firing rate on current step magnitude is significantly higher in layers V/VI insular neurons projecting to mPFC following novel compared to familiar taste or cage controls (two-way repeated measurements ANOVA, n=13–14 cells per group; p=0.0009; F (2, 37) = 8.465). Error bars represent SEM; *p<0.05, **p< 0.01, ***p<0.001, ****p<0.0001.
-
Figure 2—source data 1
Novel taste exposure increases excitability of mPFC projecting neurons of the inner insular layers.
- https://cdn.elifesciences.org/articles/66686/elife-66686-fig2-data1-v2.xlsx
Figure 2—figure supplement 1
Layer II/III of mPFC projections of the aIC displays similar intrinsic properties after novel and familiar taste exposure.
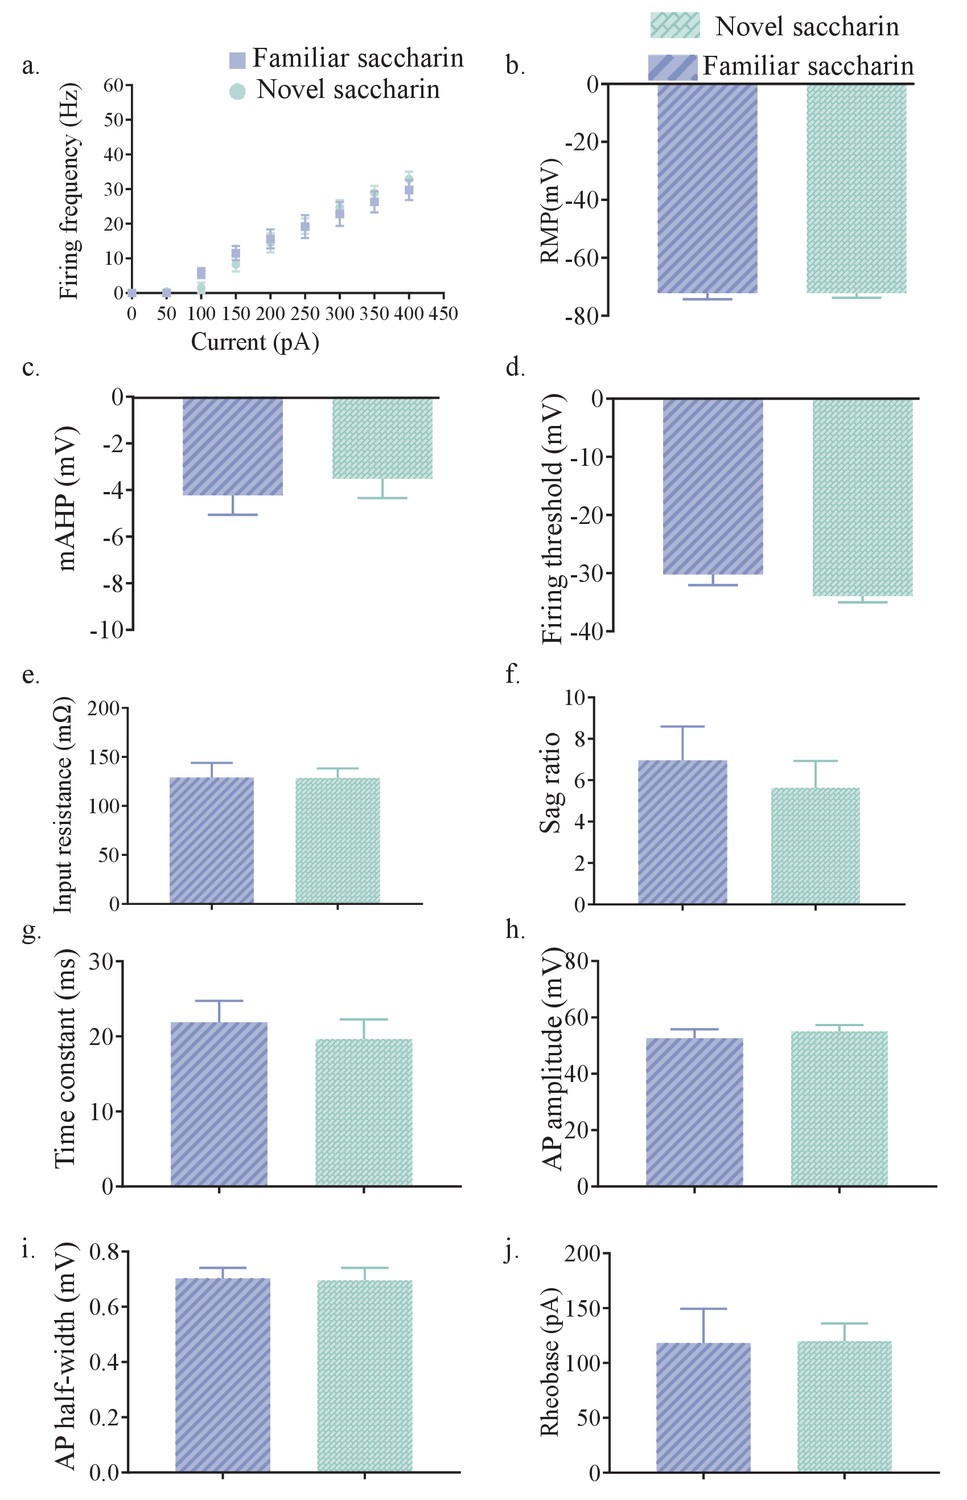
(a) The dependence of firing rate on current step magnitude was not significantly different between layer II/III insular neurons projecting to mPFC following novel or familiar saccharin consumption (two-way repeated measurements ANOVA, n = 10 cells per group, p=0.0823). (b) The resting membrane potential (RMP) of mPFC-projections in the outer layers of the aIC was similar between novel (−71.65±1.504 mV, n=14) and familiar saccharin (−72.26±2.02 mV, n=10; Mann Whitney test, U51, p = 0.8094). (c) The amplitude of mAHP of mPFC-projections in the outer layers of the aIC was not significantly different between novel (−3.509±0.8405 mV, n=10) or familiar saccharin (−4.223±0.8426 mV, n=10; two-tailed t-test; p=0.556). (d) Threshold potential for action potential firing (measured at a change of 30 V/s in the membrane potential) of mPFC-projections in the outer layers of the aIC was similar following novel (−33.92±1.109 mV, n=10) and familiar (−30.2±1.845 mV, n=10; two-tailed t-test; p=0.1008) saccharin. (e) The input resistance of mPFC-projections in the outer layers of the aIC (calculated from the voltage response to −150 pA hyper-polarizing current step) was not significantly different between novel (128.6±9.645 MΩ, n=10) and familiar saccharin (128.9±15.02 MΩ, n = 10; two-tailed t-test; p=0.9891). (f) Sag ratio of mPFC-projections in the outer layers of the aIC was not significantly different between novel (5.631±1.298, n=10) and familiar saccharin (6.96±1.633, n=10; two-tailed t-test; p=0.5323). (g) The membrane time constant of mPFC-projections in the outer layers of the aIC was not significantly different between novel (19.63±2.623 ms, n=10) and familiar saccharin (21.89±2.855 ms, n=10; two-tailed t-test, p=0.5673). (h) Action potential amplitude of mPFC-projections in the outer layers of the aIC was not significantly different between novel (55.06 ±2.263 mV, n=10) and familiar taste (52.61±3.211 mV, n=10; two-tailed t-test, p=0.5403). (i) Action half-width of mPFC-projections in the outer layers of the aIC was not significantly different following novel (0.703±0.03798 ms, n=10) and familiar saccharin (0.696±0.04483 ms, n=10; Unpaired t test; p=0.9065). (j) The amount of current required to elicit a single action potential (Rheobase, calculated from 10 ms current injection) of mPFC-projections in the outer layers of the aIC was not significantly different following novel (119.9±16.23 pA, n=10) and familiar taste (118.2±31.24 pA; n=10; two-tailed t-test; p=0.9620). Error bars represent SEM.
-
Figure 2—figure supplement 1—source data 1
Layer II/III of mPFC projections of the aIC displays similar intrinsic properties after novel and familiar taste exposure.
- https://cdn.elifesciences.org/articles/66686/elife-66686-fig2-figsupp1-data1-v2.xls
Figure 2—figure supplement 2

Novel taste exposure increases excitability of mPFC-projecting neurons of the inner insular layers.
(a) The amplitude of mAHP of layer V/VI insular neurons projecting to mPFC was not significantly different between novel (−5.163±0.916 mV, n=14), familiar saccharin (−4.14 ± 0.6927 mV, n=13) and cage controls (−3.359 ± 0.9374 mV; n=13; one-way ANOVA p=0.5384). (b) Threshold potential for action potential firing (measured at a change of 30 V/s in the membrane potential) was similar between novel (−35±1.499 mV, n=14), familiar saccharin (33.08±2.421 mV, n=13) and cage controls (−33.17 ± 1.884, n=13; one-way ANOVA; p=0.7316). (c) The resting membrane potential (RMP) of layer V/VI insular neurons projection to mPFC is significantly higher following novel saccharin (−66.67±1.469 mV, n=14) or cage controls (−68.37 ± 1.177, n=13) compared to familiar saccharin (−62.18±1.368 mV, n=13; one-way ANOVA; F (2, 37) = 6.732, p = 0.0032). (d) The membrane time constant of layers V/VI insular neurons projecting to mPFC was not significantly different between novel (18.4±2.049 ms, n=14), familiar saccharin (14.27±1.842 ms, n=13) and cage controls (18.74 ± 2.406 ms, n=13; one-way ANOVA, p = 0.2673). (e) Action potential amplitude was not significantly different following novel (50.53 ± 2.242 mV, n=14), familiar saccharin (56.4±2.135 mV, n=13) and cage controls (53.82 ± 2.298 mV, n=13; one-way ANOVA, p=0.1837). (f) Action potential half-width was significantly lower following novel saccharin (0.6136±0.03875 ms, n=14) compared to cage controls (0.8308 ± 0.05237 ms; one-way ANOVA, F (2, 37) = 5.041, p=0.0116), but not compared to familiar saccharin (0.6931±0.05582 ms, n=13). (g) The amount of current required to elicit a single action potential (Rheobase, calculated from 10 ms current injection) is similar between novel (68.86±8.601 pA, n=14), familiar saccharin (102.7±13.68 pA, n=13) and cage controls (81.62 ± 10.71 pA, n=13; one-way ANOVA, p = 0.1054). h,i. The input resistance of layer V/VI insular neurons projecting to mPFC, calculated from the voltage response to −150 pA hyper-polarizing current step, is significantly increased following novel (150.1±12.94 MΩ, n=14) compared to familiar saccharin (106.9±11.32, MΩ, n = 13) but not compared to cage controls (128.5 ± 10.54 MΩ; one-way ANOVA: p = 0.0428, F (2, 37) = 3.436). (j) Sag ratio of layer V/VI insular neurons projecting to mPFC is similar between novel (8.349±2.134, n=14), familiar saccharin (12.29±1.993, n=13) and cage controls (14.11 ± 2.752; one-way ANOVA: p=0.2046). Error bars represents SEM.
-
Figure 2—figure supplement 2—source data 1
Novel taste exposure increases excitability of mPFC-projecting neurons of the inner insular layers.
- https://cdn.elifesciences.org/articles/66686/elife-66686-fig2-figsupp2-data1-v2.xls
Figure 3
Novel taste experience increases number of pERK+ cells in aIC-projecting neurons of the mPFC.
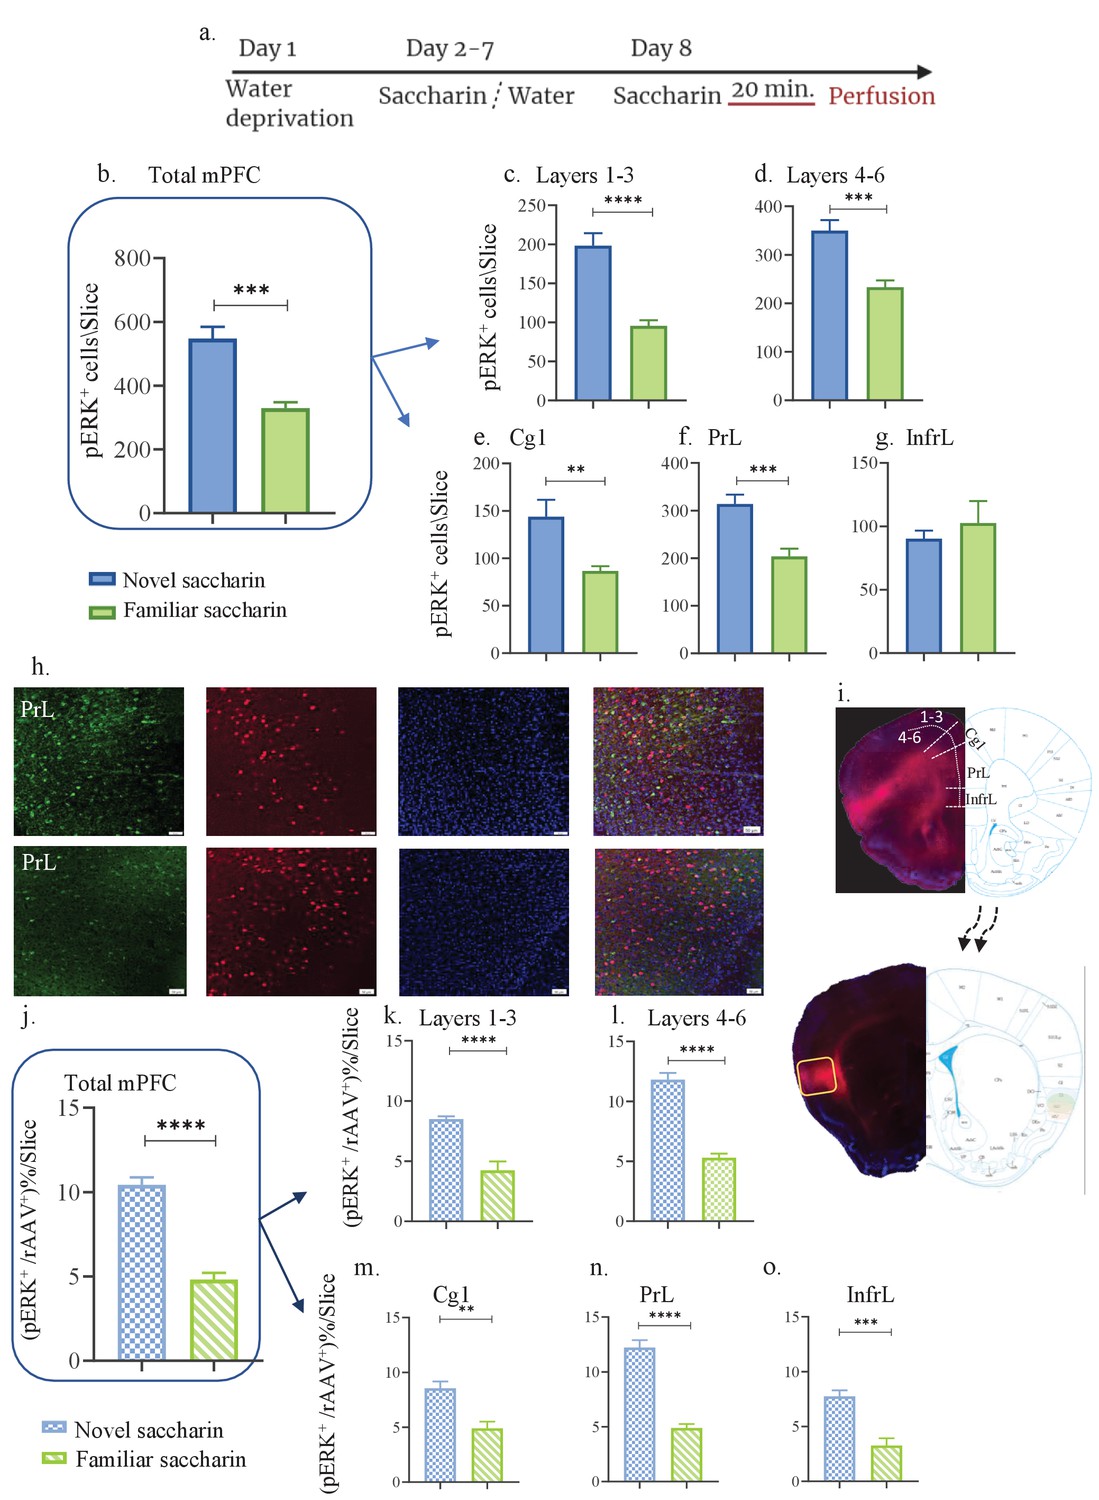
(a) Schematic representation of novel or familiar taste learning; animals were water restricted in the first day and administered with saccharin (familiar saccharin group) or water (novel saccharin group) in the following 6 days. In the last day, mice were presented with 1 ml of Saccharin 20 min prior to perfusion.number of pERK+ neurons was quantified in the different subregions and layers of the mPFC. (b) Number of pERK+ neurons of the mPFC was significantly increased following novel (548.1±36.24) compared to familiar (329±18.89) saccharin consumption. (c) Number of pERK+ neurons of the outer layers of the mPFC was significantly increased following novel (198±16.15) compared to familiar (95.75±6.920) saccharin consumption. (d) Number of pERK+ neurons of the inner layers of the mPFC was significantly increased following novel (349±21.67) in comparison to familiar (233.4±14.040) saccharin consumption. (e) Number of pERK+ neurons in the Cg1 was significantly higher following novel (143±17.71) compared to familiar (86.63±4.988) saccharin consumption. (f) Number of pERK+ neurons in the PrL was significantly higher following novel (314±19.68) in comparison to familiar (203.6±16.44) saccharin consumption. (g) Number of pERK+ neurons in the InfrL was similar following novel (90.23±6.423) and familiar (102.6±17.32) saccharin consumption. (h) Representative coronal mPFC sections immunostained for pERK (Green) and DAPI (blue) from mice injected with rAAV at the IC (Red) following novel (upper) and familiar (lower) saccharin. Scale bar, 50 µm, 20x. (i) Stereotaxic injection of rAAV-mCherry construct (red) at the IC and its subsequent labeling in the mPFC. Representative schematic overlays of the Cre-dependent expression of the chemogenetic receptors using the rAAV systems is shown, demonstrating the expressionto be restricted in the aIC and mPFC. Percentage of double labeled (pERK+,rAAV+) neurons was calculated as a percentage of all rAAV+ neurons. (j) Percentage of double-labeled neurons of the mPFC was significantly increased following novel (10.44 ± 0.434%) compared to familiar (4.819 ± 0.397%) saccharin consumption. (k) Percentage of double-labeled neurons of the outer layers of the mPFC was significantly increased following novel (8.49 ± 0.230%) compared to familiar (4.23 ± 0.739%) saccharin consumption. (l) Percentage of double-labeled neurons of the inner layers of the mPFC was significantly increased following novel (11.81 ± 0.561%) compared to familiar (5.296 ± 0.340%) saccharin consumption. (m) Percentage of double-labeled neurons of the Cg1 was significantly increased following novel (8.543 ± 0.633%) compared to familiar (4.897±0.617) saccharin consumption. (n) Percentage of double-labeled neurons of the Prl was significantly increased following novel (12.23 ± 0.665%) in comparison to familiar (4.893 ± 0.358%) saccharin consumption. (o) Percentage of double-labeled neurons of the InfrL was significantly increased following novel (7.744 ± 0.554%) in comparison to familiar (3.261 ± 0.673%) saccharin consumption. Data are shown as mean ± SEM. *p<0.05, **p< 0.01, ***p<0.001, ****p<0.0001.
-
Figure 3—source data 1
Novel taste experience increases number of pERK cells in aIC-projecting neurons of the mPFC.
- https://cdn.elifesciences.org/articles/66686/elife-66686-fig3-data1-v2.xlsx
Figure 4 with 1 supplement
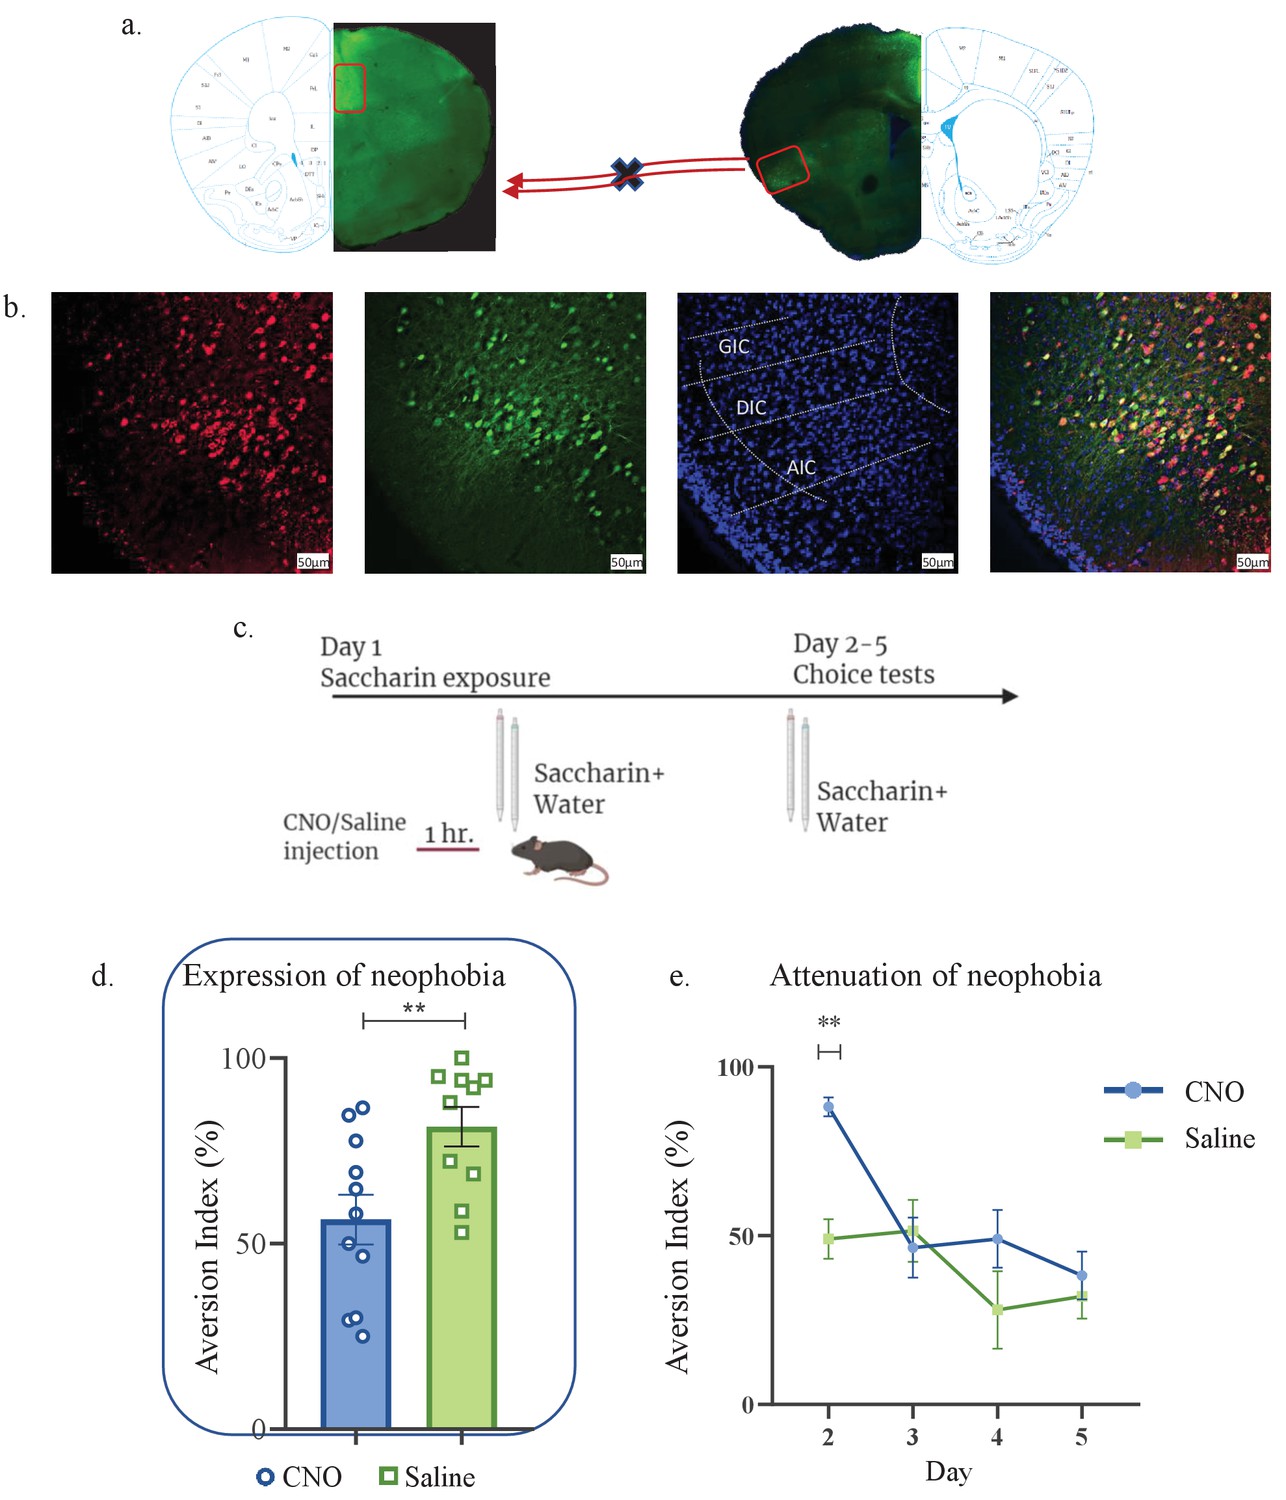
aIC-to-mPFC projecting neurons are necessary for both novel taste neophobic response and learning.
WT male mice were injected with retrograde-Cre AAV at the mPFC (green) and the Cre-dependent DREADDs at the IC (red), resulting in expression of inhibitory hMD4Gi in aIC-to-mPFC neurons. (a) Representative images of retrograde-Cre AAV injection in the mPFC and the consequent labeling in the IC (red). (b) Representative images of neurons targeted for inhibition in the IC: Cre-dependent expression of the chemogenetic receptors (red), retrograde-Cre AAV (green) and DAPI (blue). (c) Schematic representation of behavioral test conducted. Mice injected with IC-to-mPC inhibitory DREADDs received intraperitoneal injection of CNO or Saline 1 hr prior to novel saccharin (first exposure) and water choice test, while aversionwas assessed. In the following days, mice were given a choice test without intervention. (d) CNO-injected mice exhibited significantly lower aversion (51.21 ± 8.255%) levels than do Saline-injected controls (78.36 ± 4.33%) in the first choice day (expression of neophobia). (e) CNO-injected mice were significantly more averse to saccharin (87.45 ± 4.336%, compared to saline (54.57 ± 5.708%)) injected controls in the second day. CNO-injected and saline-injected mice showed similar aversion in the third (CNO: 60.70 ± 8.599%, Saline: 54.93 ± 12.68%) fourth (CNO: 51.13 ± 7.804%, Saline: 27.29 ± 14.34%) and fifth (CNO: 45.77 ± 7.852%, Saline: 29.63 ± 6.974%) day of choice tests. Data are shown as mean ± SEM. *p<0.05, **p< 0.01, ***p<0.001, ****p<0.0001.
-
Figure 4—source data 1
aIC-to-mPFC projecting neurons are necessary for both novel taste neophobic response and learning.
- https://cdn.elifesciences.org/articles/66686/elife-66686-fig4-data1-v2.xlsx
Figure 4—figure supplement 1
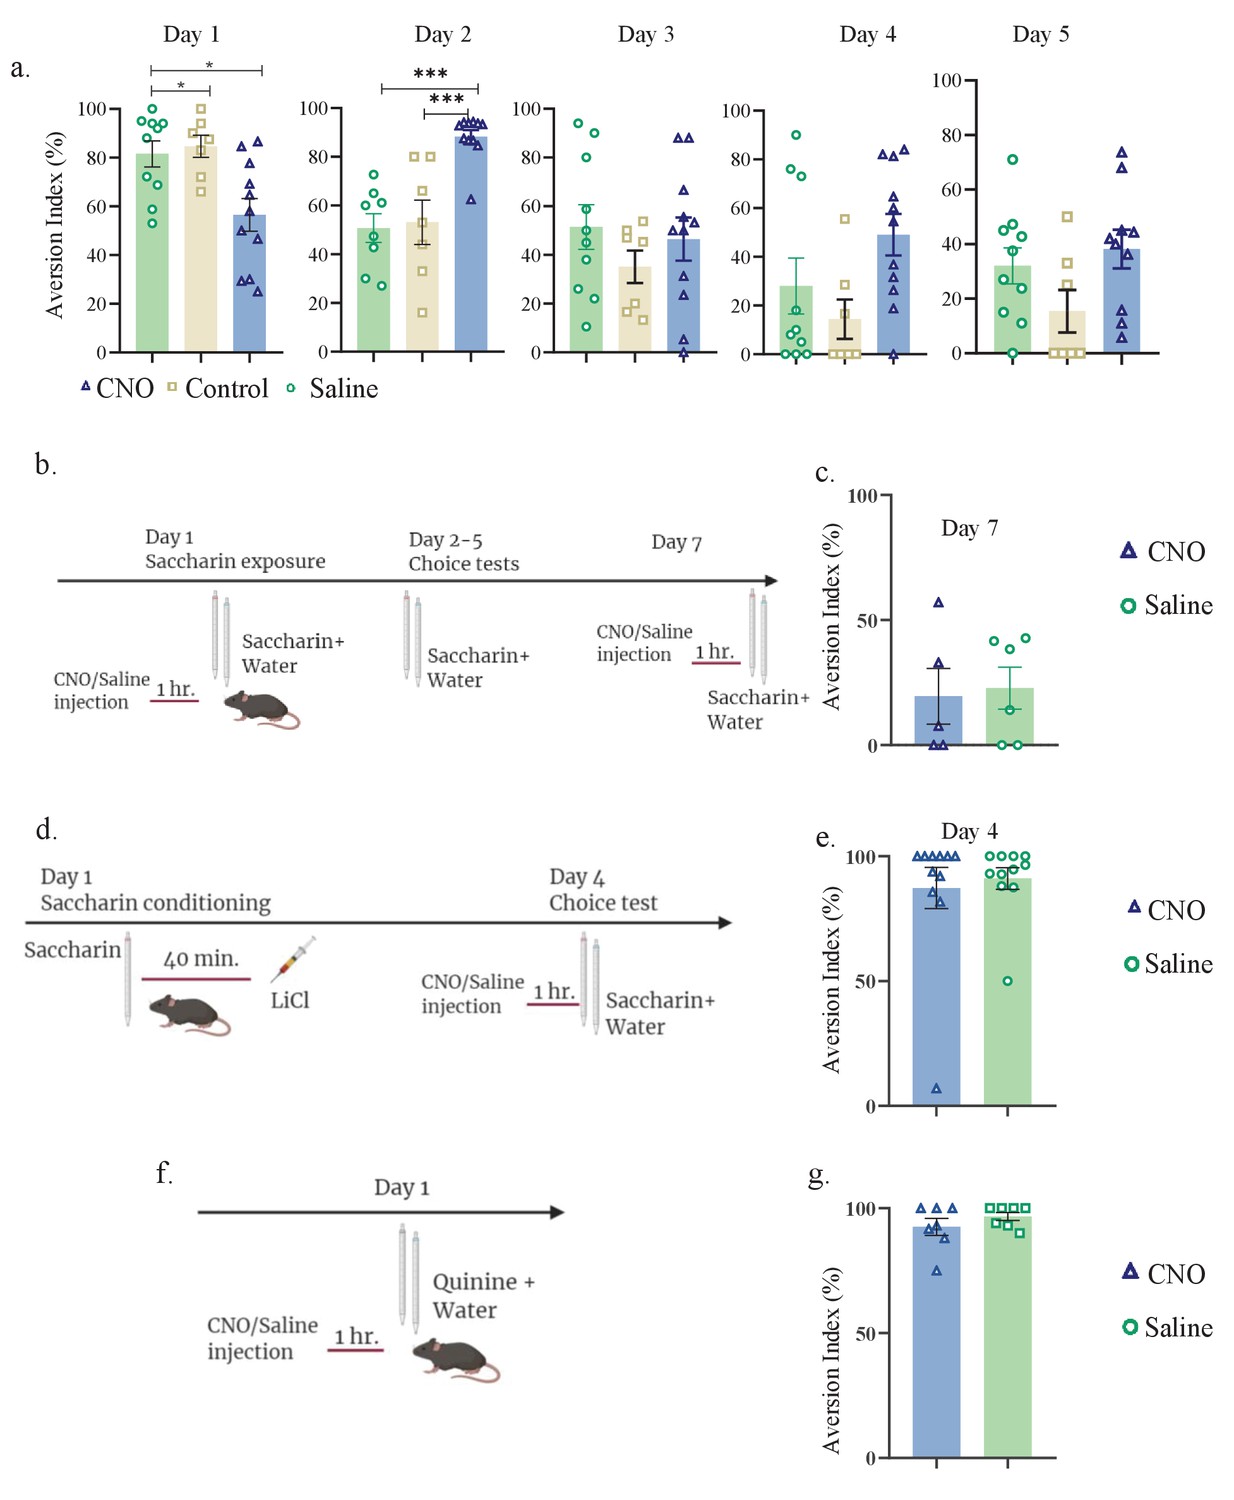
aIC-to-mPFC inhibition does not affect taste recognition.
Daily analysis of aIC-to-mPFC inhibition during novel taste learning tests. Day 1: one-way ANOVA: F (2, 25) = 6.953, p=0.004; Day 2: one-way ANOVA: p<0.0001, F (2, 23) = 15.35; Day 3: one-way ANOVA: F (2, 25) = 0.7685; p=0.4743; Day 4: p=0.0653, F (2, 25) = 3.050; Day 5: one-way ANOVA: p=0.1123, F (2, 24) = 2.398. (b) Experimental design for inhibiting aIC-to-mPFC projecting neurons during familiar taste retrieval test: animals were i.p. injected with CNO(n=5)/Saline(n=6) 1 hr prior to familiar saccharin and water choice test (day 7 of the experiment). (c) Similar aversion was obtained for both CNO and saline-injected mice (CNO: 19.56 ± 11.17%, Saline: 22.80 ± 8.392%; unpaired t-test; p=0.818, t=0.236, DF=9) during familiar taste retrieval. (d) Experimental design for inhibiting aIC-to-mPFC projections during CTA retrieval. Animals were given saccharin and injected with LiCl after 40 min. Two days later, animals were injected with CNO/saline prior to saccharin and water choice test. (e) Similar aversion was recorded for both CNO (87.3 ± 8.264%) and saline (91.14 ± 4.346%) injected mice during CTA retrieval (unpaired t-test; p=0.685, t=0.411, DF=20). (f) Schematic representation of behavioral test conducted. Animals injected with aIC-to-mPFC inhibitory DREADDs underwent Quinine/water choice test 1 hr following CNO or saline injection. (g) Both CNO and saline-injected mice were similarly aversive toward quinine: t-test; p=0.292, t=1.102, DF=12; CNO=92.53 ± 3.437%; saline=96.71 ± 1.614%.
-
Figure 4—figure supplement 1—source data 1
aIC-to-mPFC inhibition does not affect taste recognition.
- https://cdn.elifesciences.org/articles/66686/elife-66686-fig4-figsupp1-data1-v2.xlsx
Figure 5
Activity within aIC-to-BLA projecting neurons is necessary for novel taste response but not for its attenuation.
WT male mice were injected with retrograde-Cre AAV at the BLA (green) and Cre-dependent DREADDs at the IC (red), resulting in expression of inhibitory hMD4Gi in aIC-to-BLA projecting neurons. (a) Representative images of retrograde-Cre AAV injection in the BLA (green) and the consequent labeling in the IC. (b) Representative images of IC-to-BLA projecting neurons that are targeted for inhibition using Cre-dependent expression of the chemogenetic receptors (red), retrograde-Cre AAV (green) and DAPI (blue). (c) Schematic representation of behavioral test conducted. Mice injected with IC-to-BLA inhibitory DREADDs received intraperitoneal injection of CNO or Saline 1 hr prior to novel saccharin (first exposure) and water choice test, while aversion was assessed. In the following days, mice were given a choice test without intervention. (d) CNO-injected mice exhibited lower aversion (41.11 ± 9.309%) levels than do Saline-injected controls (79.60 ± 5.604%) in the first choice day (unpaired t-test: p=0.007, t=3.243, DF=12). (e) CNO-injected and saline-injected mice showed similar aversion on the second (CNO: 36.26 ± 11.04%, Saline: 40.0 ± 12.98%), third (CNO: 16.06 ± 5.01%, Saline: 18.25 ± 8.920%), fourth (CNO: 26.13 ± 10.52%, Saline: 18.67 ± 12.48%), and fifth (CNO: 6.50 ± 4.153%, Saline: 0.00 ± 0.00%) day of expression of neophobia. Data are shown as mean ± SEM. *p<0.05, **p< 0.01, ***p<0.001, ****p<0.0001.
-
Figure 5—source data 1
Activity within aIC-to-BLA projecting neurons is necessary for novel taste response but not for its attenuation.
- https://cdn.elifesciences.org/articles/66686/elife-66686-fig5-data1-v2.xlsx
Figure 6 with 2 supplements

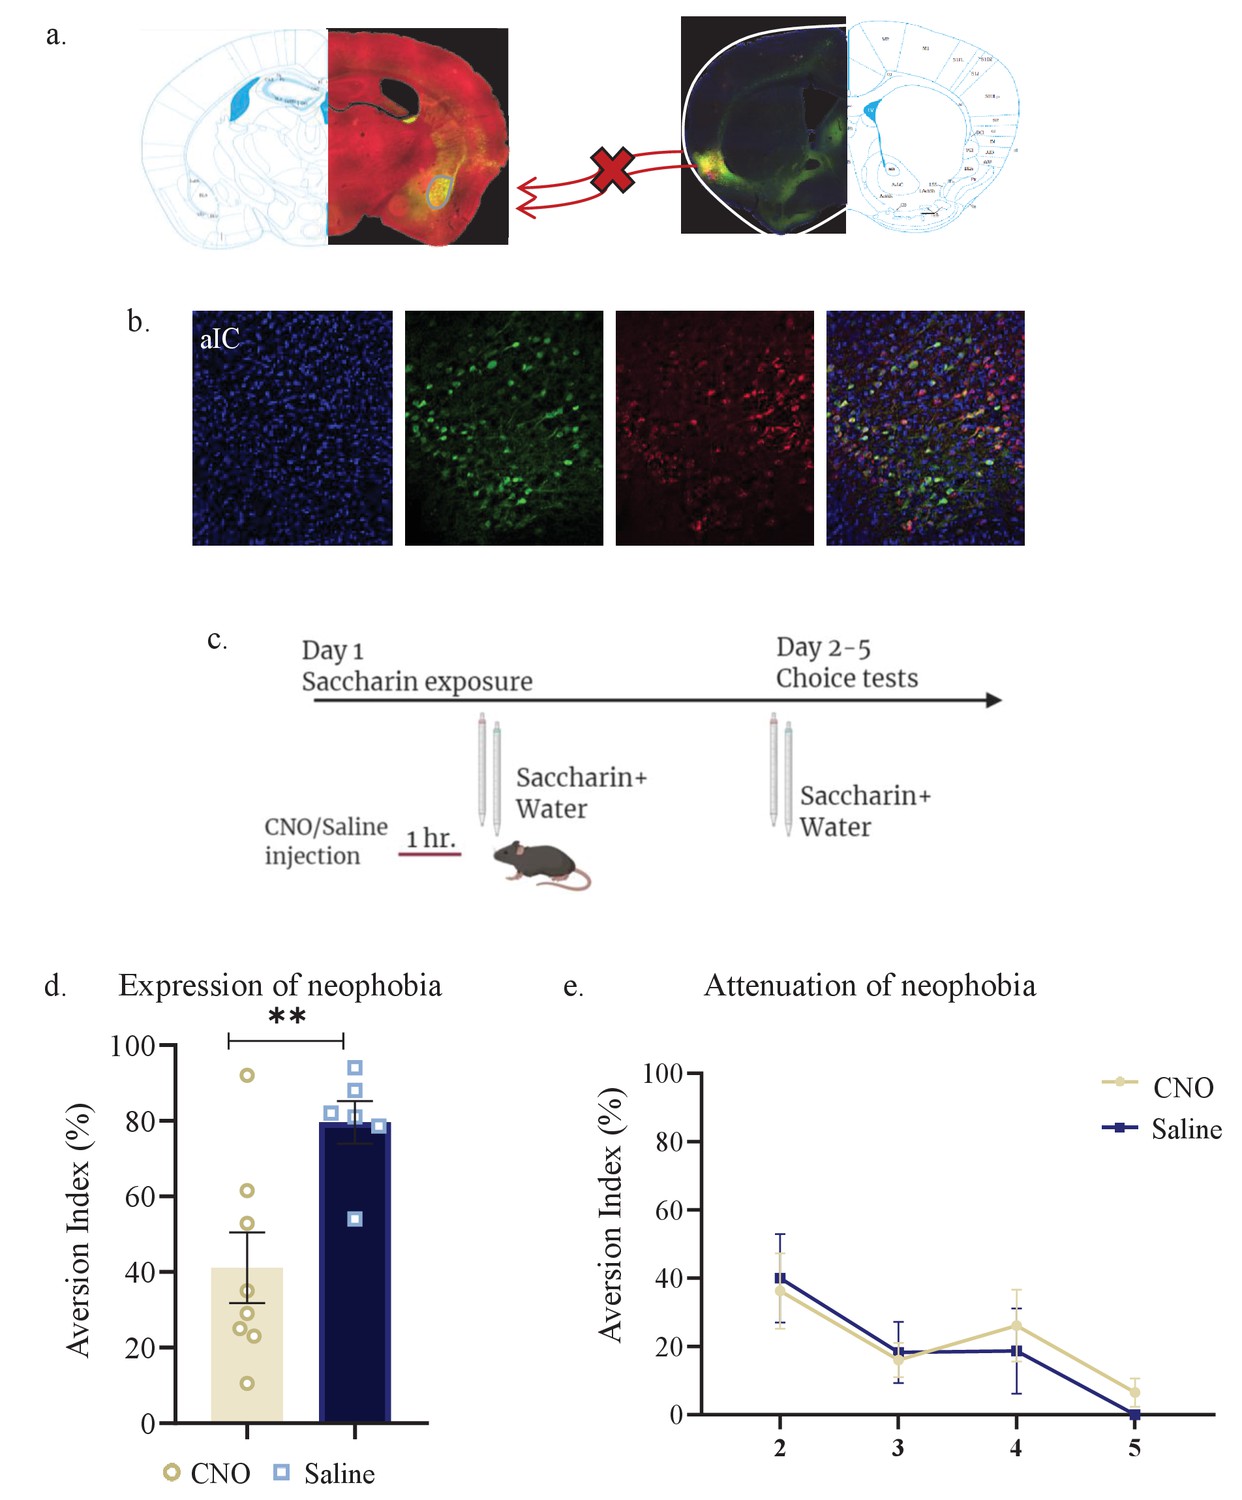
Activity of mPFC-to-aIC projecting neurons is necessary for novel taste neophobic reaction but not for the learning.
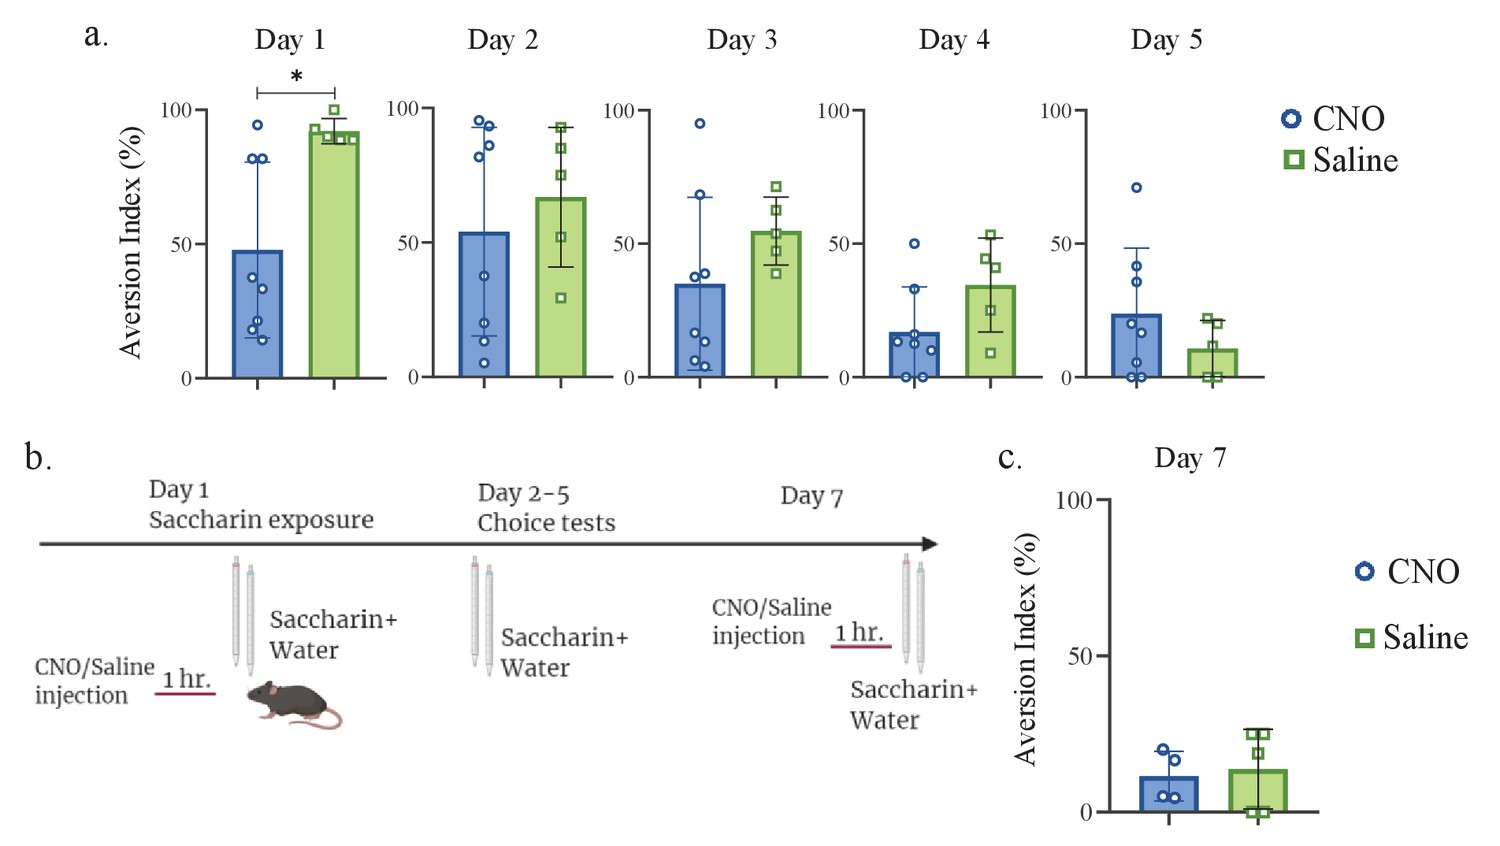
WT male mice were injected with Cre-dependent DREADDs at the mPFC and rAAV-Cre at the IC, resulting in expression of inhibitory hMD4Gi in mPFC-to-aIC neurons. (a) Representative images of retrograde-Cre AAV injection in the IC (red) and the consequent labeling in the mPFC. (b) Representative images of mPFC-to-aIC projecting neurons that are targeted for inhibition: Cre-dependent expression of the chemogenetic receptors (red), retrograde-Cre AAV (green) and DAPI (blue). (c) Schematic representation of behavioral test conducted. Mice injected with mPFC-to-IC inhibitory DREADDs received intraperitoneal injection of CNO or Saline 1 hr prior to novel saccharin (first exposure) and water choice test, while aversion was assessed. In the following days, mice were given a choice test without intervention. (d) CNO-injected mice (47.81 ± 11.58%) exhibited significantly lower aversion levels than do saline-injected controls (92.08 ± 2.111%) in the first choice day (expression of neophobia). (e) CNO-injected and saline-injected mice showed similar aversion on the second (CNO: 54.06 ± 13.71%, Saline: 66.84 ± 11.60%), third (CNO: 34.98 ± 11.44%, Saline: 54.76 ± 5.693%), fourth (CNO: 16.85 ± 5.986%, Saline: 34.54 ± 7.856%), and fifth (CNO: 23.80 ± 8.681%, Saline: 10.74 ± 4.712%) day of attenuation of neophobia. Data are shown as mean ± SEM. *p<0.05, **p< 0.01, ***p<0.001, ****p<0.0001.
-
Figure 6—source data 1
Activity of mPFC-to-aIC projecting neurons is necessary for novel taste neophobic reaction but not for the learning.
- https://cdn.elifesciences.org/articles/66686/elife-66686-fig6-data1-v2.xls
Figure 6—figure supplement 1
mPFC-to-aIC projecting neurons are necessary for novel taste response but not for familiar taste taste retrieval.
(a) Daily analysis of mPFC-to-aIC inhibition during novel taste learning tests. Day2: unpaired t-test; p=0.531, t=0.647, DF=11; Day 3: unpaired t-test; p=0.224, t=1.288, DF=11; Day 4: unpaired t-test; p=0.098, t=1.808, DF=11; Day 5: unpaired t-test; p=0.289, t=1.112, DF=11. (b) Schematic representation of behavioral test conducted. Animals injected with mPFC-to-aIC inhibitory DREADDs were familiarized to saccharin and on the seventh day underwent saccharin/water choice test 1 hr following CNO or saline injection. (c) CNO (11.53 ± 3.974%) and saline (13.75 ± 5.728%) injected mice showed similar aversion (unpaired t-test: p=0.772, t=3.018, DF=7) during familiar taste retrieval.
-
Figure 6—figure supplement 1—source data 1
mPFC-to-aIC projecting neurons are necessary for novel taste response but not for familiar taste retrieval.
- https://cdn.elifesciences.org/articles/66686/elife-66686-fig6-figsupp1-data1-v2.xlsx
Figure 6—figure supplement 2
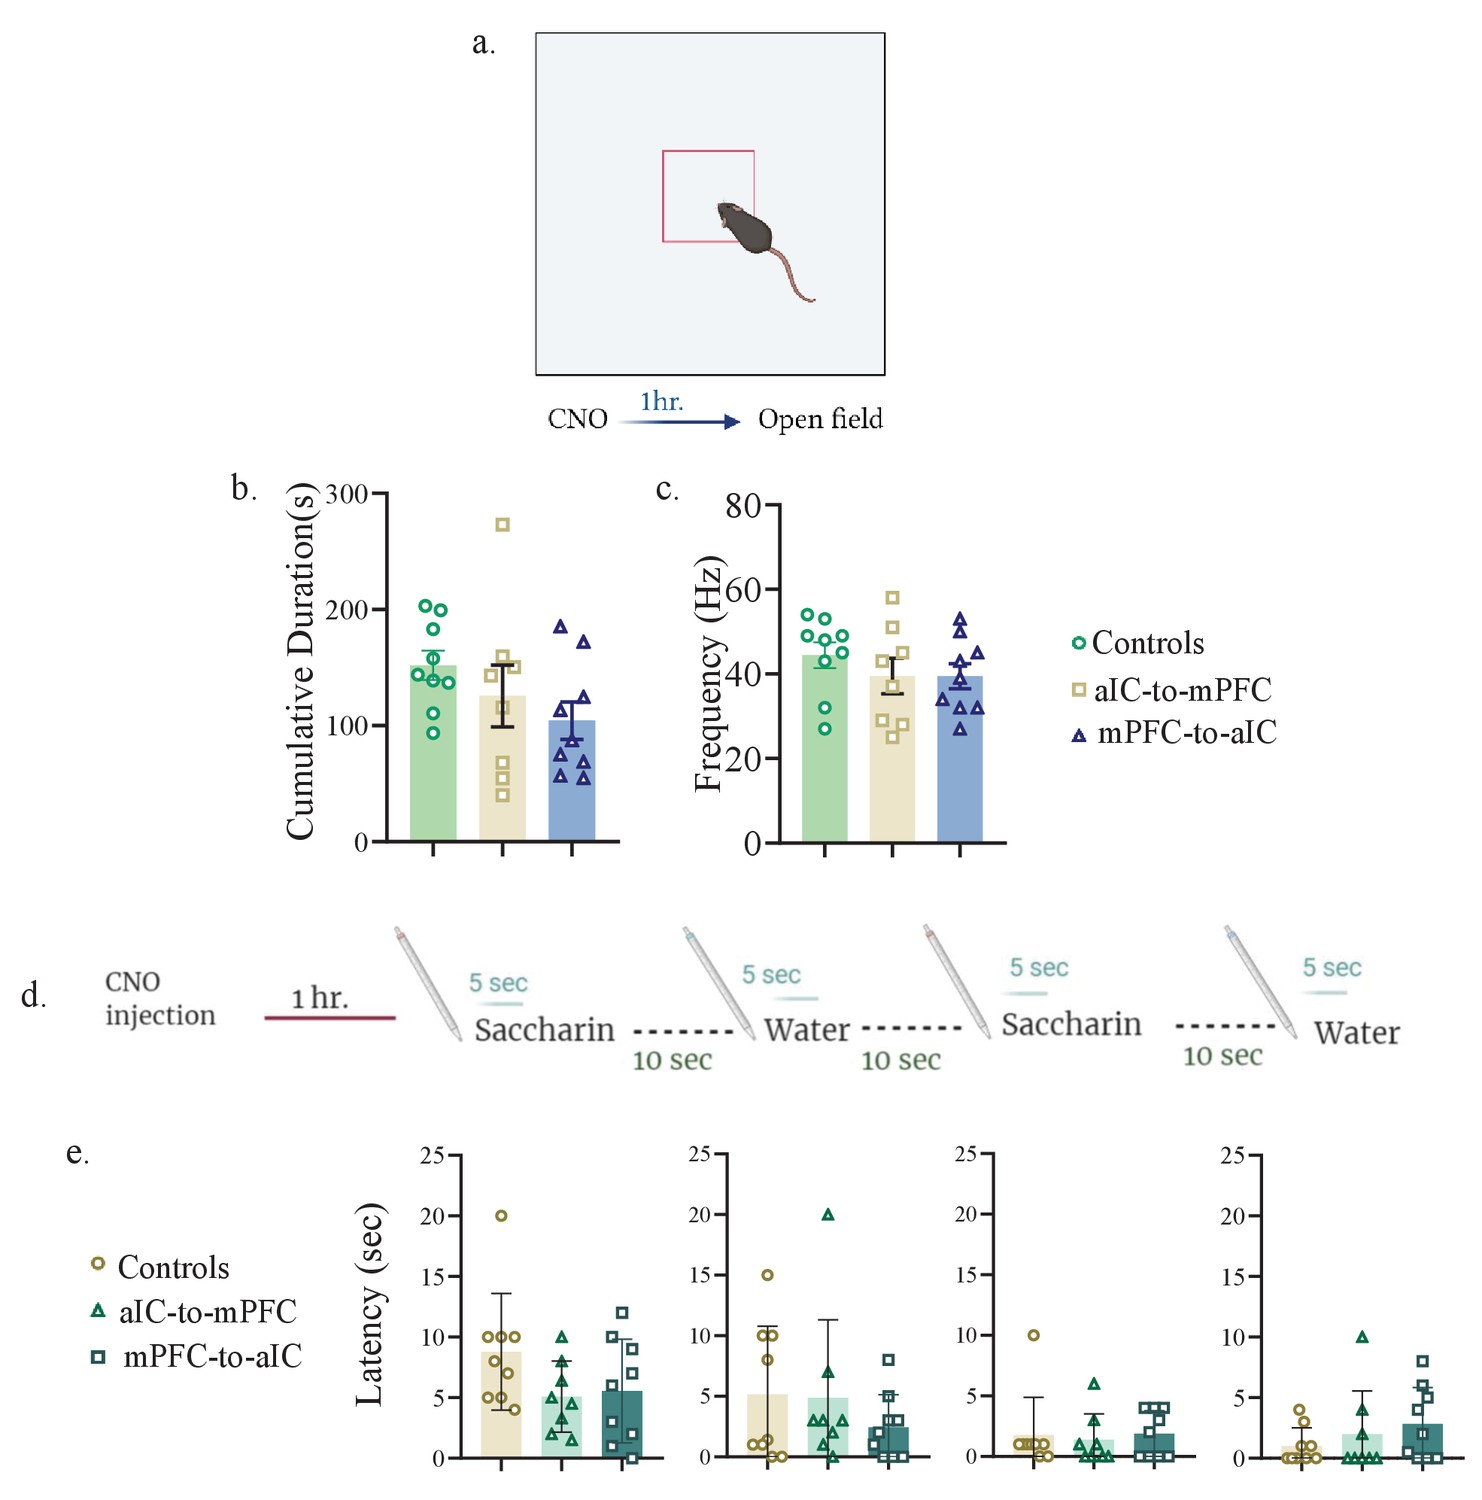
Inhibition of aIC-to-mPFC and mPFC-to-aIC projecting neurons does not affect anxiety-related behavior.
(a) Mice injected with aIC-to-mPC/mPFC-to-aIC inhibitory DREADDs or aIC-to-mPFC control vectors were i.p injected with CNO. One hr later, mice were exposed to an open field box and left to explore for 10 min. (b) Cumulative duration of time spent in the center of the arena was not different between controls (151.9±12.61 s), mice undergoing aIC-to-mPFC inhibition (125.5±26.58) and mice undergoing mPFC-to-aIC inhibition (104.3±16.14) (one-way ANOVA: F (2, 23) = 1.689; p=0.2068). (c) Frequency for crossing the center was not different between controls (45.00±2.805), aIC-to-mPFC (39.50±4.175) and mPFC-to-aIC inhibition groups (39.44±2.968) (one way ANOVA: F(2, 24) = 0.9965; p=0.3839). (d) Mice injected with aIC-to-mPC/mPFC-to-aIC inhibitory DREADDs or aIC-to-mPFC control vectors were i.p injected with CNO. 1 hr later mice were exposed to a novel saccharin/water. (e) Latency toward the first saccharin exposure (controls: 8.778± 1.605 s, aIC-to-mPFC:5.088± 1.038 s, mPFCto-aIC:5.556±1.425 s; one-way ANOVA: F (2, 23) = 2.073, p = 0.1487), first water exposure (controls: 5.156± 1.877 s, aIC-to-mPFC: 4.875± 2.279 s, mPFCto-aIC: 2.444 ± 0.8992 s; one-way ANOVA: F (2, 23) = 0.7531, p = 0.0744), second saccharin exposure (controls: 1.778 ±1.038 s, aIC-to-mPFC: 1.375 ± 0.7545 s, mPFC-to-aIC: 1.889 ± 0.6334 s; one-way ANOVA: F (2, 23) = 0.1014, p = 0.9040) and second water exposure (controls: 1.000 ± 0.5000 s, aIC-to-mPFC: 2.000 ± 1.254 s, mPFC-to-aIC: 2.833 ± 1.007 s; one-way ANOVA: F (2, 23) = 0.9742, p = 0.4076) was similar among the three groups.
-
Figure 6—figure supplement 2—source data 1
Inhibition of aIC-to-mPFC and mPFC-to-aIC projecting neurons does not affect anxiety-related behavior.
- https://cdn.elifesciences.org/articles/66686/elife-66686-fig6-figsupp2-data1-v2.xls
Figure 7
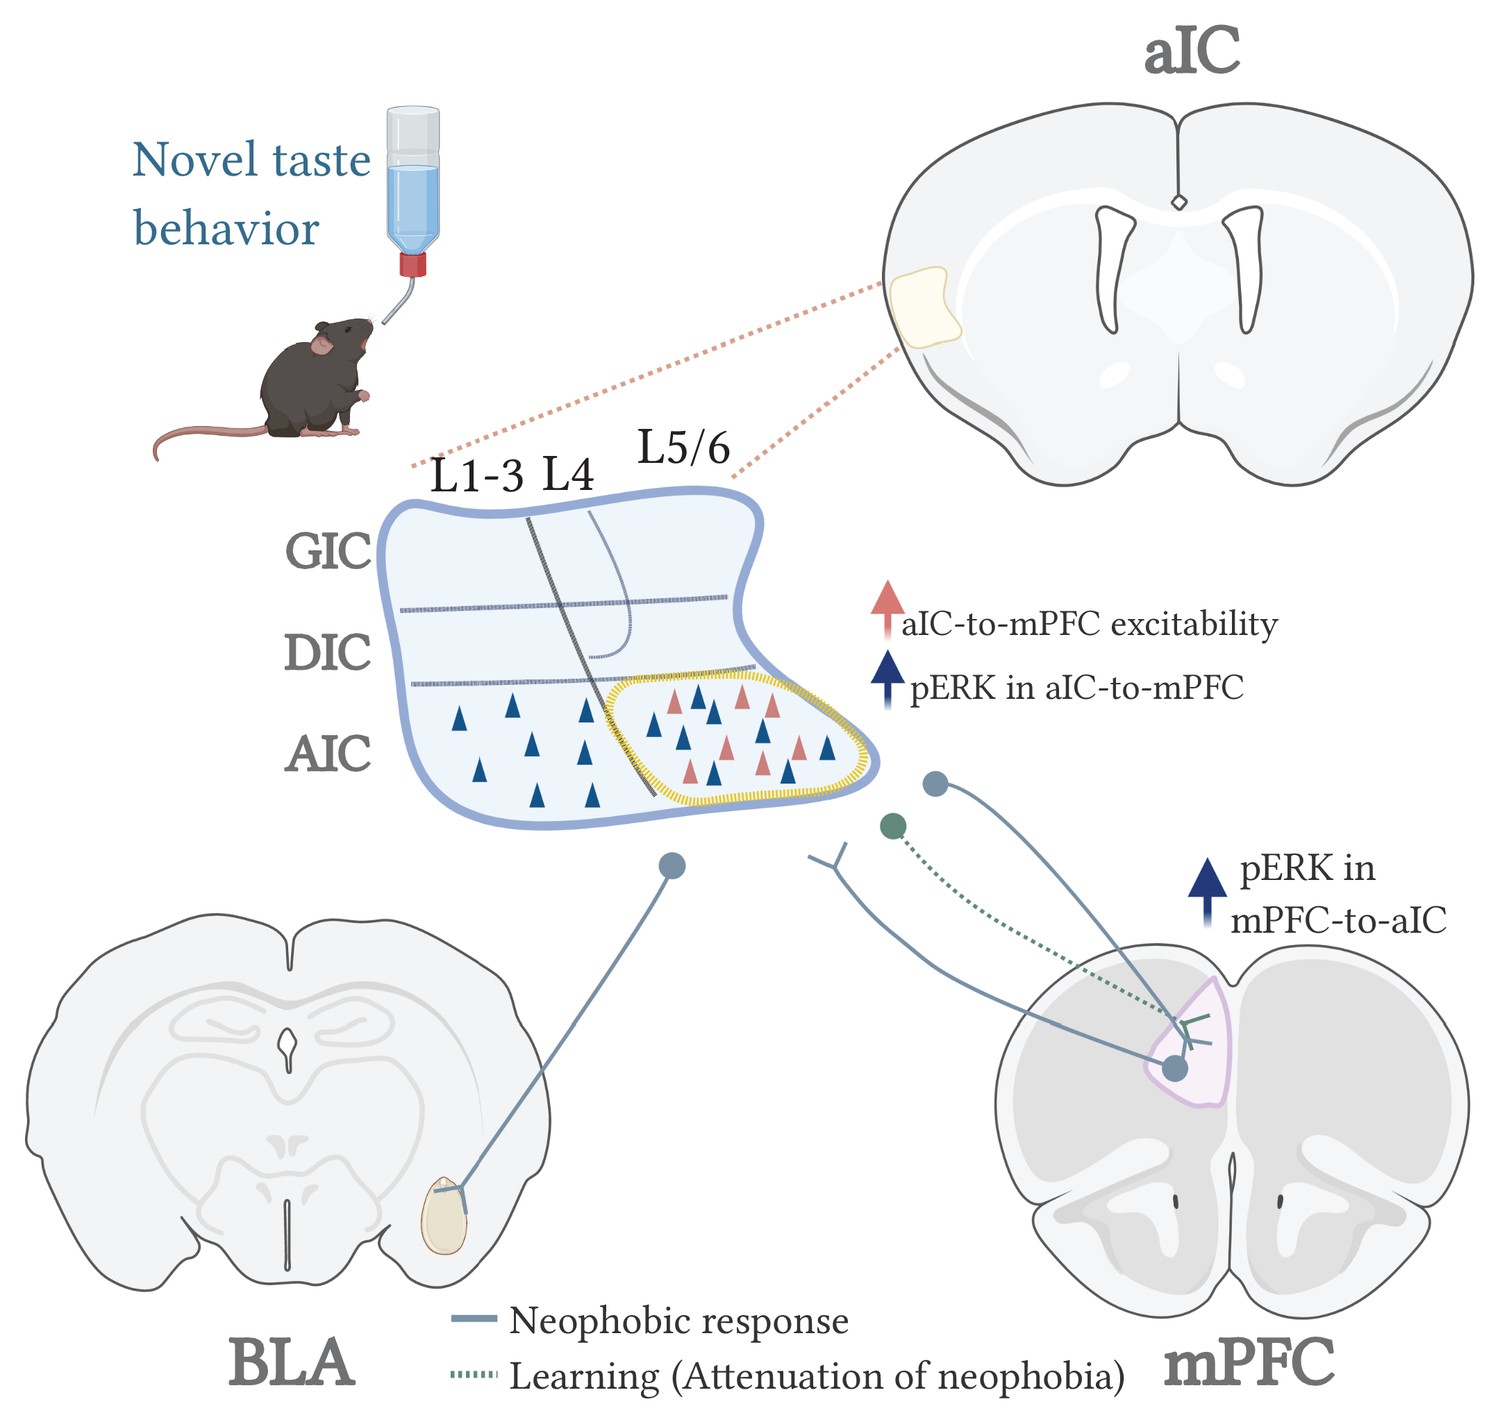
A model for the circuits involved in novel taste expression and learning.
Tables
Table 1
Summary of intrinsic properties of aIC-to-mPFC projecting neurons following novel or familiar taste experience.
| Groups | RMP (mV) | mAHP (mV) | Input resistance (MΩ) | Sag ratio (%) | Time constants (ms) | AP thresh (mV) | AP Amp (mV) | AP half-width (ms) | Rheobase (pA) |
|---|---|---|---|---|---|---|---|---|---|
| Layer 2/3 IC-mPFC (F.Sacc) | −72.26 ± 2.02 (10) | −4.223 ± 0.8426 (10) | 128.9 ± 15.02 (10) | 6.96 ±1.633 (10) | 21.89 ± 2.855 (10) | −30.2 ± 1.845 (10) | 52.61 ± 3.211 (10) | 0.696 ± 0.04483 (10) | 118.2 ± 31.24 (10) |
| Layer 2/3 IC-mPFC (Novel) | −71.65 ± 1.504 (10) | −3.509 ± 0.8405 (10) | 128.6 ± 9.645 (10) | 5.631 ±1.298 (10) | 19.63 ± 2.623 (10) | −33.92 ± 1.109 (10) | 55.06 ± 2.263 (10) | 0.703 ± 0.03798 (10) | 119.9 ± 16.23 (10) |
| Layer 5/6 IC-mPFC (F.Sacc) | −62.18 ± 1.368 (13) * | −4.14 ± 0.6927 (13) | 106.9 ± 11.32 (13) * | 12.29 ± 1.993 (13) | 14.27 ± 1.842 (13) | −33.08 ± 2.421 (13) | 56.4 ± 2.135 (13) | 0.6931 ± 0.05582 (13) | 102.7 ± 13.68 (13) * |
| Layer 5/6 IC-mPFC (Novel) | −67.21 ± 1.215 (14) | −5.163 ± 0.916 (14) | 150.1 ± 12.94 (14) | 8.349 ± 2.134 (14) | 18.4 ± 2.049 (14) | −35 ± 1.499 (14) | 50.53 ± 2.242 (14) | 0.6136 ± 0.03875 (14) | 68.86 ± 8.601 (14) |
| Layer 5/6 IC-mPFC (Cage controls) | −68.37 ± 1.177 (13) ++ | −3.359 ± 0.9374 (13) | 128.5 ± 10.54 (13) | 14.11 ± 2.752 (13) | 18.74 ± 2.406 (13) | −33.17 ± 1.884 (13) | 53.82 ± 2.298 (13) | 0.8308 ± 0.05237 (13) $ | 81.62 ± 10.71 (13) |
-
*=p<0.05, aIC-to-mPFC L5/6 novel vs familiar saccharin. ++ = p<0.01 aIC-to-mPFC L5/6 cage control vs familiar saccharin. $=p<0.05 aIC-to-mPFC L5/6 novel saccharin vs cage controls.
Additional files
Download links
A two-part list of links to download the article, or parts of the article, in various formats.
Downloads (link to download the article as PDF)
Open citations (links to open the citations from this article in various online reference manager services)
Cite this article (links to download the citations from this article in formats compatible with various reference manager tools)
Insula to mPFC reciprocal connectivity differentially underlies novel taste neophobic response and learning in mice
eLife 10:e66686.
https://doi.org/10.7554/eLife.66686


