Murine muscle stem cell response to perturbations of the neuromuscular junction are attenuated with aging
- Department of Biomedical Engineering, University of Michigan, United States
- Biointerfaces Institute, University of Michigan, United States
- Parker H. Petit Institute of Bioengineering and Bioscience, Georgia Institute of Technology, United States
- School of Biological Sciences, Georgia Institute of Technology, United States
- Wallace Coulter Departmentof Biomedical Engineering, Georgia Institute of Technology, United States
- Internal Medicine-Hematology/Oncology, University of Michigan, United States
- Michigan Center for Translational Pathology, University of Michigan, United States
- Department of Pharmacology and Physiology, University of Rochester Medical Center, United States
- Department of Biomedical Engineering, University of Rochester Medical Center, United States
- Wilmot Cancer Institute, Stem Cell and Regenerative Medicine Institute, and The Rochester Aging Research Center, University of Rochester Medical Center, United States
- Departmentof Molecular Biology, Cell Biology and Biochemistry, Brown University, United States
- Center for Translational Neuroscience, Robert J. and Nancy D. Carney Institute for Brain Science and Brown Institute for Translational Science, Brown University, United States
- Department of Molecular & Integrative Physiology, University of Michigan, United States
- Department of Surgery, University of Texas Southwestern, United States
- Childrens Research Institute and Center for Mineral Metabolism, United States
- Program in Cellular and Molecular Biology, University of Michigan, United States
Figures
Figure 1
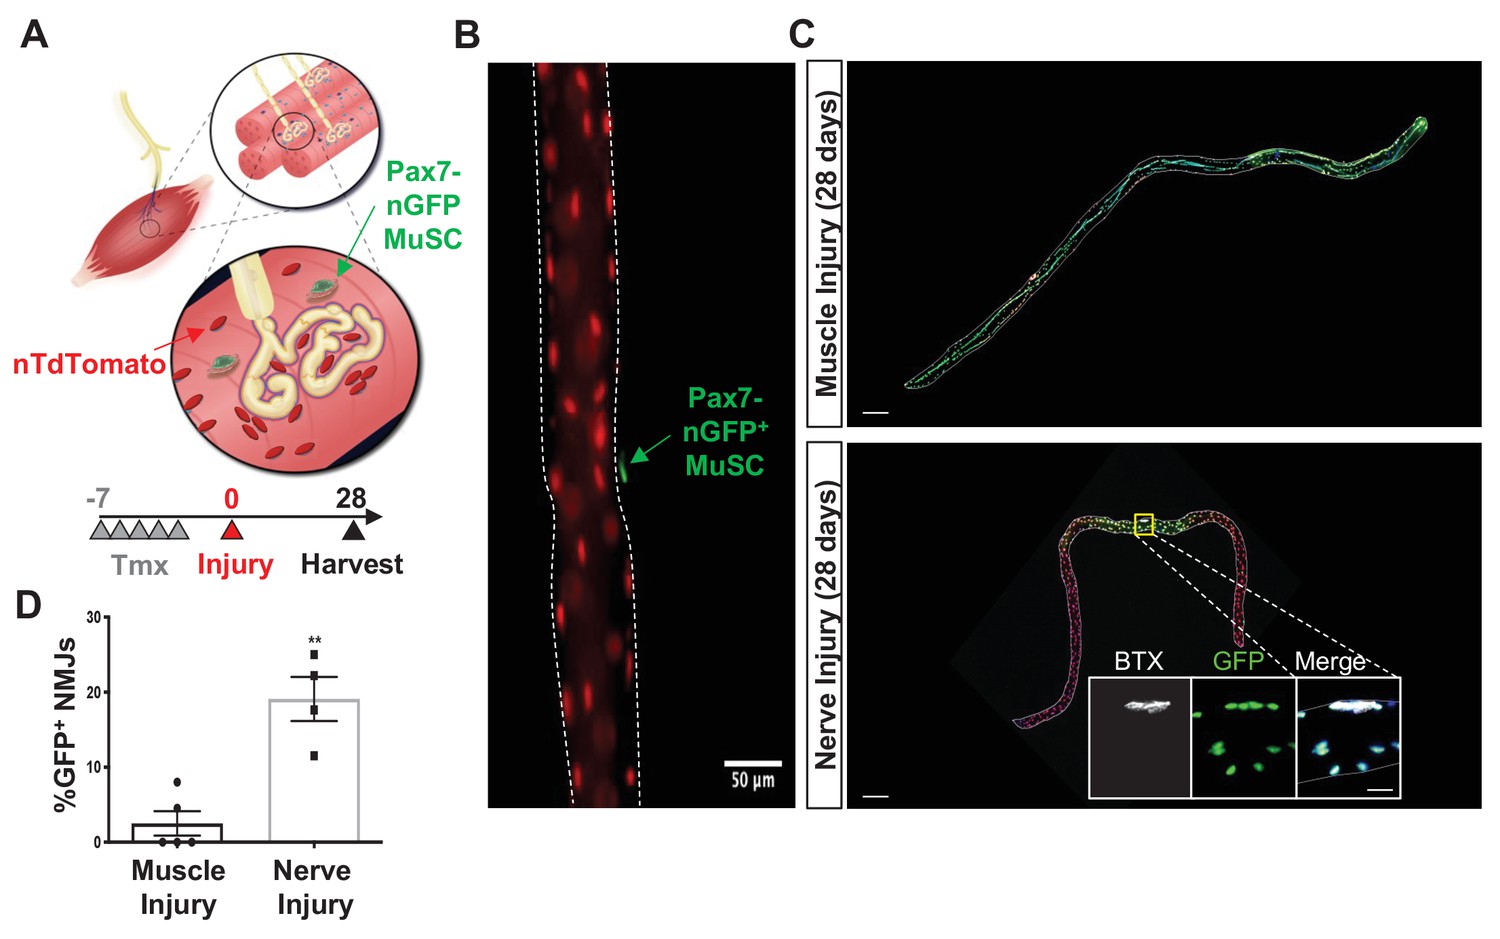
Denervation induces muscle stem cell (MuSC) actions proximal to the neuromuscular junction (NMJ).
(A) Schematic of NMJ from Pax7CreER/+-Rosa26nTnG mice, which display red fluorescent protein (RFP) in their nuclei and following administration of tamoxifen, Pax7+ MuSCs (labeled with green arrow) and their progeny are labeled with a nuclear green fluorescent protein (nGFP). (B) Representative immunofluorescence image of single myofiber isolated from extensor digitorum longus (EDL) muscle showing GFP expression exclusively in MuSCs and red nuclei. Scale=50 µm. (C) After muscle injury through barium chloride (BaCl2) injection (top), myofiber degeneration resulted in contribution of MuSC-derived progenitors and centrally located myonuclei along the entire length of the regenerated myofiber. After sciatic nerve transection (SNT), MuSC-derived myonuclei were confined at or near NMJ myofiber regions. Magnified inset images show NMJs (acetylcholine receptor [AChR] labeled with α-bungarotoxin [BTX]) with nGFP+ nuclei. Scale bar for myofibers = 200 μm for inset = 25 μm. n = 5 muscles for both injury types and 20–30 myofibers counted from each isolated muscle. (D) Quantification of fraction of nGFP+ nuclei underneath and near synapses compared to all positions on myofibers, where **p < 0.01 using two-sided t-test.
Figure 2 with 1 supplement
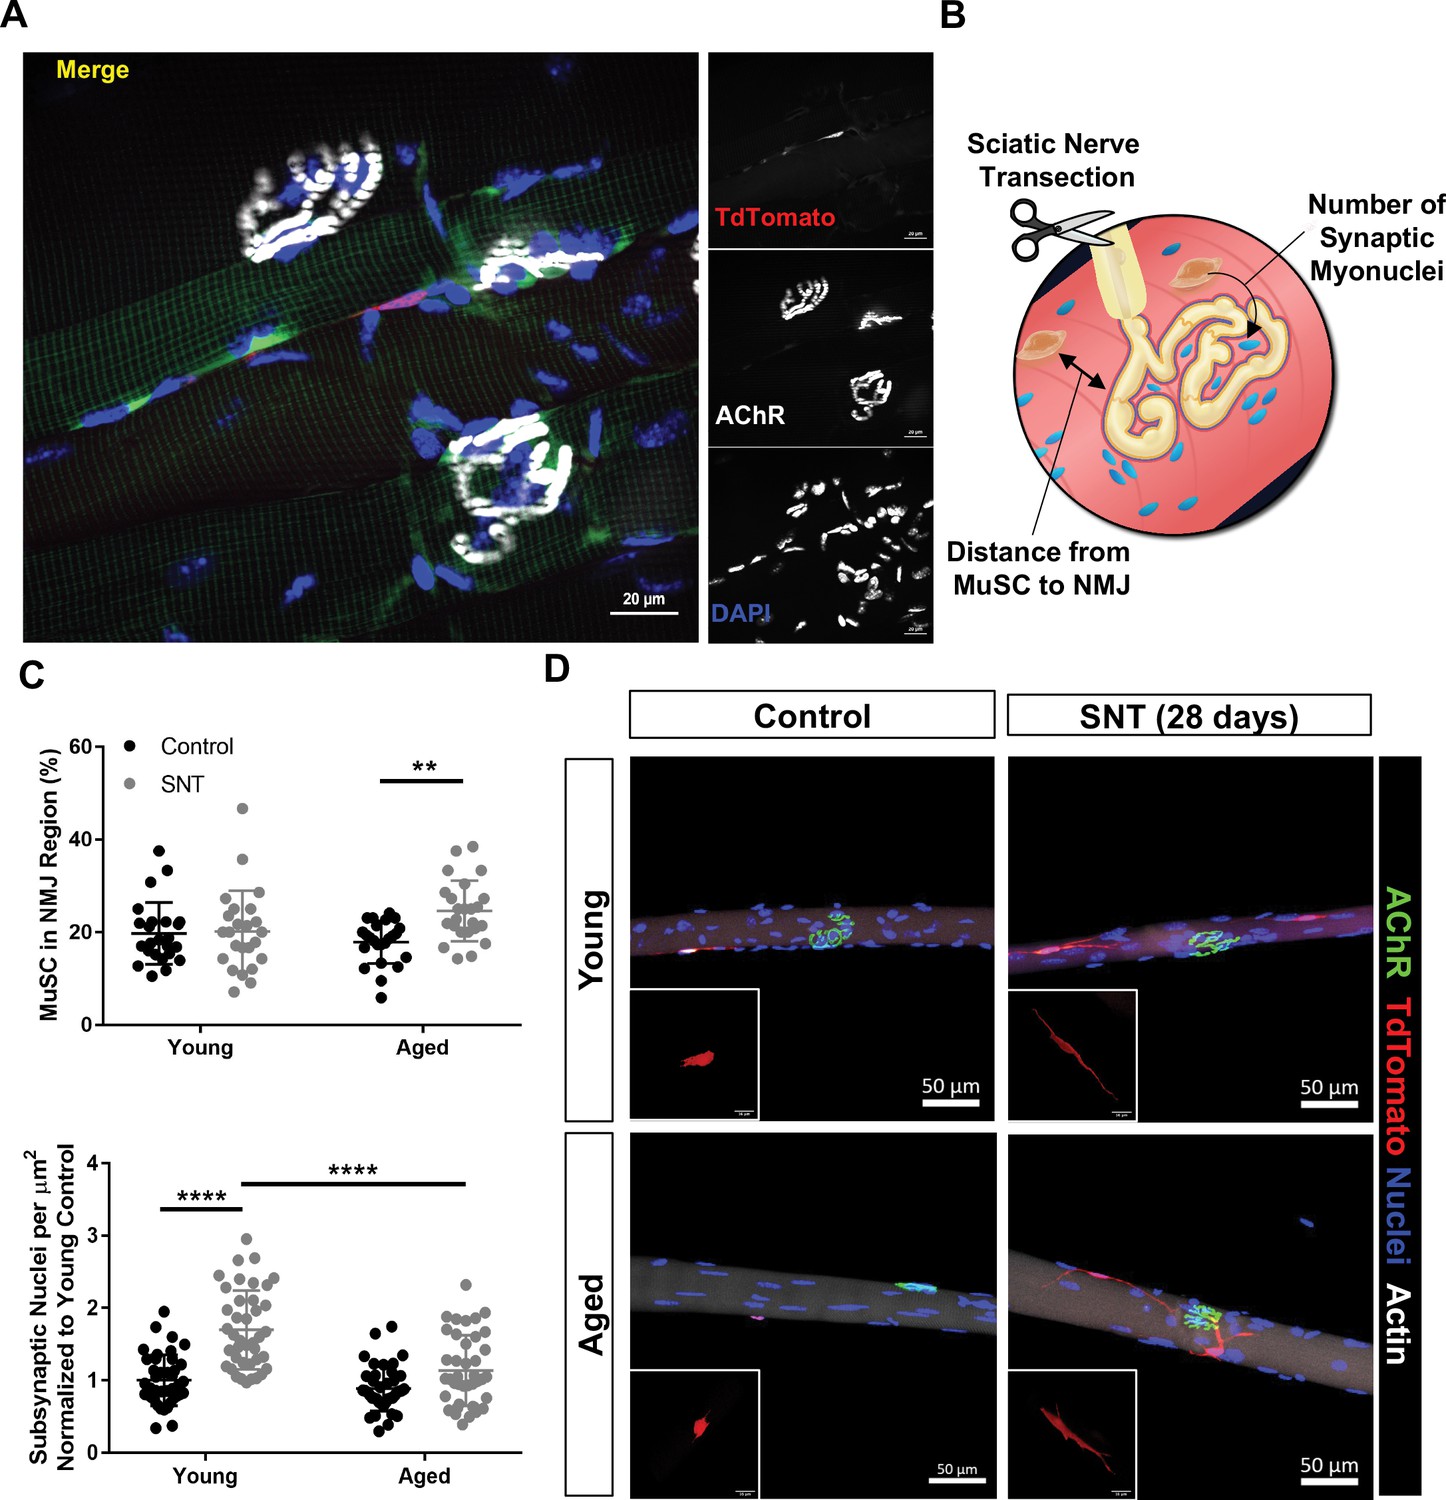
Aging attenuates muscle stem cell (MuSC) engraftment into synaptic myonuclei after nervous perturbation.
(A) Representative immunofluorescence image of MuSC in proximity to neuromuscular junction (NMJ) from tibialis anterior (TA) muscle of young (3 months) Pax7CreER/+-Rosa26TdTomato/+ mouse. Pax7-Pink, acetylcholine receptor (AChR) labeled with α-bungarotoxin (BTX) stain (white) and nuclei/DAPI (blue). (B) Schematic of experiment to quantify distance from MuSCs to NMJ and changes in synaptic myonuclei before and after sciatic nerve transection (SNT). (C) Top: Quantification of the percentage of MuSCs in the NMJ region of the myofiber out of the total number of myofiber MuSCs in uninjured contralateral control and SNT muscle fibers from both aged and young mice (**p < 0.01, two-way ANOVA with Tukey post hoc test, n=4 mice/group, and >10 myofibers from each sample). Bottom: Quantification of the number of subsynaptic nuclei per synaptic area in uninjured contralateral control and SNT muscle fibers from both aged and young mice, normalized to the subsynaptic nuclei of young uninjured control (****p < 0.0001, two-way ANOVA with Tukey post hoc test). (D) Representative images of single TA uninjured (left) myofibers isolated from (top) young (2–3 months) and (bottom) aged (20–22 months) Pax7CreER/+-Rosa26TdTomato/+ mice. Administration of SNT and extraction of single TA myofibers 28 days post injury revealed that MuSCs are recruited to the synapse and display long projections with differential engraftment into synaptic myonuclei. Pax7/TdTomato – red, AChR/BTX – green, nuclei/DAPI – blue.
Figure 2—figure supplement 1
Muscle stem cell loss and changes in neuro-muscular junctions in aged muscle.
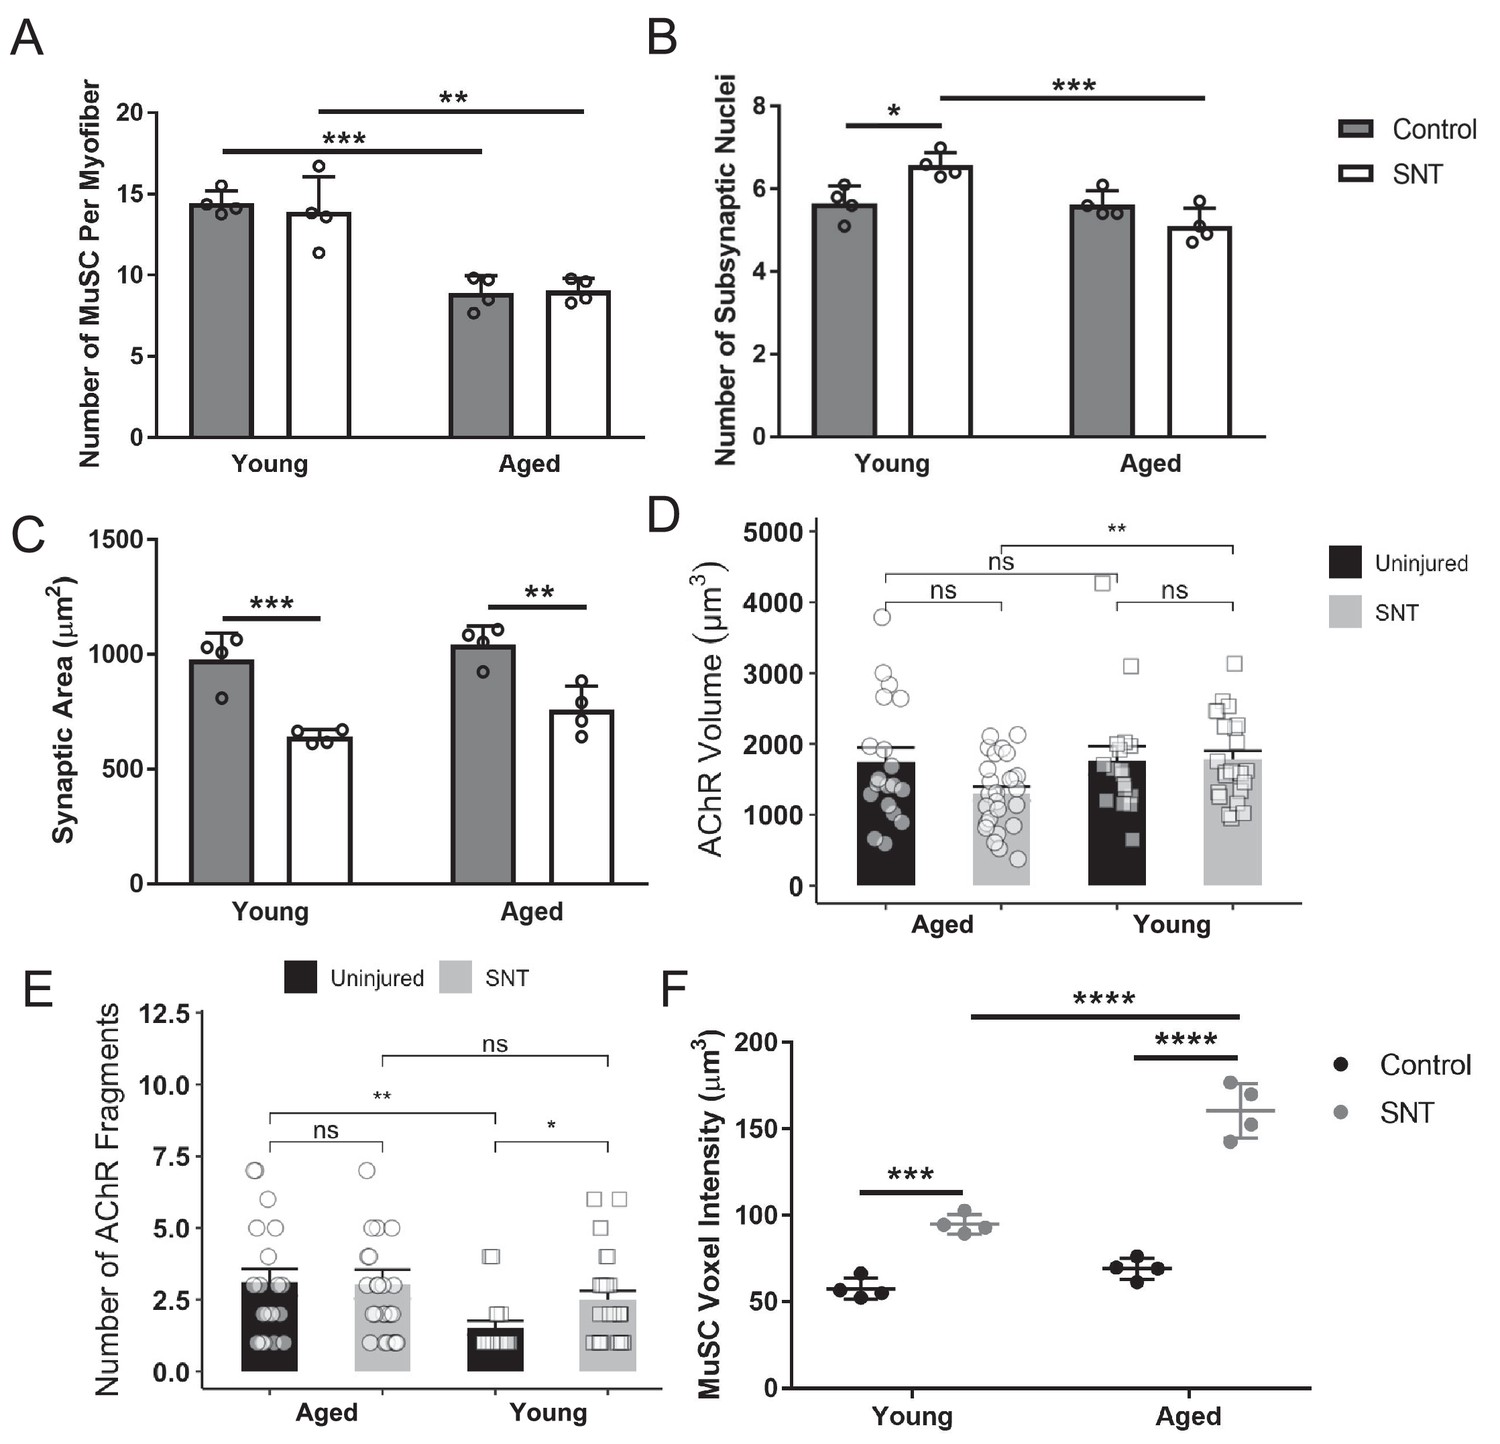
(A) Total number of muscle stem cells (MuSCs) along the entire length of myofibers isolated uninjured control and sciatic nerve transection (SNT) tibialis anterior (TA) muscles from young (2–3 months) and aged (20–22 months) Pax7-tdTomato mice. Myofibers were isolated with the myotendinous junctions attached at each end to ensure the entire length of the fiber was isolated. Data represents the mean of four biological samples for each group, and at least 10 myofibers were quantified from each sample. **p < 0.01, ***p < 0.001. (B) Total number of myonuclei within each synapse from isolated myofibers of uninjured control and SNT (TA) muscles from young and aged mice. Data represents the mean of four biological samples for each group, with 10 synapses quantified per group. *p < 0.05, ***p < 0.001. (C) Area (µm Blau et al., 2015) of synapses from z-stack confocal images of uninjured control and SNT TA muscles from young and aged mice. Data represents the mean of four biological samples for each group, with 10 synapses measured per group. Data were analyzed with a two-way ANOVA with Tukey post hoc test. **p < 0.01, ***p < 0.001. (D) Acetylcholine receptor (AChR) voxel volume (µm Schultz and Lipton, 1982) per neuromuscular junction (NMJ) was quantified in fiber bundles from uninjured and SNT-injured young and aged mice (n=17–26 NMJs per group). Comparisons were made with a two-sided, unpaired t-test. **p < 0.01, n.s. p > 0.05. (E) The number of AChR fragments per NMJ was quantified in fiber bundles from uninjured and SNT-injured young and aged mice (n=17–26 NMJs per group). Comparisons were made with a Mann-Whitney U-test. *p < 0.05, **p < 0.01, n.s. p > 0.05. (F) MuSC voxel volumes from isolated myofibers of uninjured and control SNT TA muscles from young and aged mice. n = 4 mice, with at least 16 MuSCs near the NMJ quantified from each biological replicate. Data were analyzed with a two-way ANOVA with Tukey post hoc test. ***p < 0.001, ****p < 0.0001.
Figure 3 with 2 supplements
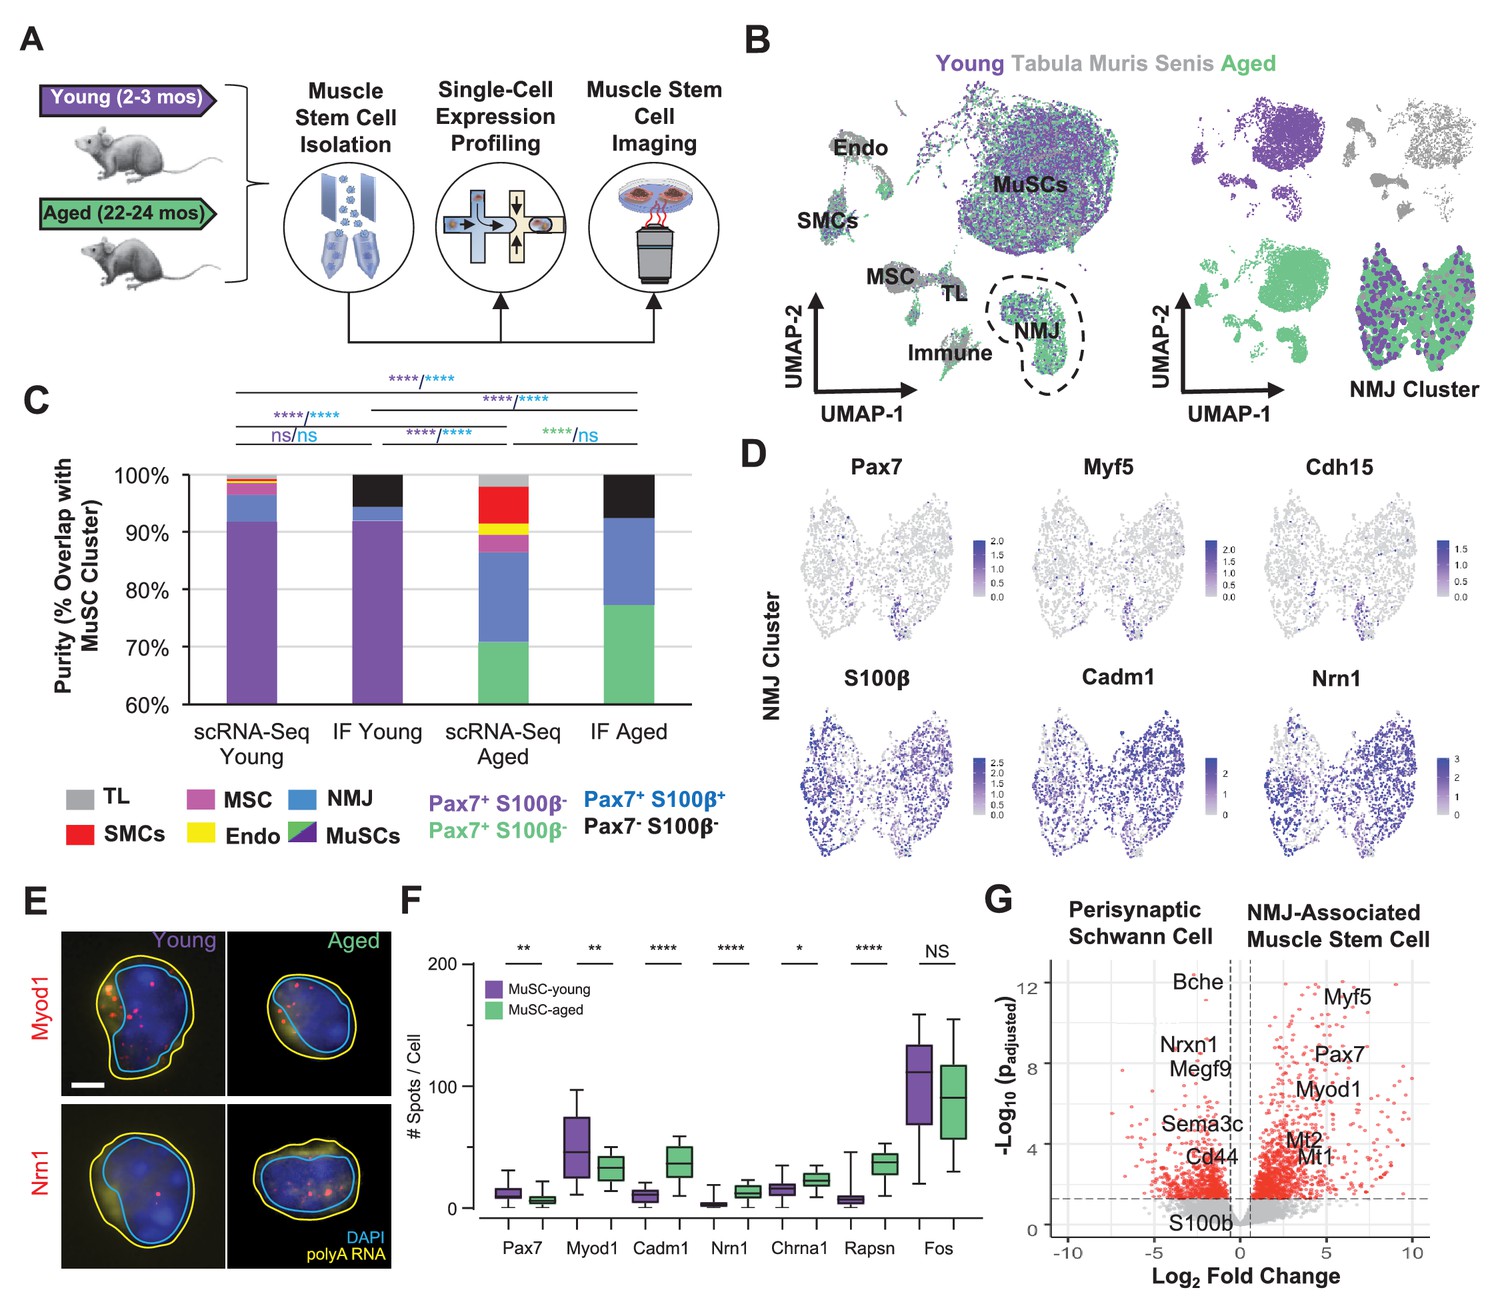
Single cell analysis of skeletal muscle stem cells (MuSCs) in age shows a subset express transcripts associated with the neuromuscular junction.
(A) Experiment design schematic. MuSCs were fluorescent activated cell sorting (FACS) enriched from young and aged wild-type (WT) mice, then analyzed by IF, single cell mRNA sequencing (scRNA-Seq), or single-molecule fluorescence in situ hybridization (smFISH). (B) Left: Dimensional reduction and unsupervised clustering of young (2–3 months) and aged (22–24 months) WT FACS-isolated MuSCs and limb muscle cells from 24-month Tabula Muris Senis datasets colored by sample type showing overlap between FACS-enriched MuSCs and MuSC clusters among all mono-nucleated cells. Four and five independent replicates of young and age, respectively, were sequenced where each sample is composed of a pool from two mice. Cell types were identified according to markergene expression and labeled on the plot. NMJ – neuromuscular junction; TL – tenocyte; MSC – mesenchymal stromal cell; Immune – CD45+ immune cell; Endo – endothelial cell; SMC – smooth muscle cell. Right: Plots split by sample type showing contribution to uniform manifold approximation and projection (UMAP) and re-clustered UMAP of the NMJ-associated cluster. (C) Stacked bar plot representing the fraction of the sorted cell populations that clustered with each mono-nucleated cell type as well as the number of Pax7+S100b- (MuSC) and Pax7+S100b+ (NMJ) cells based on IF stains. A higher fraction of FACS purified cells from aged mice are associated with the NMJ cluster as compared to young. Quantification by FACS imaging of S100β and Pax7 proteins shows that less than 5% of young MuSCs co-express both markers compared to 15% of aged MuSCs. **** denotes p < 0.0001 and ns denotes p > 0.05 by two-sided z-test for proportions with pairwise comparisons using Holm p-value adjustment. Threshold for significance was considered p < 0.05. Sample sizes (n) were 3568, 483, 6532, and 880 cells for scRNA-Seq young, FACS young, scRNA-Seq aged, and FACS aged, respectively. Representative IF images are shown in Figure 3—figure supplement 2. (D) Re-clustered UMAP diagrams of the NMJ-associated cluster and overlay of specific genes. (E) Representative pseudocolored images of MuSCs from young or aged mice, stained with DAPI (blue), probes against Myod1 mRNA (red, top panels), probes against Nrn1 mRNA (red, bottom panels), and probes against polyA RNA (yellow). Nuclear (cyan) and cell (yellow) boundaries are also represented. Scale bar, 2 µm. (F) Box plots of spots/cell, wherein the central line, box edges and bars represent the median, 25th and 75th quartiles, and data range respectively. p-Values are based on two-tailed t-test with Welch’s correction, ****p < 0.0001, **p<0.01, *p<0.1, NS – not significant, n=210 cells for young and n=210 cells for aged. (G) Volcano plot of differential gene expression between Pax7+ cells from the NMJ cluster and bulk RNA-Seq datasets from Schwann cells. Gene counts of the single cell datasets were merged across cells to generate ‘sudo-bulk’ expression matrices, where half of the cells from each sample were summed separately and considered a biological and technical replicate in order to achieve sufficient sample size. DESeq2 was used to calculate differential expression. More than 2500 genes were differentially expressed. n = 4 for Pax7+NMJ sequencing replicates and n = 5 for Schwann cell sequencing replicates.
Figure 3—figure supplement 1
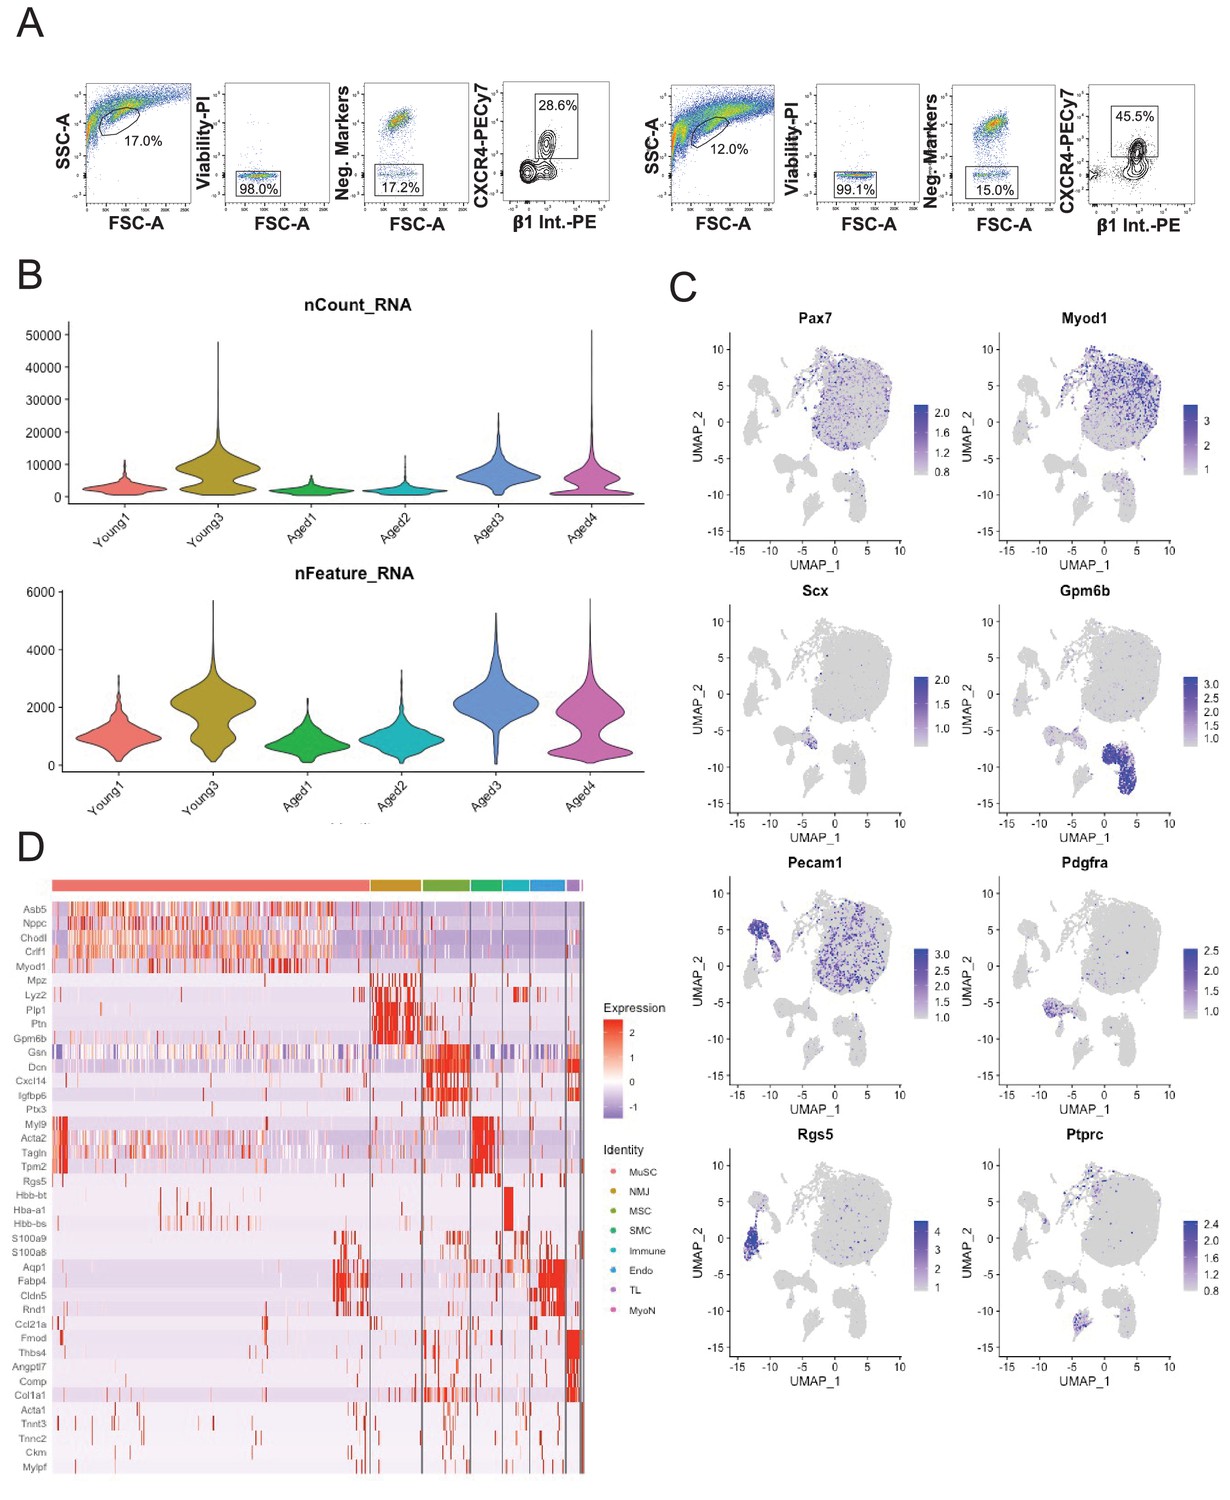
Single-cell sequencing of sorted muscle stem cells in young and aged muscle.
(A) Representative fluorescent activated cell sorting (FACS) scatter plots showing gating of muscle stem cells (MuSCs) based on negative (Sca-1, Mac-1, CD31, CD45, Ter-119) and positive (CXCR4, B1-integrin) markers. (B) (Top) Violin plot of the number of unique molecular identifiers (UMIs) recovered in each dataset. (Bottom) Violin plot of the number of genes recovered in each dataset. (C) Markergene overlays of UMAP reduction of young MuSCs, aged MuSCs, and Tabula Muris Senis limb muscle cells. (D) Heatmap of top 5 differentially expressed genes across cell types.
Figure 3—figure supplement 2

Synaptic factors in aged muscle stem cells.
(A) Plots of myogenic regulatory factor and rapsyn expression in Pax7+S100b+ cells and Pax7+S100b- cells in cells enriched from young vs. aged animals. Cells were filtered into groups based on raw expression greater than 0 (Myog and Pax7 were not co-expressed among single cell mRNA sequencing [scRNA-Seq] libraries). Not enough Pax7+S100b+ cells were captured by scRNA-Seq to include in the violin plots. ****p < 0.0001 by Wilcoxon rank sum test with Bonferroni correction for multiple testing. (B) Representative IF images of Pax7 and S100b expression in muscle stem cells (MuSCs) sorted from young and aged muscles. Scale bar indicates 200 μm. Arrows point to Pax7+S100b+ cells. Quantifications of Pax7 and S100b expression are included in Figure 3C. (C) Split violin plots comparing gene expression across Pax7+ and Pax7- cells in the neuromuscular junction (NMJ) cluster based on whether raw counts were greater than 0 (Pax7+) or equal to 0 (Pax7-). ****p<0.0001 by Wilcoxon rank sum test with Bonferroni correction for multiple comparison. Ns denotes not significant. (D) Correlation between RNA levels as measured by single-molecule fluorescence in situ hybridization (smFISH) and RNAseq. R, correlation coefficient.
Figure 4 with 1 supplement
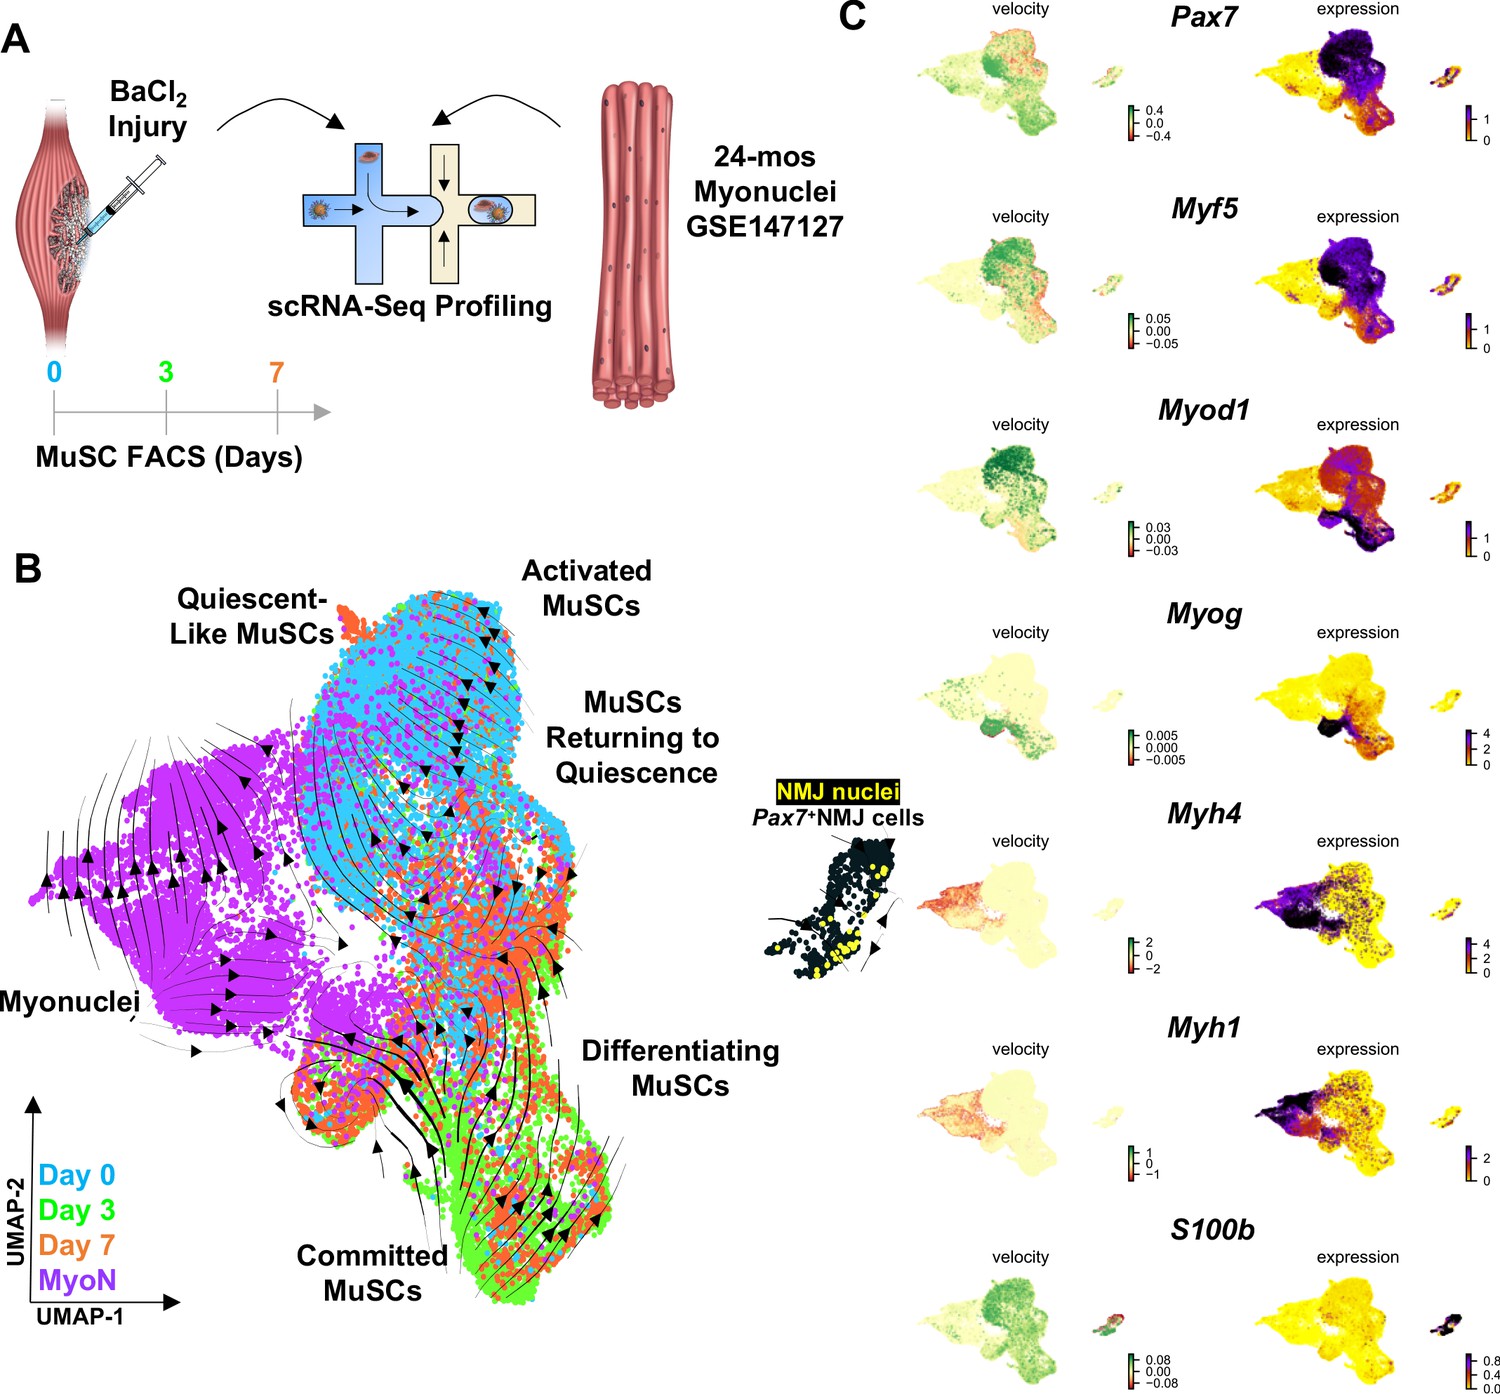
Muscle injury induces a continuum of muscle stem cell (MuSC) states distinct from the synaptic state induced by neurodegeneration.
(A) Schematic of experiment design, whereby tibialis anterior (TA) and extensor digitorum longus (EDL) muscles from aged (22–24 months) wild-type mice were injured via intramuscular injections of barium chloride. Single cell mRNA sequencing (ScRNA-Seq) was used to profile fluorescent activated cell sorting (FACS)-enriched MuSCs before injury (day 0), and 3 and 7 days post injury (dpi). (B) Uniform manifold approximation and projection (UMAP) dimensional reduction of FACS-isolated MuSCs (FSMs) from injured aged muscles and uninjured, age-matched myonuclei from ref 28 colored by sample type. RNA velocity streams are overlaid onto UMAP showing MuSCs progressing from a Pax7hiMyf5hi quiescent-like state to an activated state at 0 dpi, becoming committed progenitors (Myod1hi) by 3dpi, and differentiating or returning to quiescence by 7dpi. (C) mRNA expression (right) and velocity (left) overlays of canonical MuSC (Pax7, Myf5, Myod1, and Myog), myonuclei (Myh1, Myh4), and neuromuscular junction (NMJ) (S100b) genes.
Figure 4—figure supplement 1

Single-cell RNA sequencing of aged muscle stem cells during muscle regeneration.
(A) Violin plot of the number of unique molecular identifiers (top) and number of genes (bottom) in each dataset. (B) Stacked bar graph showing Pax7- NMJ, Pax7+ NMJ, and muscle stem cells (MuSCs) as a percent of fluorescent activated cell sorting (FACS)-enriched MuSCs. **** denotes p < 0.0001 and ** denotes p < 0.01 by two-sided z-test for proportions with pairwise comparisons using Holm p-value adjustment. Threshold for significance was considered p < 0.05. Sample sizes (n) were 5951, 6404, and 6264 for 0, 3, and 7 dpi (days post injury), respectively. Orange asterisk indicates comparison of MuSCs, purple indicates comparison of Pax7+ NMJ cells, and blue indicates comparison of Pax7- NMJ cells. (C) (Left) Uniform manifold approximation and projection (UMAP) colored by time point showing velocity-inferred cell-cell connections (gray lines), which suggests a decision to acquire a synaptic fate. (Right) Expanded view of the neuromuscular junction (NMJ) cluster showing Pax7+ NMJ cells (black) and Pax7+ NMJ myonuclei (yellow), which originate from the single cell mRNA sequencing (snRNA-Seq) datasets. Blue, orange, and green points represent Pax7-NMJ cells recovered in the time course datasets.
Figure 5 with 2 supplements
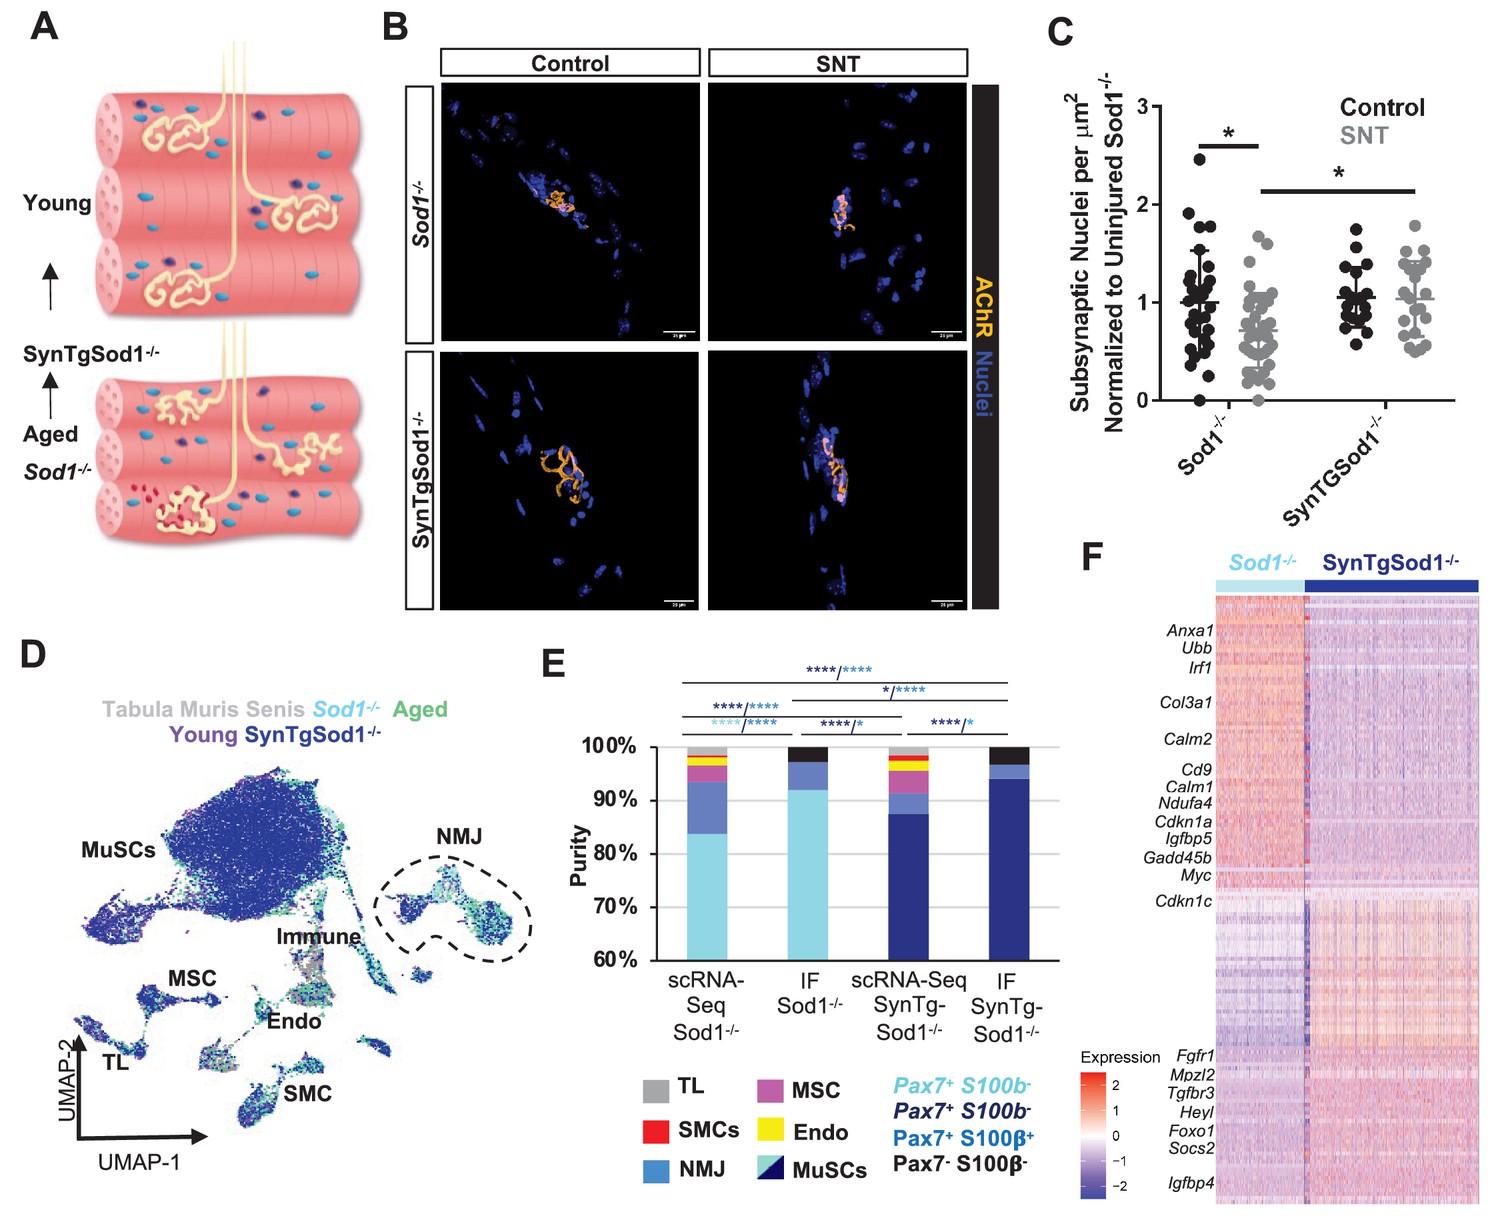
Neurodegeneration activates muscle stem cells (MuSCs) in a similar manner to aging and rescue of motor neurons partially reverses this activation state.
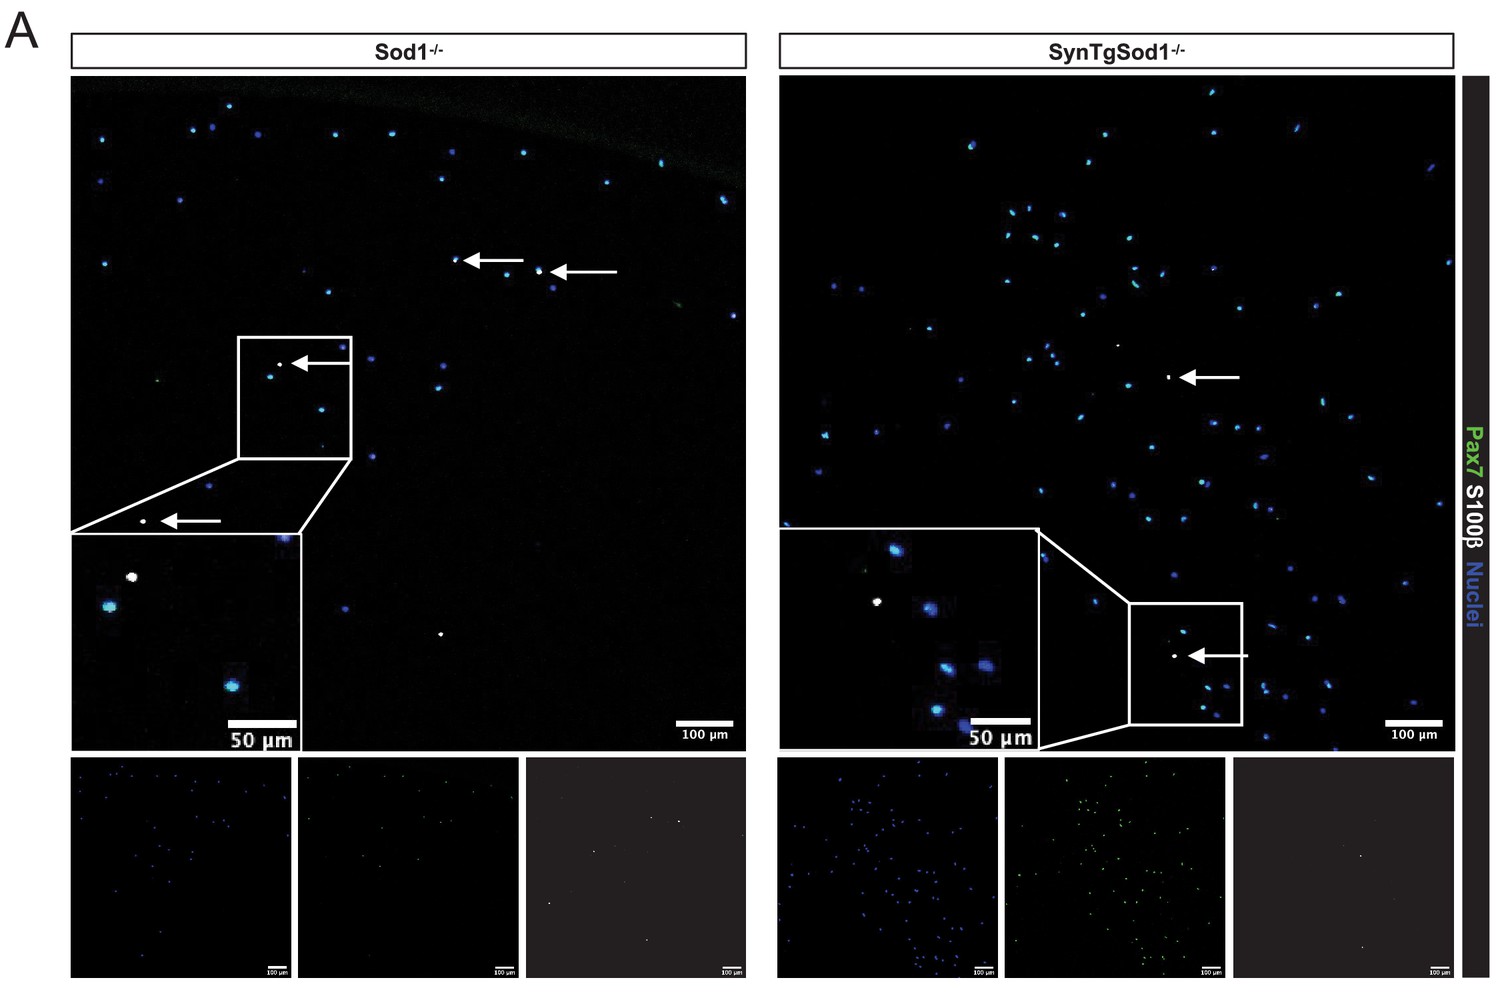
(A) Schematic of neuromuscular junction (NMJ) in young (top) and aged or Sod1-/- (bottom) muscle, whereby NMJ becomes fragmented or partially denervated. (B) Representative images of Sod-/- and SynTgSod1-/- myofibers from uninjured and sciatic nerve transection (SNT) tibialis anterior muscles stained with DAPI (blue) and α-bungarotoxin (orange). (C) Quantification of the number of subsynaptic nuclei per synaptic area in uninjured control and SNT muscle fibers from both Sod1-/- and SynTgSod1-/- mice, normalized to the subsynaptic nuclei per area of Sod1-/- uninjured control (*p < 0.05, two-way ANOVA with Tukey post hoc test). (D) Uniform manifold approximation and projection (UMAP) dimensional reduction of fluorescent activated cell sorting (FACS)-isolated MuSCs (FSMs) from young and aged wild-type (WT) mice, 10-month Sod1-/- mice, 10-month Sod1-/- rescue (SynTgSod1-/-) mice, and public Tabula Muris Senis limb muscle datasets colored by sample type. One and two independent replicates of Sod1-/- and Sod1-/- rescue (SynTgSod1-/-) mice, respectively, were sequenced where each sample is composed of a pool from two mice. Cell types were identified according to markergene expression and labeled on the plot. TL – tenocyte; MSC – mesenchymal stromal cell; Immune – CD45+ immune cell; Endo – endothelial cell; SMC – smooth muscle cell. (E) Stacked bar plot representing the fraction of the sorted cell populations that clustered with each mono-nucleated cell type as well as the number of sorted cells that were Pax7+S100b- (MuSC) and Pax7+S100b+ (NMJ) cells based on IF staining. More FACS purified MuSCs from Sod1-/- mice cluster with NMJ-associated cells when compared to SynTgSod1-/- mice. **** denotes p < 0.0001 and * denotes p < 0.05 by two-sided z-test for proportions with pairwise comparisons using Holm p-value adjustment. Threshold for significance was considered p < 0.05. Sample sizes (n) were 6042, 1622, 10445, and 1614 cells for single cell mRNA sequencing (scRNA-Seq) Sod1-/-, FACS Sod1-/-, scRNA-Seq SynTgSod1-/-, and FACS SynTgSod1-/-, respectively. Representative IF images are shown in Figure 5—figure supplement 2. (F) Heatmap of the top 75 differentially expressed genes between MuSCs isolated from Sod1-/- and SynTgSod1-/- mice. All genes shown have a log fold change greater than 0.25 and a p_adjusted value less than 10−20.
Figure 5—figure supplement 1
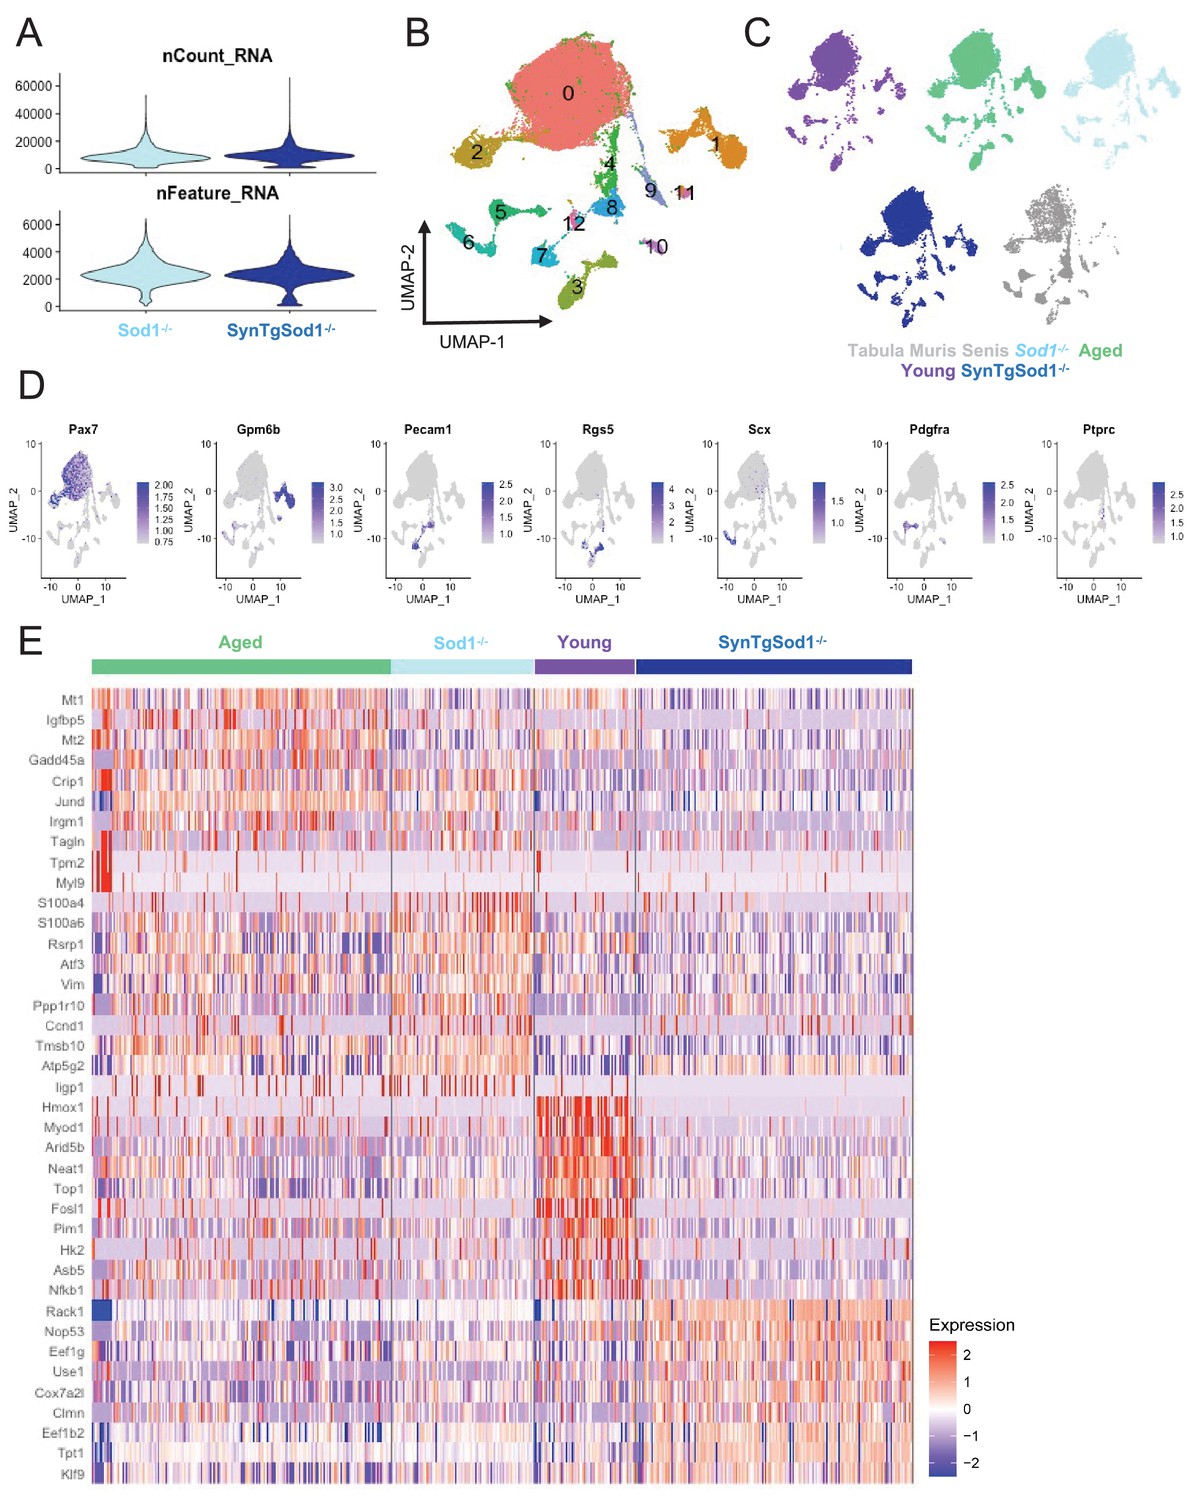
Single-cell RNA sequencing of Sod1-/-, and SynTgSod1-/ muscle stem cells.
(A) Violin plots of the number of unique molecular identifiers (UMIs) (top) and number of genes (bottom) recovered in each dataset. (B) Uniform manifold approximation and projection (UMAP) overlay colored by Louvain cluster at a resolution of 0.1. (C) Plots split by sample type showing contribution to UMAP. (D) UMAP overlays of markergene expression for the various cell types recovered. (E) Heatmap of top 10 differentially expressed genes across aged, young, Sod1-/-, and SynTgSod1-/-muscle stem cells (MuSCs). Differential gene expression testing was calculated only on cells from the MuSC clusters (labeled 0 and 2 in Supp. Figure 5B).
Figure 5—figure supplement 2
Validation of synaptic proteins in sorted muscle stem cells from Sod1-/- and SynTgSod1-/- muscles.
(A) Representative IF images of Pax7 and S100b expression in muscle stem cells (MuSCs) sorted from Sod1-/- and SynTgSod1-/- muscles. Scale bar indicates 100 μm for full size images and 50 μm for insets. Arrows point to Pax7+S100b+ cells. Image quantifications are shown in Figure 5e.
Figure 6 with 1 supplement

Mislocalization of S100β signaling from denervation promotes muscle stem cell maladaptation.
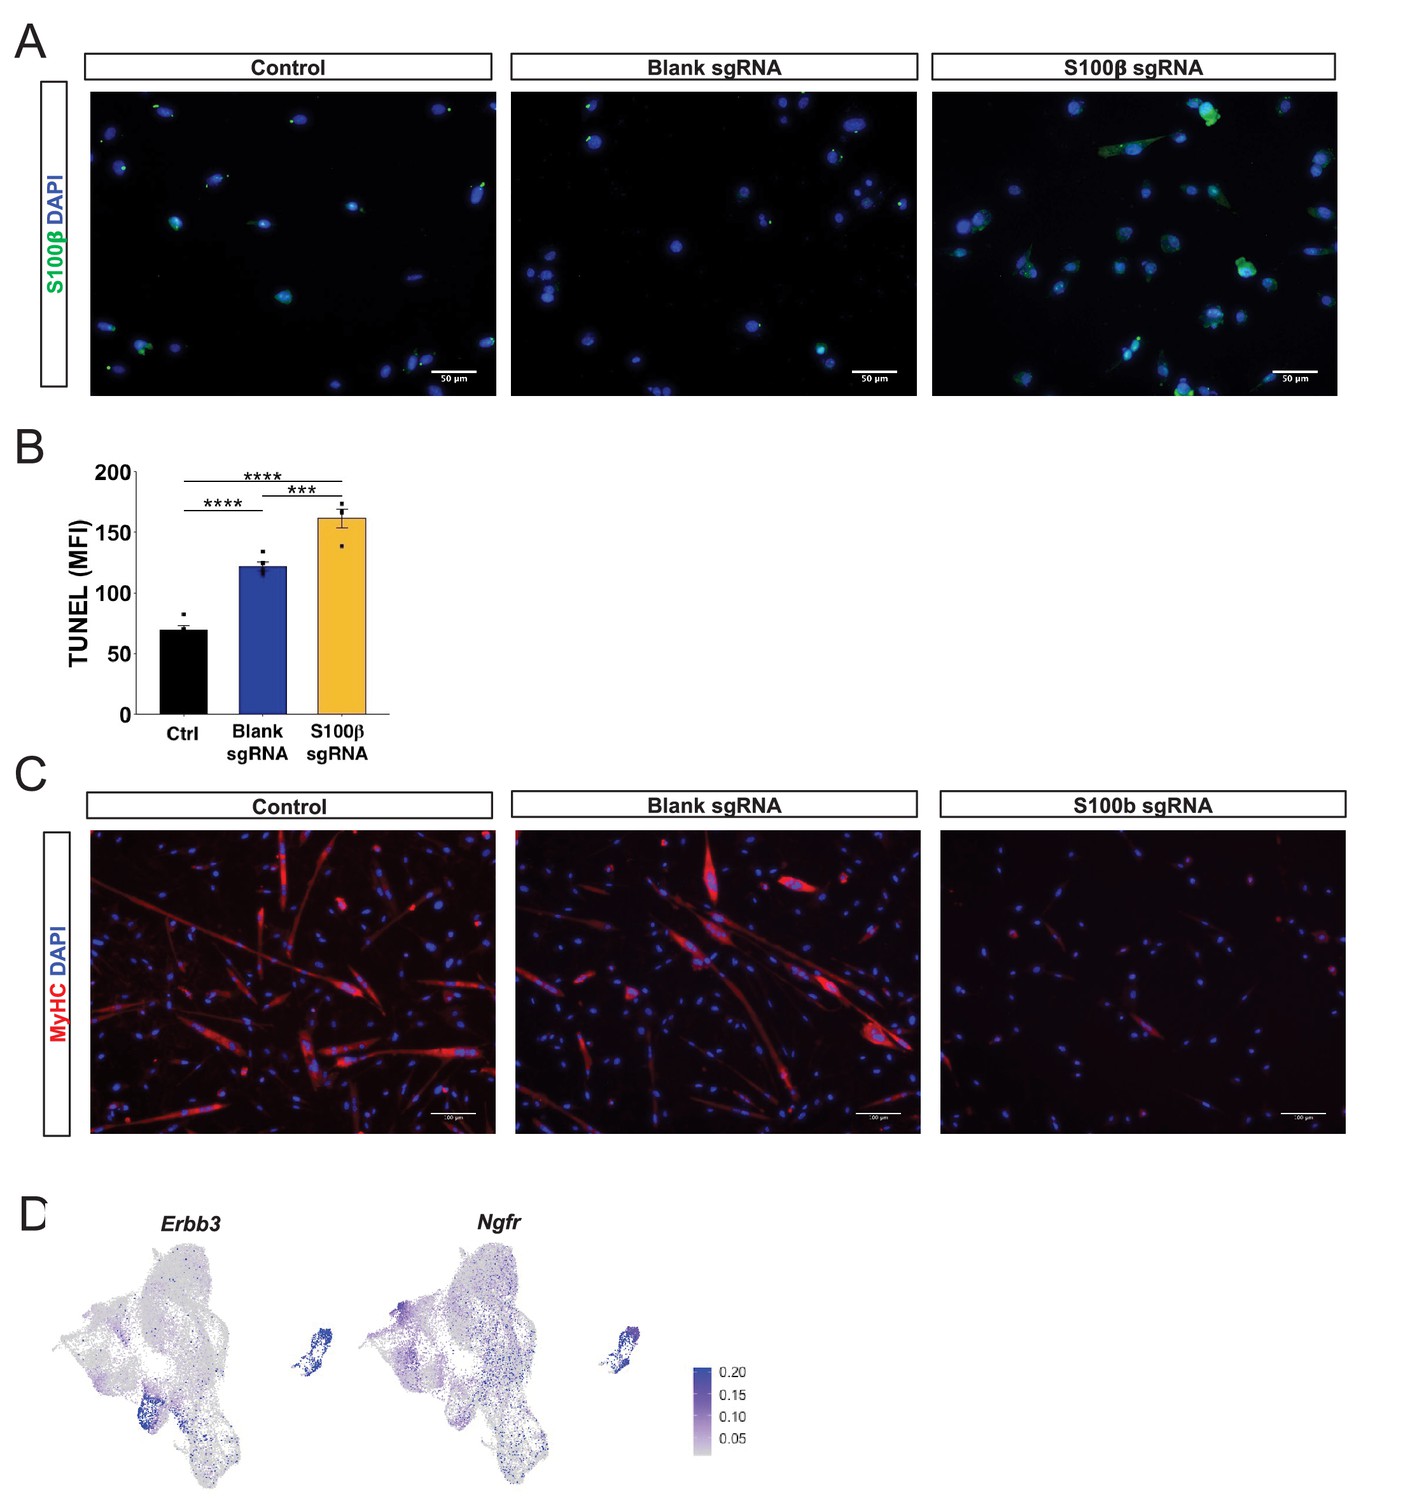
(A) Schematic of S100β-GFP mice administered sciatic nerve transection (SNT) on one limb and the other limb acts as a control (Ctrl). (B) Representative immunofluorescence z-stack images of isolated muscle fibers from young uninjured and S100β-GFP transgenic mice administered SNT. Myofibers/myobundles are stained with Hoechst33342 (blue), Pax7 (red), α-bungarotoxin (white), and S100β-GFP (green). (C) Euclidean distance of S100B+ and S100B+/Pax7+ cells from the neuromuscular junction (NMJ) in tibialis anterior (TA) muscles from uninjured controls and SNT muscles. n=70 S100B+ cells were quantified on single myofibers from four different mice. *p<0.05, **p<0.01 between groups for S100B+ cells using two-tailed t-test with Holm multiple testing corrections. No statistical significance between groups for S100B+/Pax7+ cells. (D) Schematic of transcriptional activation system in primary myoblasts using CRISPR-dCas9-Suntag and short guide RNA (sgRNA) targeted to S100β. (E) Quantification of mean fluorescent intensity (MFI) of S100β immunofluorescent staining in untransfected cells (Ctrl) and cells transfected with an empty vector (blank sgRNA) or an S100β sgRNA-containing plasmid. Sample sizes were four culture wells, each with >100 cells. **p < 0.01 by one-way ANOVA and Tukey post hoc test. (F) Quantification of MFI from reactive oxygen species (ROS, CellROX) for Ctrl cells and cells transfected with blank sgRNA and S100β sgRNA. Sample sizes were five culture wells, each with >100 cells. *p < 0.05 and **p < 0.01 by one-way ANOVA and Tukey post hoc test. (G) Quantification of fusion index for Ctrl cells and cells transfected with blank sgRNA and S100β sgRNA, then allowed to differentiate for 3 days. Fusion index was calculated as number of nuclei in myotubes/total number of nuclei. Sample size was four culture wells, each with >100 nuclei. **p < 0.01 by one-way ANOVA and Tukey post hoc test.
Figure 6—figure supplement 1
Overexpression of S100β induces muscle stem cell dysfunction as observed in aging.
(A) Representative immunofluorescence images of untransfected myoblasts (control), myoblasts transfected with an empty vector (blank sgRNA), and myoblasts transfected with an S100β sgRNA-containing plasmid. Cells are stained with DAPI (blue) and S100β (green). (B) Quantification of mean fluorescent intensity (MFI) TUNEL signal for untransfected cells (Ctrl) and cells transfected with blank sgRNA or S100β sgRNA. Sample sizes were four culture wells, each with >100 cells. ***p < 0.001 and ****p < 0.0001 by one-way ANOVA and Tukey post hoc test. (C) Representative immunofluorescence images of control cells and cells transfected with blank sgRNA or S100β sgRNA. Cells are stained with DAPI (blue) and MyHC (red). (D) Uniform manifold approximation and projection (UMAP) gene expression overlays of expression of neurotrophic receptors Erbb3 and Ngfr on the neuromuscular junction (NMJ) cluster.
Figure 7
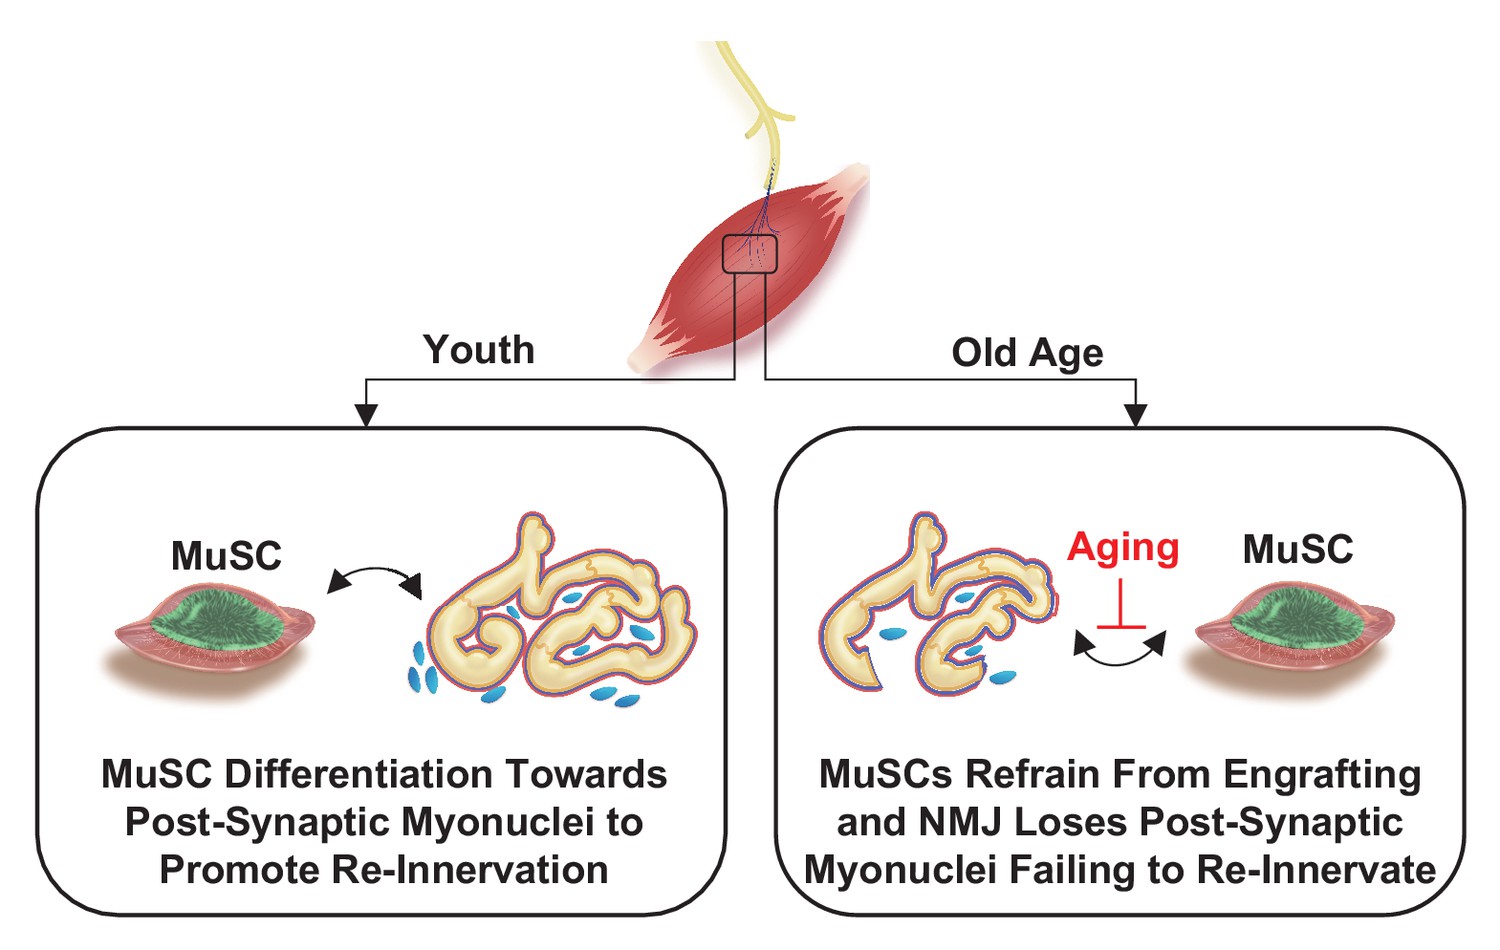
Proposed model for relationship between muscle stem cells and the neuromuscular junction.
Author response image 1
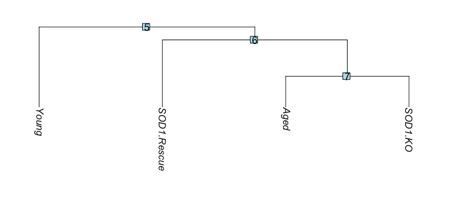
Dendrogram of transcriptional similarity across models.
SOD1.KO: SOD1-/-, SOD1.Rescue: SynTgSod1-/-.
Author response image 2

(A) UMAP overlays of transcriptomes reported in Kimmel et al., Development 2020 (peach) and the datasets reported in this manuscript.
(B) Marker-gene overlays showing canonical myogenic regulatory factors as well as S100b showing S100b is confined to the UMAP cluster containing primarily cells reported in this manuscript. (C) Pearson correlation coefficients across datasets reported herein as well as in Kimmel et al. shows high similarity overall, with three groups of highest correlation being the activated cells from Kimmel et al., our aged v3 datasets, and the young and aged quiescent v2 datasets. Some of this grouping is likely a result of differences in features and counts among the libraries. (D) Stacked bar graph showing origin of Pax7+S100b+ cells. Most are recovered in the aged v3 datasets we report, though several are also among the datasets reported by Kimmel et al., and in our young v3 dataset.
Tables
Key resources table
| Reagent type (species) or resource | Designation | Source or reference | Identifiers | Additional information |
|---|---|---|---|---|
| Antibody | APC anti-mouse Ly-6A/E (Sca-1), clone: D7, isotype: Rat IgG2a, κ | BioLegend | BioLegend 108112; RRID:AB_313349 | FACS (1:400) |
| Antibody | APC anti-mouse CD45, clone: 30-F11, isotype: Rat IgG2b, κ | BioLegend | BioLegend 103112; RRID:AB_312977 | FACS (1:400) |
| Antibody | APC anti-mouse/human CD11b, clone: M1/70. Isotype: Rat IgG2b, κ | BioLegend | BioLegend 101212; RRID:AB_312795 | FACS (1:400) |
| Antibody | APC anti-mouse TER-119, clone: TER-119, isotype: Rat IgG2b, κ | BioLegend | BioLegend 116212; RRID:AB_313713 | FACS (1:400) |
| Antibody | PE anti-mouse/rat CD29, clone: HMβ1–1, isotype: Armenian Hamster IgG | BioLegend | BioLegend 102208; RRID:AB_312885 | FACS (1:200) |
| Antibody | Biotin Rat Anti-Mouse CD184, clone: 2B11/CXCR4 (RUO), isotype: Rat IgG2b, κ, lot # 6336587 | BD Bioscience | BD Bioscience 551968; RRID:AB_394307 | FACS (1:100) |
| Antibody | Streptavidin PE-Cyanine7, lot # 4290713 | eBioscience | eBioscience 25-4317-82; RRID:AB_10116480 | FACS (1:1000) |
| Antibody | Rabbit anti-mouse laminin 1+2, Isotype: Polyclonal IgG | Abcam | Abcam ab7463; RRID:AB_305933 | IF (1:500) |
| Antibody | Goat anti-mouse IgG1, Alexa Fluor 488 conjugate | Thermo Fisher | Thermo Fisher A21121; RRID:AB_2535764 | IF (1:500) |
| Antibody | Goat anti-rabbit H+L, Alexa Fluor 555 conjugate | Thermo Fisher | Thermo Fisher A21428; RRID:AB_141784 | IF (1:500) |
| Other | 4’,6-Diamidino-2-Phenylindole, Dihydrochloride (DAPI), FluoroPure grade | Thermo Fisher | Thermo Fisher D21490 | IF (1:500) Nuclear stain |
| Antibody | Mouse anti-Pax7, Isotype MIgG1, kappa light chain, supernatant | Developmental Studies Hybridoma Bank | DHSB Pax7-s | IF (1:100) |
| Antibody | Rabbit polyclonal anti-S100B | Thermo Fisher | Thermo Fisher PA5-78161; RRID:AB_2736549 | IF (1:500) |
| Antibody | Mouse monoclonal anti-MyoD (G-1) | Santa Cruz Biotechnology | Santa Cruz Biotechnology Sc-377460; RRID:AB_2813894 | IF (1:200) |
| Antibody | Donkey anti-rabbit IgG (H+L), Alexa Fluor 647 | Thermo Fisher | Thermo Fisher A31573; RRID:AB_2536183 | IF (1:500) |
| Antibody | Goat anti-mouse H+L, Alexa Fluor 555 conjugate | Thermo Fisher | Thermo Fisher A28180; RRID:AB_2536164 | IF (1:250) |
| Antibody | Alexa Fluor 488 goat anti-rabbit secondary antibody | Thermo Fisher | Thermo Fisher A11034; RRID:AB_2576217 | IF (1:500) |
| Antibody | Alexa Fluor 488 conjugated α-Bungarotoxin | Thermo Fisher | Thermo Fisher B13422 | IF (1:500) |
| Antibody | Hoechst 33342 | Thermo Fisher | Thermo Fisher H3570 | IF (1:500) |
| Antibody | Goat anti-rabbit IgG (H+L), Alexa Fluor 647 | Thermo Fisher | Thermo Fisher A21245; RRID:AB_2535813 | IF (1:500) |
| Antibody | Goat anti-mouse IgG (H+L), Alexa Fluor 647 | Thermo Fisher | Thermo Fisher A21235; RRID:AB_2535804 | IF (1:500) |
| Other | Dispase II (activity ≥0.5 units/mg solid) | Sigma Aldrich | Sigma D4693-1G | Digestion of tissue to extract MuSCs |
| Other | Collagenase Type II | Thermo Fisher | Thermo Fisher 17101015 | Digestion of tissue to extract MuSCs |
| Chemical compound, drug | Propidium Iodide – 1.0 mg/mL solution in water | Thermo Fisher | Thermo Fisher P3566 | FACS (1:400) |
| Commercial assay or kit | Mouse on Mouse blocking reagent | Vector Laboratories | Vector Laboratories MKB-2213; RRID:AB_2336587 | |
| Other | Corning CellTak | Fisher Scientific | Fisher Scientific C354240 | 22.4 µg/mL Adhere MuSCs to tissue culture plastic |
| Peptide, recombinant protein | XbaI | New England Biolabs | NEB R0145S | |
| Peptide, recombinant protein | SalI | New England Biolabs | NEB R3138S | |
| Peptide, recombinant protein | Matrigel Basement Membrane Matrix, LDEV-free | Corning | Corning 356234 | |
| Commercial assay or kit | CellROX Deep Red Reagent | Thermo Fisher | Thermo Fisher C10422 | |
| Commercial assay or kit | Stellaris RNA FISH Wash Buffer A | LGC-Biosearch | LGC-Biosearch SMF-WA1-60 | |
| Commercial assay or kit | Stellaris RNA FISH Wash Buffer B | LGC-Biosearch | LGC-Biosearch SMF-WB1-20 | |
| Commercial assay or kit | Stellaris RNA FISH Hybridization Buffer | LGC-Biosearch | LGC-Biosearch SMF-HB1-10 | |
| Sequence-based reagent | Fos FISH probe | LGC-Biosearch | LGC-Biosearch VSMF-3011–5 | |
| Commercial assay or kit | Single cell 3’ Library and Gel Bead Kit v2 and v3 | 10× Genomics | 10× Genomics 120267 | |
| Commercial assay or kit | QIAprep Spin Miniprep Kit | Qiagen | Qiagen 27104 | |
| Commercial assay or kit | Satellite Cell Isolation Kit, mouse | Miltenyi Biotec | Miltenyi Biotec 130104268 | |
| Commercial assay or kit | In Situ Cell Death Detection Kit, TMR red | Sigma Aldrich | Sigma 12156792910 | |
| Biological sample (Mus musculus) | C57BL/6 mice | Charles River Labs | C57BL/6NCrl Strain 027 | Female, 3–4 months |
| Biological sample (Mus musculus) | C57BL/6 mice | NIA | C57BL/6JNia; RRID:IMSR_JAX:000664 | Female, 20–24 months |
| Biological sample (Mus musculus) | SynTgSod1-/- mice | Oklahoma Medical Research Foundation | PMID:24378874, 31470261 | Female, 10–12 months |
| Biological sample (Mus musculus) | Sod1-/- mice | Oklahoma Medical Research Foundation | PMID:9264557, 15531919 | Female, 10–12 months |
| Biological sample (Mus musculus) | Pax7CreER+/+ mice | Jackson Labs | RRID:IMSR_JAX:017763 | Male, 2–3 months |
| Biological sample (Mus musculus) | Rosa26mTmG+/+ mice | Jackson Labs | RRID:IMSR_JAX: 007676 | Female, 2–3 months |
| Biological sample (Mus musculus) | Rosa26TdTomato+/+ mice | Jackson Labs | RRID:IMSR_JAX: 007909 | Female, 2–3 months |
| Biological sample (Mus musculus) | Rosa26nTnG+/+ mice | Jackson Labs | RRID:IMSR_JAX: 023035 | Female, 2–3 months |
| Biological sample (Mus musculus) | S100b-GFP mice | Jackson Labs | RRID:IMSR_JAX: 005621 | Female |
| Biological sample (Mus musculus) | Rosa26dCas9-SunTag/+ mice | Jackson Labs | Stock # 43926-JAX | Female |
| Software, algorithm | CellRanger v2.0.0, v3.0.0 | 10× Genomics | https://support.10xgenomics.com/single-cell-gene-expression/software/downloads | |
| Software, algorithm | R v.4.0.2 | The R Foundation for Statistical Computing | RRID:SCR_001905 | |
| Software, algorithm | Bioconductor v.3.11 | Huber et al., 2015 | Nature Methods 12:115–121, PMID:25633503 | |
| Software, algorithm | DESeq2 v.1.28.1 | Love et al., 2014 | RRID:SCR_015687 | |
| Software, algorithm | scVelo v.0.2.2 | Bergen et al., 2020 | RRID:SCR_018168 | |
| Software, algorithm | ggplot2 v.3.3.2 | Wickham, 2016 | RRID:SCR_014601 | |
| Software, algorithm | EnhancedVolcano v.1.6.0 | Blighe et al., 2021 | RRID:SCR_018931 | |
| Software, algorithm | Python v3.6.5 | Python Software Foundation | RRID:SCR_008394 | |
| Software, algorithm | Seurat v.3.2.2 | Stuart et al., 2019 | RRID:SCR_007322 | |
| Software, algorithm | SeuratWrappers v0.3.0 | https://github.com/satijalab/seurat-wrappers | ||
| Software, algorithm | scCATCH | Shao et al., 2020 | https://github.com/ZJUFanLab/scCATCH | |
| Software, algorithm | LIGER v0.5.0 | Welch et al., 2019 | RRID:SCR_018100 | |
| Software, algorithm | AnnotationDbi v1.50.3 | Pagès et al., 2021 | ||
| Software, algorithm | GenomeInfoDb 1.24.2 | Arora and Morgan, 2021 | ||
| Software, algorithm | Jupyter v.4.4.0, notebook v.5.7.8 | Project Jupyter 2019 | https://jupyter.org/ | |
| Software, algorithm | dplyr v1.0.2 | Wickham, 2021 | RRID:SCR_016708 | |
| Software, algorithm | tibble v3.4.0 | Müller and Wickham, 2021 | ||
| Software, algorithm | tximport v1.16.1 | Soneson et al., 2016 | RRID:SCR_016752 | |
| Software, algorithm | Velocyto v0.17 | La Manno et al., 2018 | RRID:SCR_018167 | |
| Software, algorithm | Kallisto v0.44 | Bray et al., 2016 | RRID:SCR_016582 |
Additional files
Download links
A two-part list of links to download the article, or parts of the article, in various formats.
Downloads (link to download the article as PDF)
Open citations (links to open the citations from this article in various online reference manager services)
Cite this article (links to download the citations from this article in formats compatible with various reference manager tools)
Murine muscle stem cell response to perturbations of the neuromuscular junction are attenuated with aging
eLife 10:e66749.
https://doi.org/10.7554/eLife.66749


