Circuit organization of the excitatory sensorimotor loop through hand/forelimb S1 and M1
- Department of Physiology, Feinberg School of Medicine, Northwestern University, United States
- Department of Microbiology-Immunology, Feinberg School of Medicine, Northwestern University, United States
Figures
Figure 1 with 1 supplement
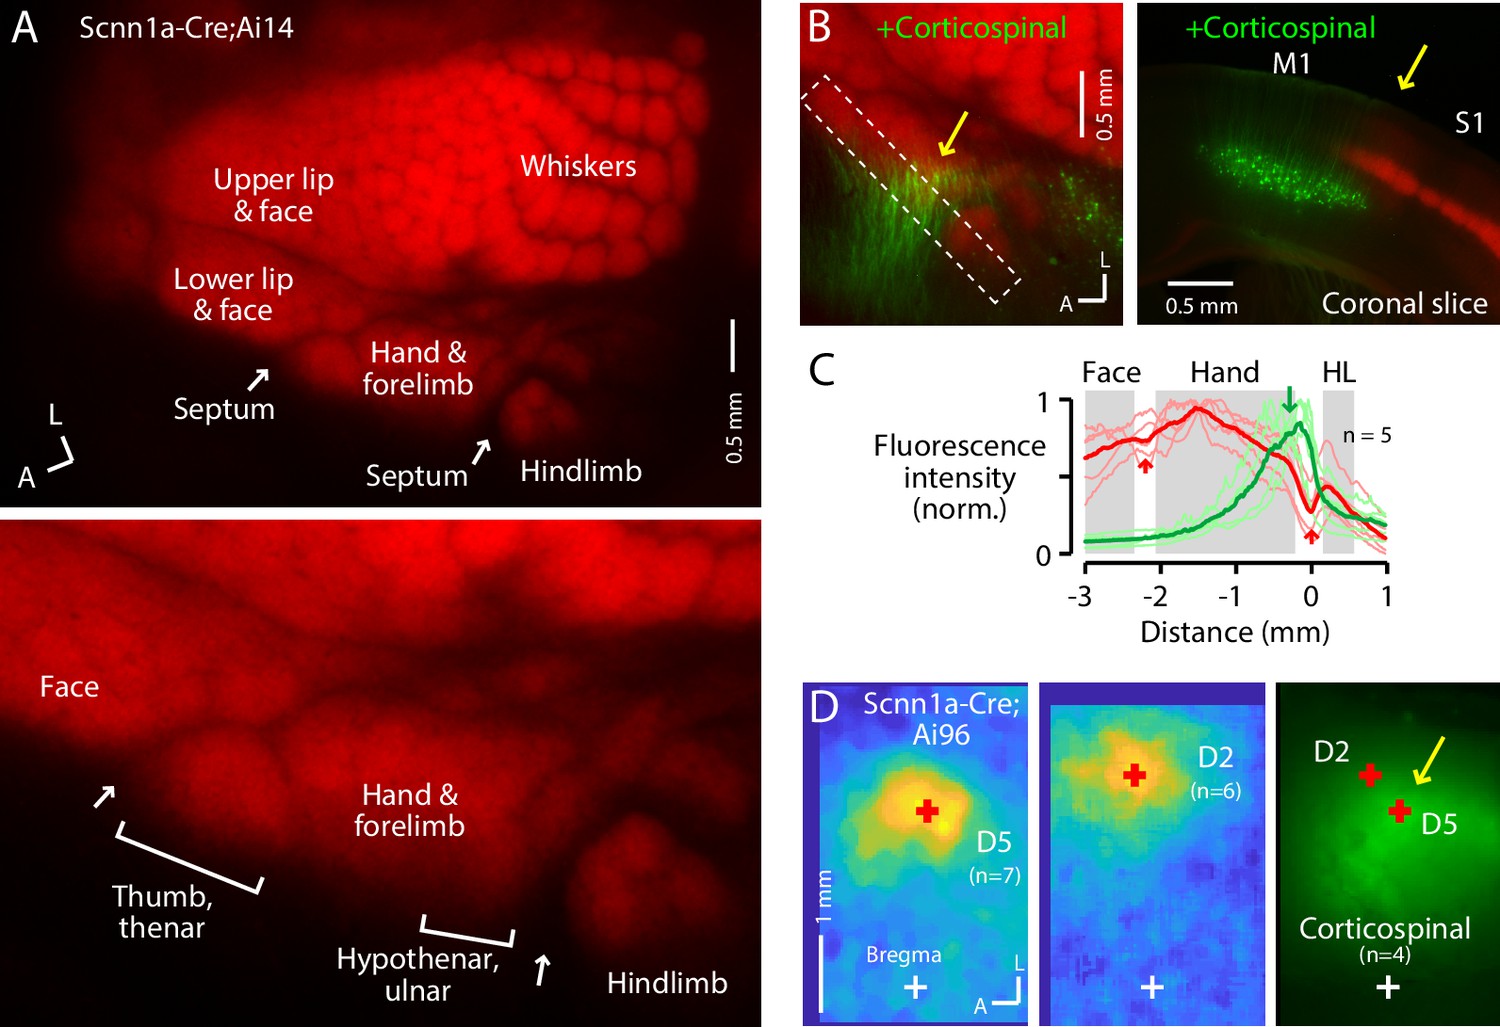
The S1 hand/forelimb subfield overlaps medially with corticospinal neurons.
(A) Top: Flat-mount section through L4 of the cortex of a Scnn1a-Cre;Ai14 mouse, showing the L4 labeling pattern across S1 cortex. This image is of the right side of the brain, as are all dorsal-view images in the figures unless indicated otherwise. A, anterior; L, lateral. Bottom: Enlarged view of the hand region. Septa (arrows) separate the hand region from the neighboring face and hindlimb regions. Labeling of S1 somatotopic subfields is based on prior studies in mice and rats (Waters et al., 1995; Sigl-Glöckner et al., 2019) and standard atlases (Dong, 2008). (B) Left: Same, additionally showing corticospinal neurons (green; their dendrites within the section mainly through L4), labeled by cervical injection of AAVretro-GFP. Dashed rectangle: region of interest used to quantify fluorescence profile. Arrow: region of overlap. Right: Coronal section (different animal), showing laminar labeling patterns. This image is of the right side of the brain (midline is to the left), as are all coronal images in the figures unless indicated otherwise. (C) Fluorescence intensity profiles across the anteromedial edge of the S1 area (marked by dashed rectangle in image in panel B), for individual animals (lighter traces) and group average (darker, n = 5 animals), showing hand area (gray) bordered by septa (red arrows), with region of corticospinal labeling (green arrow) located medially, in the putative hypothenar/ulnar subregion. Intensity profiles were aligned to the hand-hindlimb septum (x = 0). (D) Somatosensory responses mapped by transcranial GCaMP6s imaging in Scnn1a-Cre;Ai96 mice, showing the average responses to stimulation of the fifth (D5) and second (D2) digits, with the centroids of the responses marked (red ‘+'), which are also shown superimposed on the average transcranial image of corticospinal labeling, from a subset of the same mice that were injected with AAVretro-GFP in the spinal cord. Maps are aligned to bregma (white ‘+').
Figure 1—figure supplement 1
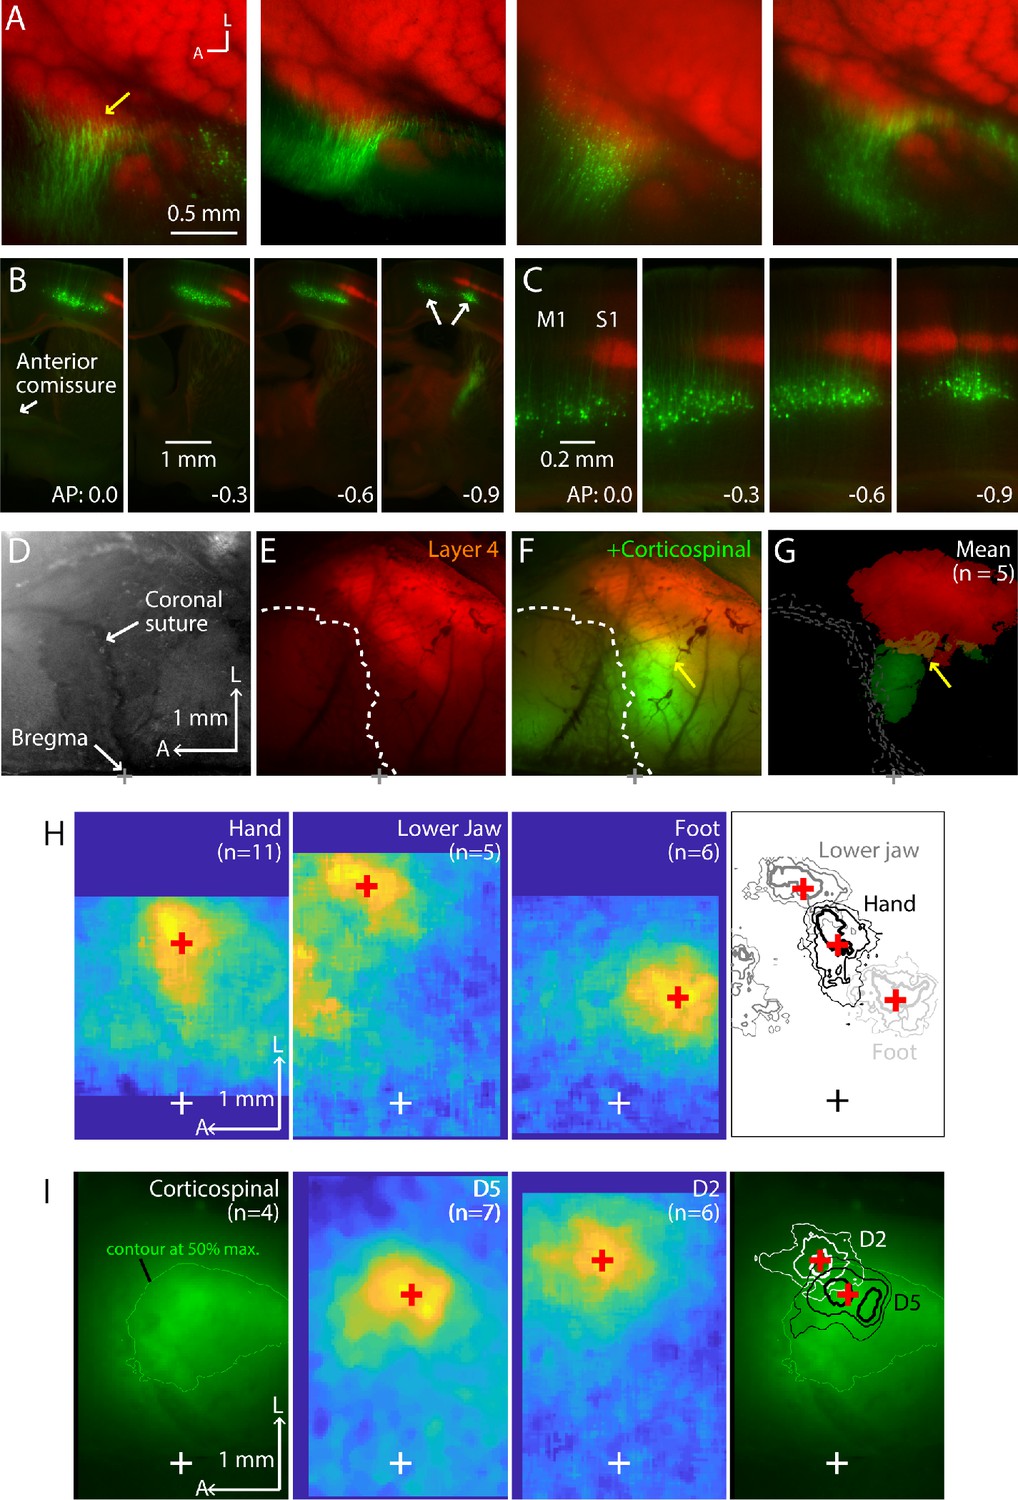
Additional examples and analyses of L4 labeling, corticospinal labeling, and GCaMP imaging.
(A) Zoomed-in views of the labeling patterns in flat-mounted cortex. Leftmost panel is the same as in Figure 1B; other panels show additional examples from other animals. (B) Coronal sections from another animal, showing laminar labeling patterns. (C) Same, shown at higher zoom. (D) Bright-field image of the right side of the cranium of Scnn1a-Cre;Ai14 mouse, showing the coronal suture and bregma. (E) Corresponding transcranial red fluorescence image from the same mouse, showing the cortical labeling pattern. Dashed line: coronal suture. Scale bars apply to panels A-D. (F) Same, also showing the cortical labeling of corticospinal neurons (green channel), retrogradely labeled by C6 cervical injection of AAVretro-GFP. Arrow points to region of red-green overlap. (G) Average fluorescence images (n = 5 animals), thresholded at 50% of maximum intensity and aligned to bregma. (H) Average cortical responses in CaMKII-Cre;Ai96 mice, evoked by stimulation (20 Hz, 1 s) of the left hand, lower jaw, or hindlimb. White cross indicates bregma. Red cross indicates the centroid of top 20% response. Right: Contour plots showing the top 10, 20, and 30% response levels, plotted with different line thickness (thickest = 10%). The same centroids (red cross) are also shown. (I) Average epifluorescence image of corticospinal labeling (transcranial) from Scnn1a-Cre;Ai96 mice injected at spinal level C6 with AAVretro-tdTomato (n = 4). Green contour indicates 50% of maximum fluorescence signal. Middle panels show the average sensory responses evoked by stimulation (1 s, 20 Hz) of the fifth (D5) or second (D2) digits. Red crosses indicate the centroids of the top 20% response area. Right: The response contours and centroids are plotted on the corticospinal labeling image.
Figure 2 with 1 supplement
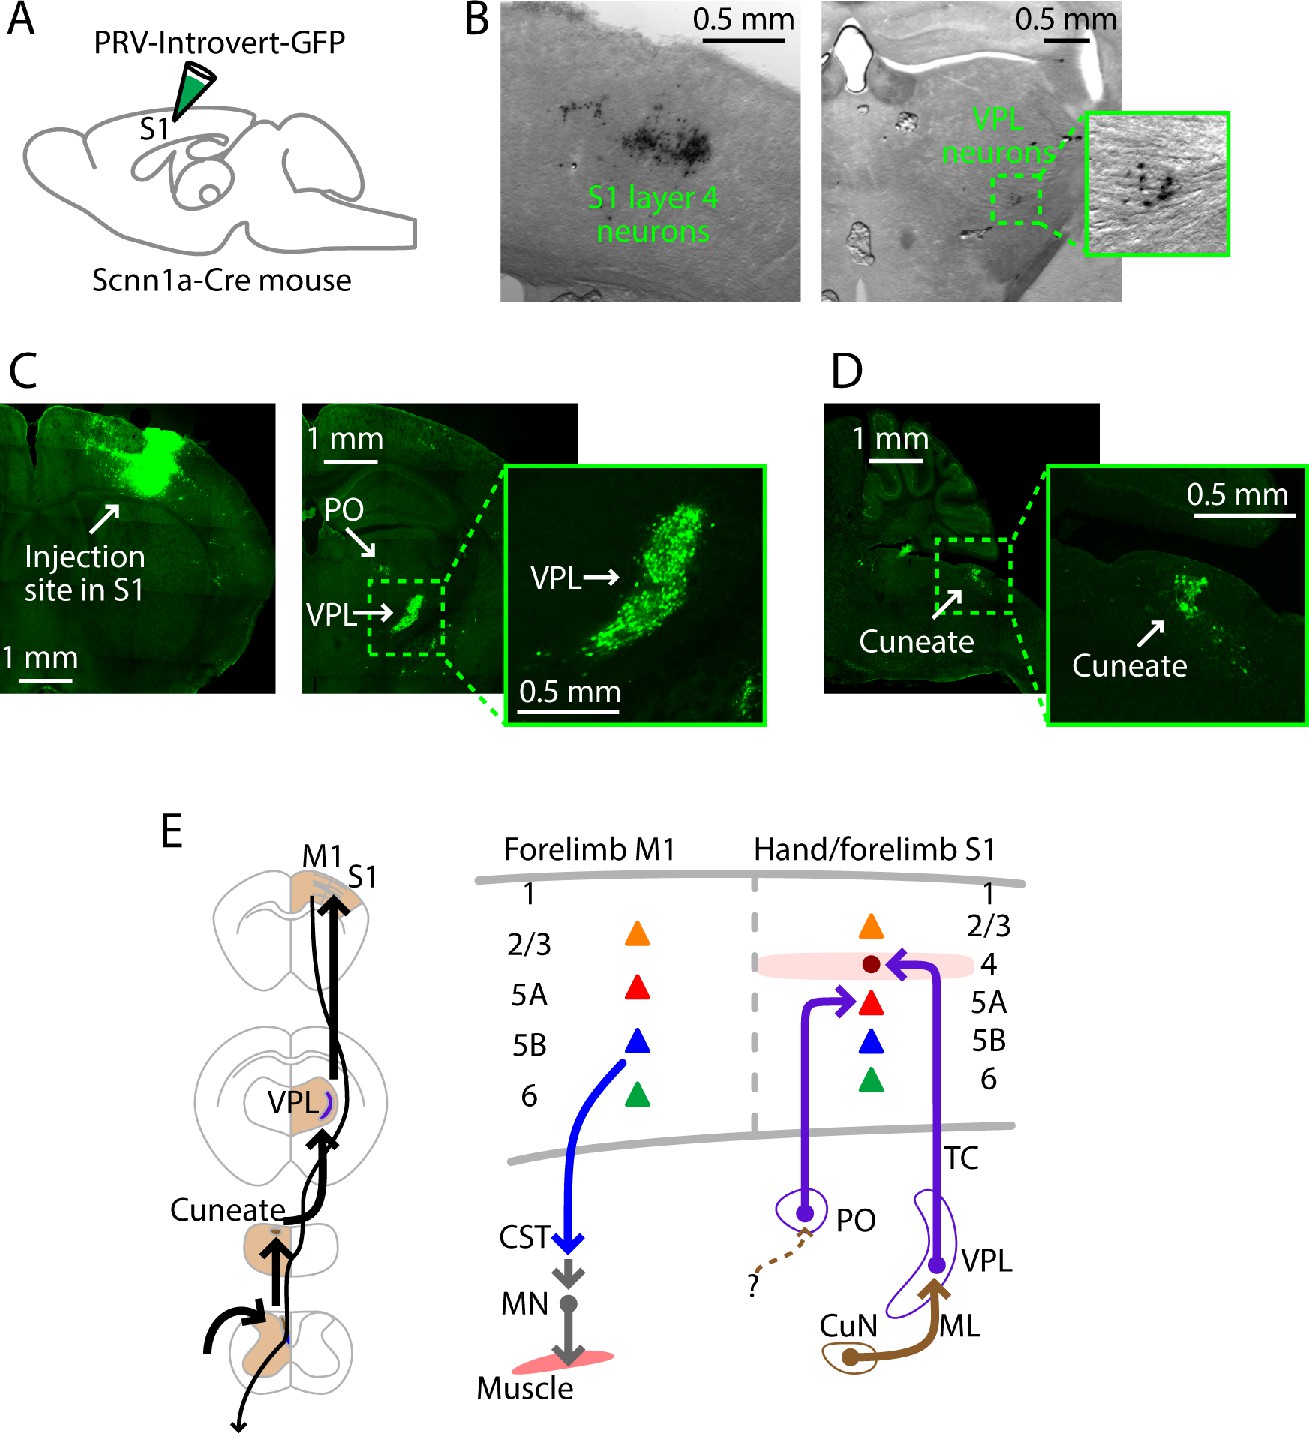
PRV labeling of the lemnisco-cortical pathway to L4 neurons in hand S1.
(A) Schematic depicting the injection strategy. PRV-Introvert-GFP was injected into the S1 hand subfield in Scnn1a-Cre mice, a L4-specific Cre driver line. (B) Labeling pattern observed in cortex at the injection site in S1 (left) and in thalamus in VPL (right), after incubation period of 72 hr (coronal slices). PRV labeling was visualized by immunohistochemical amplification of GFP followed by DAB staining. (C) Same experiment, but with a longer incubation period of 96 hr. PRV labeling was visualized by immunohistochemical amplification of GFP followed by FITC staining. Left: Coronal slice showing labeling at the injection site in cortex. Right: Coronal slice showing thalamic labeling, at lower (left) and higher (right) magnification. (D) Sagittal slice showing cuneate labeling, at lower (left) and higher (right) magnification. (E) Schematic summaries depicting the ascending lemnisco-cortical pathway to hand/forelimb S1, via cuneate→VPL→S1-L4 connections, and the descending pathway from forelimb M1 corticospinal neurons. The S1 also receives PO→S1-L5A input.
Figure 2—figure supplement 1
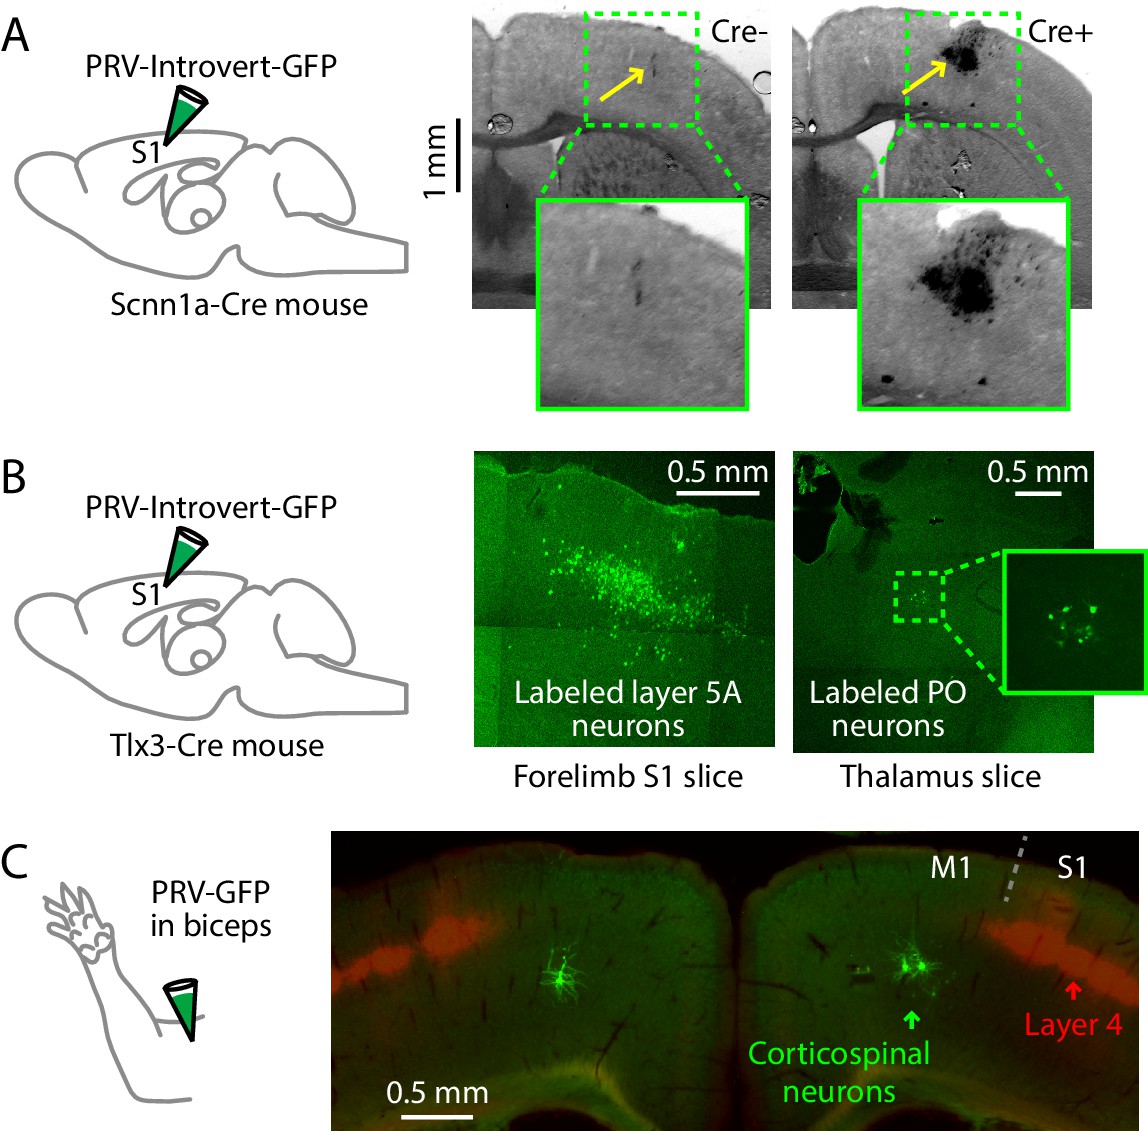
Additional PRV labeling results.
(A) To control for the Cre-dependence of the PRV-Introvert-GFP virus, the virus was injected in the S1 cortex of a Cre-negative mouse (left images). Minor nonspecific labeling was observed at the injection site, without evidence of neuronal labeling or transneuronal spread (n = 2 mice). Injection in a Cre-positive mouse produced strong labeling in L4 at the injection site (right images). (B) Injection strategy: PRV-Introvert-GFP was injected into the hand area of S1 in Tlx3-Cre mice, a L5A-specific Cre driver line. Right: Representative images showing labeling patterns at the injection site in cortex (left) and in PO thalamus (right), 96 hr post-injection. (C) Schematic depicting the injection of PRV-GFP into the biceps muscle. Example showing labeling of corticospinal neurons (green) in M1 in a coronal section, from a mouse also expressing tdTomato in S1 L4 (red; Scnn1a-Cre;Ai14); in this example the biceps were injected bilaterally with PRV.
Figure 3
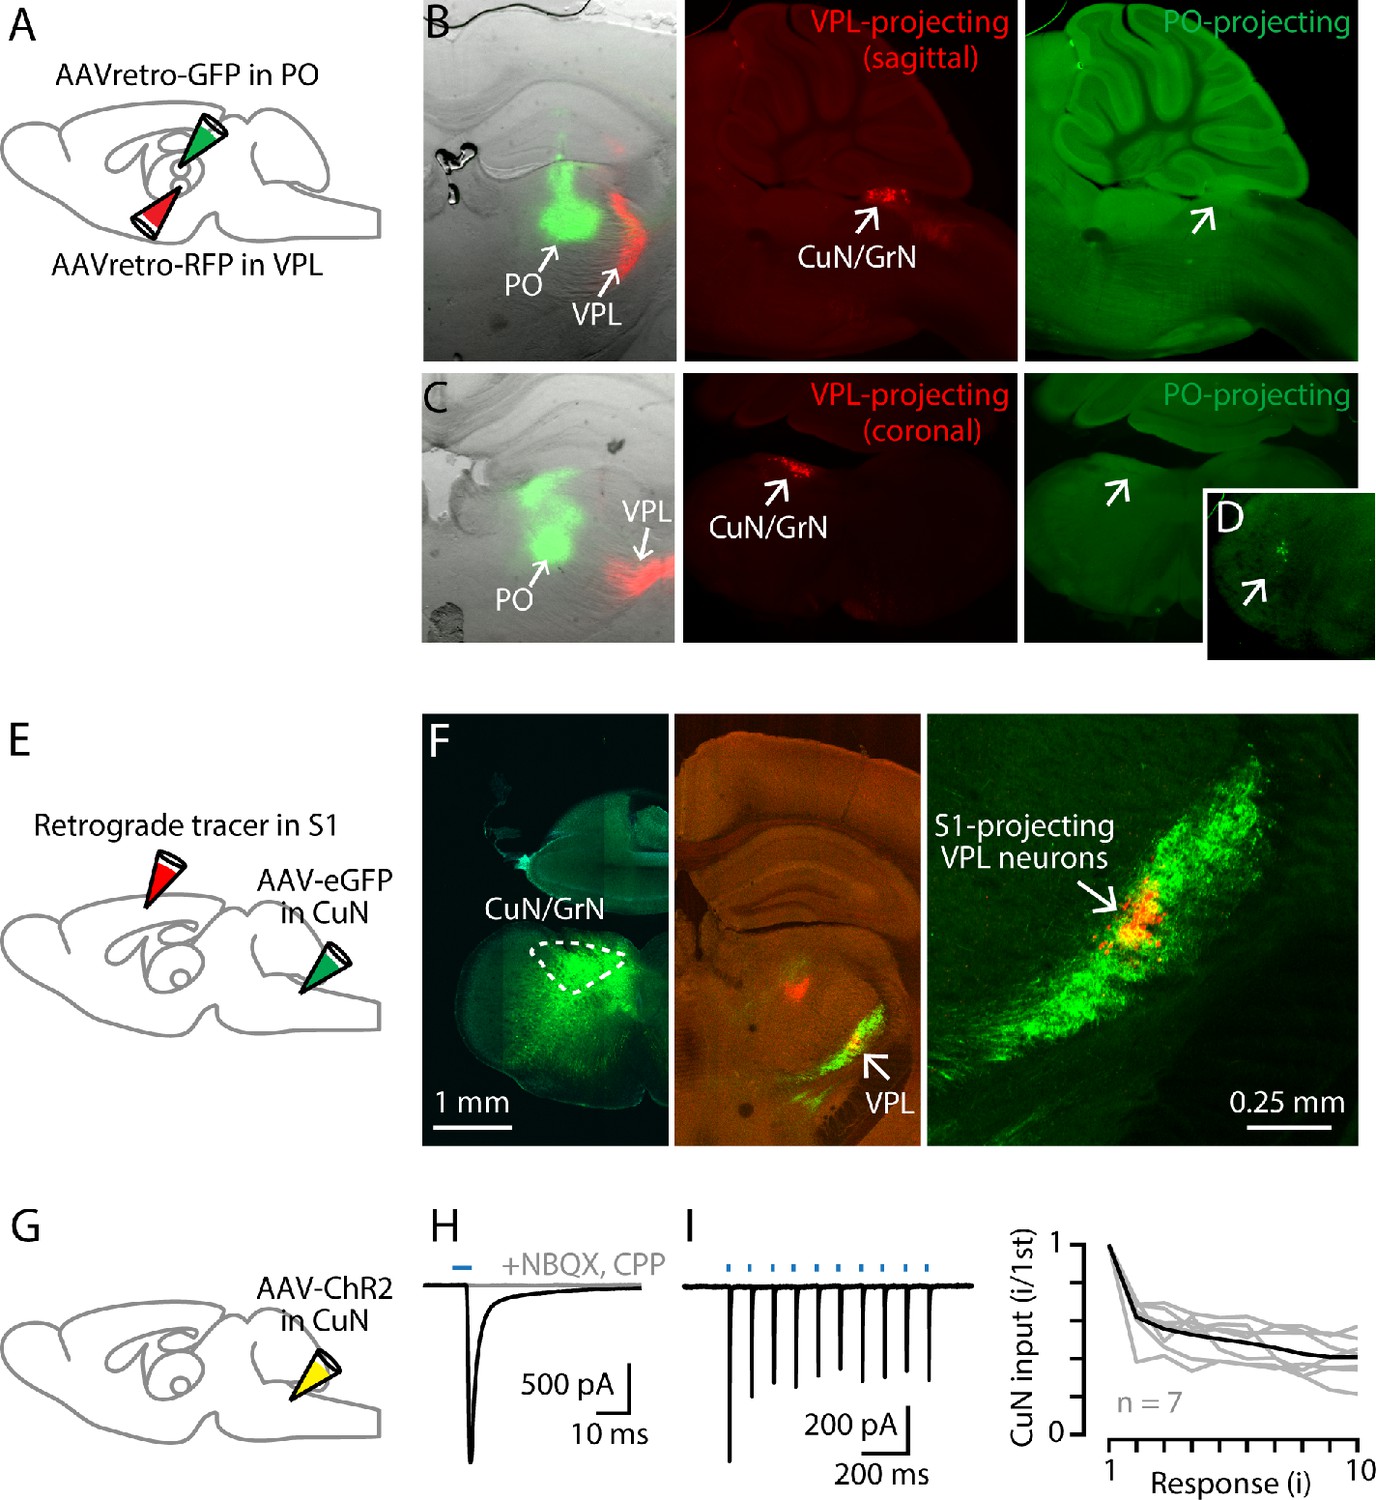
Cuneate→VPL circuit analysis.
(A) Schematic of injection strategy: PO was injected with AAVretro-GFP and VPL was injected with AAVretro-RFP. (B) Left: Coronal section showing injection sites in VPL and PO. Middle: Sagittal section showing labeled VPL-projecting neurons in the cuneate nucleus. Right: Same, showing absence of PO-projecting neurons in the same region. (C) Same, but with coronal sections, at the level of the right thalamus (left) and left cuneate (middle and right). (D) Labeled PO-projecting neurons in the trigeminal nucleus. (E) Schematic of injection strategy: forelimb S1 was injected with a retrograde tracer CTB647, and cuneate nucleus was injected with AAV-eGFP. (F) Left: Labeling at site of AAV-eGFP injection in the cuneate nucleus (left side of the brainstem). Middle: Labeled cuneothalamic axons in VPL thalamus. Right: VPLS1-proj neurons are situated within the field of labeled cuneothalamic axons. (G) Schematic of injection strategy: the cuneate nucleus was injected with AAV-ChR2. (H) Example traces showing strong excitatory synaptic responses recorded in a VPL neuron in a thalamic brain slice, evoked by photostimulation of ChR2-expressing cuneothalamic axons. (I) Example traces (left) and group data (right) showing strong synaptic depression of responses to trains of photostimuli (amplitude of the ith response divided by that of the first; gray, individual neurons; black, group mean).
Figure 4 with 1 supplement
Cuneate→VPL→S1 circuit analysis.
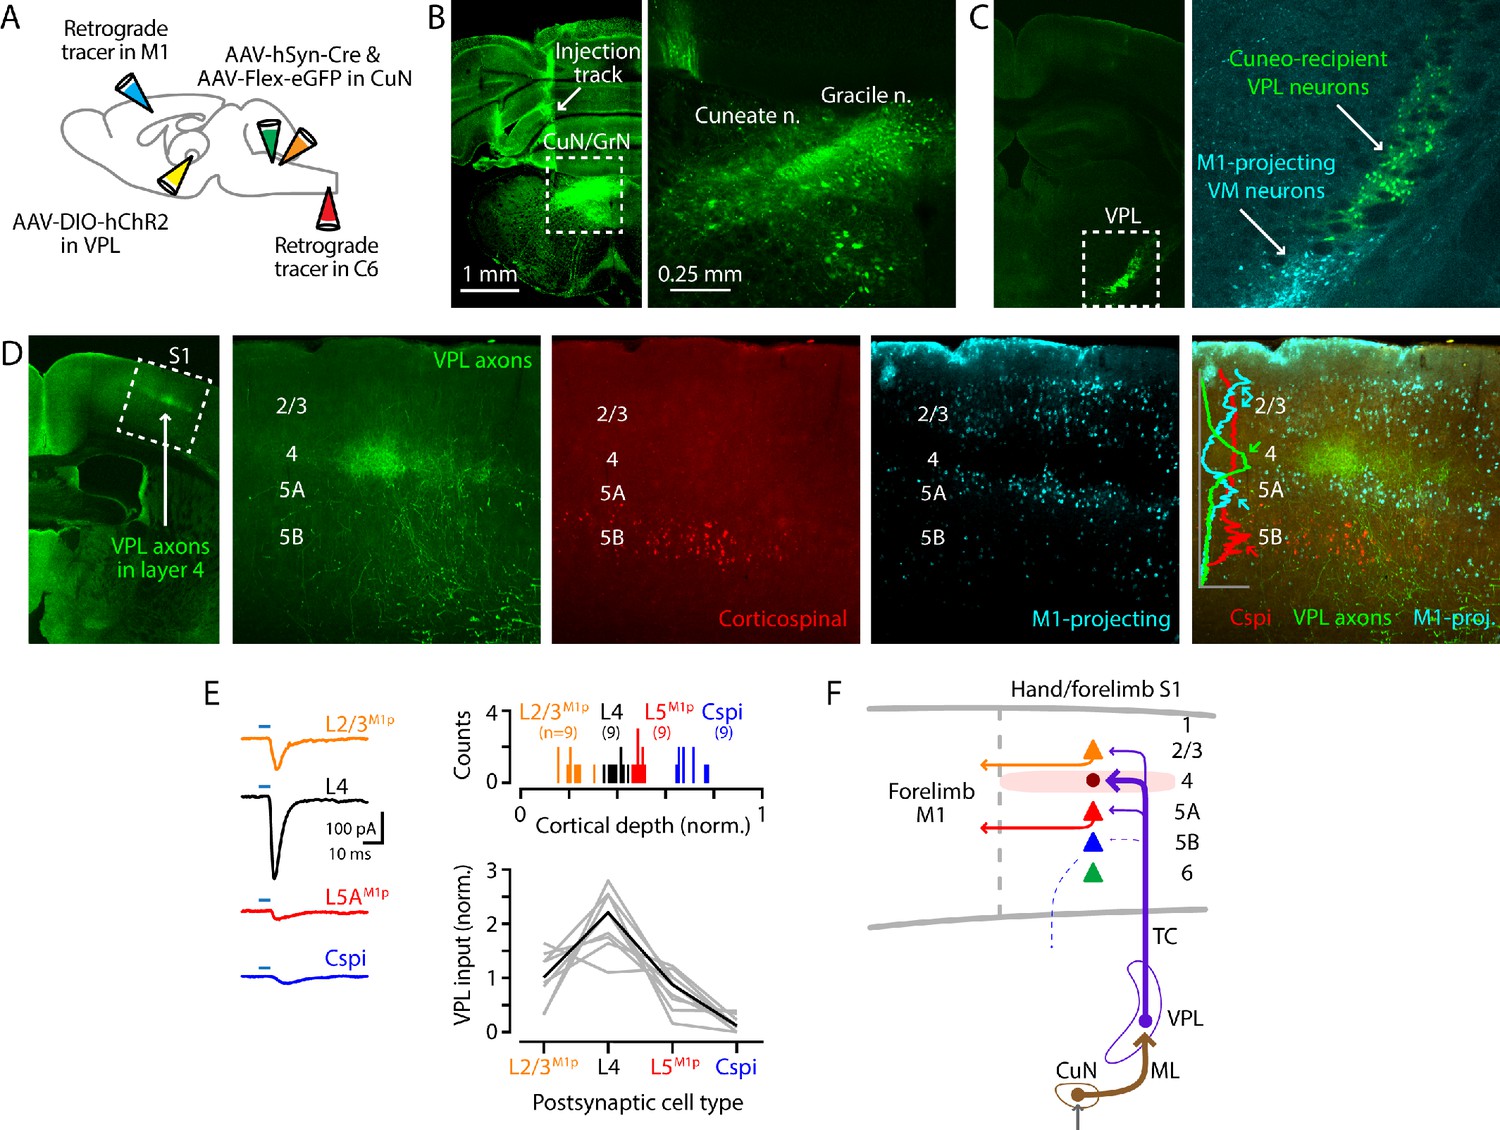
(A) Schematic of injection strategy: forelimb M1 was injected with one retrograde tracer (CTB647) and C6 spinal cord with another (red Retrobeads); the cuneate nucleus was injected with AAV-hSyn-Cre and AAV-Flex-EGFP; and, the VPL was injected with AAV-DIO-hChR2. (B) Fluorescence images at low (left) and high (right) power of a coronal section at the level of the dorsal column nuclei, showing labeling in the cuneate and gracile nuclei (left side of the brainstem). Labeling in the latter likely represents spread from the targeted site in the cuneate. (C) Coronal section at the level of the VPL nucleus, showing the anterogradely labeled cuneate axons and cuneo-recipient VPL neurons (both in green), along with retrogradely labeled VMM1-proj neurons. (D) Coronal section at the level of S1, showing the anterogradely labeled VPL axons ramifying in L4 (green; left). The middle three panels show at higher magnification the labeling of VPL axons (green), corticospinal neurons (red, in L5B), and M1-projecting corticocortical neurons (cyan, particularly L2/3 and L5A). These are also shown as a merged image (far right), with a plot of the normalized fluorescence intensity profiles of the different colors. (E) Left: example traces of EPSCs evoked by photostimulating ChR2-expressing VPL axons in cortical brain slices, recorded in L2/3M1-proj, L4, L5M1-proj, and corticospinalC6-proj neurons in S1. Upper right: Histogram of the normalized cortical depths of each of the S1 cell types sampled. Numbers of cells per group are given in parentheses below the cell type labels. Lower right: Plot of EPSC amplitudes recorded in the four types of postsynaptic S1 neurons. Gray: data from individual sets of four neurons (i.e., sequentially recorded quadruplets). The EPSCs of each quadruplet of recorded neurons were normalized to the quadruplet average. Black: group average, calculated across the set of n = 8 quadruplets. (F) Schematic summary of the main findings.
Figure 4—figure supplement 1
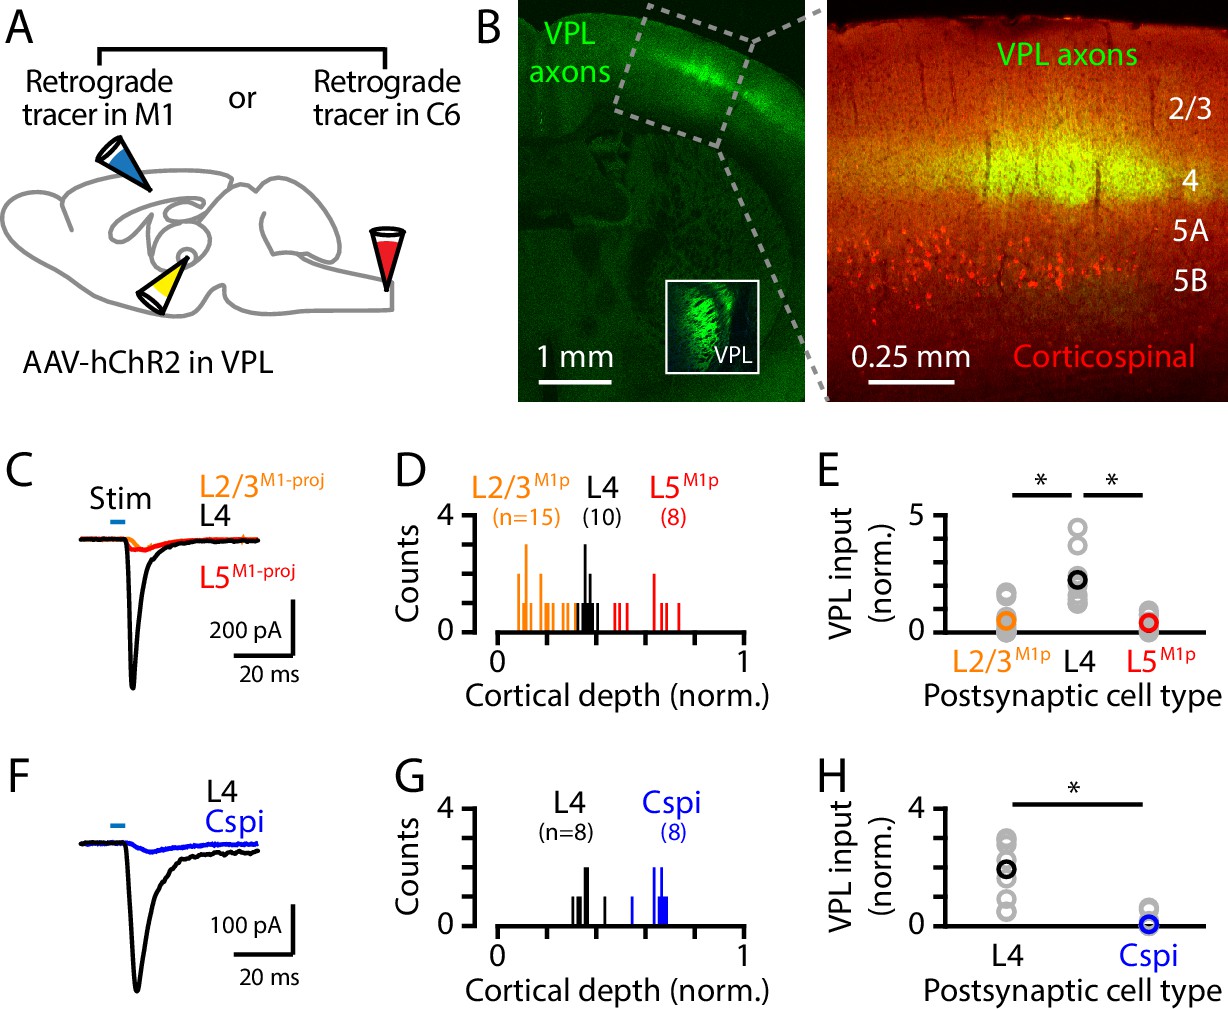
VPL→S1 circuit analysis.
(A) Schematic of injection strategy: the VPL was injected with AAV-ChR2 and either the C6 spinal cord or the M1 was injected with a retrograde tracer (either CTB647 or red beads). (B) Left: coronal section showing VPL axons (green) ramifying primarily in L4 of S1; inset shows labeling at the injection site in VPL. Right: higher power view of the same, also showing the retrogradely labeled corticospinal neurons (red). (C) Example traces of EPSCs evoked by photostimulating the ChR2-expressing VPL axons, recorded in S1 neurons identified as L2/3M1-proj, L4, and L5M1-proj neurons. (D) Histogram of the normalized cortical depths of each of the S1 cell types sampled. Numbers of cells per group are given in parentheses below the cell type labels. (E) Plot of EPSC amplitudes recorded in the three types of postsynaptic S1 neurons. Gray: data from individual neurons, generally recorded as a set (i.e., sequentially recorded triplets). The EPSCs of each set of recorded neurons were normalized to the set average. Group averages were calculated across the individual values per set. Asterisks (*) indicate significant differences between groups (details in main text). (F–H) Same, for analysis of VPL excitatory input to L4 versus corticospinalC6-proj neurons.
Figure 5
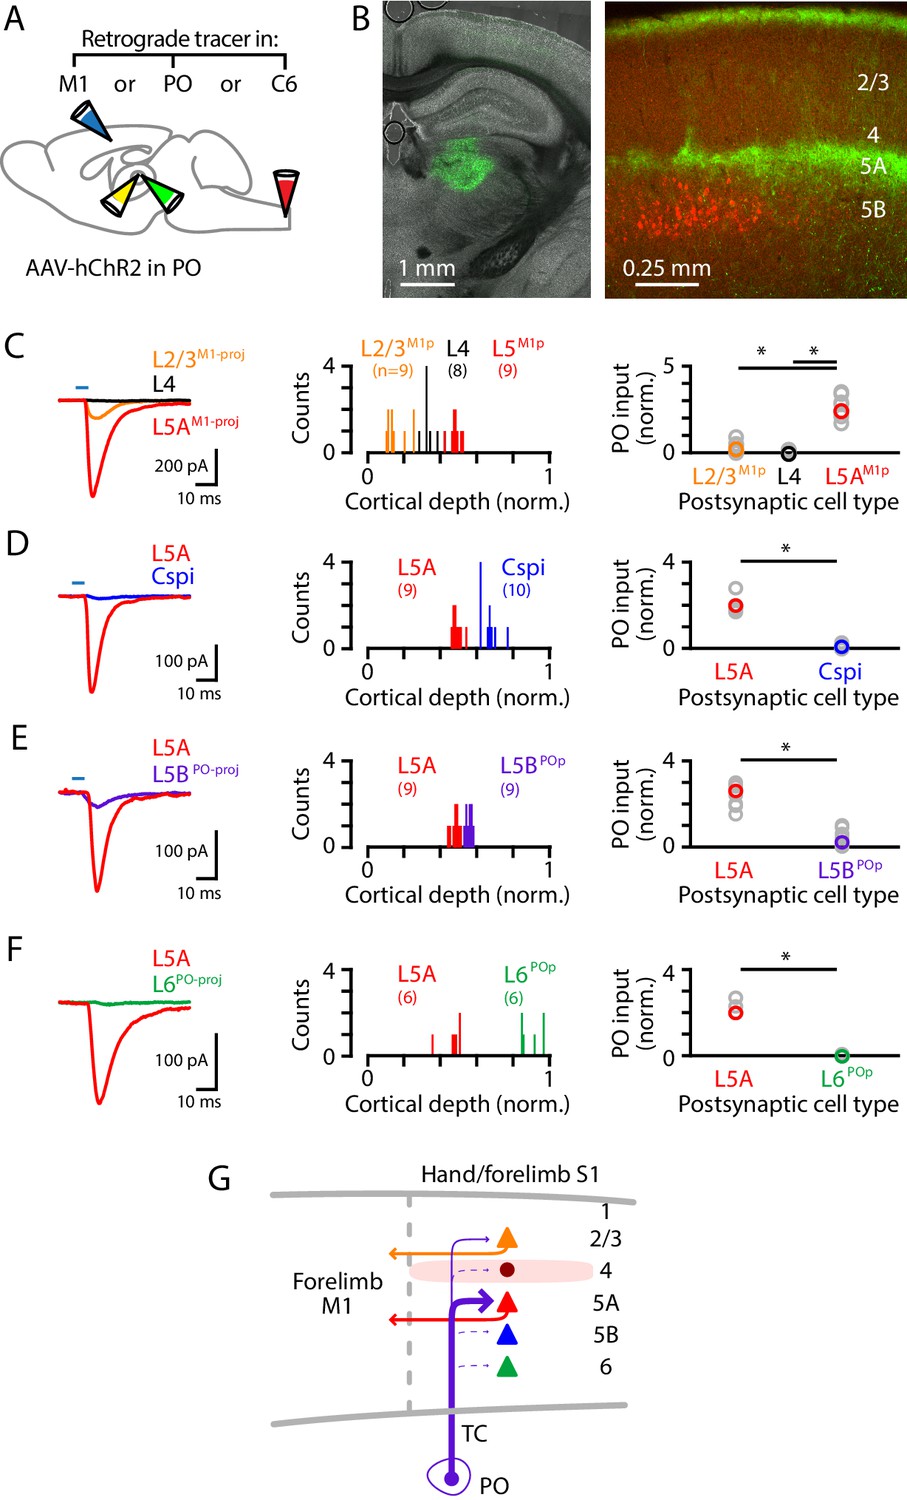
PO axons mainly excite L5AM1-proj neurons in S1.
(A) Schematic of injection strategy: the PO was injected with AAV-hChR2, and the forelimb M1, PO, and/or C6 spinal cord with retrograde tracer(s) (CTB647 and/or red Retrobeads). (B) Left: coronal section showing labeling at the injection site in PO (green). Right: coronal section showing labeled PO axons (green) ramifying primarily in L1 and L5A of S1, and also showing the retrogradely labeled corticospinal neurons (red). (C) Left: example traces of EPSCs evoked by photostimulating the ChR2-expressing PO axons, recorded in L2/3M1-proj, L4, and L5M1-proj neurons in S1. Middle: Histogram of the normalized cortical depths of each of the S1 cell types sampled. Numbers of cells per group are given in parentheses below the cell type labels. Right: Plot of EPSC amplitudes recorded in the three types of postsynaptic S1 neurons. Asterisks (*) indicate significant differences between groups (details in main text). (D) Same, comparing PO inputs to L5A and corticospinalC6-proj neurons in S1. (E) Same, comparing PO inputs to L5A and L5BPO-proj neurons in S1. (F) Same, comparing PO inputs to L5A and L6PO-proj neurons in S1. (G) Schematic summary of the main findings.
Figure 6

Corticocortical axons from S1 mainly excite L2/3 neurons in M1.
(A) Schematic of injection strategy: the cervical spinal cord was injected at level C6 with retrograde tracer (red Retrobeads), and hand S1 was injected with AAV-DIO-hChR2, in a Tlx3-Cre mouse. (B) Left: Coronal section at the level of hand S1, showing labeling primarily of L5A neurons at the site of injection (arrow). Corticospinal neurons in L5B are also observed (red; red arrow). White arrowhead marks the approximate location of the medial border of hand S1. Center: Same, for a more anterior coronal section at the level of hand M1. Right: Same, showing an enlarged view of the labeling pattern in forelimb M1. (C) Left: Example traces of EPSCs evoked by photostimulating the ChR2-expressing S1 axons, recorded in L2/3, L5A, L6, and corticospinalC6-proj neurons in M1. Middle: Histogram of the normalized cortical depths of each of the S1 cell types sampled. Numbers of cells per group are given in parentheses below the cell type labels. Right: Plot of EPSC amplitudes recorded in the four types of postsynaptic M1 neurons. (D) Schematic summary of the main findings. (E–H) Same, but using shallow injections in S1 to label L2/3 neurons, to analyze the S1-L2/3→M1 connections.
Figure 7
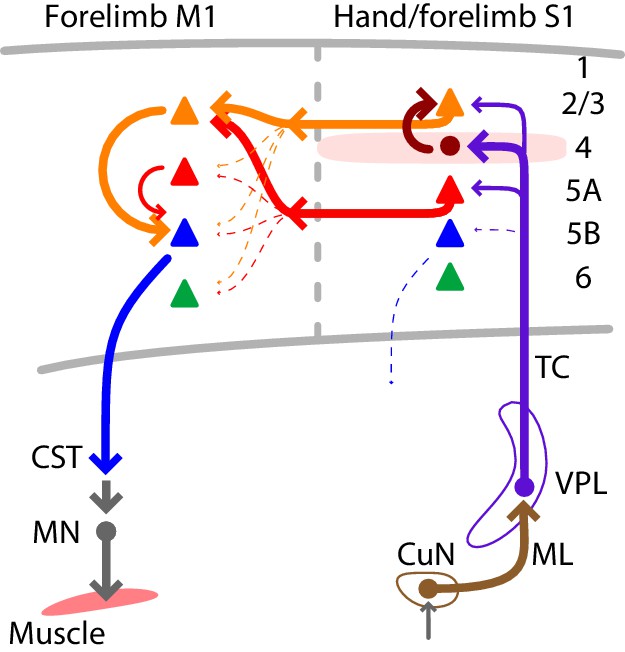
Summary wiring diagram of the major excitatory connections along the hand/forelimb-related somatosensory-to-motor transcortical circuit.
The thickest arrows emphasize the strongest connections. The lemnisco-cortical circuit, arising from the cuneate nucleus, traverses the VPL via strong, depressing-type excitatory connections, and primarily targets L4 neurons in hand-related S1. In hand S1, similar to other sensory areas, L4 neurons connect strongly to L2/3 neurons. Neurons in both L2/3 and L5A in turn project to M1, forming convergent excitatory connections onto L2/3 neurons there. Strong local L2/3 connections to corticospinal neurons form the last connection to close the circuit leading back to the cervical spinal cord and the motor neurons controlling the forelimb musculature.
Tables
Key resources table
| Reagent type (species) or resource | Designation | Source or reference | Identifiers | Additional information |
|---|---|---|---|---|
| Strain, strain background (M. musculus) | Wild-type C57BL/6 | Jackson Laboratory | #000664; RRID:IMSR_JAX:000664 | |
| Strain, strain background (M. musculus) | Scnn1a-Cre or B6;C3-Tg(Scnn1a-cre)3Aibs/J | Jackson Laboratory; (Madisen et al., 2010) | #009613; RRID:IMSR_JAX:009613 | |
| Strain, strain background (M. musculus) | Txl3-Cre or B6.FVB(Cg)-Tg(Tlx3-cre)PL56Gsat/Mmucd | MMRRC; (Gerfen et al., 2013) | #041158-UCD; RRID:MMRRC_041158-UCD | |
| Strain, strain background (M. musculus) | CaMKII-Cre or B6.Cg-Tg(Camk2a-Cre)T29-1Stl/J | Jackson Laboratory; (Tsien et al., 1996) | #005359; RRID:IMSR_JAX:005359 | |
| Strain, strain background (M. musculus) | Ai14 or B6.Cg-Gt(ROSA)26Sortm14(CAG-tdTomato)Hze/J | Jackson Laboratory; (Madisen et al., 2010) | #007914; RRID:IMSR_JAX:007914 | |
| Strain, strain background (M. musculus) | Ai96 or B6J.Cg-Gt(ROSA)26Sortm96(CAG-GCaMP6s)Hze/MwarJ | Jackson Laboratory; (Madisen et al., 2010) | #028866; RRID:IMSR_JAX:028866 | |
| Recombinant DNA reagent | AAV-ChR2-mCherry or AAV1.CamKIIa.hChR2(E123T/T159C).mCherry.WPRE.hGH | Addgene | #35512; RRID:Addgene_35512 | |
| Recombinant DNA reagent | AAV-ChR2-Venus or AAV1.CAG.ChR2-Venus.WPRE.SV40 | Addgene | #35509; RRID:Addgene_35509 | |
| Recombinant DNA reagent | AAV-hSyn-Cre or AAV1.hSyn.Cre.WPRE.hGH | Addgene | #35509; RRID:Addgene_35509 | |
| Recombinant DNA reagent | AAVretro-GFP or AAV-CAG-GFP | Addgene | #37825; RRID:Addgene_37825 | |
| Recombinant DNA reagent | AAVretro-tdTomato or AAV-CAG-tdTomato | Addgene | #59462; RRID:Addgene_59462 | |
| Recombinant DNA reagent | PRV-EGFP or PRV-152 | CNNV; http://www.cnnv.pitt.edu | ||
| Recombinant DNA reagent | PRV-Introvert-GFP | J. Friedman; (Pomeranz et al., 2017) |
Additional files
-
Source data 1
Electrophysiology traces for the recordings shown in Figures 3–6 are provided in a set of Matlab figure files.
- https://cdn.elifesciences.org/articles/66836/elife-66836-data1-v1.zip
-
Transparent reporting form
- https://cdn.elifesciences.org/articles/66836/elife-66836-transrepform-v1.docx
Download links
A two-part list of links to download the article, or parts of the article, in various formats.
Downloads (link to download the article as PDF)
Open citations (links to open the citations from this article in various online reference manager services)
Cite this article (links to download the citations from this article in formats compatible with various reference manager tools)
Circuit organization of the excitatory sensorimotor loop through hand/forelimb S1 and M1
eLife 10:e66836.
https://doi.org/10.7554/eLife.66836


