Rapid spread of a densovirus in a major crop pest following wide-scale adoption of Bt-cotton in China
- The State Key Laboratory for Biology of Plant Disease and Insect Pests, Institute of Plant Protection, Chinese Academy of Agricultural Sciences, China
- Shenzhen Branch, Guangdong Laboratory of Lingnan Modern Agriculture, Genome Analysis Laboratory of the Ministry of Agriculture and Rural Affairs, Agricultural Genomics Institute at Shenzhen, Chinese Academy of Agricultural Sciences, China
- Institute of Plant Protection and Soil Fertility, Hubei Academy of Agricultural Sciences, China
- Tobacco Research Institute, Chinese Academy of Agricultural Sciences, China
- Lancaster Environment Centre, Lancaster University, United Kingdom
- Instituto de Biotecnología, Universidad Nacional Autónoma de México, United States
Figures
Figure 1 with 1 supplement
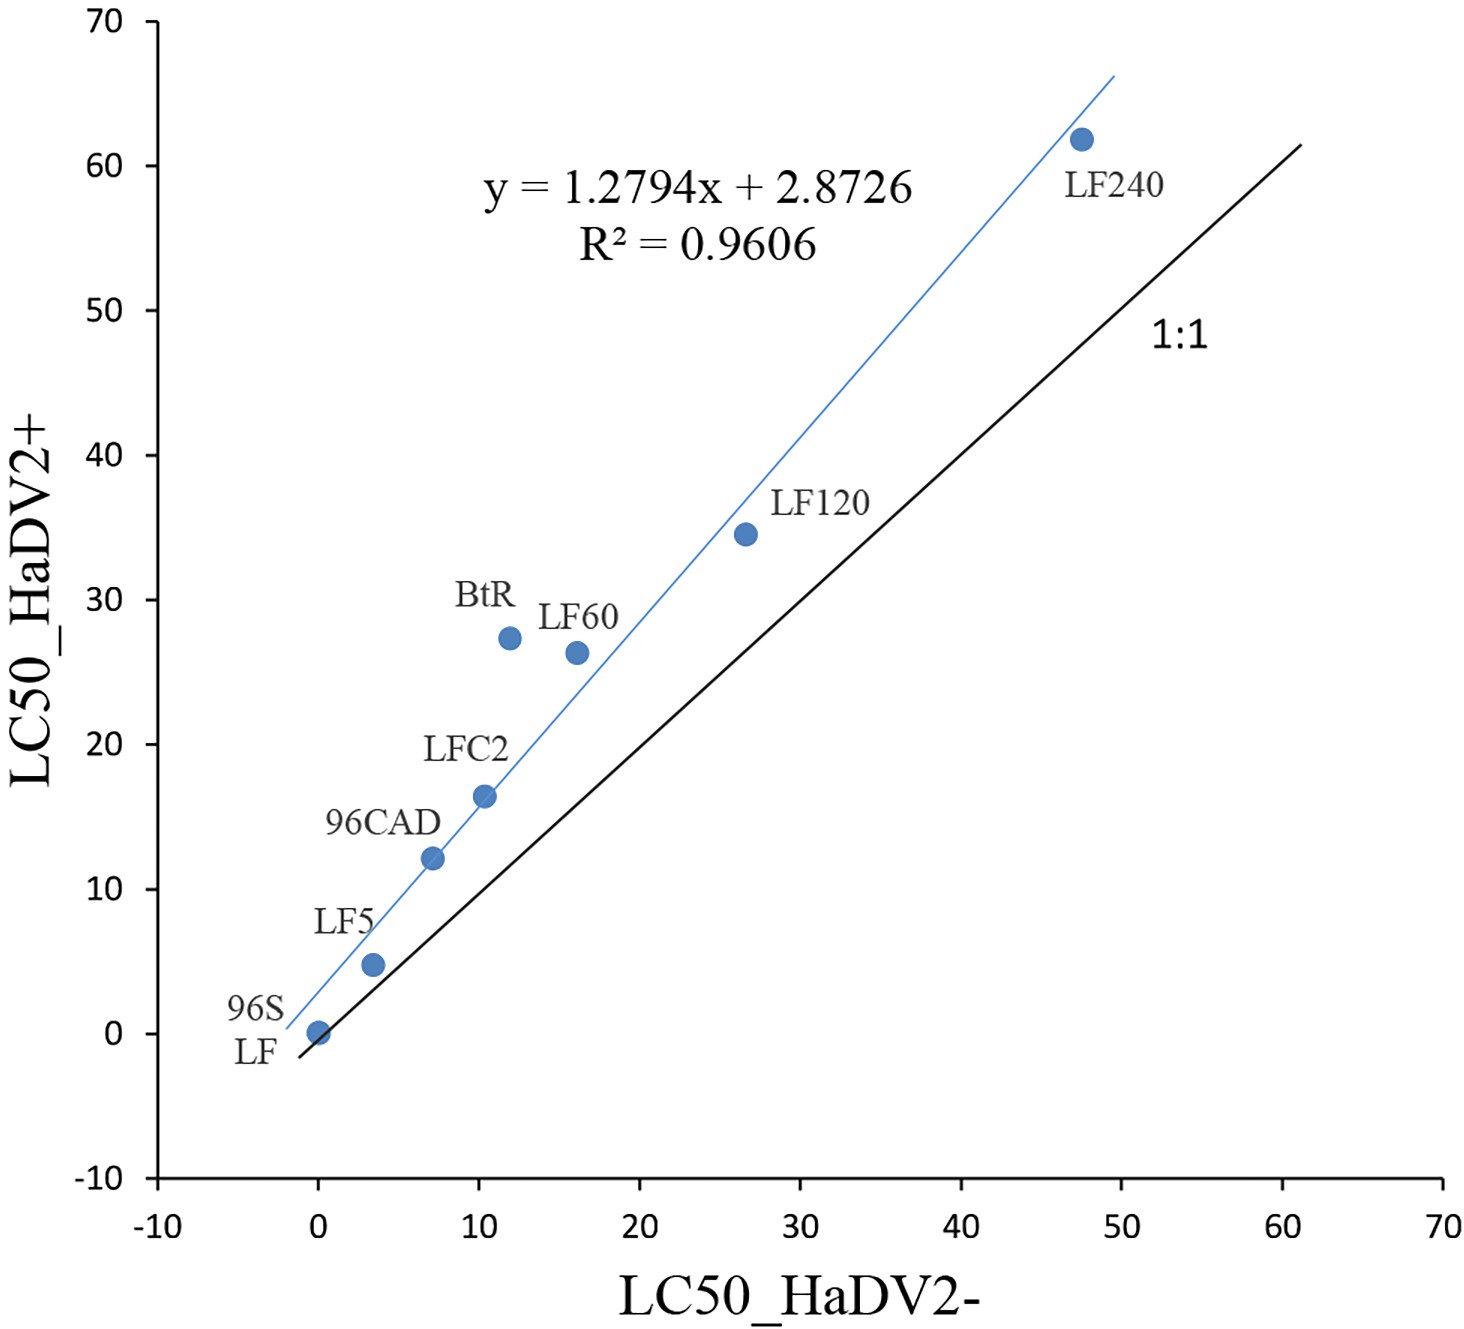
Relationship of different Helicoverpaarmigera strains’ LC50 with or without HaDV2 infection.
The x-axis is the LC50 of different strains (LF, 96S, LF5, LF60, LF120, LF240, LFC2, 96CAD, and BtR) without HaDV2 infection (HaDV2-negative); the y-axis is the LC50 of different strains (LF, 96S, LF5, LF60, LF120, LF240, LFC2, 96CAD, and BtR) with HaDV2 infection (HaDV2-positive). The regression line is described by the following equation: y=1.2794x+2.8726, R²=0.9606, F=11.99, df=1,7 (p<0.0085).
-
Figure 1—source data 1
Source data for Figure 1.
- https://cdn.elifesciences.org/articles/66913/elife-66913-fig1-data1-v2.docx
Figure 1—figure supplement 1
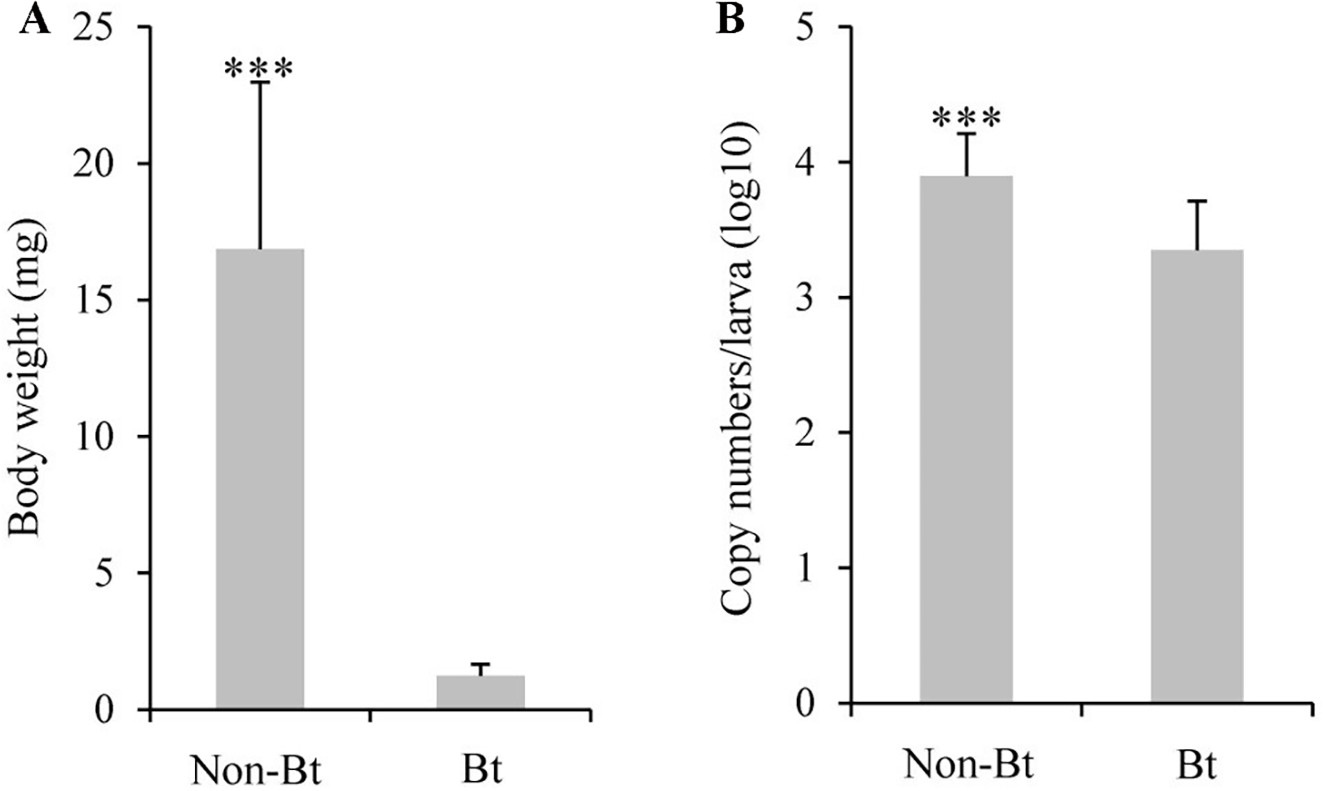
Quantification of HaDV2 in individuals feeding on diet with and without Bt.
(A) The body weight of larvae feeding on diet with and without Bt at 8th day after hatching (t=10.164, df=32, p<0.0001, n=17). (B) The logarithm of HaDV2 copy number to base 10 per larva feeding on diet with and without Bt (t=4.527, df=32, p<0.0001, n=17). ‘***’ stands for p<0.001.
-
Figure 1—figure supplement 1—source data 1
Quantification of HaDV2 in individuals feeding on diet with and without Bt toxin.
- https://cdn.elifesciences.org/articles/66913/elife-66913-fig1-figsupp1-data1-v2.docx
Figure 2
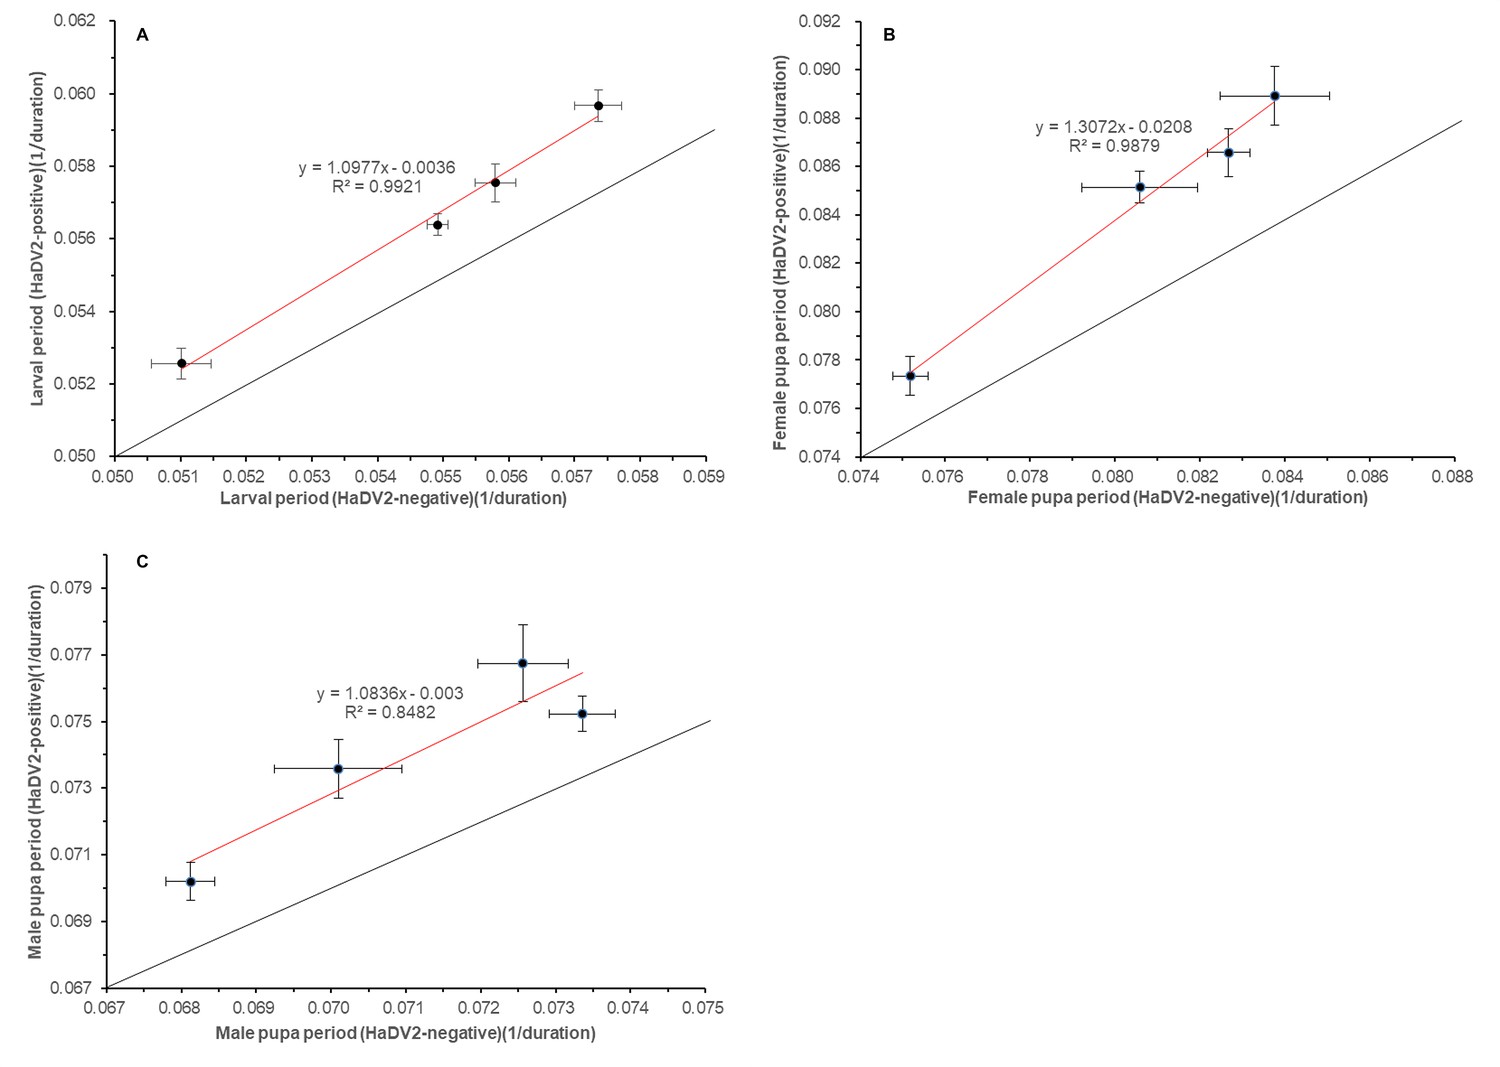
Relationship of different Helicoverpaarmigera strains’ larval (A), and pupal (B,C) with or without HaDV2 infection.
(A) The x-axis is the larval development rate (1/duration) of different strains (LF, LF5, LF60, and LF240) without HaDV2 infection (HaDV2-negative); the y-axis is the larval development rate (1/duration) of different strains (LF, LF5, LF60, and LF240) with HaDV2 infection (HaDV2-positive), y=1.0977x−0.0036, R²=0.9921, F=176.678, df=1.2, p=0.006. (B) The x-axis is the female pupal development rate (1/duration) of different strains (LF, LF5, LF60, and LF240) without HaDV2 infection (HaDV2-negative); the y-axis is the female pupa period (1/duration) of different strains (LF, LF5, LF60, and LF240) with HaDV2 infection (HaDV2-positive), y=1.3072x−0.0208, R²=0.9879, F=125.211, df=1.2, p=0.008. (C) The x-axis is the male pupa period (1/duration) of different strains (LF, LF5, LF60, and LF240) without HaDV2 infection (HaDV2-negative); the y-axis is the male pupa period (1/duration) of different strains (LF, LF5, LF60, and LF240) with HaDV2 infection (HaDV2-positive), y=1.0836x−0.003, R²=0.8482, F=7.581, df=1.2, p=0.110.
-
Figure 2—source data 1
Source data for Figure 2.
- https://cdn.elifesciences.org/articles/66913/elife-66913-fig2-data1-v2.docx
Figure 3 with 1 supplement
Effects of HaDV2 infection on the net reproductive rate (R0) in four Helicoverpaarmigera strains differing in their tolerance to Bt and not exposed to Cry1Ac toxin.
Mean R0 is calculated as the number of female offspring per female that reaches adulthood. The bars are bootstrapped standard errors.
Figure 3—figure supplement 1
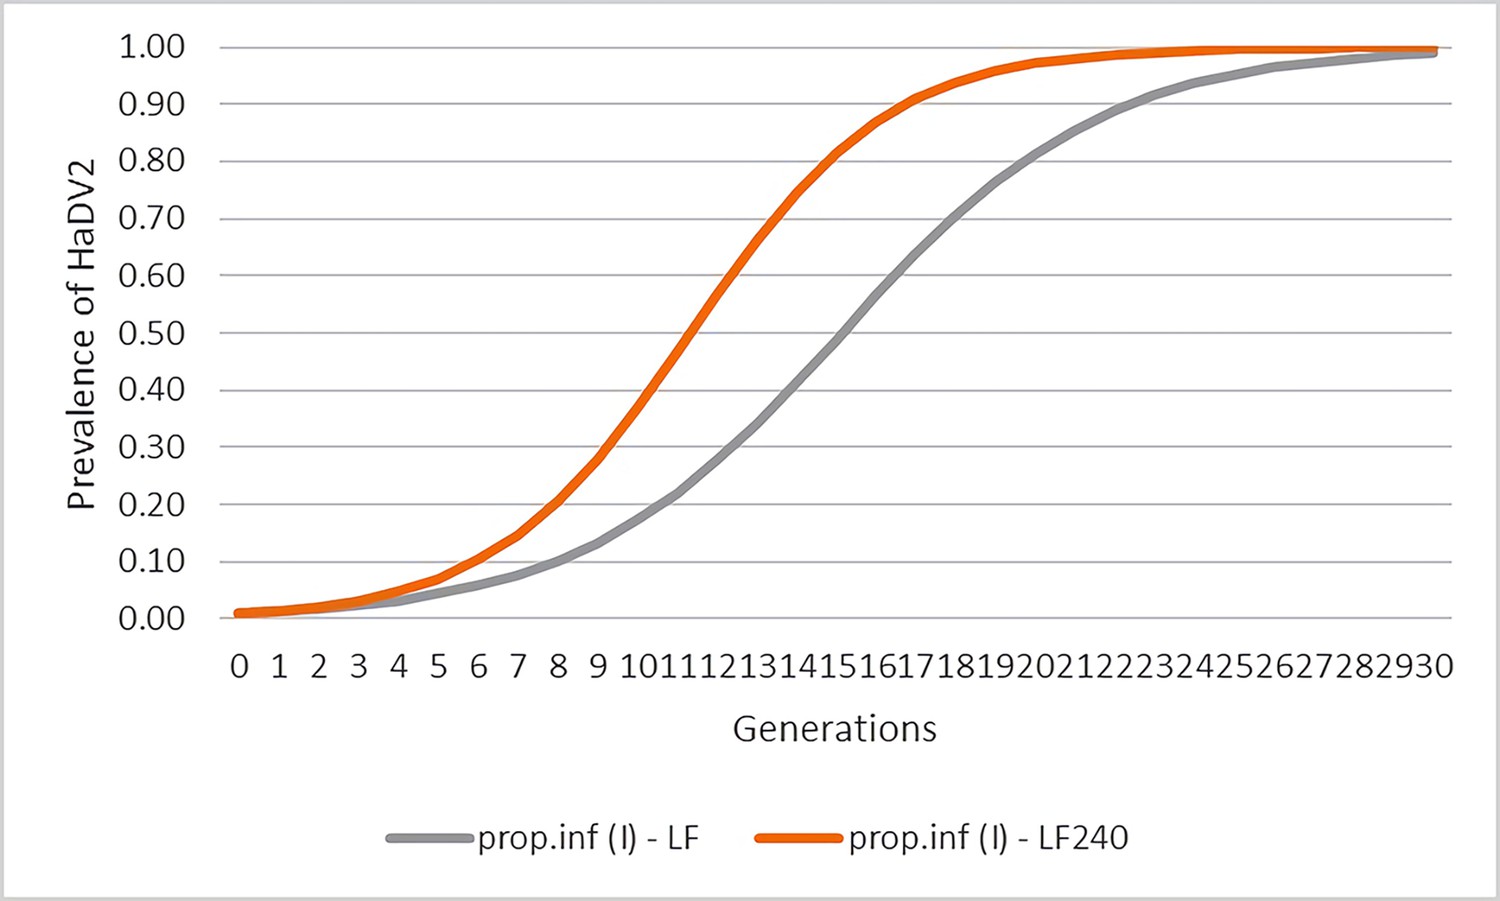
Predicted spread of HaDV2 on Bt-cotton for two strains of Helicoverpaarmigera (LF and LF240).
The model is based on that by Himler et al., 2011, where F=R0(HaDV2−)/R0(HaDV2+), which equals 0.7385 for LF and 0.6667 for LF240. The predicted prevalence of HaDV2 in generation t+1 (It+1) is calculated as follows: It+1=It/{[(1–It)*F]+It}, where It is the proportion of infected H. armigera in generation t and 1–It is the proportion uninfected. The model shows that from a starting frequency of 1%, the prevalence of HaDV2 infection would increase in Bt-cotton-growing areas to >97% after 20 or 27 generations for LF240 or LF strain H. armigera, respectively.
Figure 4
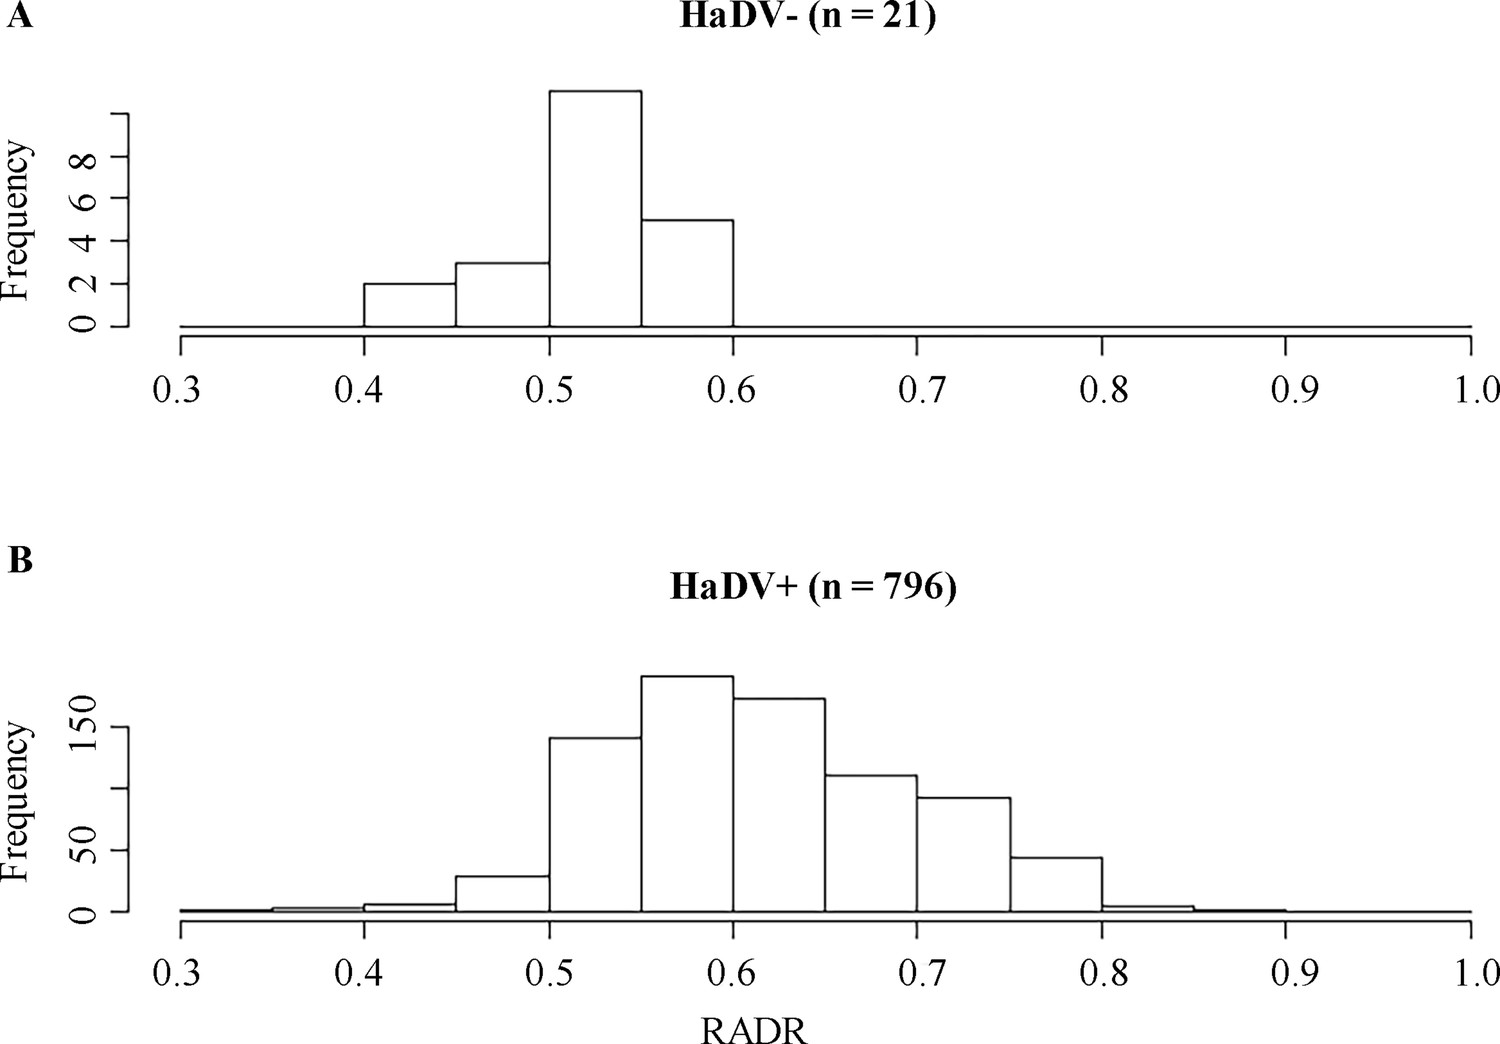
Frequency distributions for RADR scores for HaDV2 positive and negative insects.
The data were collected from field-collected insects from Xiajin and Anci in 2015 and 2016. RADR, relative average development rate.
-
Figure 4—source data 1
Source data for Figure 4.
- https://cdn.elifesciences.org/articles/66913/elife-66913-fig4-data1-v2.xlsx
Figure 5
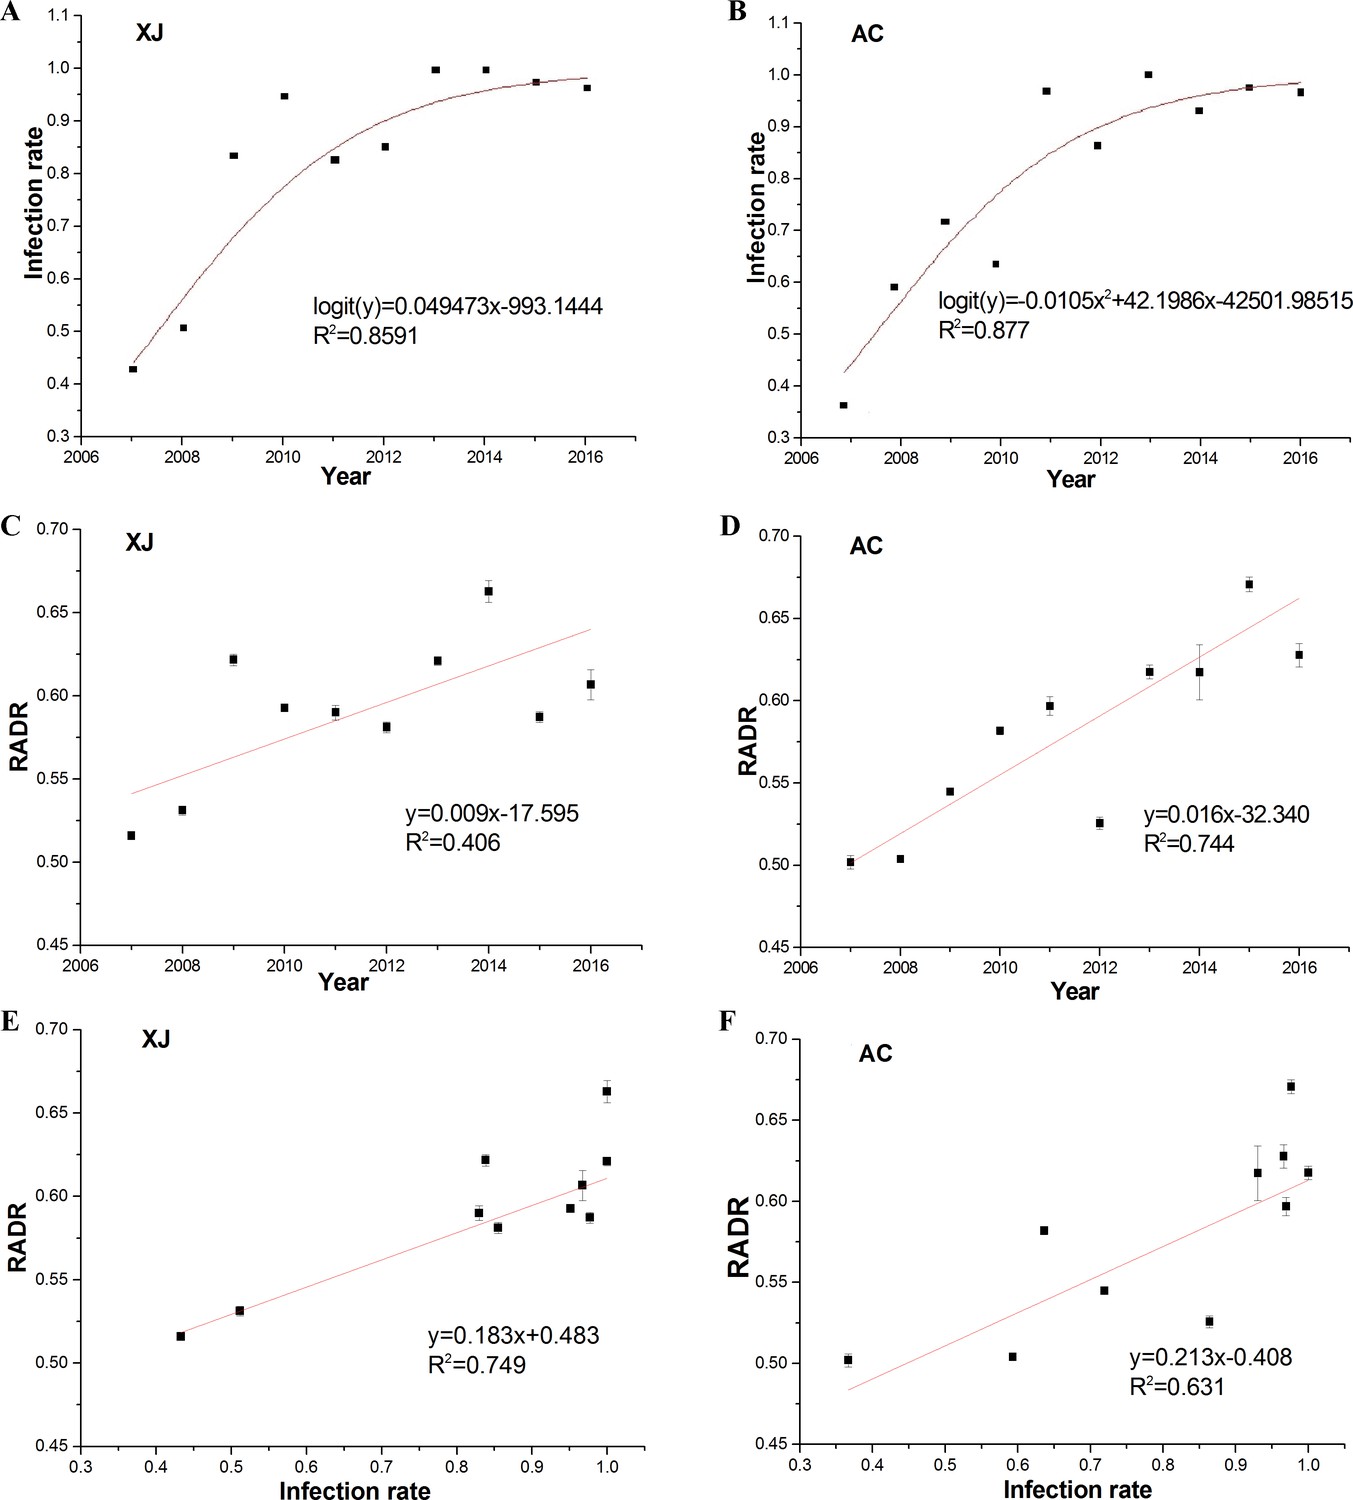
HaDV2 infection rate and RADR dynamics and their relationship for each year in the Xiajin and Anci populations during 2007–2016.
(A) Relation between HaDV2 infection rate of larvae in Xiajin populations and planting year of Bt-cotton. Logistic regression model of HaDV2 infection rate, logit (y) = 0.49473x−993.1444, R²=0.8591, χ2=405.79, df=1, p<0.0001. (B) Relation between HaDV2 infection rate of larvae in Anci populations and planting year of Bt-cotton. Logistic regression model of HaDV2 infection rate, logit (y) = −0.0105x2+42.1986x−42501.98515, R²=0.877, χ2=325.21, df=1, p<0.0001. (C) Relation between RADR of larvae in Xiajin populations and planting year of Bt-cotton. Linear model of RADR, y=0.009x−17.595, R²=0.406, F=5.474, df=1.8, p=0.047. (D) Relation between RADR of larvae in Anci populations and planting year of Bt-cotton. Linear model of RADR, y=0.016x−32.340, R2=0.744, F=23.256, df=1.8, P=0.001. (E) Relationship of larvae RADR in Xiajin population and HaDV2 infection rate during the years 2007–2016, each data point is a different year, in the Linear model of RADR, y=0.183x+0.438, R²=0.749, F=23.826, df=1.9, p=0.001. (F) Relationship of larvae RADR in Anci populations and HaDV2 infection rate during the years 2007–2016, each data point is a different year, in the Linear model of RADR, y=0.213+0.408, R²=0.625, F=13.676, df=1.9, p=0.006. The bars are the standard error of the mean RADR for the field-derived strains tested in each year. RADR, relative average development rate.
-
Figure 5—source data 1
Source data for Figure 5.
- https://cdn.elifesciences.org/articles/66913/elife-66913-fig5-data1-v2.docx
Figure 6 with 2 supplements
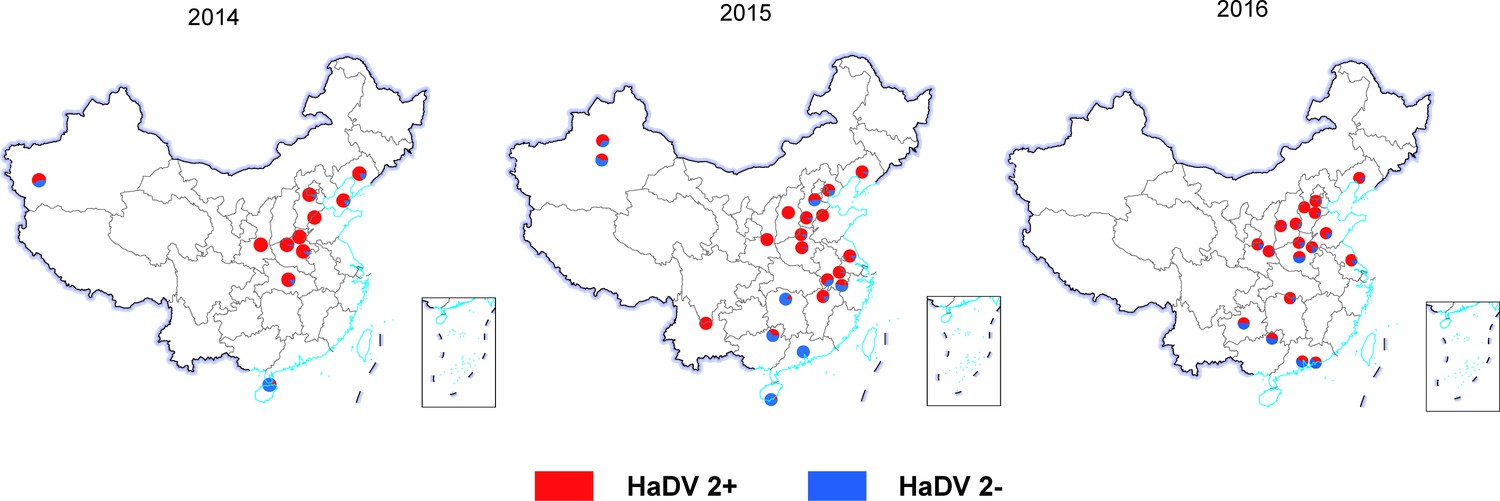
Distribution of HaDV2 in Helicoverpaarmigera from different populations.
The red proportion of circles refers to infected individuals, and the blue refers to non-infected individuals. There are significant differences in HaDV2 infection rates between the 29 Bt-cotton planting points and 7 non-Bt-cotton planting points (code: 12, 29, 30, 31, 32, 49, and 50). The sample information was summarized in Supplementary file 1g.
Figure 6—figure supplement 1
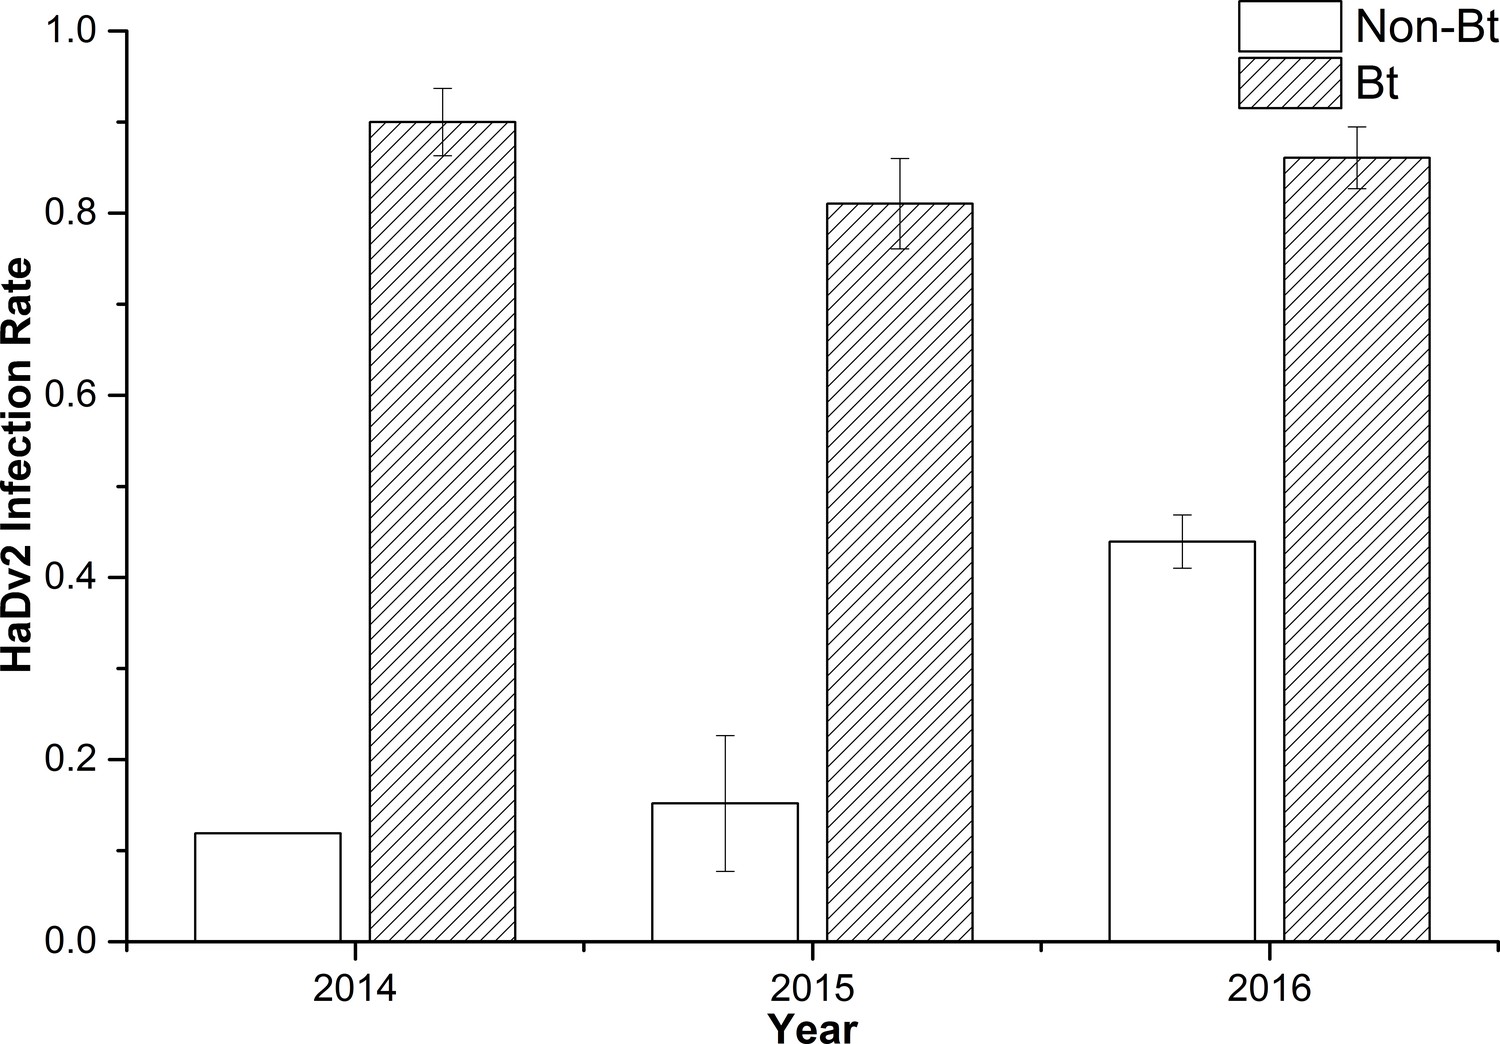
The infection rate of HaDV2 in Bt-cotton and non-Bt-cotton planting areas from 2014 to 2016 (means± SE).
The detailed information is summarized in Supplementary file 1g.
Figure 6—figure supplement 2
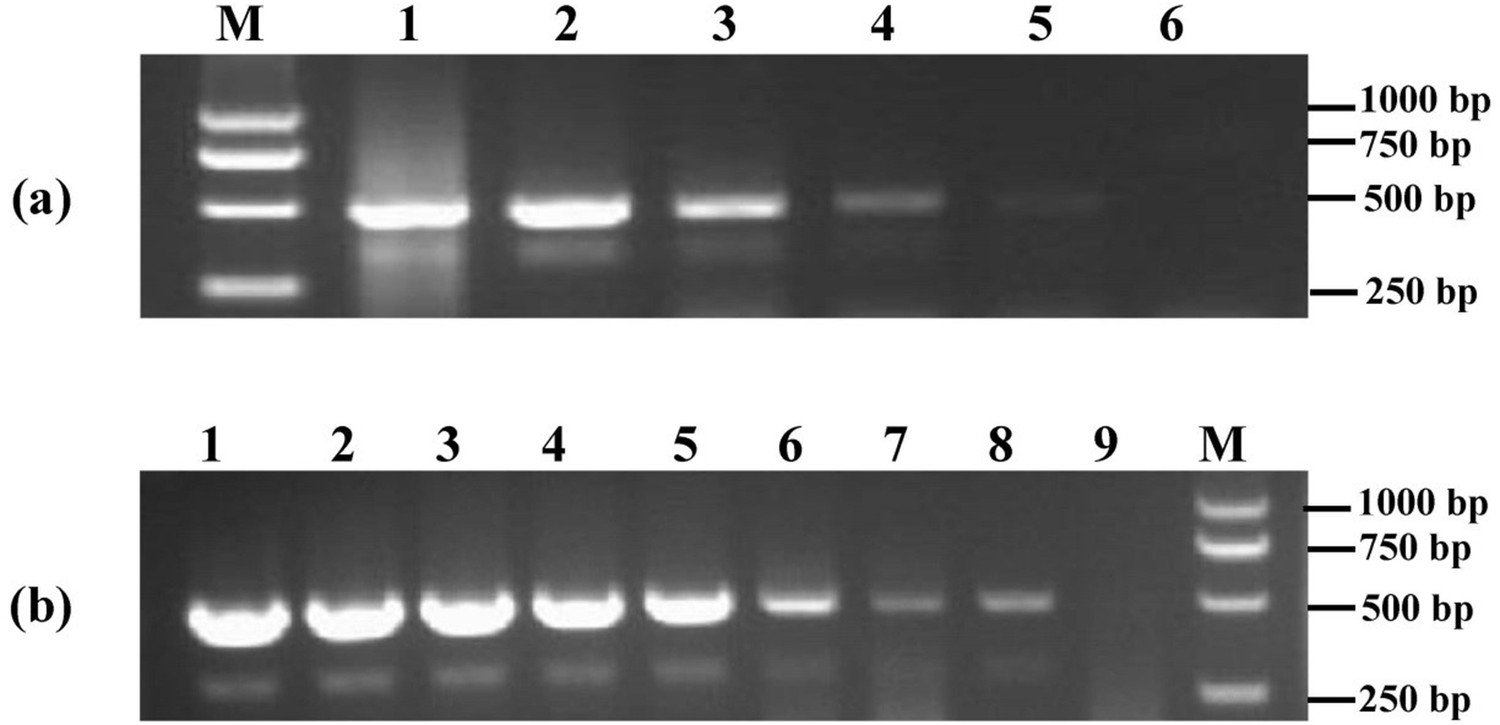
The detection limit of HaDV2 with PCR method.
(a) DNA from HaDV2 positive individual as template. M=Marker, 1=1324.9 ng/µL, 2=132.49 ng/µL, 3=13.249 ng/µL, 4=1.3249 ng/µL, 5=0.13249 ng/µL, and 6=0.013249 ng/µL. (b) Plasmids as template. M=Marker, 1=3 ng/µL (6.185×10⁸ copies/µL), 2=3×10⁻¹ ng/µL (6.185×10⁷ copies/µL), 3=3×10⁻² ng/µL (6.185×10⁶ copies/µL), 4=3×10⁻³ ng/µL (6.185×10⁵ copies/µL), 5=3×10⁻⁴ ng/µL (6.185×10⁴ copies/µL), 6=3×10⁻⁵ ng/µL (6.185×10³ copies/µL), 7=3×10⁻⁶ ng/µL (6.185×10² copies/µL), 8=3×10⁻⁷ ng/µL (61.85 copies/µL), and 9=3×10⁻⁸ ng/µL (6.185 copies/µL).
Figure 7

HaDV2 infection rate has increased significantly since Bt-cotton was first introduced and was positively related to the Bt adoption in all cotton areas.
(A) Temporal changes in the infection rate of HaDV2 since the introduction of Bt-cotton. (B) Changes in the infection rate of HaDV2 according to the proportion of Bt-cotton in all cotton. Each symbol represents an individual province sampled for densovirus over three years (2014–2016); the mean virus prevalence (± standard error) over those 3 years is shown. Symbol size reflects sampling effort and represents data from >1500 insects. Circles represent the 12 provinces where Bt-cotton is grown; squares are the 4 provinces where Bt-cotton is not grown. The solid line represents the logistic regression (± standard error, shaded zone) describing the relationship between virus prevalence and years since the introduction of Bt-cotton to a province for the 12 Bt-cotton-growing provinces only. The dashed line extrapolates this regression line to Year 0. The detailed information is summarized in supplementary file 1g and Figure 6—figure supplement 1.
Figure 8 with 1 supplement
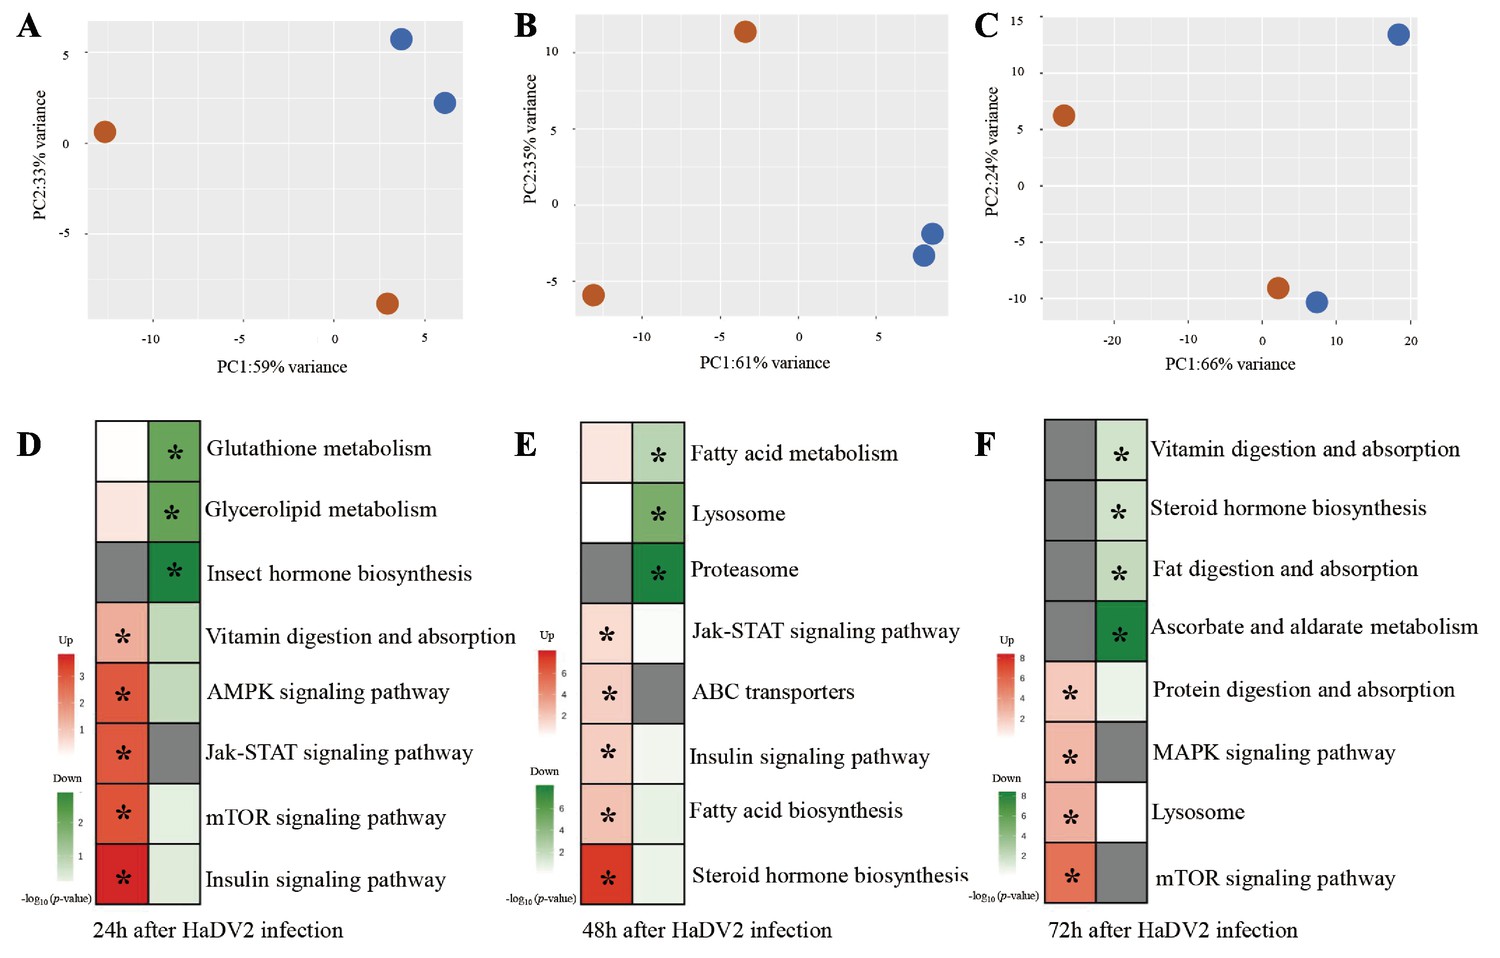
Transcriptome analysis of HaDV2-positive individuals compared to related HaDV2-negative individuals (HaDV2+ vs.HaDV2−) of Helicoverpaarmigera.
(A–C) PCA of global gene expression of DEGs at 24 (A), 48 (B), and 72 hr (C) after HaDV2 inoculation. Blue stands for HaDV2-positive samples and red stands for HaDV2-negative samples. (D–F) Heatmaps of –log10 p-values of KEGG pathways representing the upregulated and downregulated DEGs at 24 (D), 48 (E), and 72 hr (F). ‘*’ indicates the significantly enriched pathways (p<0.05). Red color shows upregulation pathways, green color shows downregulation pathways, gray color shows no value, the redder/greener the color, the lower p-values. DEG, differentially expressed gene; PCA, principal component analysis.
Figure 8—figure supplement 1
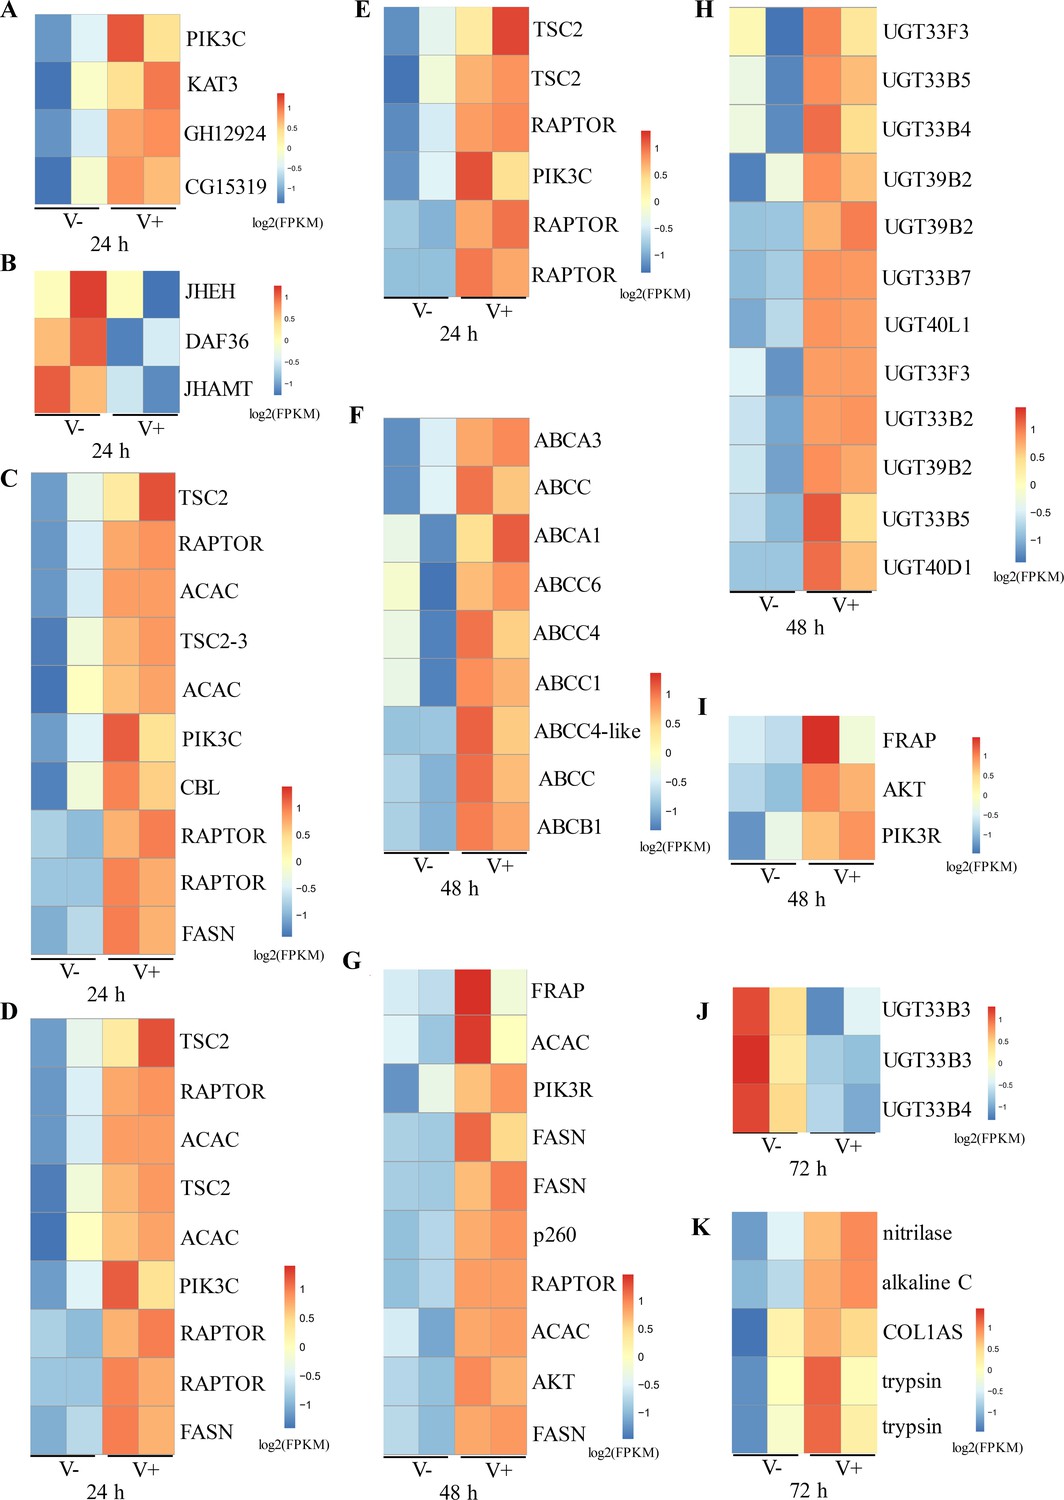
Heatmaps of DEGs related to the expression of significantly enriched pathways of Helicoverpa armigera at 24, 48, and 72 hr.
The quantity of DEGs with log2(FPKM) related to the expression of the Jak-STAT signaling pathway at 24 hr (A) and 48 hr (i); the insect hormone biosynthesis pathway at 24 hr (B); the insulin signaling pathway at 24 hr (C) and 48 hr (G); the AMPK signaling pathway at 24 hr (D); the mTOR signaling pathway at 24 hr (E); the ABC transporters at 48 hr (F); the steroid hormone biosynthesis pathway at 48 hr (H) and 72 hr (J); the protein digestion and absorption pathway at 72 hr (K). V−=HaDV2-negative individuals, V+=HaDV2-positive individuals. Colors in log2(FPKM) indicate the gene expression levels, the hotter (redder) the color, the higher the gene expression level. The two columns in V− and V+ represent two replications.
Figure 9

Transcriptome analysis of Helicoverpa armigera after HaDV2 infection and Cry1Ac exposure.
The quantity of DEGs with log2(FPKM) related to the expression of (A) the ABC transporters; (B) trypsin; (C) Bt receptors and carboxylesterase genes; (D) the MAPK signaling pathway; (E) the drug metabolism pathways. DV−=HaDV2-negative individuals, DV+=HaDV2-positive individuals. Bt−=larvae were fed on the artificial diet without Cry1Ac, Bt+=larvae were fed on the artificial diet containing 1 µg/mL Cry1Ac. Colors in log2(FPKM) indicate the gene expression levels, the hotter (redder) the color, the higher the gene expression level. The three columns represent three biological replicates. DEG, differentially expressed gene; MAPK, mitogen-activated protein kinase.
Tables
Key resources table
| Reagent type (species) or resource | Designation | Source or reference | Identifiers | Additional information |
|---|---|---|---|---|
| Strain, strain background (Helicoverpa armigera) | LF | Collected from Langfang, Hebei Province, in 1998 | See Materials and methods, Laboratory strains | |
| Strain, strain background (H. armigera) | 96S | Collected from Xinxiang, Henan Province, in 1996, | See Materials and methods, Laboratory strains | |
| Strain, strain background (H. armigera) | BtR | Cry1Ac-resistant strains selected from the susceptible strain on artificial diets | See Materials and methods, Laboratory strains | |
| Strain, strain background (H. armigera) | 96CAD | Cry1Ac-resistant strains (with a cadherin mutation) selected from the susceptible strain on artificial diets | See Materials and methods, Laboratory strains | |
| Strain, strain background (H. armigera) | LFC2 | Cry1Ac-resistant strains (with an ABCC2 mutation) selected from the susceptible strain on artificial diets | See Materials and methods, Laboratory strains | |
| Strain, strain background (H. armigera) | LF5 | Cry1Ac-resistant strains selected from the susceptible strain on artificial diets | See Materials and methods, Laboratory strains | |
| Strain, strain background (H. armigera) | LF30 | Cry1Ac-resistant strains selected from the susceptible strain on artificial diets | See Materials and methods, Laboratory strains | |
| Strain, strain background (H. armigera) | LF60 | Cry1Ac-resistant strains selected from the susceptible strain on artificial diets | See Materials and methods, Laboratory strains | |
| Strain, strain background (H. armigera) | LF120 | Cry1Ac-resistant strains selected from the susceptible strain on artificial diets | See Materials and methods, Laboratory strains | |
| Strain, strain background (H. armigera) | LF240 | Cry1Ac-resistant strains selected from the susceptible strain on artificial diets | See Materials and methods, Laboratory strains | |
| Strain, strain background (H. armigera) | Adult female bollworm moths | Collected from field | See Materials and methods, Collection of field strains | |
| Biological sample (Helicoverpa armigera densovirus-1) | HaDV2 | (Xu et al., 2014) DOI: 10.1371/journal.ppat.1004490 | See Materials and methods, HaDV2 preparation | |
| Recombinant DNA reagent | pEASY-T1 cloning vector | TransGen, Beijing, China | See Materials and methods, Detection of HaDV2 in wild populations of H. armigera | |
| Sequence-based reagent | HaDV-F | (Xu et al., 2014) DOI: 10.1371/journal.ppat.1004490 | GGATTGGCCTGGGAAATGAC | |
| Sequence-based reagent | HaDV-R | (Xu et al., 2014) DOI: 10.1371/journal.ppat.1004490 | CGTTGTTTTTATATCCGAGG | |
| Chemical compound, drug | Cry1Ac | Dow AgroSciences (Indianapolis, IN) | See Materials and methods, Bt toxins | |
| Software, algorithm | POLO Plus LeOra Software | POLO Plus LeOra Software, Berkeley | Probit analysis | |
| Software, algorithm | BLASTx | BLASTx | RRID:SCR_004870 | |
| Software, algorithm | Bowtie | Bowtie – 0.12.7 | RRID:SCR_005476 | |
| Software, algorithm | RSEM | RSEM – v1.1.17 | RRID:SCR_013027 | |
| Software, algorithm | DEseq2 | DEseq2 | RRID:SCR_015687 | |
| Software, algorithm | SPSS | SPSS | RRID:SCR_002865 | |
| Software, algorithm | RADR | (An et al., 2015) Doi: org/10.1002/ps.3807 | The relative average development rates |
Additional files
-
Supplementary file 1
Supplementary tables.
(a) Bt toxin sensitivity test of different Helicoverpa armigera strains with or without HaDV2 infection. (b) Mortality changes with Bt toxin concentration test of different H. armigera strains with or without HaDV2 infection. (c) Comparing the effects of HaDV2 on fitness components of LF, LF5, LF60, and LF240. LF is susceptible strain; LF5, LF60, and LF240 are Bt resistant strains selected with LF strain. Significant differences (ANOVA followed by Tukey’s HSD test) between each strain with or without HaDV2 infestation are indicated by different letters (p<0.05). Insects were reared on artificial non-Bt-diet. D+ stand for infected by HaDV2, D− stand for non-infected by HaDV2. (1–5) means the survival rate from the first star to the 5th star; 5 p: from the 5th star to pupa; Proportion FA: the rate of female divided male. (d) Analysis of variance for fitness parameters of 4 cotton bollworm strains (LF, LF5, LF60, and LF240). (e) Fitness of the susceptible and resistant strains on Bt- and non-Bt-cotton infected with or without HaDV2. (f) Analysis of variance for weight of cotton bollworm larvae. (g) Sample information and infection rates of HaDV2 in the field populations of H. armigera. See Figure 6 for a map of locations. X: east longitude, Y: northern latitude. (h) Host information and accessions for samples.
- https://cdn.elifesciences.org/articles/66913/elife-66913-supp1-v2.docx
-
Transparent reporting form
- https://cdn.elifesciences.org/articles/66913/elife-66913-transrepform-v2.docx
Download links
A two-part list of links to download the article, or parts of the article, in various formats.
Downloads (link to download the article as PDF)
Open citations (links to open the citations from this article in various online reference manager services)
Cite this article (links to download the citations from this article in formats compatible with various reference manager tools)
Rapid spread of a densovirus in a major crop pest following wide-scale adoption of Bt-cotton in China
eLife 10:e66913.
https://doi.org/10.7554/eLife.66913


