Somatostatin interneurons activated by 5-HT2A receptor suppress slow oscillations in medial entorhinal cortex
- Charité–Universitätsmedizin Berlin, corporate member of Freie Universität Berlin, Humboldt-Universität zu Berlin, and Berlin Institute of Health; Neuroscience Research Center, Germany
- Charité–Universitätsmedizin Berlin, corporate member of Freie Universität Berlin, Humboldt-Universität zu Berlin, and Berlin Institute of Health; Cluster of Excellence NeuroCure, Germany
- German Centre for Neurodegenerative Diseases (DZNE), Germany
- Charité–Universitätsmedizin Berlin, corporate member of Freie Universität Berlin, Humboldt-Universität zu Berlin, and Berlin Institute of Health; Department of Experimental Neurology, Germany
- Charité–Universitätsmedizin Berlin, corporate member of Freie Universität Berlin, Humboldt-Universität zu Berlin, and Berlin Institute of Health; Center for Stroke Research Berlin, Germany
- Charité–Universitätsmedizin Berlin, corporate member of Freie Universität Berlin, Humboldt-Universität zu Berlin, and Berlin Institute of Health; Einstein Center for Neurosciences Berlin, Germany
Figures
Figure 1 with 3 supplements
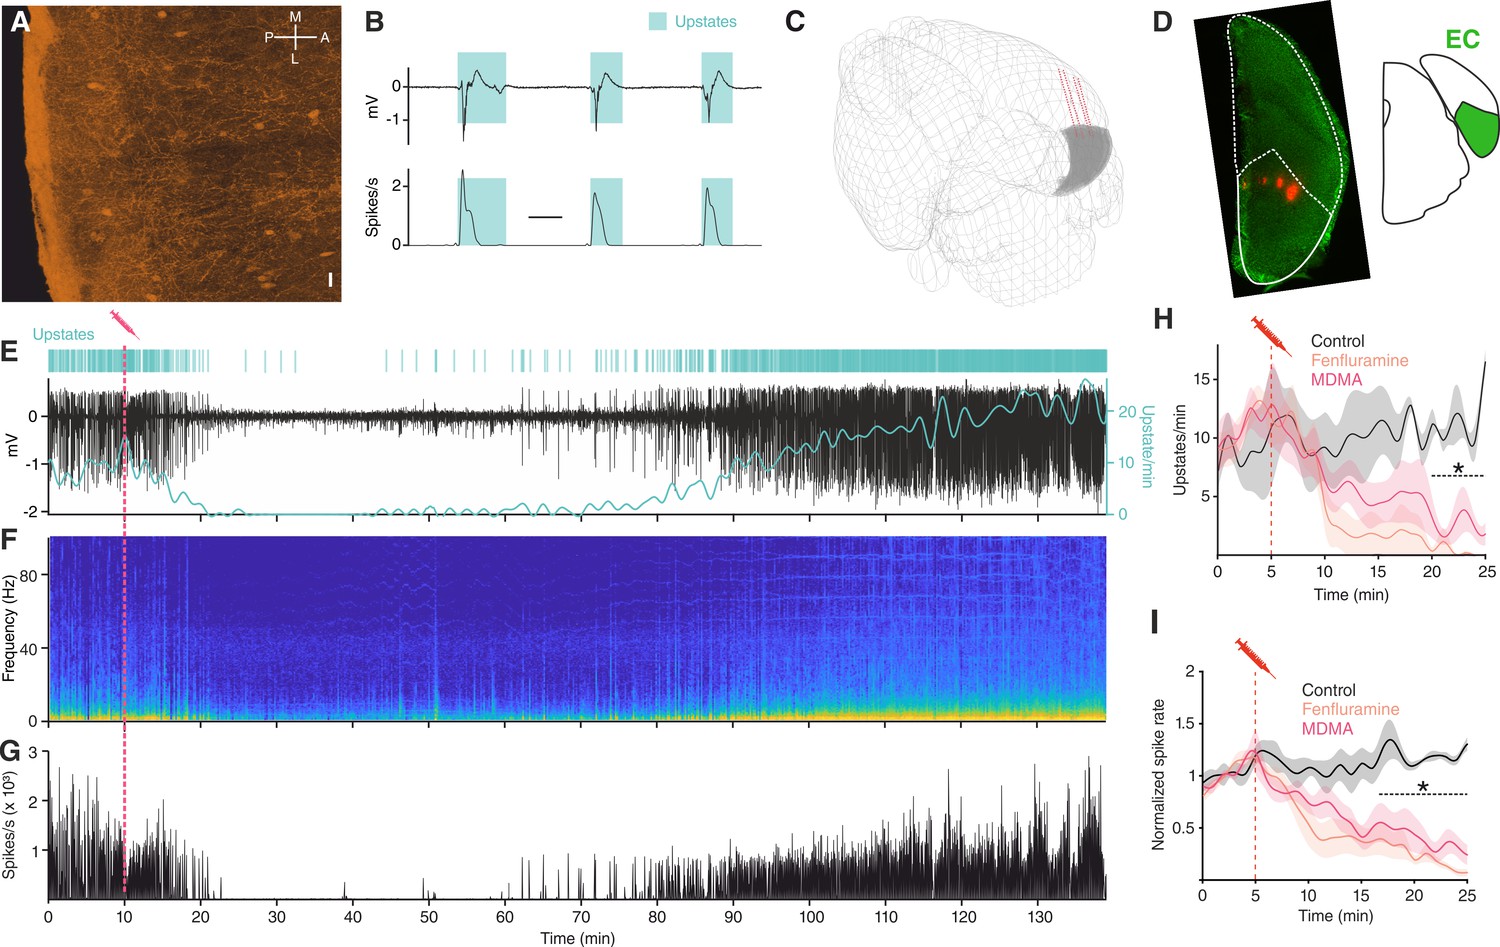
MDMA/Fen inhibit SOs in anesthetized mice.
(A) Immunocytochemical analysis of an ePet-YFP mouse showing serotonergic fibers in medial entorhinal cortex, horizontal slice (M = medial, L = lateral, P = posterior, A = anterior). Scale bar: 20 µm. (B) LFP (top) and instantaneous population activity (bottom) of a representative in vivo recording during SOs (spikes/s units in thousands), cyan rectangles represent detected upstates. (C) 3D visualization of the microelectrode location of the recording shown in E. EC represented in gray. (D) Left: microelectrode tracks (red) of the recording shown in (E). Right: EC position represented in green. (E) Top: Cyan lines represent detected upstates. Bottom: LFP (black) and average upstate incidence per minute (cyan). Pink dotted line represents MDMA application time. (F) Fourier transformation and (G) instantaneous population activity for the recording shown in E. (H) Mean upstate incidence after saline (control), Fen or MDMA application (control: n = 5, Fen: n = 6, MDMA: n = 7; p<10−4, unpaired t test with Holm-Šidák correction). (I) Mean normalized spike rate after saline (control), Fen or MDMA application (control: n = 5, Fen: n = 6, MDMA: n = 7; p<10−4, unpaired t test with Holm-Šidák correction).
Figure 1—figure supplement 1
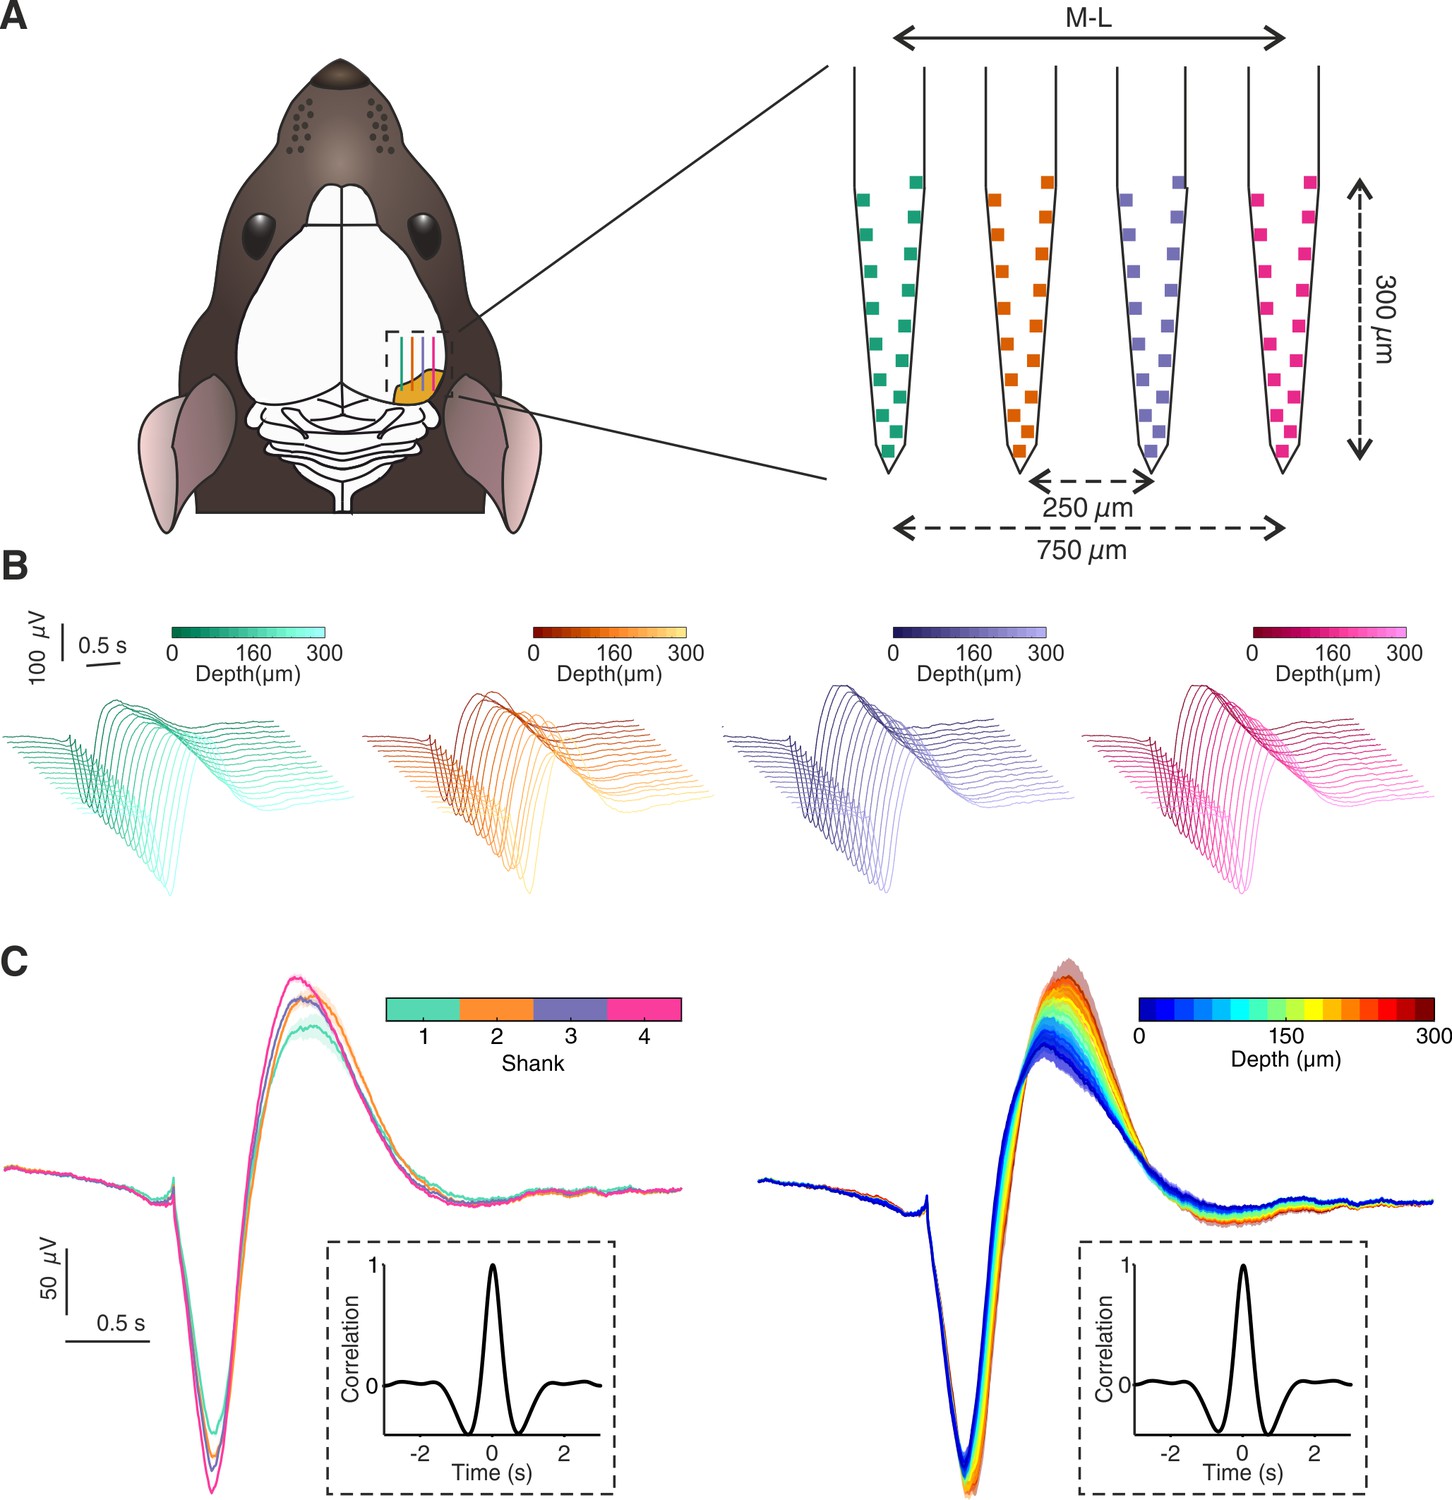
In vivo upstate spatial features.
(A) Microelectrode implant location and microelectrode features. Sixty-four channels (nanimals = 15, nshanks = 4) and 32 channels (nanimals = 3, nshanks = 2) microelectrodes were used in this study, analysis shown in this figure excludes data recorded with 32 channels probe due to the different spatial configuration of the channels. (B) Average upstate voltage deflection for each channel of the microelectrode. For experiments with drug application (either MDMA or Fen), only baseline upstates were taken in account. (C) Left: Average upstate voltage deflection grouped by shank. Right: Average upstate voltage deflection grouped by depths (right). Insets show the normalized correlation between averages in the two different groups.
Figure 1—figure supplement 2

LFP power analysis for saline and MDMA/Fen injection.
(A) Average normalized LFP power during baseline and saline injection. (B) Average LFP power during baseline and MDMA/Fen injection. (C) Box plots of normalized LFP power per frequency band: delta (Control: 0.98 ± 0.01, MDMA/Fen: 0.82 ± 0.04, p=0.019, Mann-Whitney test), theta (Control: 0.90 ± 0.01 µV, MDMA/Fen: 0.76 ± 0.04, p=0.046, Mann-Whitney test), alpha (Control: 0.77 ± 0.01, MDMA/ Fen: 0.45 ± 0.03, p>0.05, Mann-Whitney test), beta(Control: 0.49 ± 0.02, MDMA/ Fen: 0.30 ± 0.03, p>0.05, Mann-Whitney test), and gamma (Control: 0.28 ± 0.02, MDMA/ Fen: 0.25 ± 0.02, p>0.5, Mann-Whitney test).
Figure 1—figure supplement 3
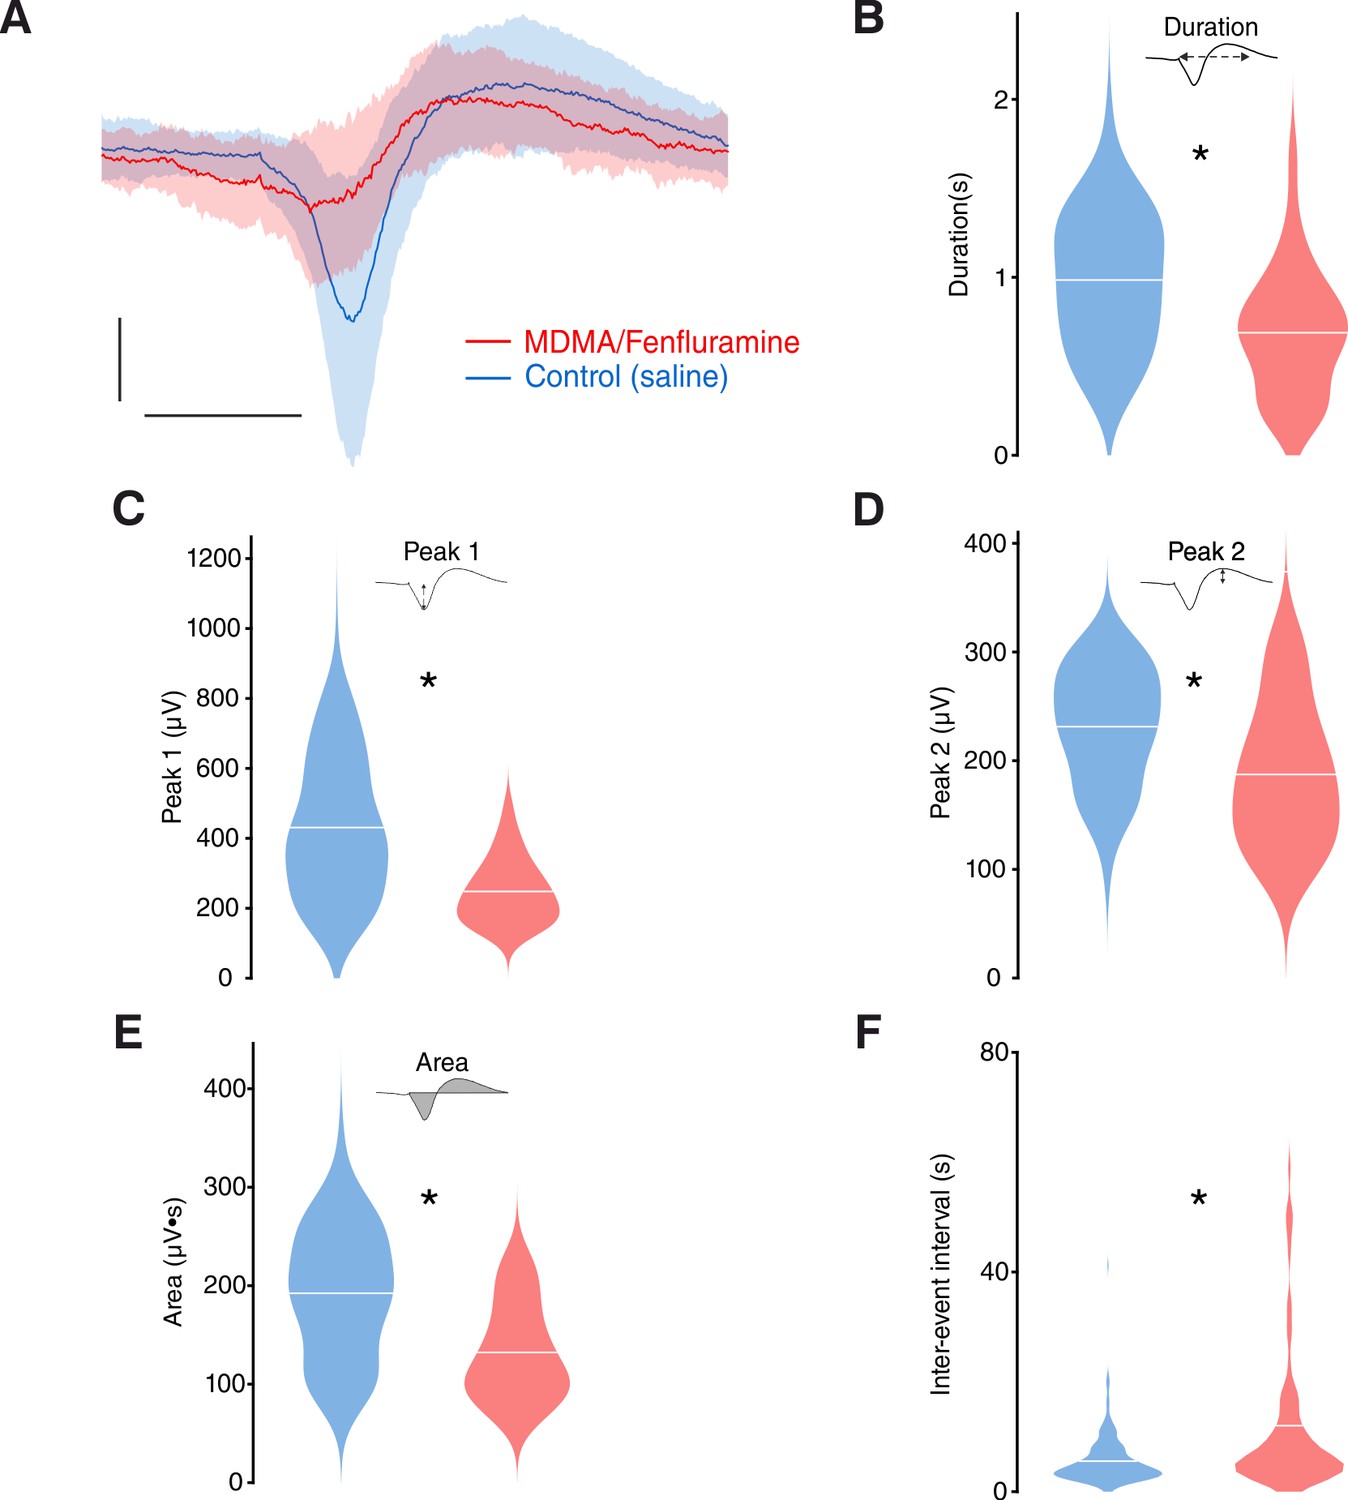
In vivo upstate metrics for saline and MDMA/Fen injection.
(A) Average upstate voltage deflection for control and MDMA/Fen, patches represent one standard deviation. Scale bars: 0.5 s, 200 µV. (B) Violin plots of duration (control: 0.98 ± 0.02 s, MDMA/ Fen: 0.69 ± 0.04 s, p<0.001, Mann-Whitney test). (C) Violin plots of peak one amplitude (control: 434.3 ± 13.09 µV, MDMA/Fen: 248.1 ± 10.49 µV, p<0.001, Mann-Whitney test). (D) Violin plots of peak two amplitude (control: 232.4 ± 3.53 µV, MDMA/ Fen: 187.3 ± 7.40 µV, p<0.001, Mann-Whitney test). (E) Violin plots of area (control: 185.6 ± 4.14 µV•s, MDMA/ Fen: 187.3 ± 7.40 µV, p<0.001, Mann-Whitney test). (F) Violin plots of inter-event intervals (control: 5.55 ± 0.26 s, MDMA/ Fen: 12.02 ± 1.75 2, p<0.001, Mann-Whitney test).
Figure 2 with 2 supplements
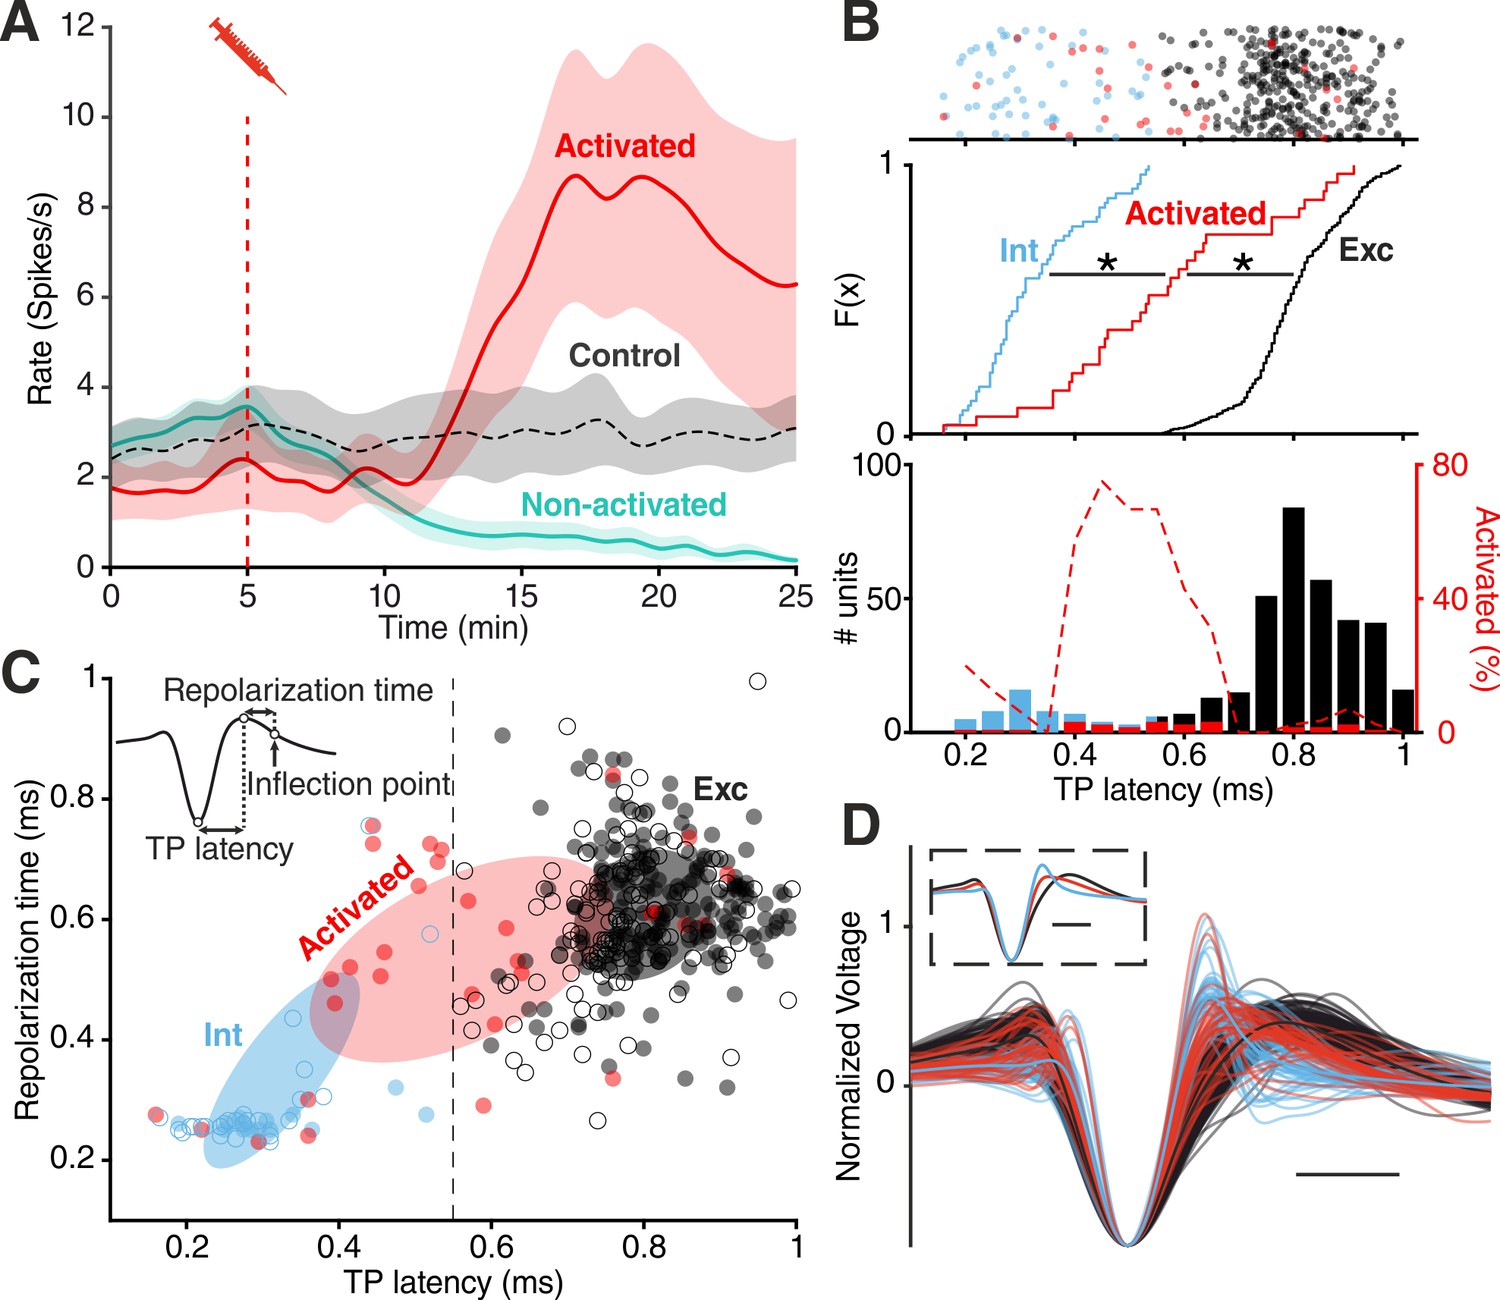
Divergent unit responses to MDMA/Fen application.
(A) Spike rate of the activated units versus all the other units during MDMA/Fen application (activated: n = 31, Non-activated: n = 324). (B) Top: TP latencies color-coded by group. Middle: cumulative distribution of TP latencies (Kolmogorov-Smirnov test, p Activated vs Int <10–4, p Activated vs Exc <10–4). Bottom: bar plot representing probability distribution of TP latencies, on the right y axis dashed line representing the percentage of ‘activated’ units per TP latency bin. (C) Distribution of units according to trough-to-peak (TP) latencies and repolarization time. Units were classified as putative interneurons (Int, blue) and putative excitatory neurons (Exc, dark gray) according to a threshold at 0.55 ms; activated units (red) could belong to either group but were mostly intermediate as shown by the covariance (2 STD) of each group (Ellipses). Units recorded during control experiments are represented by empty circles. (D) Waveforms of recorded units (n = 355). Units were divided into ‘putative excitatory’ (black) and ‘putative inhibitory’ (blue) neurons according to TP latencies. Units activated by either MDMA or Fen application are represented in red. Inset shows the average waveform for each group. Scale bars: 0.5 ms.
-
Figure 2—source data 1
Source data for Figure 2A.
- https://cdn.elifesciences.org/articles/66960/elife-66960-fig2-data1-v2.xlsx
Figure 2—figure supplement 1
Cross-correlogram (CCG) based connectivity analysis.
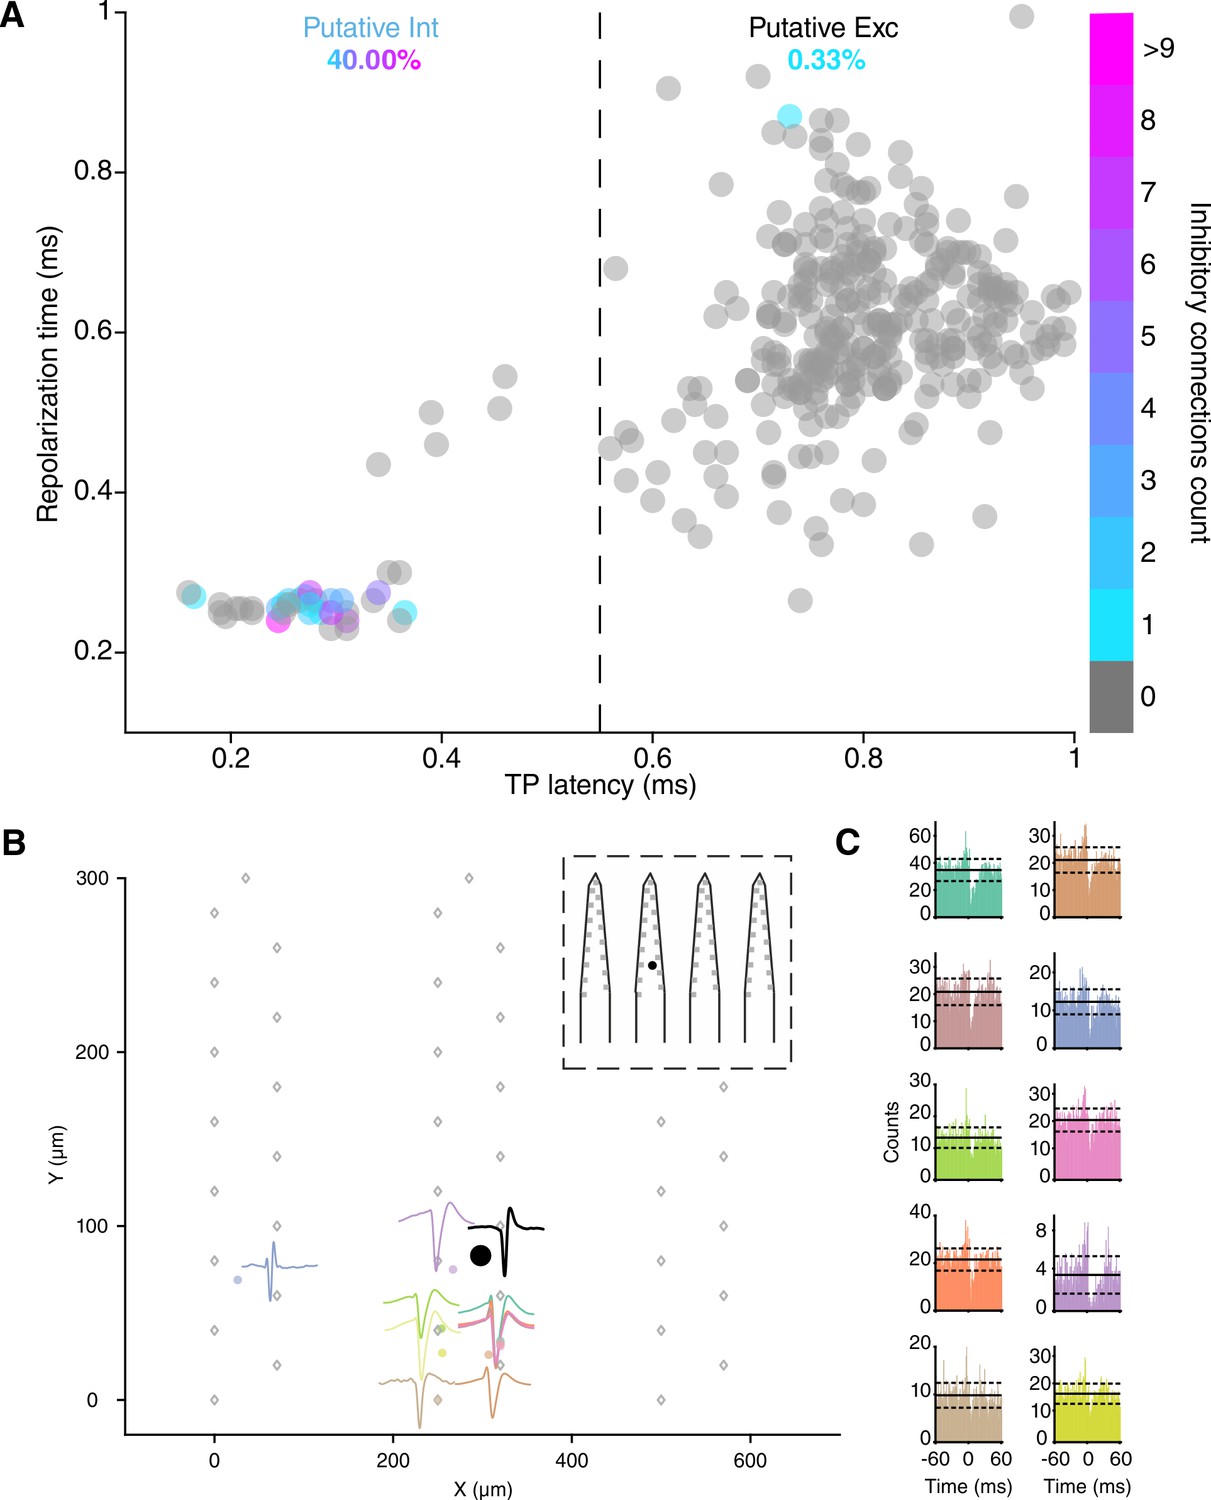
(A) Units are plotted according to TP latencies and repolarization time and color-coded according to the number of inhibitory connections detected. Units displaying a TP latency <0.55 ms were classified as putative inhibitory interneurons (‘Putative int’), the remaining units were classified as putative excitatory neurons (‘Putative exc’). Inhibitory connections were detected using Total Spiking Probability Edges (TSPE) (see Supplementary materials). Putative interneurons had a 40.0% chance of displaying at least one inhibitory connection in the CCGs with an average number of 3.38 ± 0.68 inhibitory connections while putative excitatory cells had a 0.33% chance of displaying inhibitory connections. Units with a spiking rate lower than 0.3 spikes/s were discarded from the analysis. Units from control experiments are included in the analysis. (B) Connectivity scheme of one putative inhibitory unit (source unit, black circle) displaying 10 inhibitory connections with surrounding clusters. Gray rhombi represent recording channels on the probe with the tip of the shanks pointing north. Each colored circle represents the location of an inhibited unit. Waveforms of the inhibited units are plotted nearby the location using the same color. Inset shows the location of the source unit on the probe. (C) CCGs of the connections displayed in (B) using the same color code. Solid lines represent mean, dashed lines represent one standard deviation.
Figure 2—figure supplement 2

TP latency density distributions.
(A) Dashed lines represent kernel density estimations of probability density functions of the TP latencies of putative inhibitory (blue), putative excitatory (black) and ‘activated’ units. Solid lines represent Gaussian fitting curves for each group. Peak inhibitory Gaussian: 0.31 ms, peak excitatory Gaussian: 0.81 ms and peak ‘activated’ Gaussian: 0.56 ms. (B) Goodness of fit metrics for each Gaussian fit. Sse = Sum of squares due to error, rsquare = R-squared (coefficient of determination), dfe = Degrees of freedom in the error, adjrsquare = Degree-of-freedom adjusted coefficient of determination.
Figure 3 with 9 supplements
5-HT suppresses SOs and activates Sst interneurons.
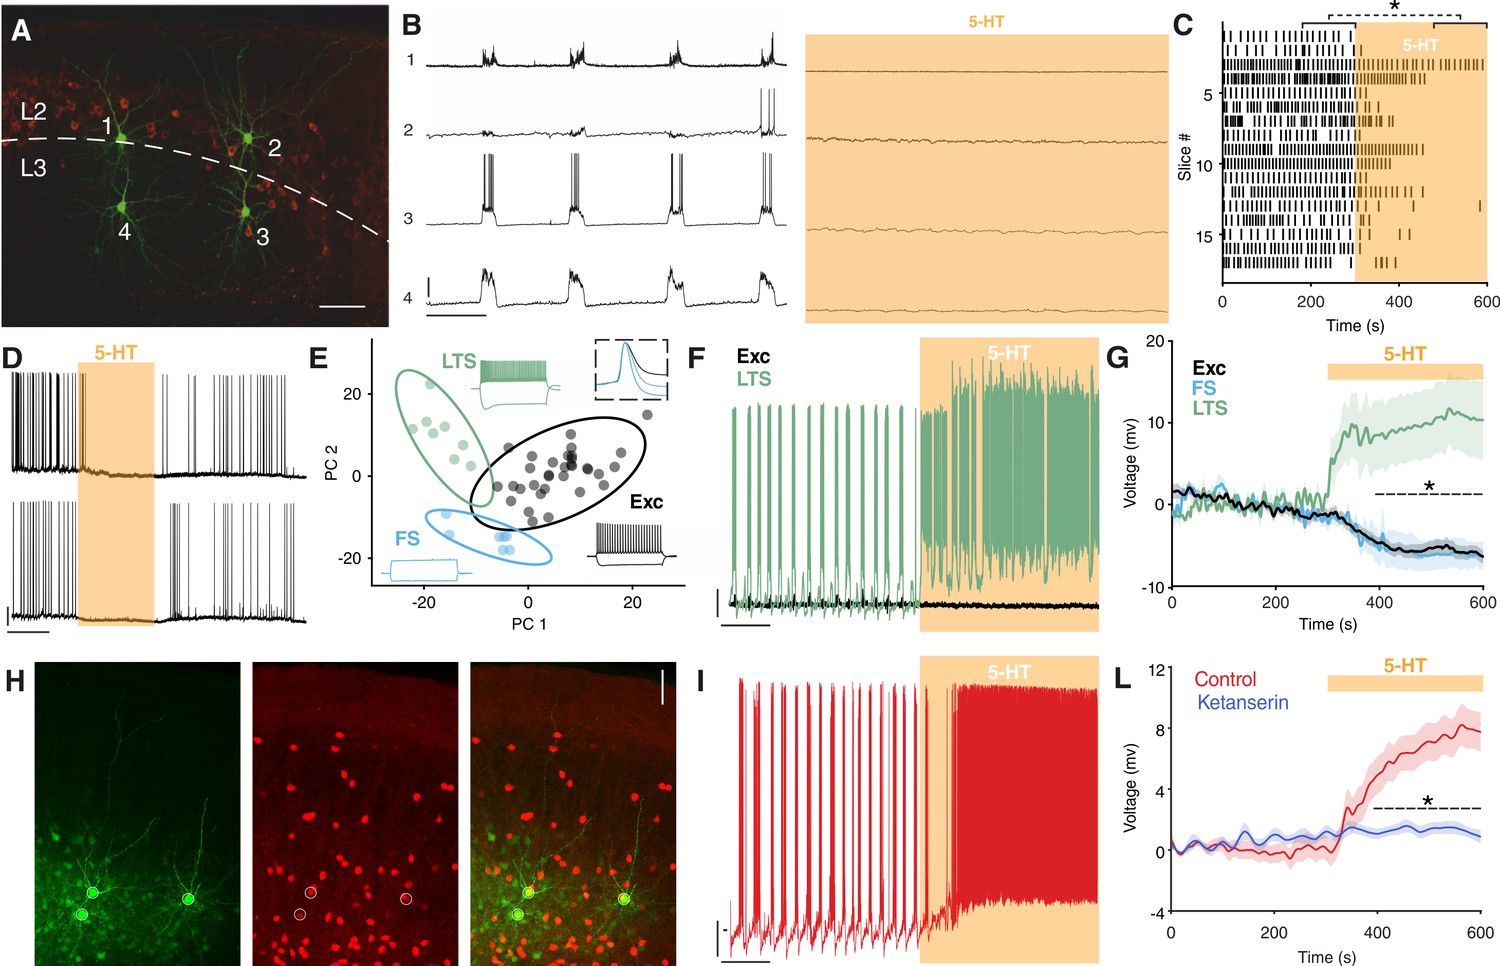
(A) Biocytin staining of four simultaneously recorded cells shown in (B) WFS1 expression (in red) delimits L2/3 border. (B) Intracellular recordings showing synchronous upstate events in four simultaneously recorded cells before (left) and after (right) 5-HT application. Scale bars: 1: 7.5 mV, 2: 25 mV, 3: 25 mV, 4: 10 mV; 10 s. (C) Upstate raster plot before and after 5-HT application, orange box represents 5-HT application (n = 17, p<10−4, Wilcoxon signed rank test). (D) Representative recording showing the temporary inhibitory effect of 5-HT on SOs in two simultaneously recorded cells. Scale bars: 5 min, 20 mV. (E) PCA projection plot of all the cells recorded (n = 48). Cells are color-coded according to group identity: Exc (black), FS (light blue), or LTS (green). Typical voltage responses to current injection (−150 and +250 pA) are plotted for each group. Inset shows the average spike waveform for each group. (F) Representative recording of an excitatory (black) and a low-threshold (green) neuron simultaneously recorded during 5-HT application. Scale bars: 10 mV, 30 s. (G) Average change of RP before and after 5-HT application, across excitatory, fast-spiking and low-threshold neurons (Exc: n = 34, FS: n = 6; LTS: n = 9; p<10−4, unpaired t test with Holm-Šidák correction). (H) Biocytin staining of cells recorded in Sst-tdTomato mouse. Biocytin in green, tdTomato in red. Scale bar: 50 µm. (I) Representative recording of a Sst interneuron during 5-HT application. Scale bars: 10 mV, 30 s. (L) Average RP of Sst interneurons during 5-HT (red) and ketanserin + 5-HT (blue) application, orange bar represents 5-HT (5-HT: n = 19, ketanserin + 5-HT: n = 22).
-
Figure 3—source data 1
Source data for Figure 3G.
- https://cdn.elifesciences.org/articles/66960/elife-66960-fig3-data1-v2.xlsx
-
Figure 3—source data 2
Source data for Figure 3L.
- https://cdn.elifesciences.org/articles/66960/elife-66960-fig3-data2-v2.xlsx
Figure 3—figure supplement 1
Effect of Fen on SOs in vitro.
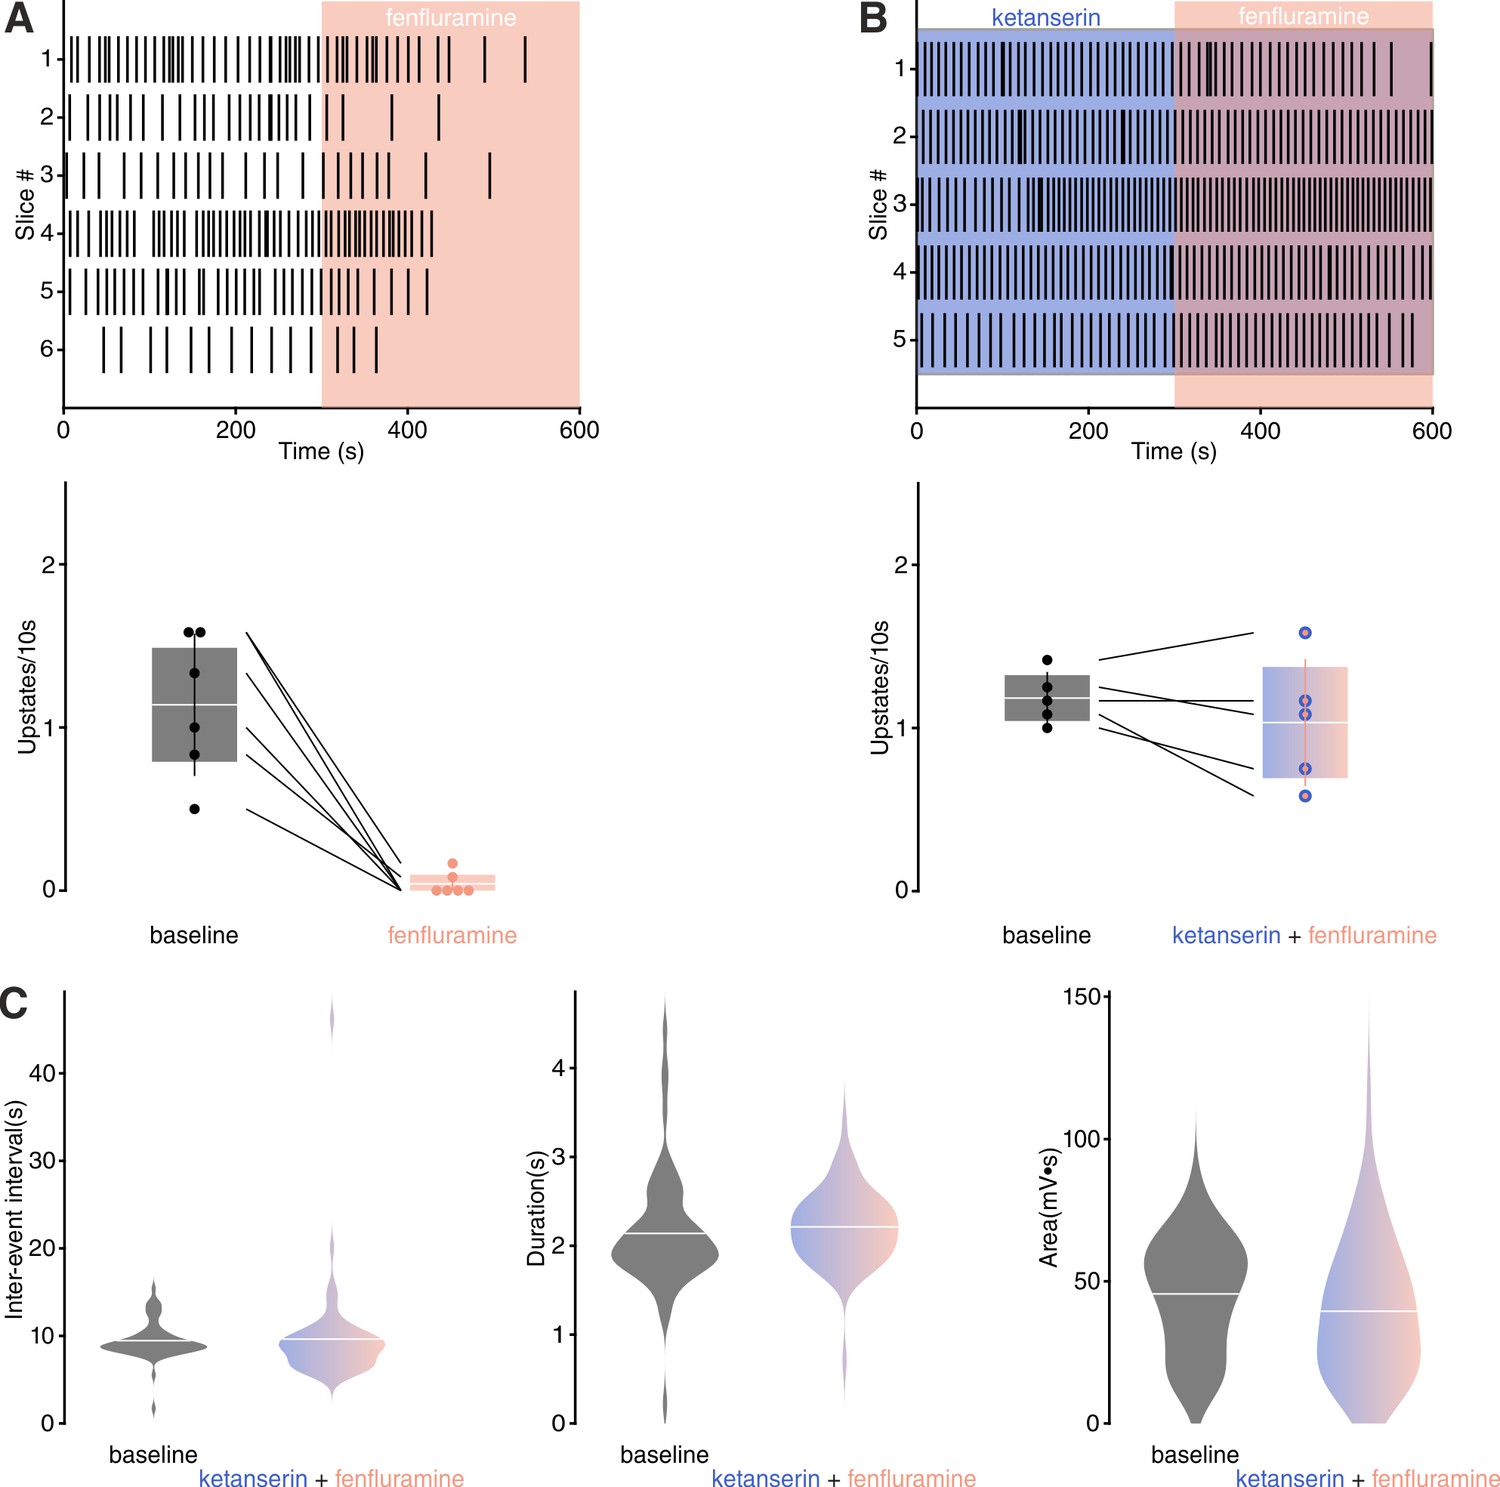
(A) Top: upstate raster plot during Fen application. Bottom: Histogram of upstate incidence before and after Fen application (n = 6, baseline: 1.13 ± 0.17 upstates/10 s, Fen: 0.04 ± 0.03 upstates/10 s). (B) Top: upstate raster plot during ketanserin + Fen application. Bottom: Histogram of upstate incidence before and after ketanserin + Fen application (n = 5, baseline: 1.18 ± 0.07 upstates/10 s, Fen: 1.03 ± 0.17 upstates/10 s). (C) Upstate metrics during baseline and ketanserin + Fen. Left: violin plots of inter-event interval (baseline = 9.46 ± 0.28 s, ketanserin + Fen = 9.63 ± 0.74 s). Middle: violin plots of inter-event upstate duration (baseline = 2.13 ± 0.08 s, ketanserin + Fen = 2.21 ± 0.05 s). Right: violin plots of upstates area (baseline = 45.55 ± 2.45 mV•s, ketanserin + Fen = 39.45 ± 2.92 mV•s).
Figure 3—figure supplement 2
5-HT suppresses evoked upstates in vitro.
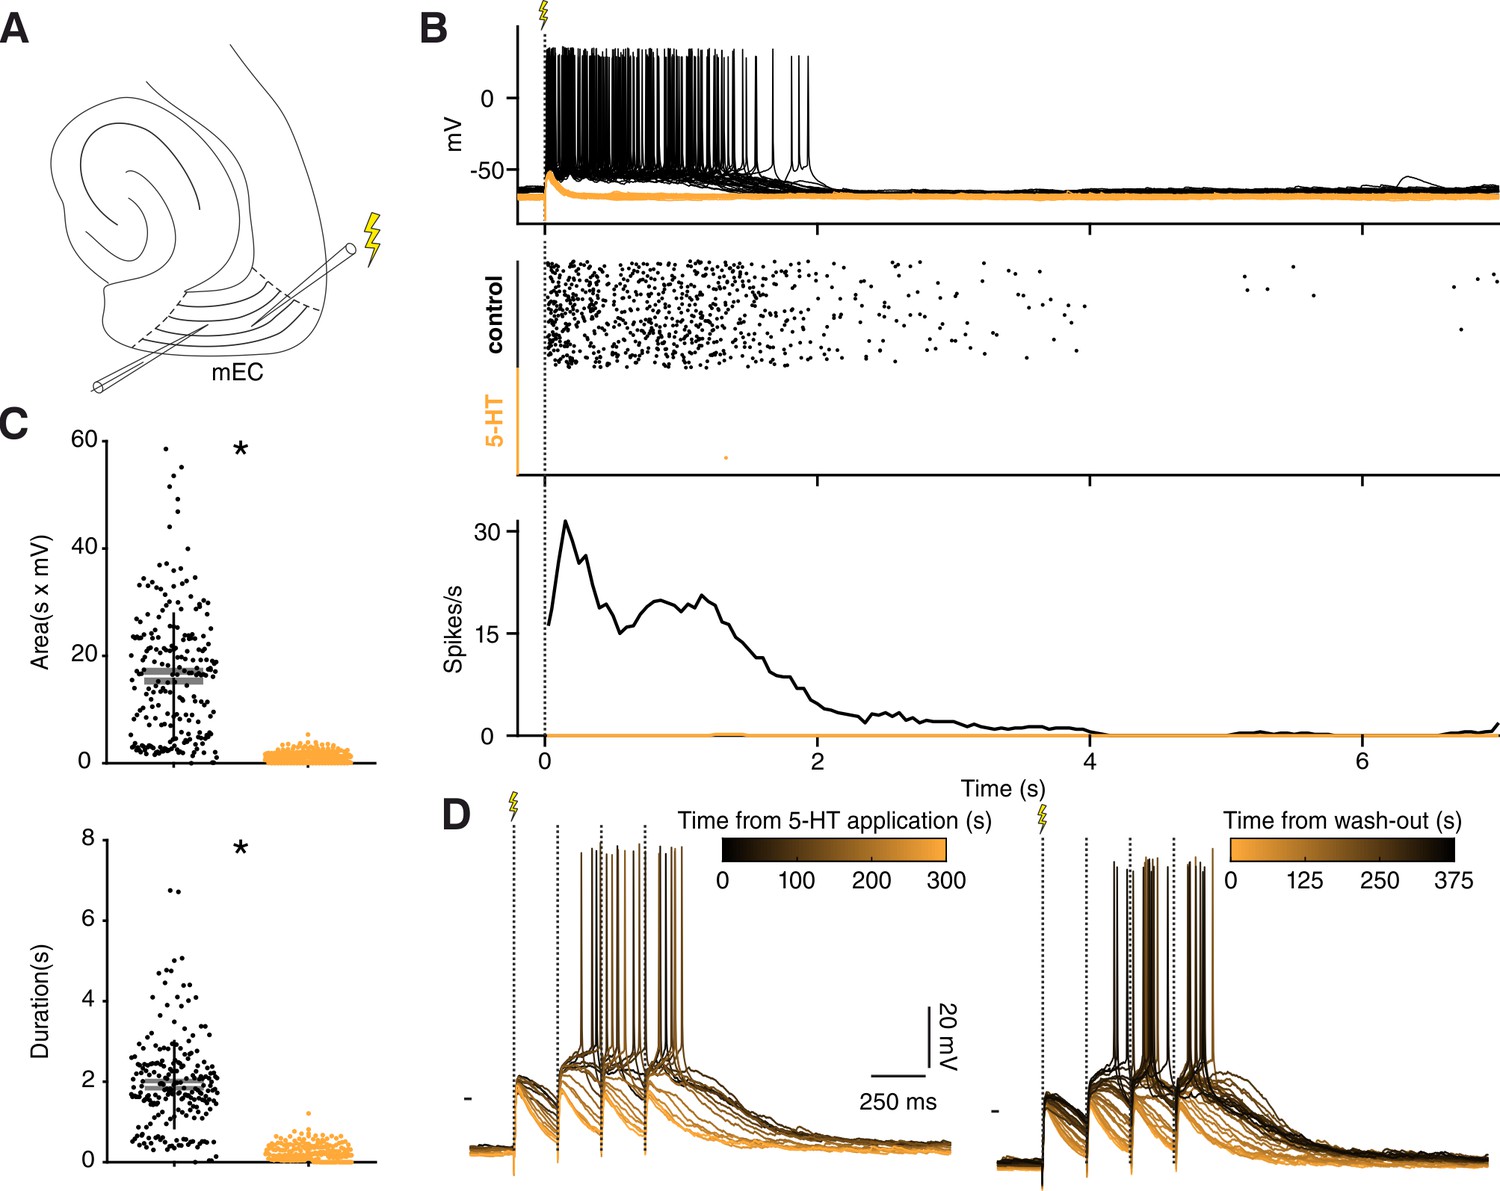
(A) Experimental protocol: recording and stimulation electrode were placed in mEC layer 3, stimulation electrode was located toward the lateral side of the slice. (B) Effect of electrical stimulation before (black) and after 5-HT application (orange). 5-HT consistently suppressed spiking. Increasing the stimulation power up to 10x (n = 40/80 in four slices) had no rescue effect. Top: voltage responses to electrical stimulation of a representative neuron. Middle: summary spike raster plot before and after 5-HT application. Bottom: spike rate line histogram (C) Scatter plot showing area (top, n = 8 neurons, mean control = 16.22 ± 0.80, mean5-HT = 1.24 ± 0.97, p<10−4, Wilcoxon matched-pairs signed rank test) and duration (bottom, n = 8 neurons, mean control = 1.92 ± 0.07, mean5-HT = 0.24 ± 0.01,, p<10−4, Wilcoxon matched-pairs signed rank test) of evoked upstates before (black) and after 5-HT application (orange). (D) Representative voltage responses to 1 s 4 Hz stimulation following wash-in (left) and wash-out (right) of 5-HT. 5-HT prevents spiking from input summation.
Figure 3—figure supplement 3
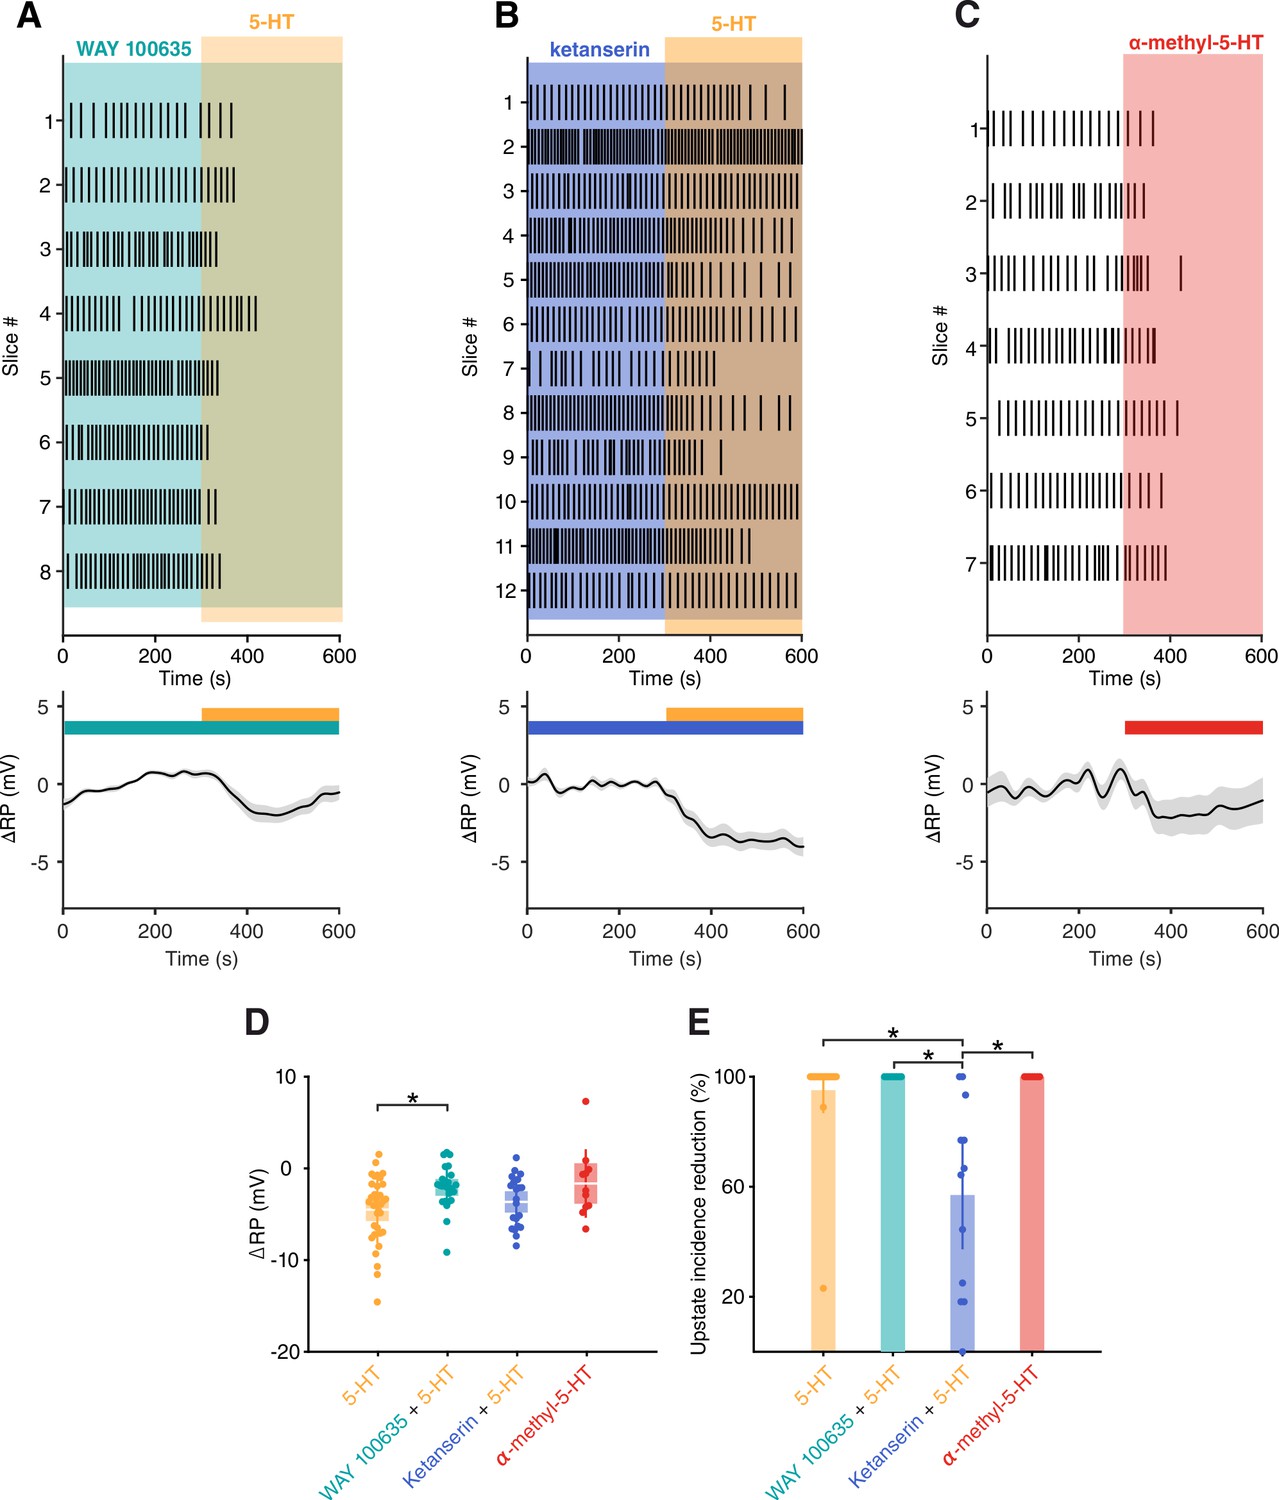
5-HT2ARs are involved in 5-HT mediated SOs suppression in vitro.
(A) Top: upstate raster plot during application of WAY 100635 (5-HT1A antagonist) + 5-HT. Bottom: change in RP in putative excitatory cells after application of WAY 100635 (5-HT1A antagonist) + 5-HT (n = 25 cells). (B) Top: upstate raster plot during application of ketanserin (5-HT2A antagonist) + 5-HT. Bottom: change in RP in putative excitatory cells after application of ketanserin (5-HT2A antagonist) + 5-HT (n = 21 cells). (C) Top: upstate raster plot during application of α-methyl-5-HT (5-HT2 agonist). Bottom: change in RP in putative excitatory cells after application of α-methyl-5-HT (5-HT2 agonist) (n = 11 cells). (D) Dot plot showing change in RP for each pharmacological condition (5-HT: −4.52 ± 0.64 mV, WAY + 5-HT: −2.09 ± 0.47 mV, ketanserin + 5-HT: −3.68 ± 0.60 mV and α-methyl-5-HT: −1.67 ± 1.13 mV; p=0.0329, Kruskal-Wallis with Dunn's multiple comparisons test). (E) Dot plot showing percentage reduction of upstate incidence for each pharmacological condition (5-HT: 95 ± 4%, WAY + 5-HT: 100 ± 0%, ketanserin + 5-HT: 57 ± 10.1% and α-methyl-5-HT: 100 ± 0%; p<10−4, Kruskal-Wallis with Dunn's multiple comparisons test).
Figure 3—figure supplement 4
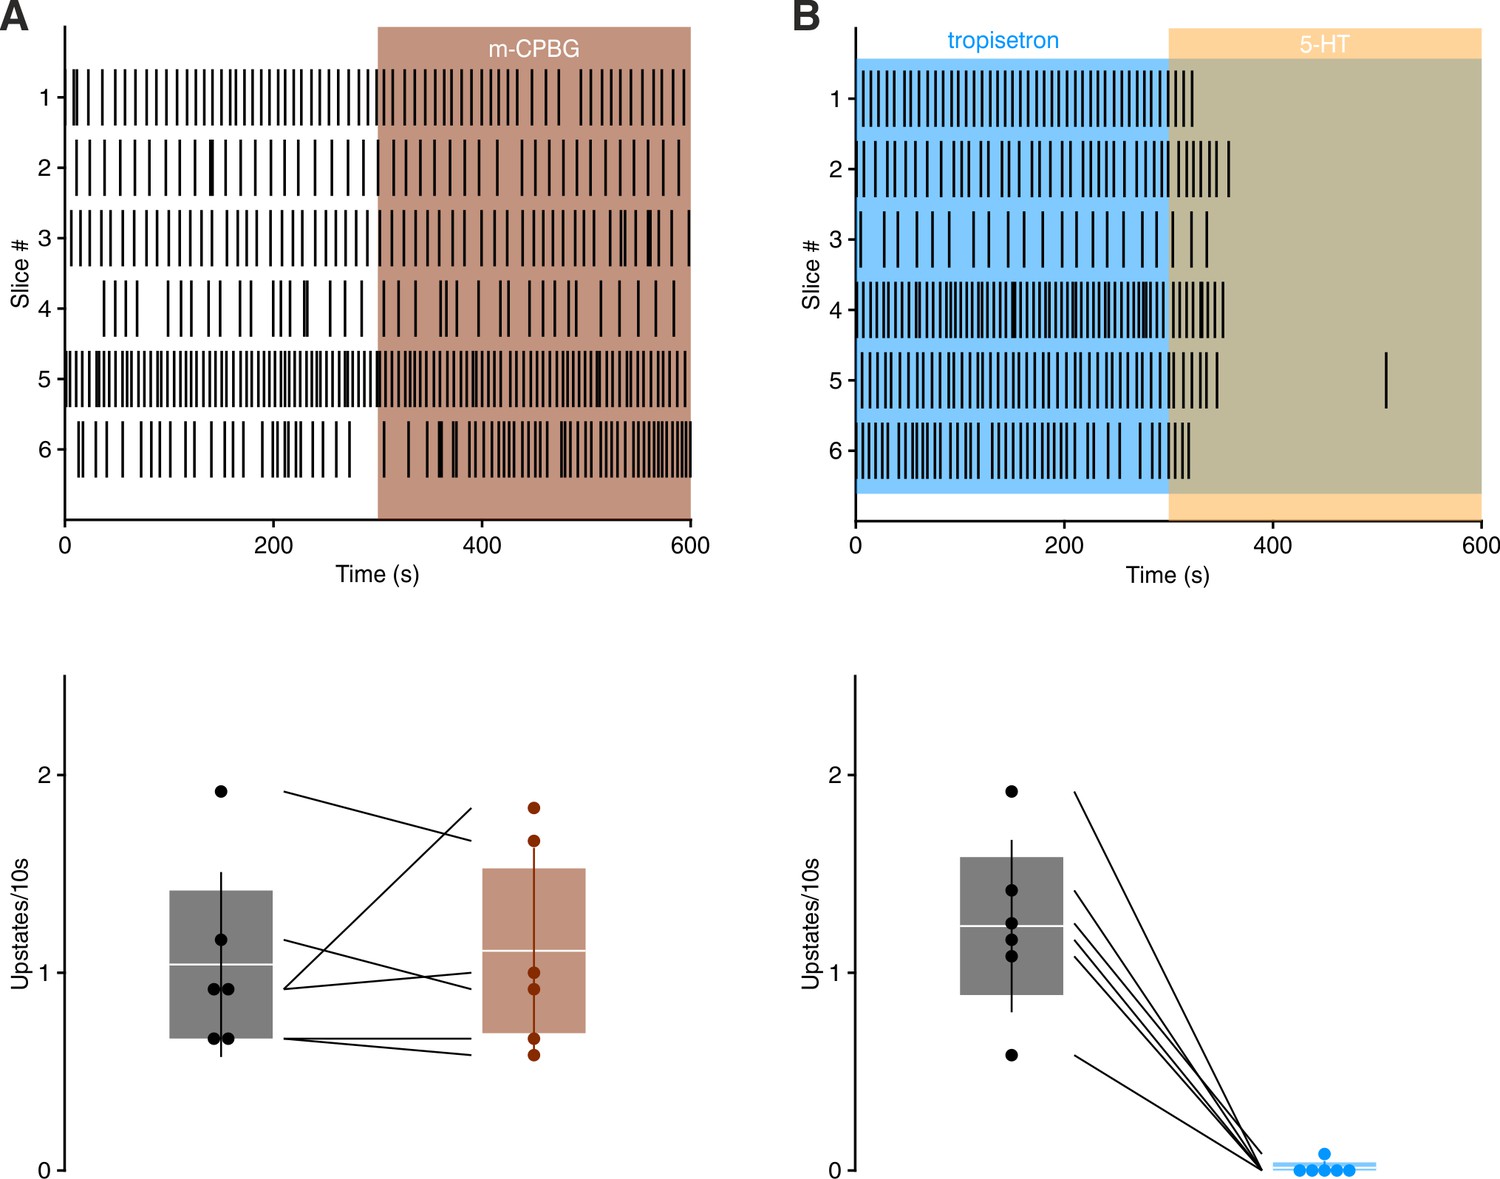
5-HT3 receptor is not involved in 5-HT mediated SOs suppression.
(A) Top: upstate raster plot during application of m-CPBG (5-HT3 agonist). Bottom: histogram of upstate incidence before and after m-CPBG application (n = 6, baseline: 1.04 ± 0.19 upstates/10 s, m-CPBG: 1.11 ± 0.21 upstates/10 s). Patches represent 95% confidence interval, lines represent standard deviation. (B) Top: upstate raster plot during application of tropisetron (5-HT3 antagonist) + 5-HT. Bottom: histogram of upstate incidence before and after tropisetron + 5-HT application (n = 6, baseline: 1.23 ± 0.18 upstates/10 s, tropisetron + 5-HT: 0.01 ± 0.01 upstates/10 s). Patches represent 95% confidence interval, lines represent standard deviation.
Figure 3—figure supplement 5
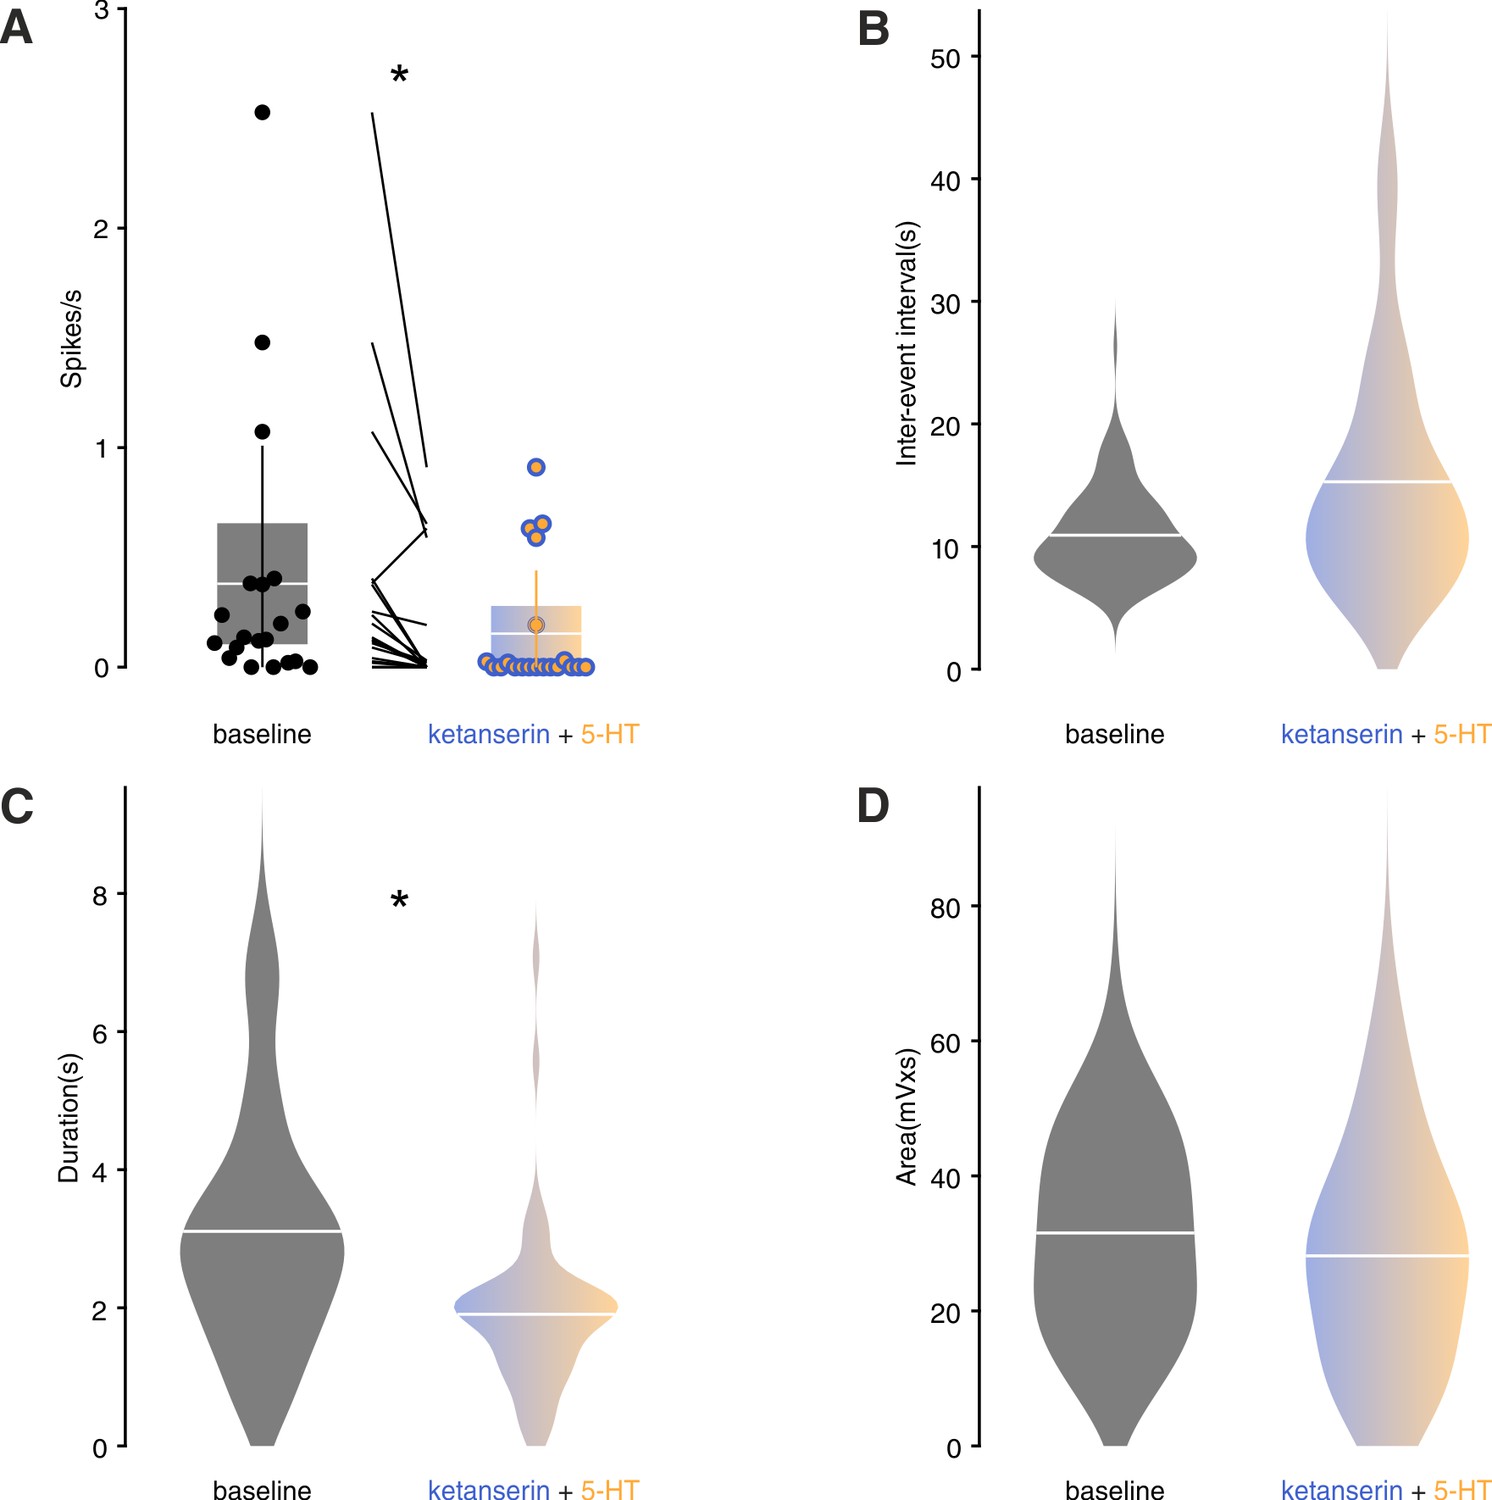
In vitro upstates metrics during baseline and ketanserin + 5-HT application.
(A) Box plot showing spiking rate before and after ketanserin + 5-HT (baseline: 0.38 ± 0.14 spikes/s, ketanserin + 5-HT: 0.15 ± 0.06 spikes/s, p=0.011, Mann-Whitney test). patches represent 95% confidence interval, lines represent standard deviation. (B) Violin plots of upstate inter-event interval (baseline = 10.92 ± 0.34 s, ketanserin+5-HT = 15.28 ± 1.34 s, p=0.071, Mann-Whitney test). (C) Violin plots of upstate duration (baseline = 3.11 ± 0.16 s, ketanserin +5-HT = 1.91 ± 0.15 s, p<0.001, Mann-Whitney test). (D) Violin plots of upstate area (baseline = 31.55 ± 1.13 mV•s, ketanserin+5-HT = 28.16 ± 1.91 mV•s, p=0.0825, Mann-Whitney test).
Figure 3—figure supplement 6
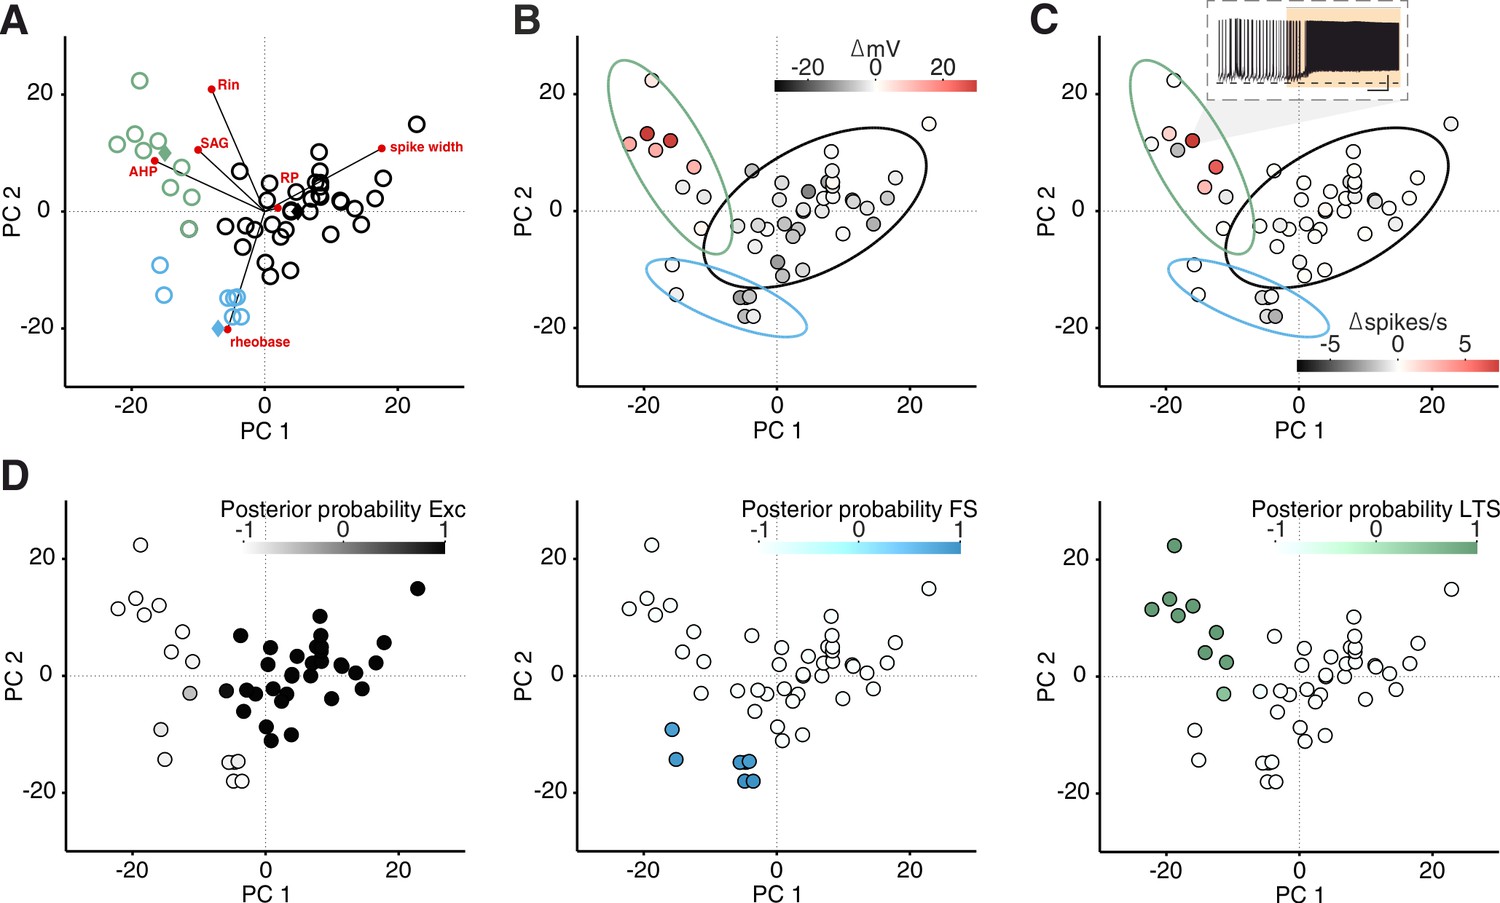
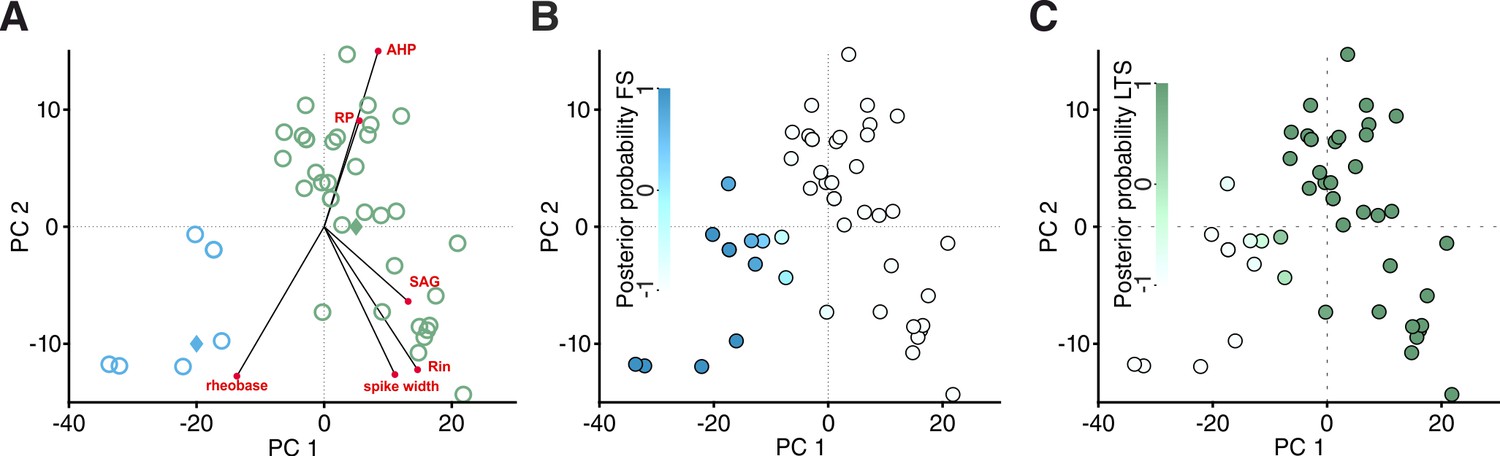
LTS neurons are depolarized by 5-HT.
(A) PCA projection plot of all the cells recorded. Cells are color-coded according to group identity (posterior probability >0.9): excitatory (black), fast-spiking (blue), low-threshold spiking (green). Red circles represent PCA loadings. (B) PCA projection plot color-coded according to ΔRP after 5-HT application. Inset shows a recording from one LTS neuron during 5-HT application. Scale bars: 20 mV, 25 s. Dotted line showing −70 mV. (C) PCA projection plot color-coded according to Δspikes/s after 5-HT application. (D) Posterior probability of being classified as Exc, FS, or LTS.
Figure 3—figure supplement 7
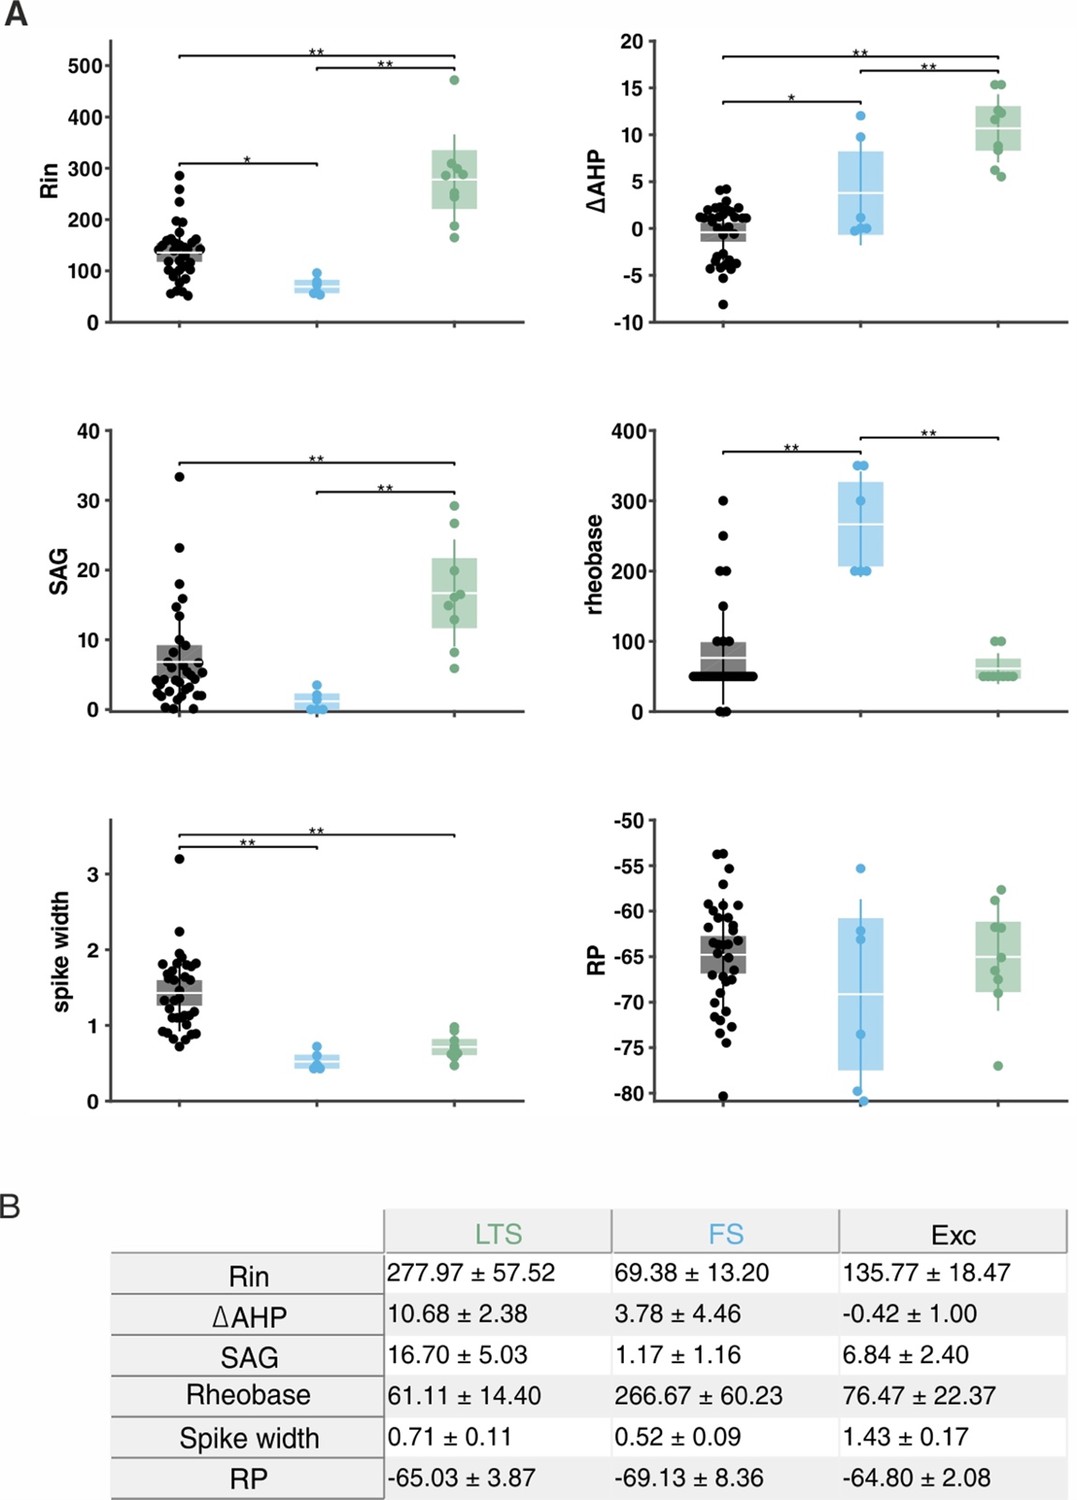
Excitatory, fast-spiking, and LTS cells have unique sets of electrophysiological features.
(A) Box plot showing the values of input resistance (Rin), delta after-hyperpolarization (ΔAHP), SAG, RP, rheobase and spike width of excitatory (Exc, black), fast-spiking (FS, blue) and low-threshold spiking (LTS, green) cells (nEXC = 33, nFS = 6, nLTS = 9; asterisk means p<0.05, double asterisk means p<0.01). Patches represent 95% confidence interval, lines represent standard deviation. (B) Table showing values plotted in (A).
Figure 3—figure supplement 8
Classification of cells recorded in Sst-tdTomato mice.
(A) PCA projection plot of cells recorded in Sst-tdTomato mice. Cells are color-coded according to group identity (posterior probability >0.9): fast-spiking (blue) or low-threshold spiking (green). Red circles represent PCA loadings. (B) Posterior probability of being classified as FS. (C) Posterior probability of being classified as LTS.
Figure 3—figure supplement 9
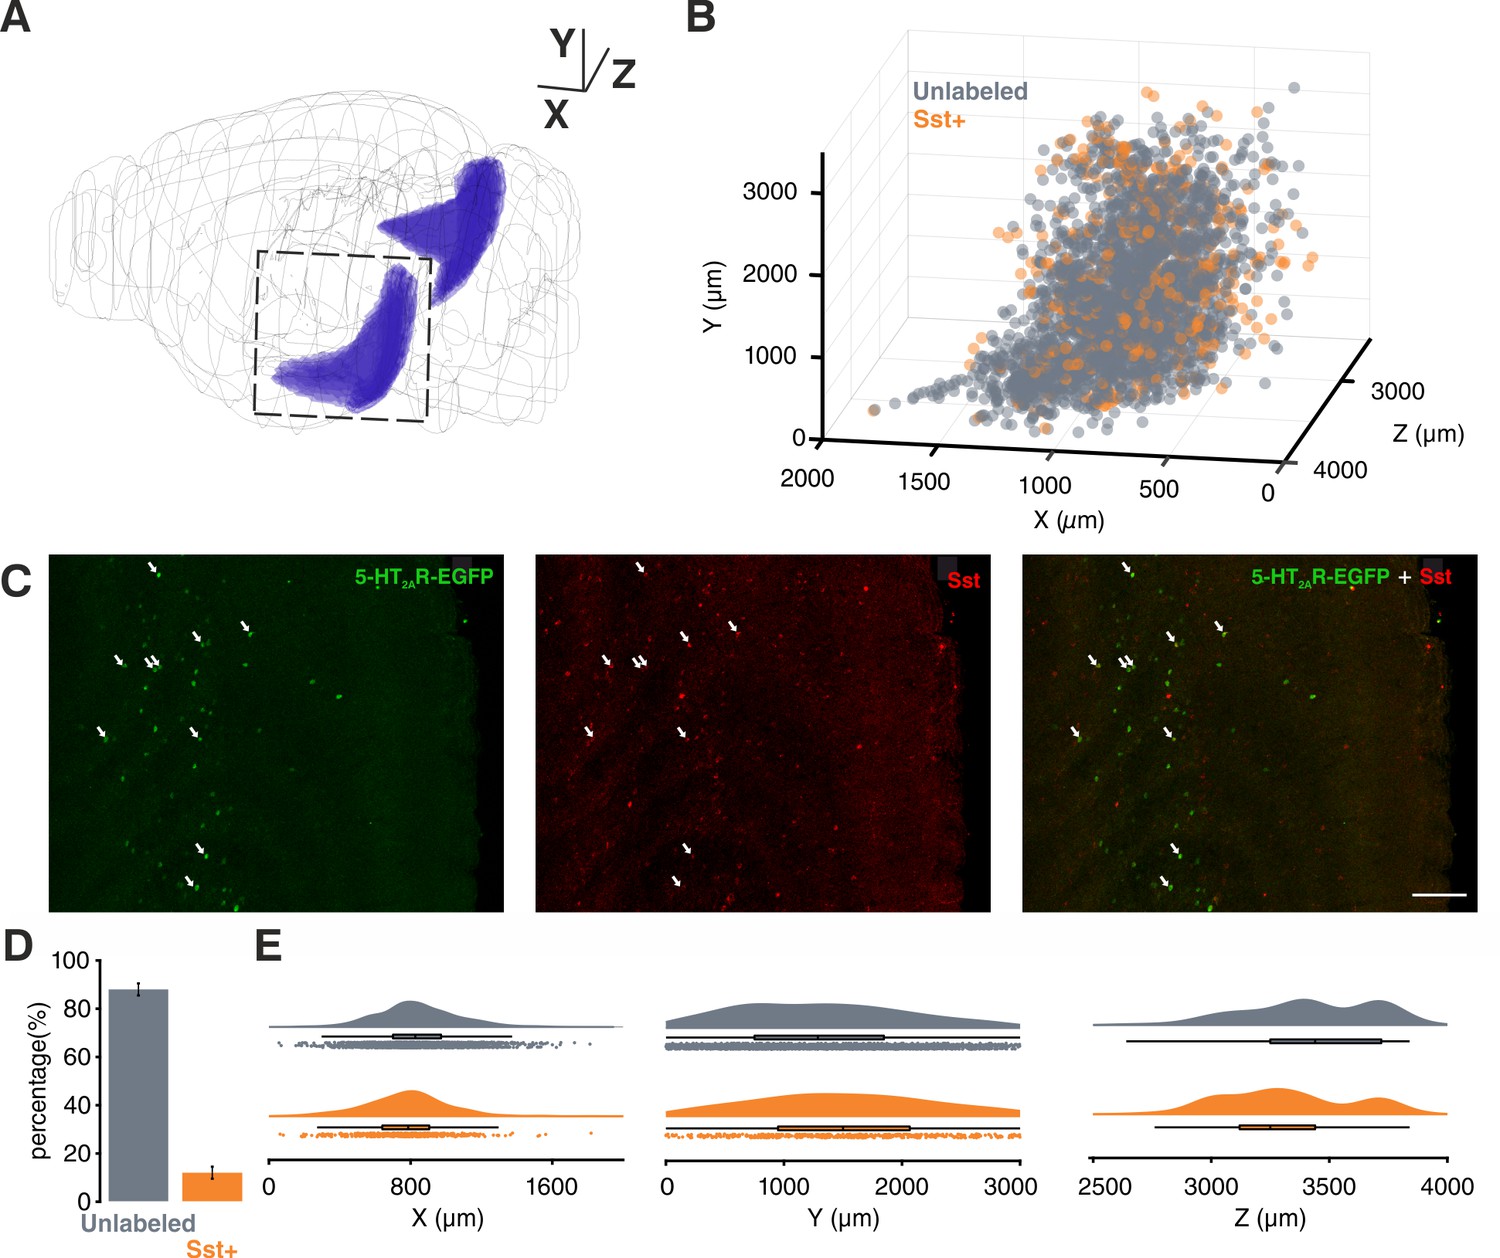
Spatial localization of 5-HT2AR positive cells in EC.
(A) 3D visualization of EC (purple). (B) 3D localization of all the 5-HT2AR-positive cells detected in EC using same perspective as (A). (Cand D) Co-localization of 5-HT2AR and Sst, arrows point to colocalized cells (scale bar: 100 µm, n animals = 7, total number of 5-HT2AR-positive cells = 3570, average number of 5-HT2AR-positive cells per animal = 510 ± 80.32). (E) Spatial distribution of 5-HT2AR-positive cells and colocalized cells along the three dimensions depicted in (A) (Z dimension centered on the midline).
Figure 4 with 1 supplement
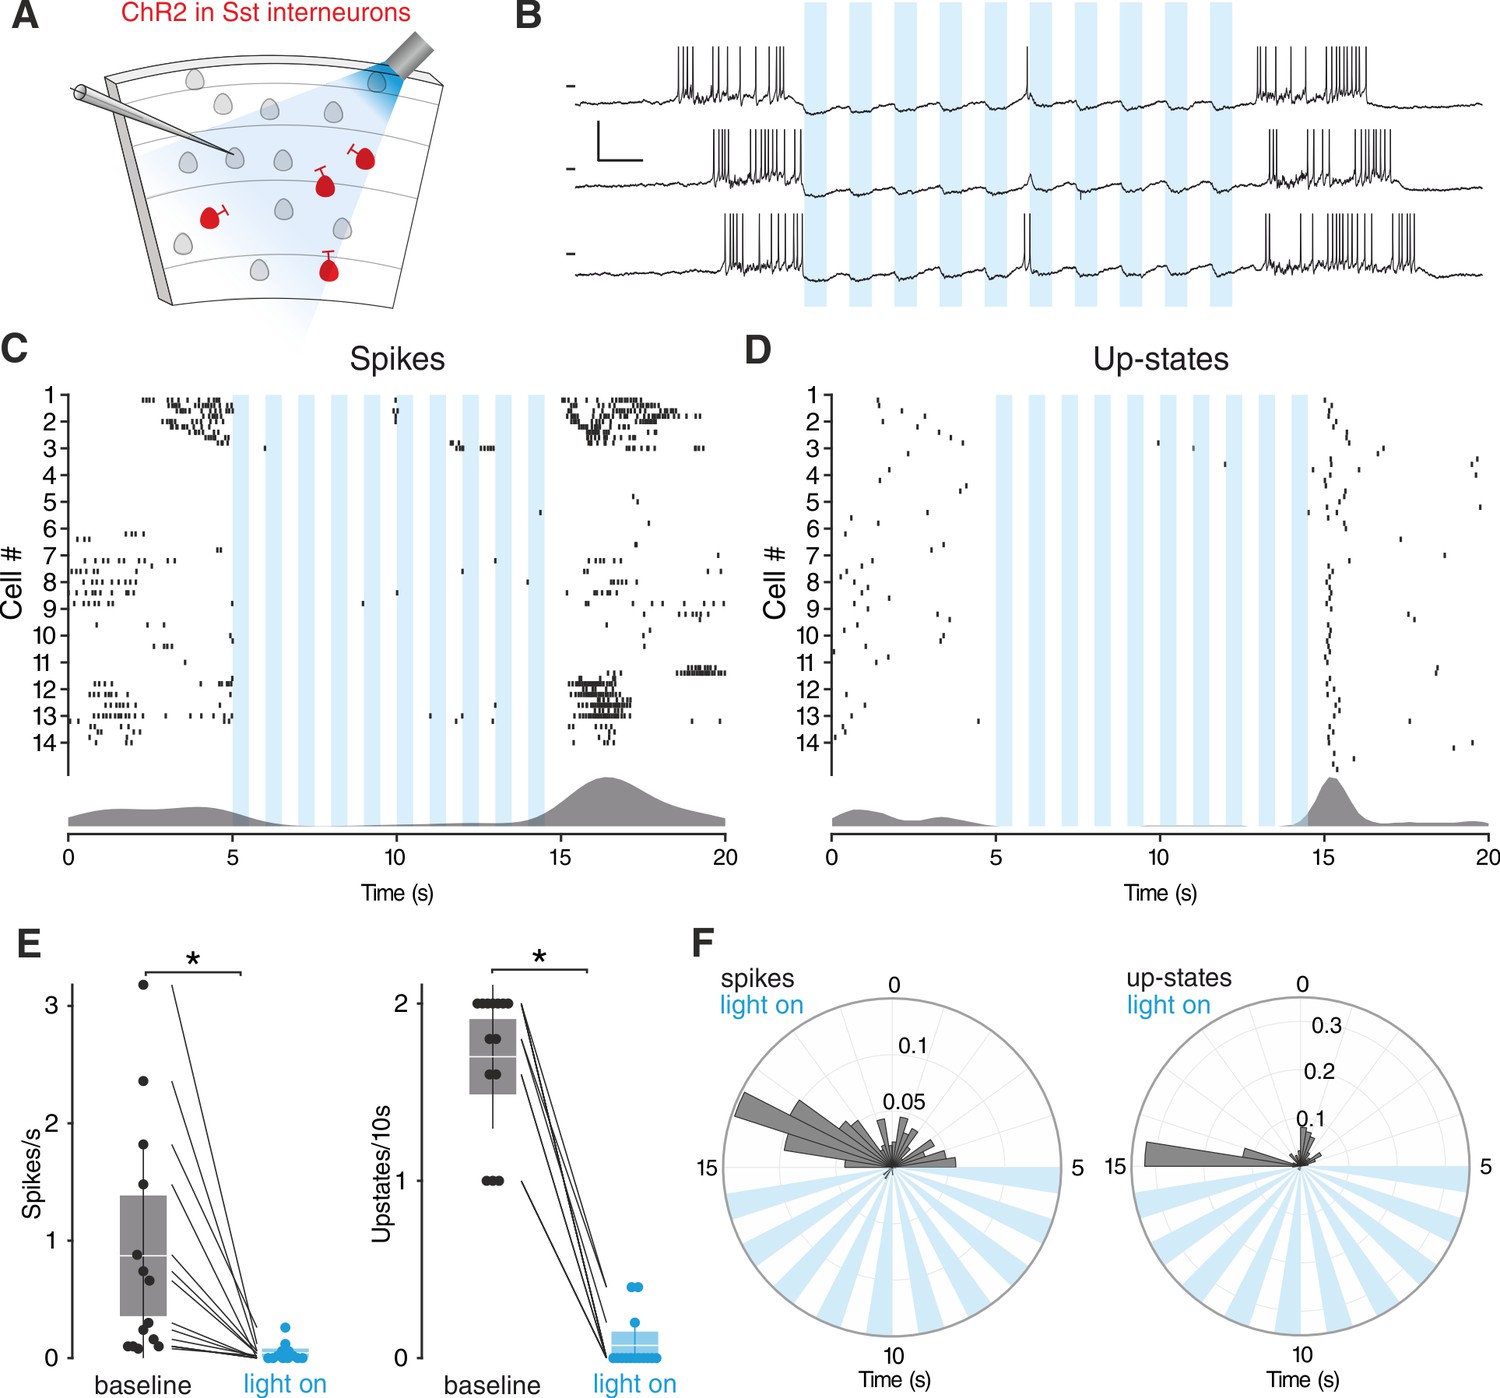
Sst interneurons activation suppresses SOs.
(A) Experimental protocol: Sst interneurons expressing ChR2 are activated by light during intracellular recording of L3 neurons in EC. (B) Representative recordings from a L3 neuron during Sst interneuron activation. Scale bars: 10 mV, 0.5 s. (C) Spikes raster (top) and density plot (bottom) during light stimulation. (D) Upstate raster (top) and density plot (bottom) during light stimulation. (E) Left: spike frequency during baseline light stimulation (n = 14; p<0.001, Wilcoxon signed rank test). Right: upstate incidence during baseline and light stimulation (n = 14; p<0.001, Wilcoxon signed rank test). Patches represent 95% confidence interval, lines represent standard deviation. (F) Left: spike probability polar plot during Sst interneurons light activation. Right: upstate probability polar plot during Sst interneurons light activation. Note the absence of both spiking activity and upstates during Sst interneurons activation.
-
Figure 4—source data 1
Source data for Figure 4E.
- https://cdn.elifesciences.org/articles/66960/elife-66960-fig4-data1-v2.xlsx
Figure 4—figure supplement 1
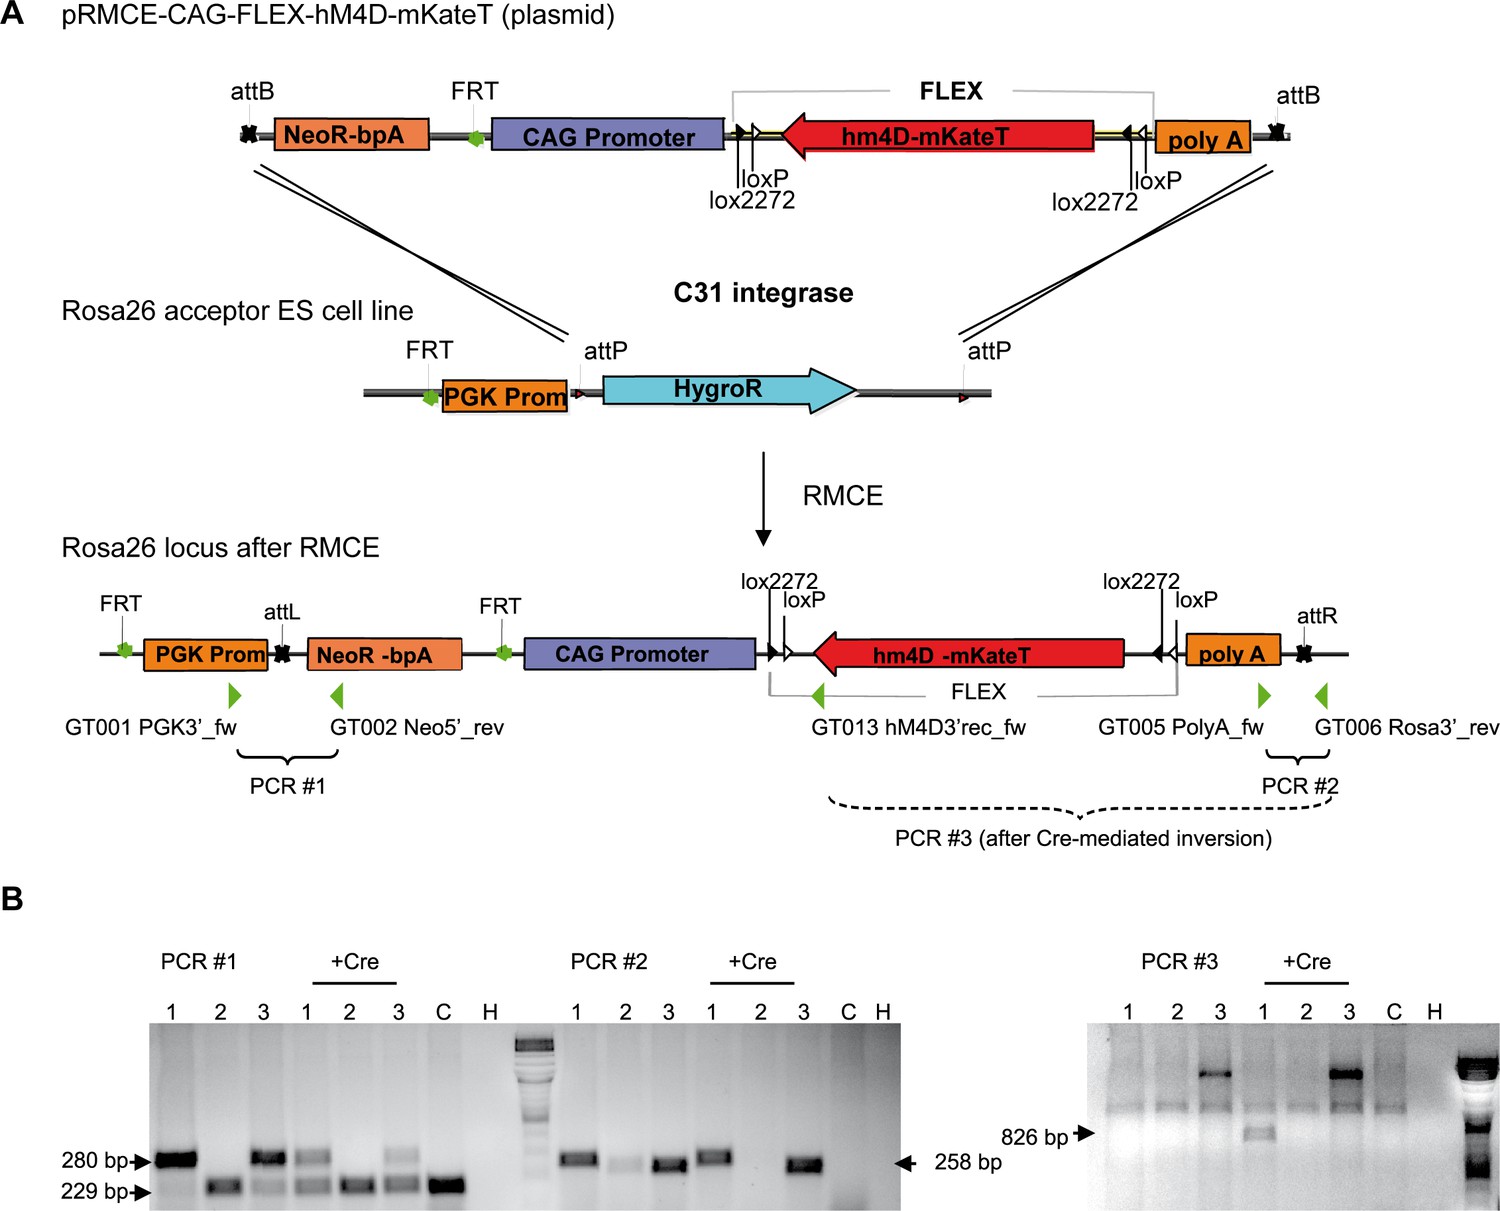
Vector construction and RMCE for the generation of a transgenic mouse line with Cre-conditional hM4Di expression.
(A) The coding sequence of hM4Di-mKate flanked by two opposing loxP and lox2272 sites was placed in reverse orientation to the CAG- promoter in the pRMCE. In the acceptor ES cells the ROSA26 allele harbors a PGK promoter driving the hygromycin selection marker, flanked by two attP sites. RMCE by C31int replaces the hygromycin resistance by the neomycin resistance of the donor vector. Location of primer-binding sites in the Rosa26-hM4Di locus is indicated by green triangles. (B) Identification of successful genomic integration events and Cre-mediated inversion of the hM4Di coding sequence by PCRs. PCR one and PCR two test for correct integration of the 5’ and 3’ end of the construct into the ROSA26 locus. The lower band in PCR one results from the Neomycin resistance cassette of the feeder cells in the ES cell culture. PCR three tests for successful recombination of the FLEX site by Cre. A successful Cre-mediated recombination of the FLEX cassette was observed for clone 1, resulting in an 826 bp product in PCR 3. C: control cells (not electroporated), H: H2O input.
Figure 5 with 2 supplements
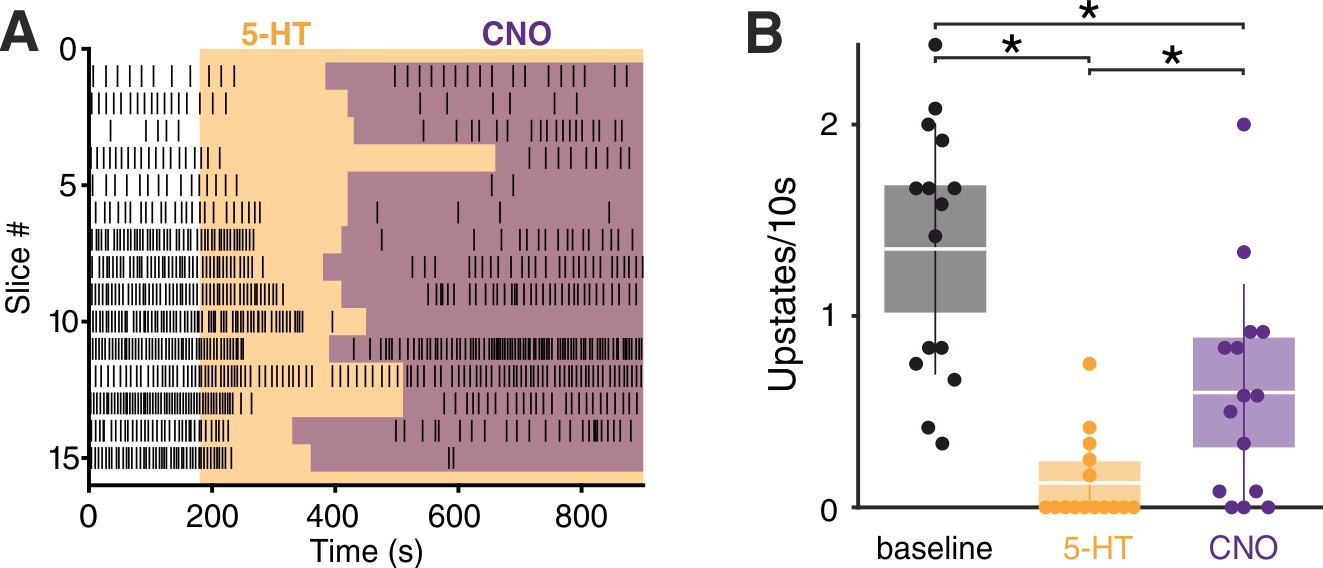
Sst interneurons mediate the effect of 5-HT on SOs.
( A) Upstate raster plot during 5-HT and subsequent CNO application. Orange box represents 5-HT, purple boxes represent CNO. Note the appearance of upstates after CNO application. (B) Upstate incidence during 5-HT and 5-HT+CNO application (n = 15; p (baseline vs 5-HT)<10–4, p (baseline vs CNO)=0.0482, p5-HT vs CNO = 0.0405, Kruskal-Wallis test). Patches represent 95% confidence intervals, lines represent standard deviation.
-
Figure 5—source data 1
Source data for Figure 5B.
- https://cdn.elifesciences.org/articles/66960/elife-66960-fig5-data1-v2.xlsx
Figure 5—figure supplement 1
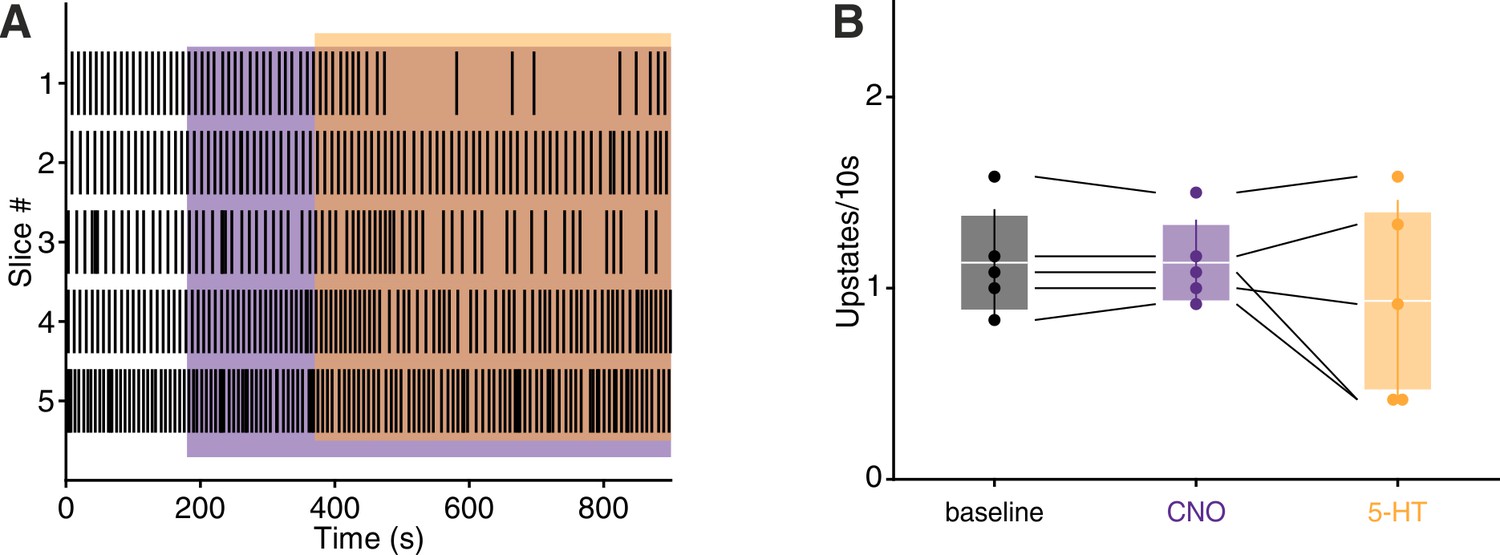
CNO application prevents 5-HT mediated upstates suppression.
(A) Upstate raster plot during CNO and subsequent 5_HT application. Orange box represents 5-HT, purple boxes represent CNO. CNO significantly prevents 5-HT-induced suppression of upstates. (B) Upstate incidence during 5-HT, CNO, and 5-HT+CNO application (n = 5, baseline: 1.13 ± 0.13 upstates/10 s, CNO: 1.13 ± 0.10 upstates/10 s, 5-HT: 0.93 ± 0.24 upstates/10 s). Patches represent 95% confidence intervals, lines represent standard deviation.
Figure 5—figure supplement 2
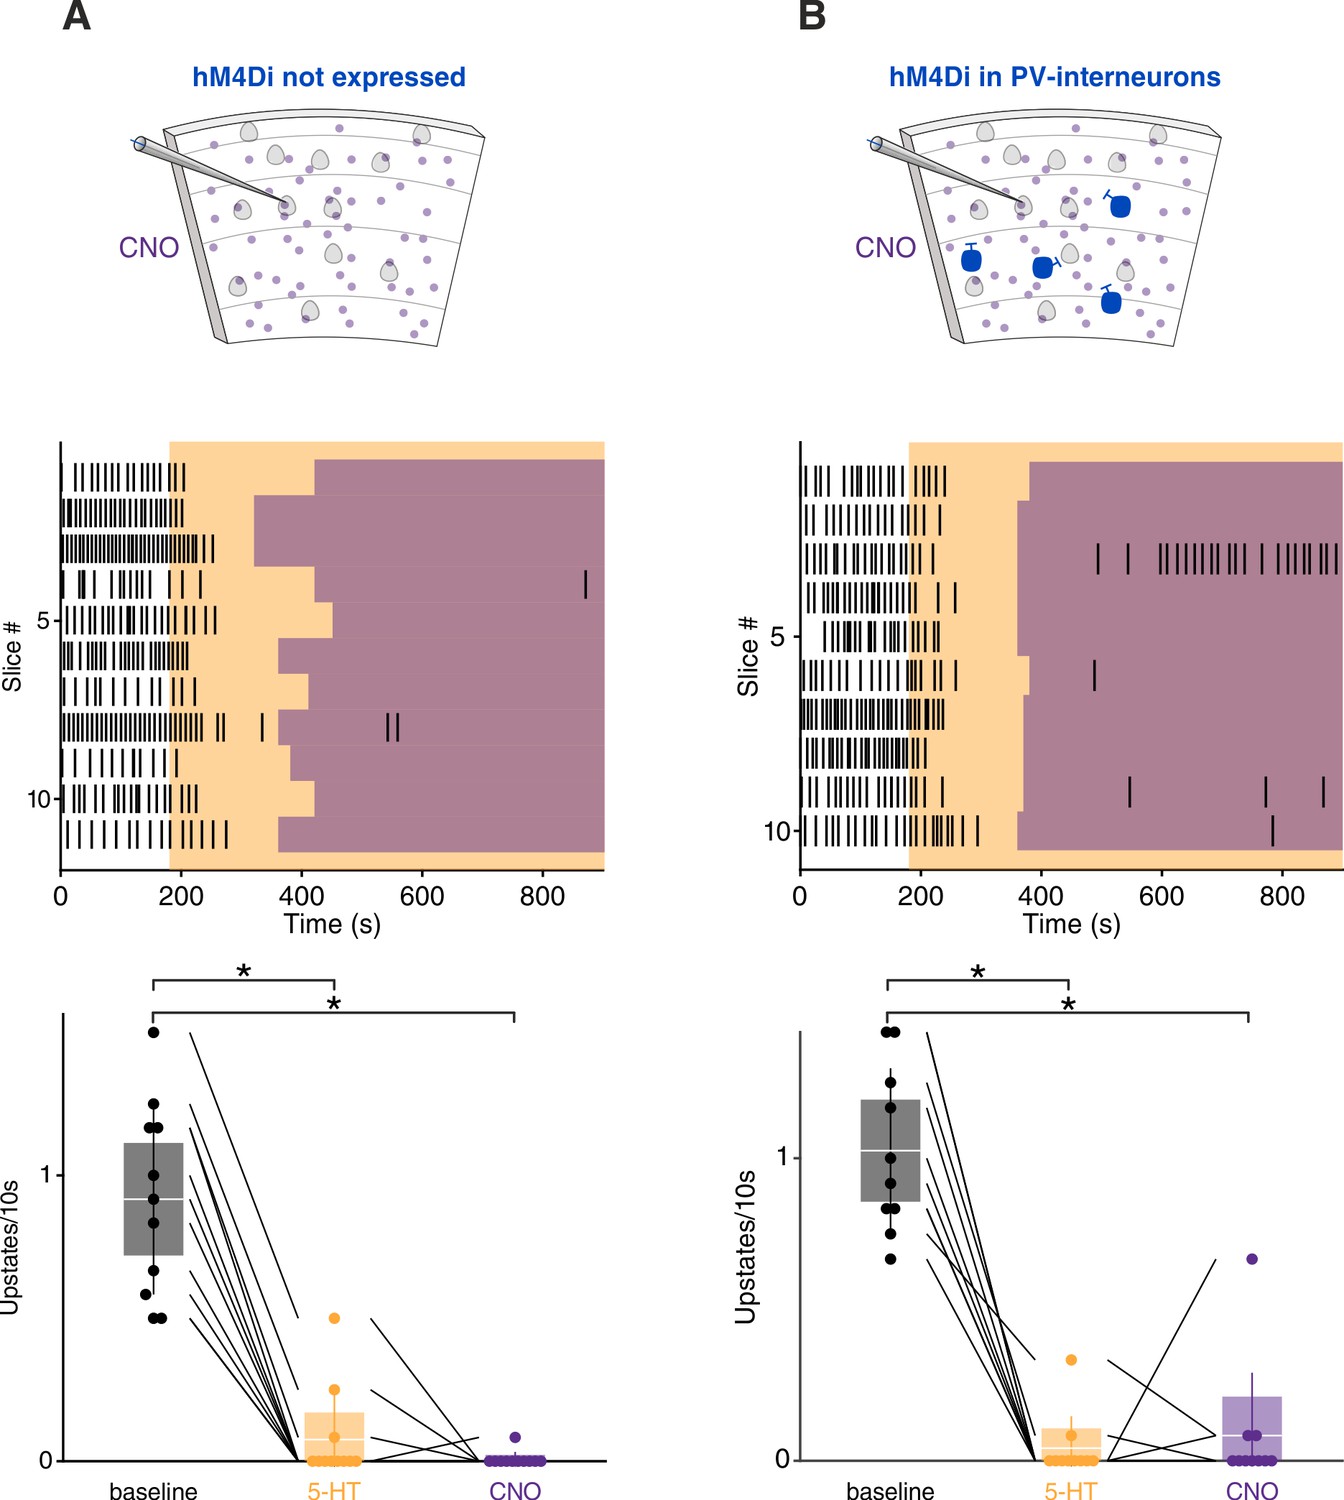
CNO application in wild-type littermates and PV-hM4Di mice.
(A) CNO application in wild-type littermates. Top: Experimental protocol. Orange box represents 5-HT and purple boxes represent CNO application. Bottom: upstate incidence during 5-HT and 5-HT+CNO application, patches represent 95% confidence interval, lines represent standard deviation (n = 11 cells in four mice, baseline = 0.91 ± 0.10, 5-HT = 0.09 ± 0.04, CNO = 0.01 ± 0.01, p baseline vs 5-HT = 0.0004, p baseline vs CNO <10−4, Kruskal-Wallis test) (B) Same as (A) but in in PV-hM4Di mice (n = 10 cells in four mice, baseline = 1.02 ± 0.08, 5-HT = 0.04 ± 0.03, CNO = 0.08 ± 0.07, p baseline vs 5-HT < 10−4, p baseline vs CNO = 0.0003, Kruskal-Wallis test).
Author response image 1

SO are not suppressed by optogenetic activation of Raphe 5-HT neurons during anesthesia.
(A) DRN immunohistochemistry image showing ChR2-YFP infection in DRN serotonergic neurons. 5-HT in red, YFP in green. Scale bars: 50 µm. (B) 3D visualization of microelectrodes location for all experiments and optic fiber (black) location. EC represented in grey, dorsal Raphe nuclei (DRN) in pink. (C) Top: upstates raster plot. Bottom: upstates density using Gaussian kernel density estimation. (D) Histogram of upstates incidence during baseline and laser stimulation (n animals = 4onedr, baseline: 2.25 ± 0.13 upstates/10s, laser: 2.11 ± 0.14 upstates/10s). (E) Left: normalized spike population activity during baseline (black) and laser stimulation (blue) in mEC L3/5 (n = 108, p < 0.05, unpaired t-test with Holm-Šidák correction). Right: heatmap showing average spike rate difference per cluster between stimulation and baseline during upstates, some units show reduced spiking during stimulation. (F) Left: normalized spike population activity during baseline (black) and laser stimulation (blue) in CA1 (n = 140, p > 0.05, unpaired t-test with Holm-Šidák correction). Right: heatmap showing average spike rate difference per cluster between stimulation and baseline during upstates, no clear difference in spiking activity.
Additional files
Download links
A two-part list of links to download the article, or parts of the article, in various formats.
Downloads (link to download the article as PDF)
Open citations (links to open the citations from this article in various online reference manager services)
Cite this article (links to download the citations from this article in formats compatible with various reference manager tools)
Somatostatin interneurons activated by 5-HT2A receptor suppress slow oscillations in medial entorhinal cortex
eLife 10:e66960.
https://doi.org/10.7554/eLife.66960


