A novel decoy strategy for polymyxin resistance in Acinetobacter baumannii
- Laboratory of Molecular Environmental Microbiology, Department of Environmental Science and Ecological Engineering, Korea University, Republic of Korea
- Department of Environmental Engineering, Yonsei University, Republic of Korea
Figures
Figure 1 with 2 supplements
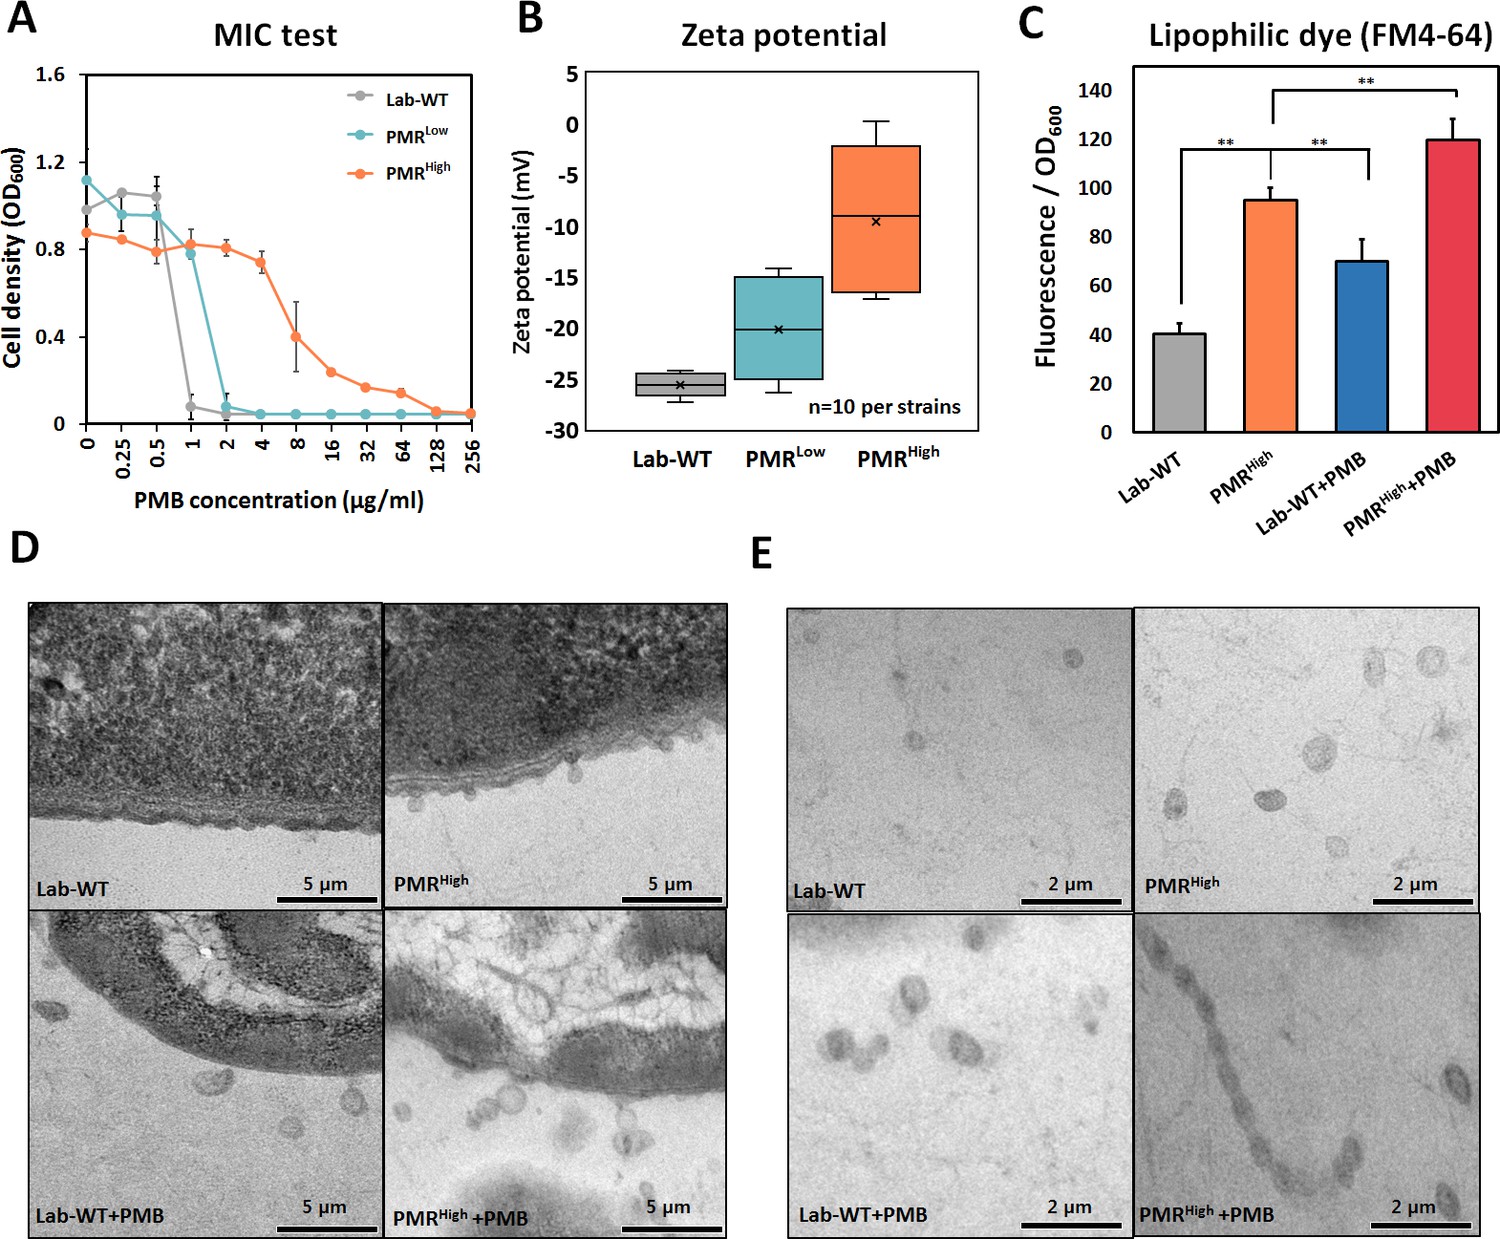
Generation of experimentally evolved polymyxin B (PMB)-resistant strains and observation of outer membrane vesicle (OMV) production.
(A) PMB-resistant strains generated by exposing wild-type cells to increasing concentrations of PMB (N = 3 biological replicates). (B) Zeta-potential of the Lab-WT, PMRLow, and PMRHigh strains (n = 10 each) under the non-treated condition. (C) OMV production was quantified by using a lipophilic dye (FM4-64) under the non-treated condition or 1/2 minimum inhibitory concentration of PMB treatment condition (N = 3 biological replicates). Asterisks indicate statistical significance at p<0.01. (D) Transmission electron micrographs (TEMs) of the experimentally evolved strains. Cells were grown to the exponential phase in LB liquid medium. (E) Detached OMVs from each strain were observed using TEM. OMVs were connected in a row in the PMRHigh strain.
-
Figure 1—source data 1
The minimum inhibitory concentration of experimentally evolved polymyxin B-resistant strains and outer membrane vesicle production.
- https://cdn.elifesciences.org/articles/66988/elife-66988-fig1-data1-v2.xlsx
Figure 1—figure supplement 1
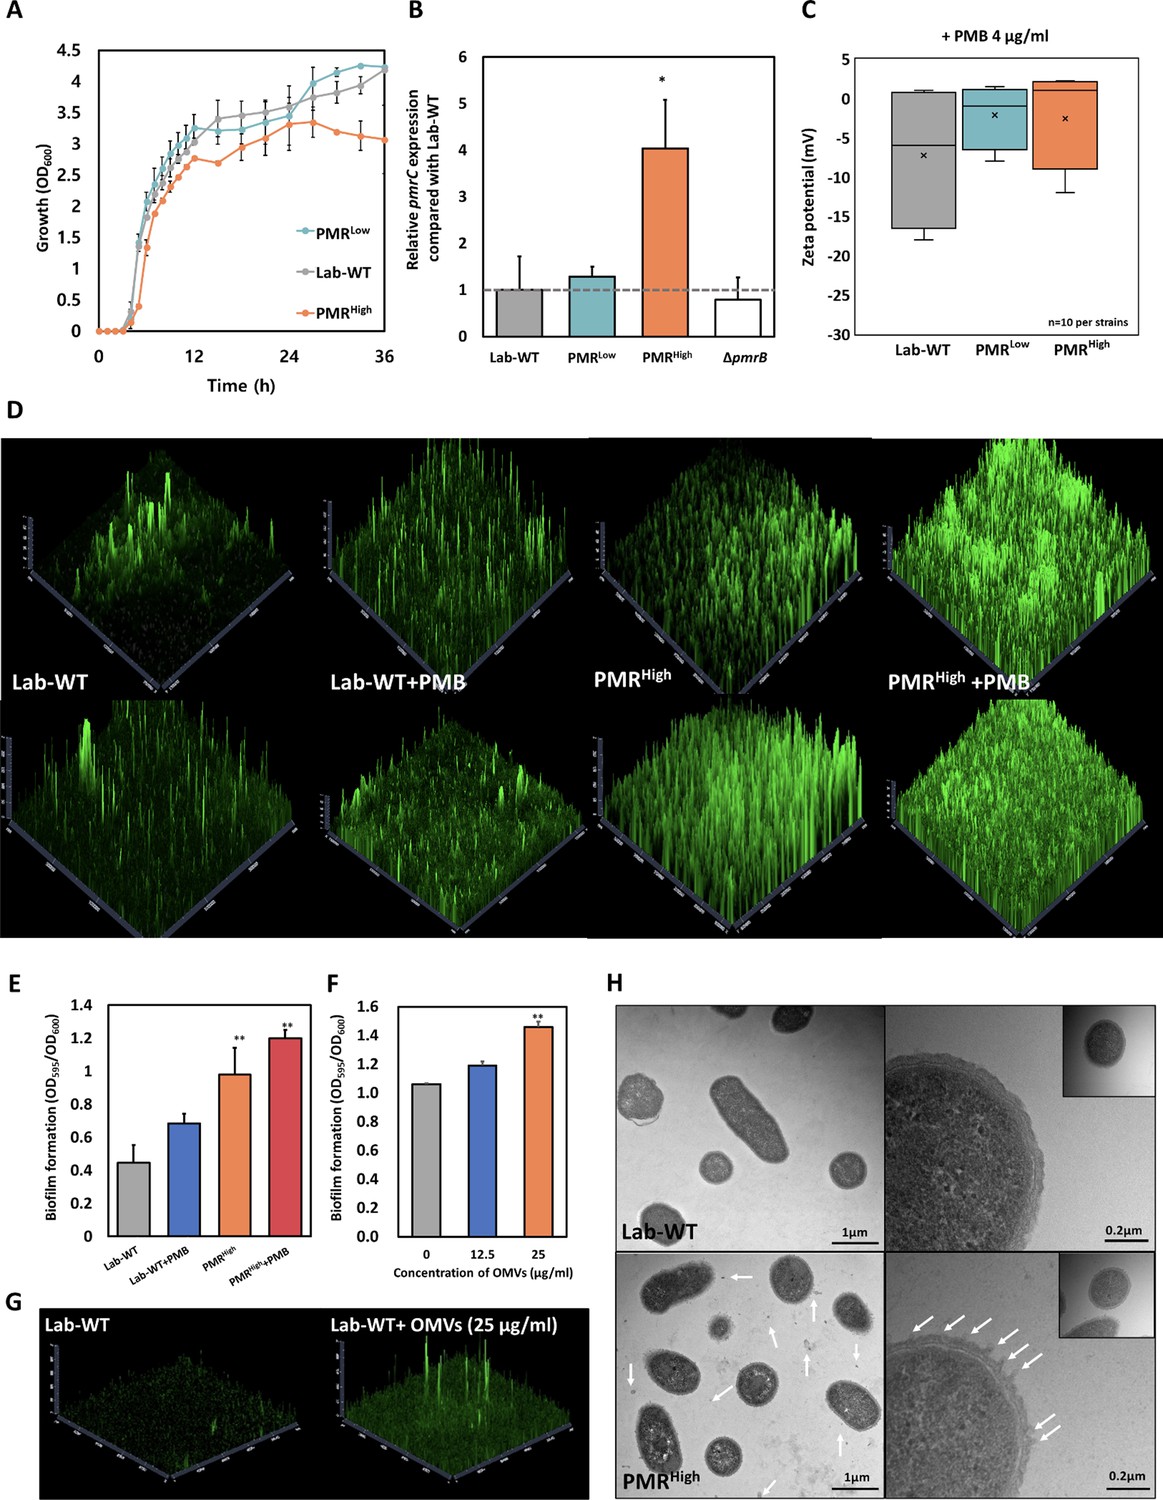
Growth, membrane charges, and biofilm formation of the experimentally evolved strains.
(A) Growth curves of WT strain and polymyxin B (PMB)-resistant mutants. All cells were initially inoculated using 106 cells in a 5 mL LB glass tube. Growth tests were carried out at 37°C for 36 hr. All experiments were conducted in three replicates (N = 3 biological replicates). (B) The qRT-PCR assay revealed strong induction of pmrC in PMRHigh strain. The expression analyses were conducted in all tested strains (Lab-WT, PMRLow, PMRHigh, and ΔpmrB strains). An asterisk indicates statistical significance at p<0.05 (N = 3 biological replicates). (C) Zeta-potential of Lab-WT, PMRLow, and PMRHigh strains (n = 10 each) under 4 μg/mL PMB-treated condition. (D) Biofilm formation was observed using confocal microscopy with FilmTracer. PMRHigh formed a thick and dense biofilm against Lab-WT. (E) Quantification of biofilm formation using the crystal violet assay with/without 1/2 minimum inhibitory concentration of PMB. (F) Quantification of biofilm formation after addition of the PMRHigh-driven outer membrane vesicles (OMVs) to Lab-WT cells. (G) Confocal images showing the PMRHigh-OMVs-driven biofilm formation. (H) Transmission electron microscopy images of the experimentally grown WT and PMRHigh cells at a low magnification. Cells were grown to the exponential phase in LB liquid medium.
Figure 1—figure supplement 2

Measurement of minimal inhibitory concentrations (MICs) in Lab-WT and polymyxin B-resistant cells (PMRLow and PMRHigh).
The MICs of antibiotics targeting different cellular components, including the cell membrane (colistin), cell wall (ampicillin, meropenem), ribosome (gentamycin, spectinomycin, kanamycin, chloramphenicol, and chlortetracycline), and RNA polymerase (rifampicin), were measured with three biological replicates.
Figure 2

Mass spectrometry and proposed structures of lipid A isolated from Lab-WT and PMRHigh.
(A) Lab-WT produced peaks at an m/z value of 1490, corresponding to bis-phosphorylated penta-acylated lipid A. (B) PMRHigh produced peaks at m/z values of 1490 and 1630, corresponding to bis-phosphorylated penta-acylated lipid A without/with one phosphoethanolamine group and -OH, respectively. (C) Raman spectra of single A. baumannii cells grown to the exponential phase in LB media. 15–20 single spectra were used to produce mean spectra. (D) Principal coordinate analysis (PCoA) demonstrated separation between Raman spectra of Lab-WT and PMRHigh. (E) Heterogeneity of the PCoA dots was analyzed.
Figure 3 with 2 supplements
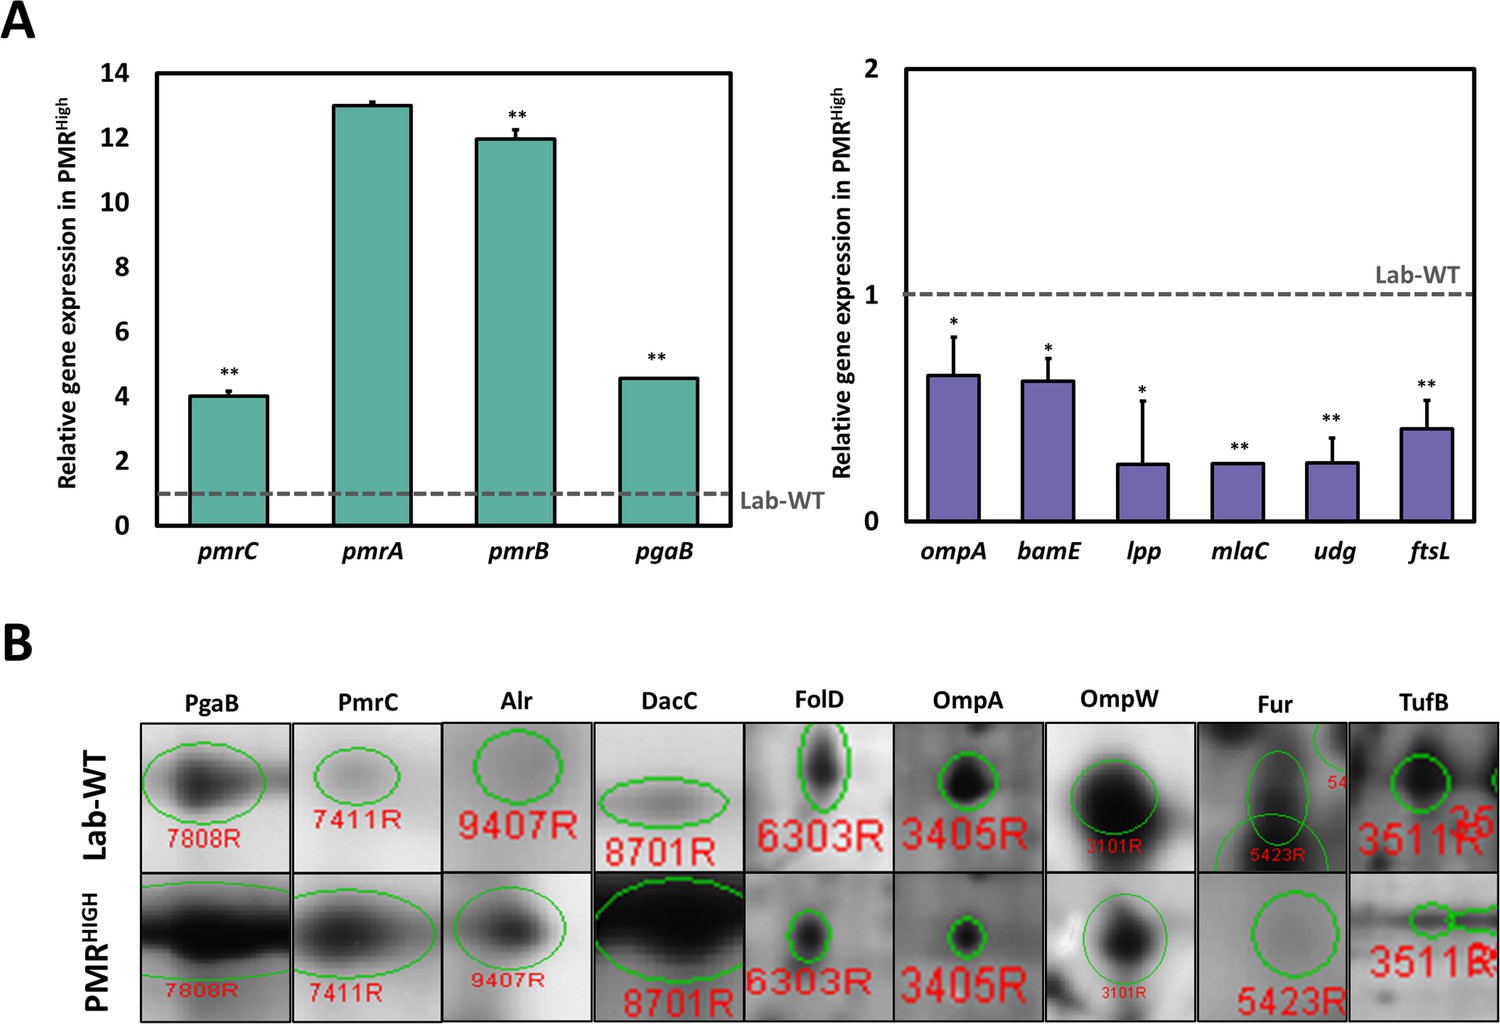
Integration of omics analysis in experimentally evolved strains and outer membrane vesicles (OMVs).
(A) The qRT-PCR assay was conducted in PMRHigh strain compared with Lab-WT. The expression of the strains was normalized to their respective 16S rRNA expression. All qRT-PCR procedures were conducted in triplicate from at least three independent cultures. (B) Two-dimensional gel electrophoresis image analysis of proteins expressing isolated OMVs from Lab-WT and PMRHigh strains (Figure 3—source data 2). The proteins were stained by colloidal Coomassie Brilliant Blue and analyzed by Image Master Platinum 5.0 image analysis program. The selected proteins indicated up- or down-expressed proteins in Lab-WT.
-
Figure 3—source data 1
The qRT-PCR assay in PMRHigh strain compared with Lab-WT.
- https://cdn.elifesciences.org/articles/66988/elife-66988-fig3-data1-v2.xlsx
-
Figure 3—source data 2
Images of selected spots in proteomics analysis (Lab-WT, Lab-WT + 1/2 minimum inhibitory concentration [MIC], PMRHigh and PMRHigh + 1/2 MIC).
- https://cdn.elifesciences.org/articles/66988/elife-66988-fig3-data2-v2.docx
-
Figure 3—source data 3
The data of two-dimensional gel electrophoresis analysis for identifying differentially expressed proteins in our isolated outer membrane vesicles collected from experimentally evolved strains.
- https://cdn.elifesciences.org/articles/66988/elife-66988-fig3-data3-v2.xlsx
Figure 3—figure supplement 1
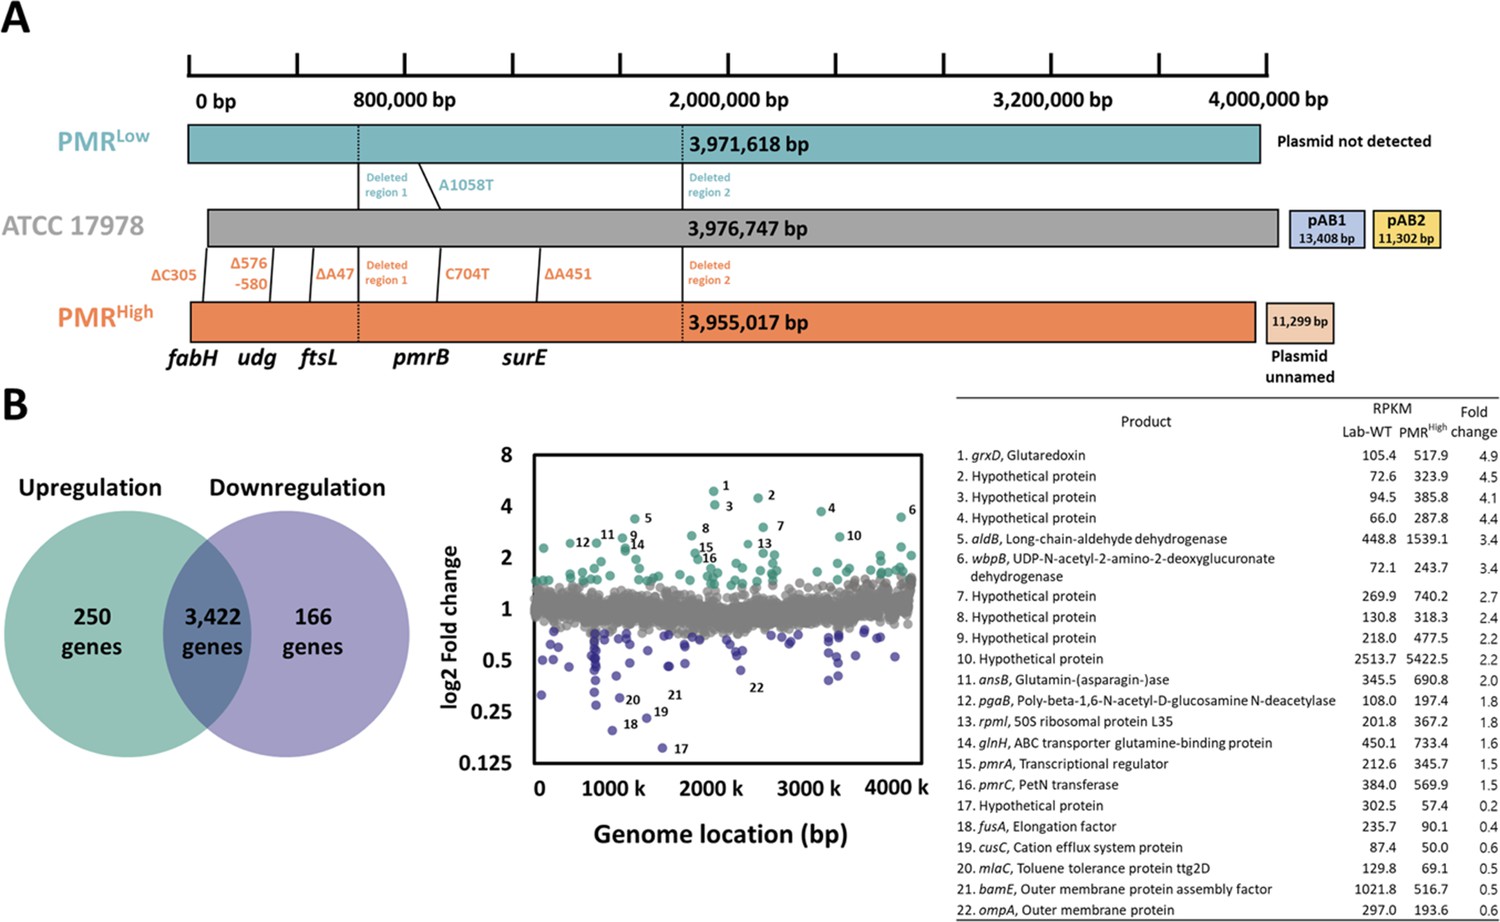
Genomics and transcriptomic analyses of experimentally evolved strains.
(A) Each bar indicates the size, mutational positions, deleted regions on chromosomes of all tested strains. The presence and size of plasmids are also indicated. The locations of mutational positions were identified using Murmer software, and additional PCR reactions using Pfu DNA polymerase were performed to confirm mutational positions listed in Supplementary file 1a (18 genes). (B) Up- and downregulated genes in PMRHigh compared to those of Lab-WT. The number of upregulated and downregulated genes (250 genes, upregulated; 166 genes, downregulated). No changes in the level of expression were observed for 3422 genes (0.7 < fold change < 1.4). The green and purple dots indicate the genes listed on the right side. X-axis and Y-axis represent the location of the genome and log2 fold change, respectively.
Figure 3—figure supplement 2
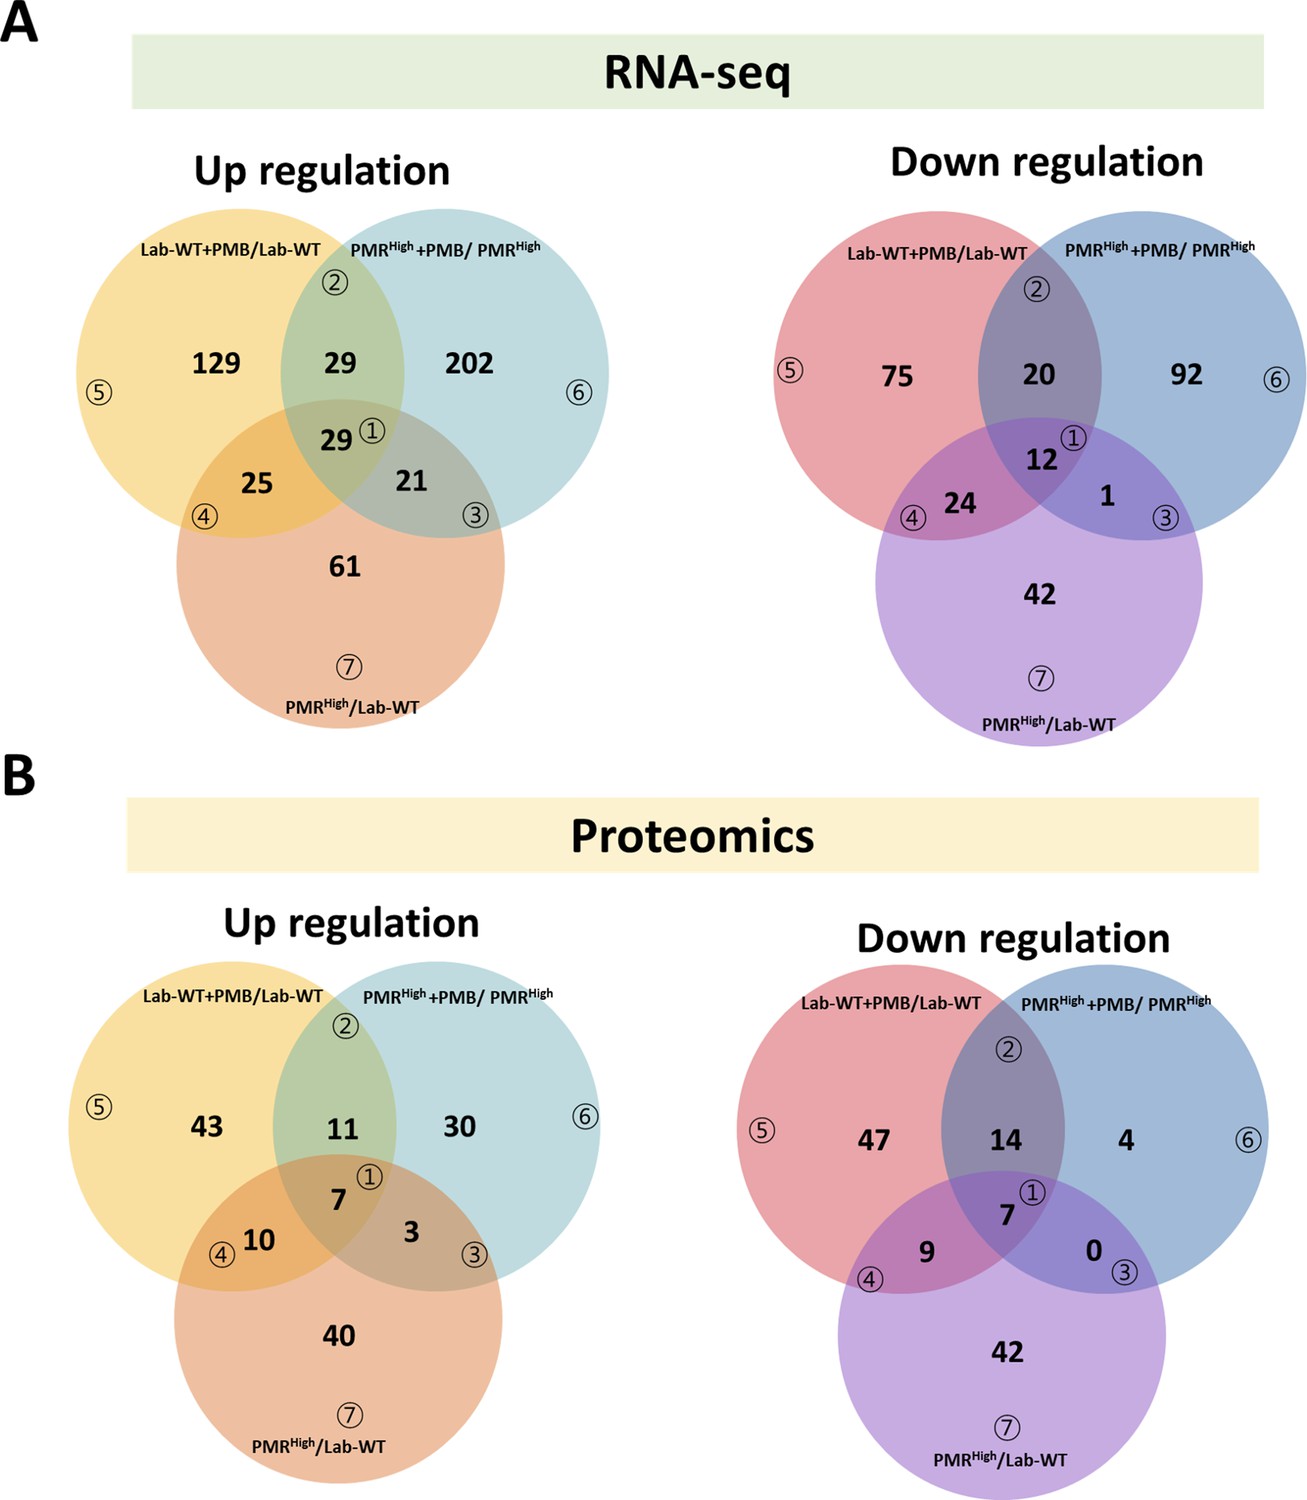
Transcriptome and proteome analyses of differential conditions.
(A) Each circle of the Venn diagrams represents the number of up- (fold change > 1.4, reads per kilobase of transcript per million mapped sequence reads [RPKM] > 50) or downregulated (fold change < 0.7, RPKM > 50) genes in comparison with the control as a result of RNA-seq. (B) Each circle of the Venn diagrams represents the number of up- (fold change > 2, intensity > 1000) or down-expressed (fold change < 0.5, intensity > 1000) protein spots in comparison with the control as a result of proteomics.
Figure 4 with 1 supplement
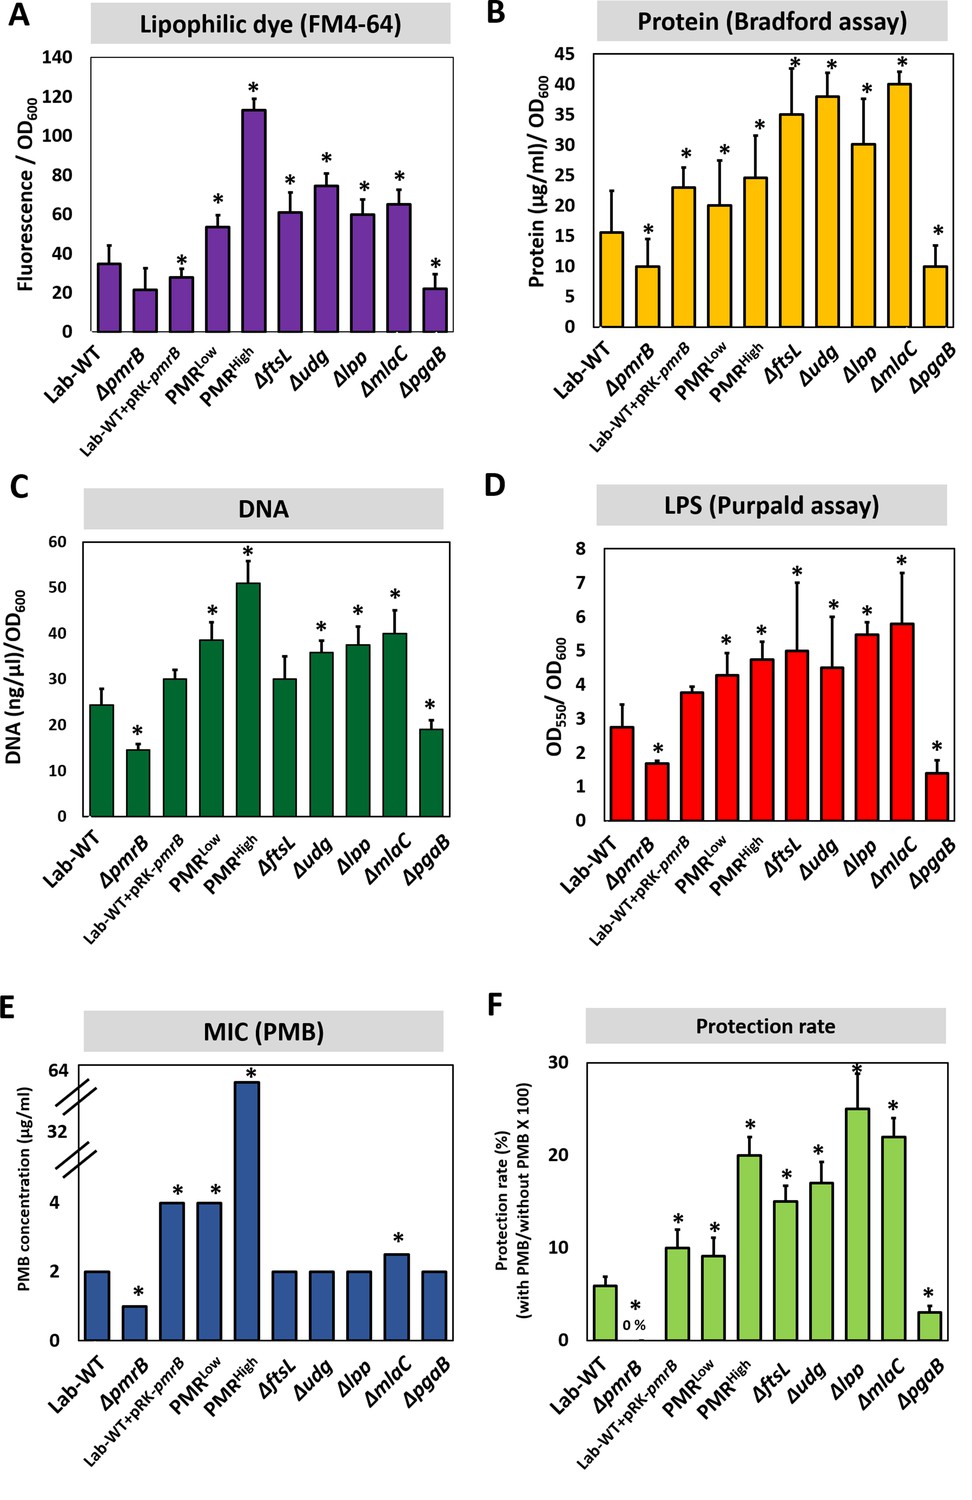
Polymyxin B (PMB) susceptibility test and outer membrane vesicle (OMV) production in experimentally evolved stains and mutants.
OMV production was analyzed for (A) lipids (lipophilic dye), (B) total protein (Bradford assay), (C) total DNA amount, and (D) lipopolysaccharide amount (purpald assay) in the exponential phase. Each measurement was normalized by the equivalent OD600. (E) The minimum inhibitory concentration (MIC) of PMB in each strain was tested. (F) Tendency for protecting cells grown in stationary phase from high PMB concentration (1/2 MIC of each clinical strain). No protection was observed in ΔpmrB. In all panels, an asterisk indicates statistical significance at p<0.05 (N = 3 biological replicates).
-
Figure 4—source data 1
Mutational analysis and quantification of outer membrane vesicle in mutants.
- https://cdn.elifesciences.org/articles/66988/elife-66988-fig4-data1-v2.xlsx
Figure 4—figure supplement 1
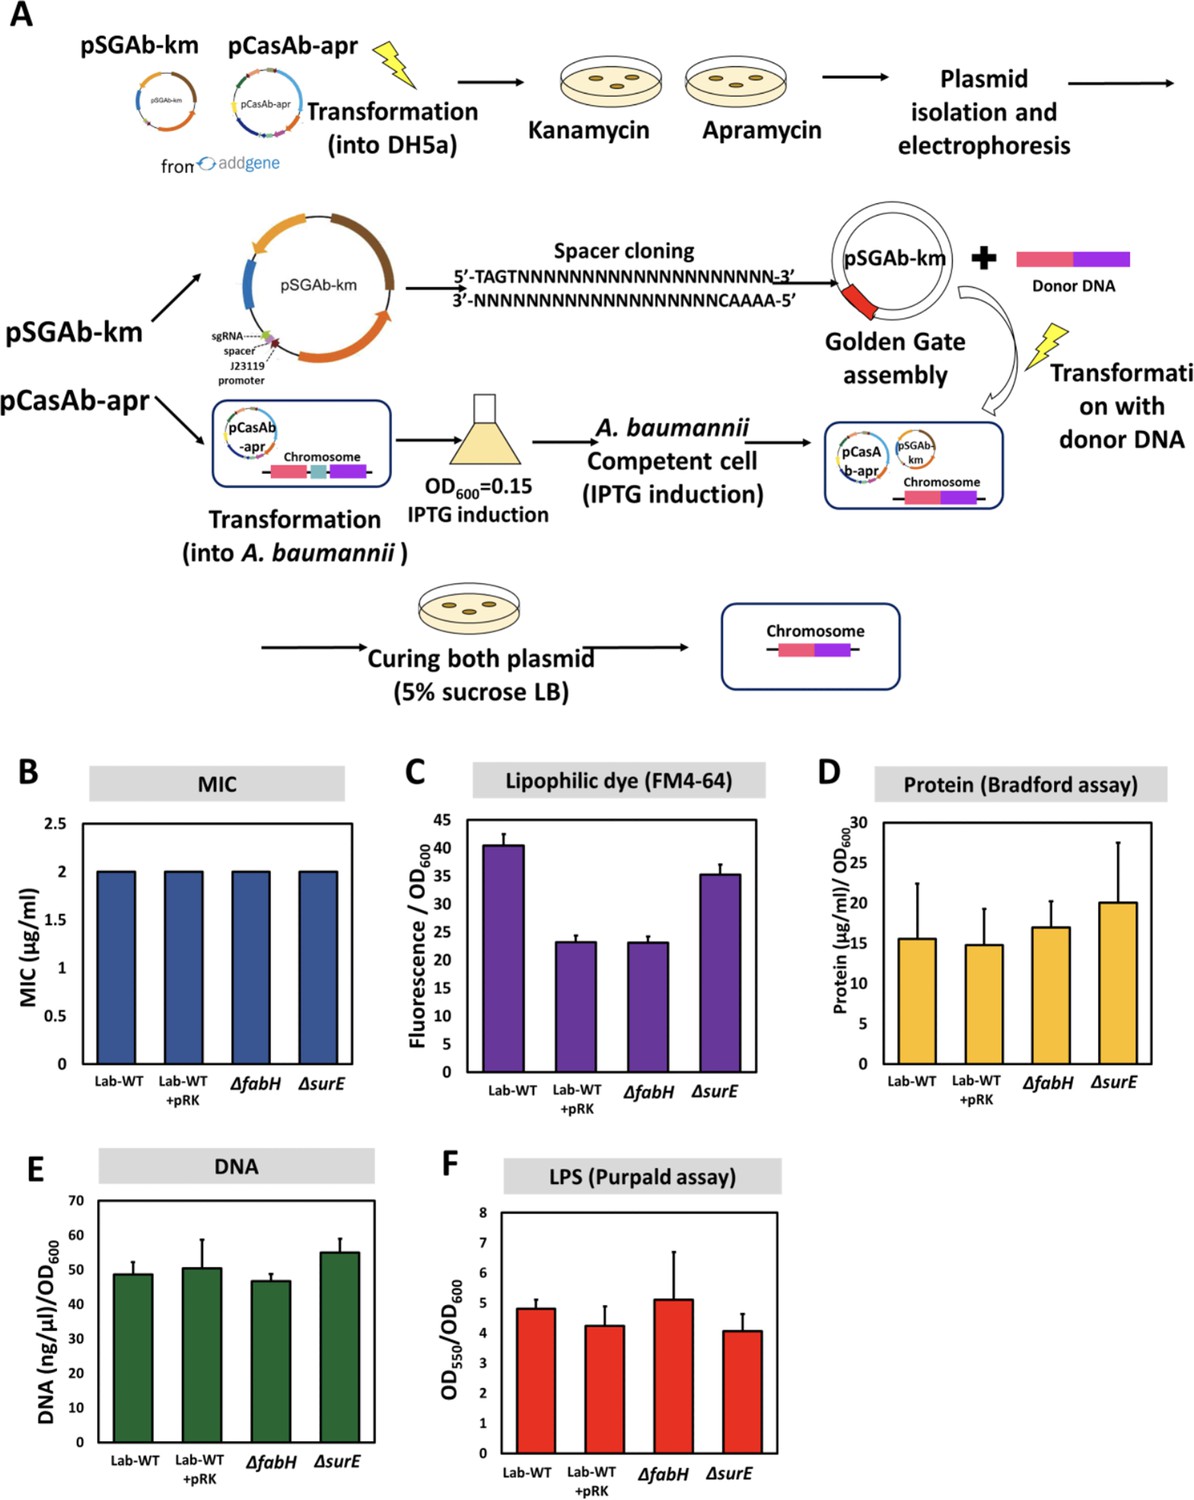
Generation of knockout mutants (ΔfabH and ΔsurE) and their outer membrane vesicle (OMV) production.
(A) Schematic diagram showing all procedures for the CRISPR-Cas9-based genome editing used in this study. (B) Minimum inhibitory concentrations of the knockout mutants and Lab-WT. OMVs were quantified using (C) lipophilic dye (FM4-64), (D) Bradford assay, (E) total DNA amounts, and (F) lipopolysaccharide amounts (purpald assay) (N = 3 biological replicates).
Figure 5 with 1 supplement
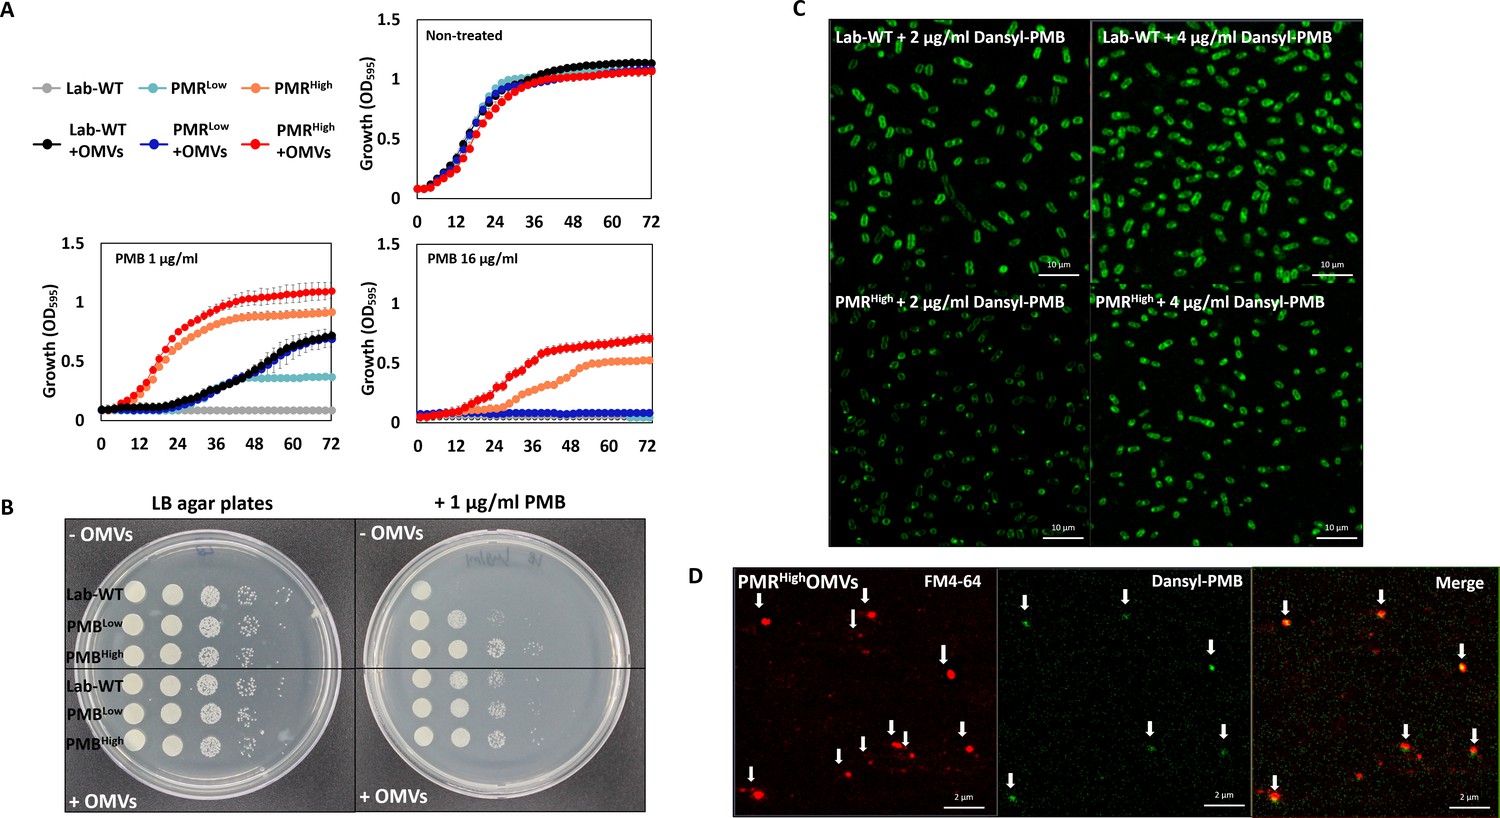
Protective effects of outer membrane vesicles (OMVs) in A. baumannii measured in vitro and visualization of the decoy role of OMVs.
(A) The results are shown after 72 hr. The Lab-WT, PMRLow, and PMRHigh strains were used to measure the protective effects of OMVs (N = 3 biological replicates). (B) Protective effects were measured after the addition of cell suspensions in LB medium with/without OMVs to polymyxin B (PMB)-containing agar. Images were obtained after 14 hr of incubation at 37°C. (C) Confocal laser scanning microscopy images of Lab-WT and PMRHigh treated with dansyl-PMB for 30 min at 37°C. (D) Isolated OMVs from PMRHigh were stained with FM4-64 and dansyl-PMB.
-
Figure 5—source data 1
The Lab-WT, PMRLow, and PMRHigh strains were used to measure the protective effects of outer membrane vesicles after 72 hr.
- https://cdn.elifesciences.org/articles/66988/elife-66988-fig5-data1-v2.xlsx
Figure 5—figure supplement 1
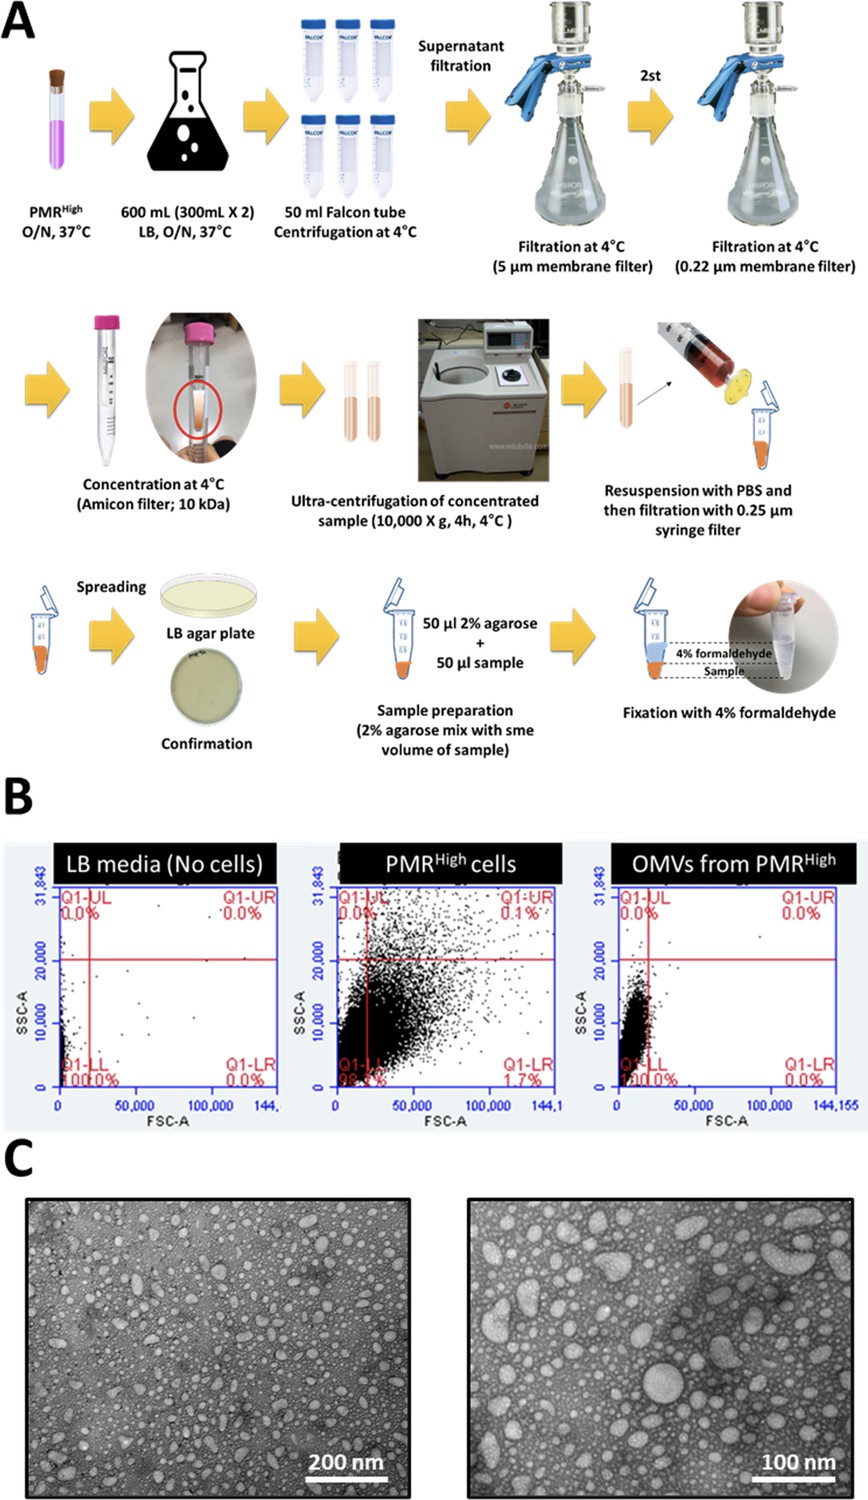
Procedures for collecting outer membrane vesicles (OMVs) and verifying extracted OMVs using fluorescence-activated cell sorting (FACS) and transmission electron microscopy (TEM).
(A) Detailed procedures for purifying OMVs after extracting them from the PMRHigh strains grown at 37°C for 14 hr with 220 rpm. (B) FACS analyses for the presence of OMVs in our collected samples. The X-axis represents the size (FSC) and the Y-axis represents the granularity (SSC), which can be used to distinguish the PMRhigh cells and OMVs. The threshold of FSC-A was 1000, and 10,000 cells were counted. (C) Isolated OMVs were identified using TEM. The scale represents 100 nm and 200 nm changes per positions, respectively.
Figure 6 with 1 supplement
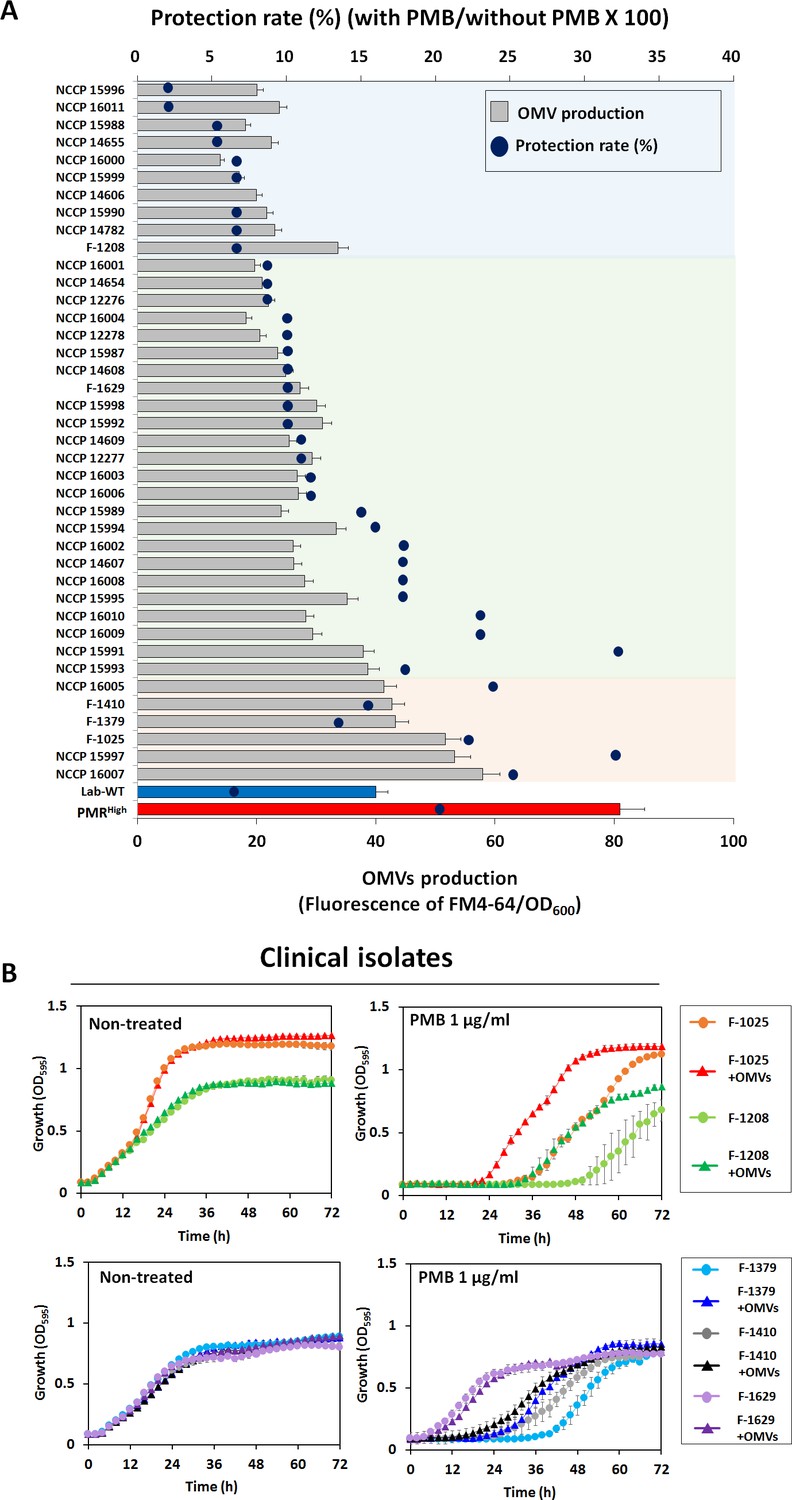
Outer membrane vesicle (OMV) production and protective effects in clinical isolates.
(A) Minimum inhibitory concentration value and OMV production were examined in 40 MDR clinical A. baumannii strains. Blue dots show the protection rate for treatment of 1/2 MIC polymyxin B (PMB) in each clinical isolate, and the bar graph shows the amount of OMVs in the early stationary phase (OD600 = 0.4). The colored area indicates degree of correlation between OMV production and protection rate in stationary phase-grown cells. Red area: strong correlation; green area: moderate correlation (N = 3 biological replicates). (B) Protective effects of OMVs in five clinical A. baumannii strains (F-1025, F-1208, F-1379, F-1410, and F-1629) measured using LB liquid medium without and with 1 μg/mL PMB after treatment with OMVs. The OD600 of the strains was measured in the wells of 96-well plates until 72 hr of incubation at 30°C (N = 3 biological replicates).
-
Figure 6—source data 1
Outer membrane vesicle production and protective effects in clinical isolates.
- https://cdn.elifesciences.org/articles/66988/elife-66988-fig6-data1-v2.xlsx
Figure 6—figure supplement 1
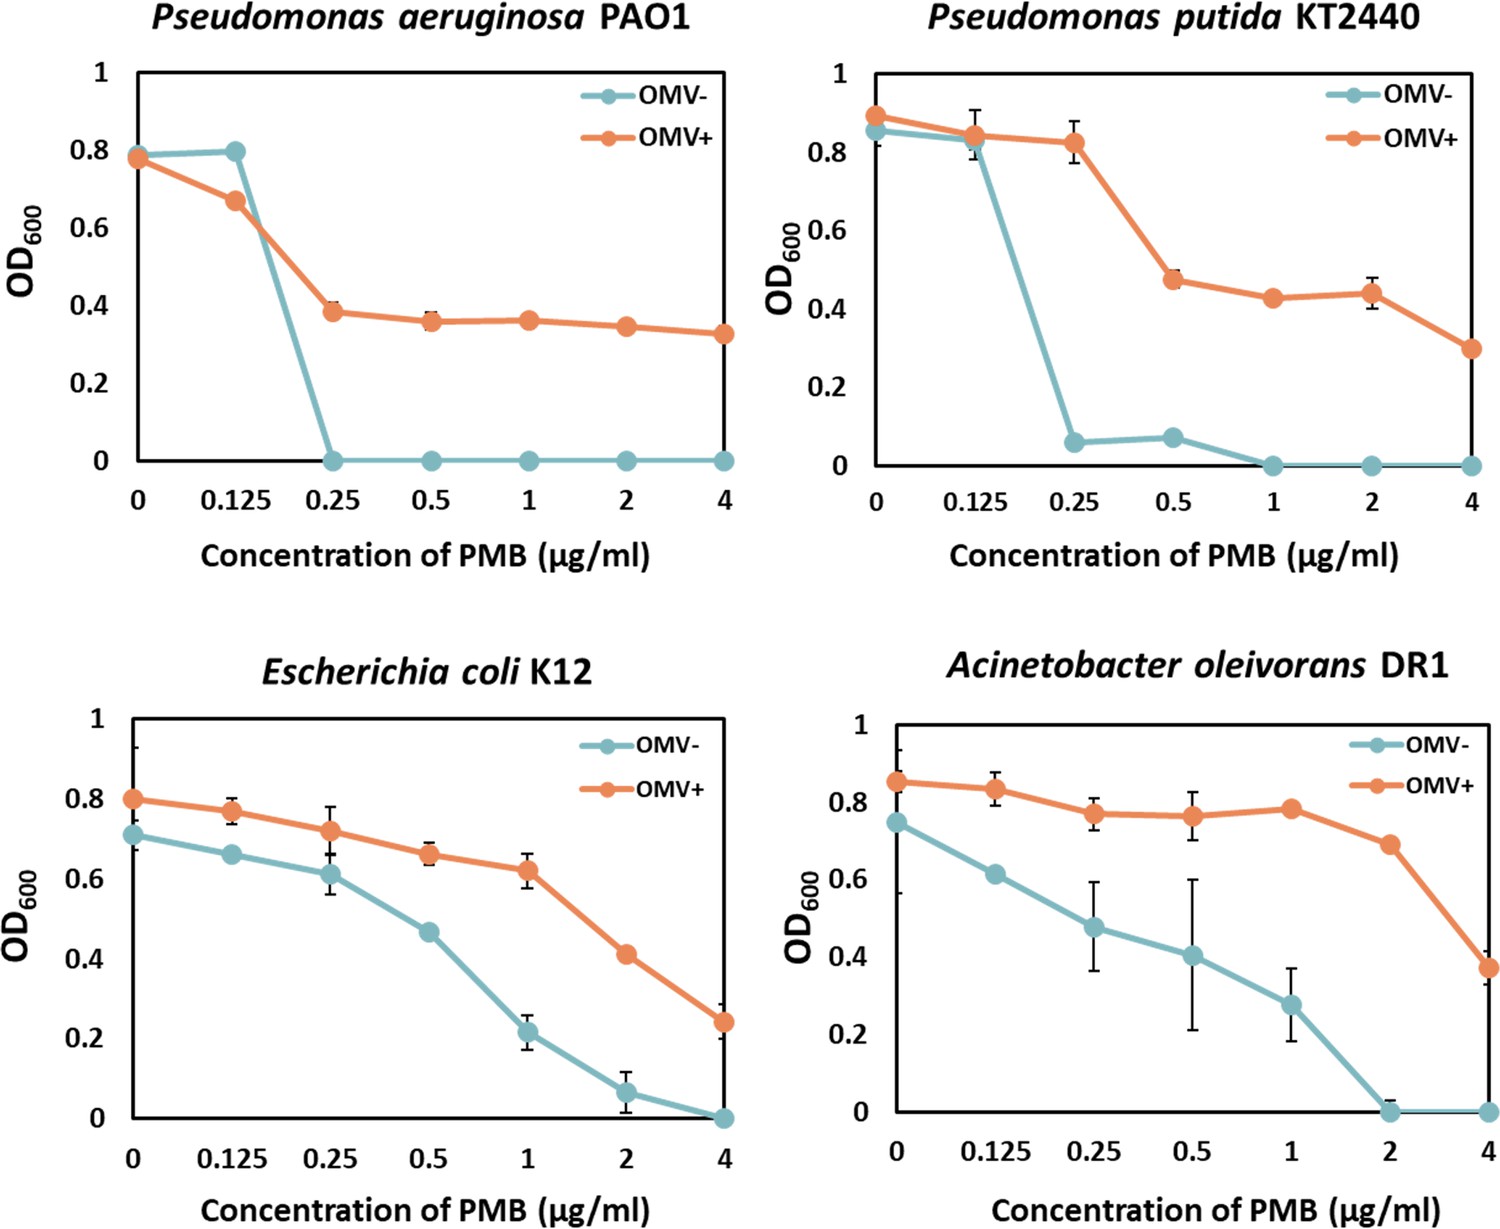
In vitro protective roles of outer membrane vesicles (OMVs) in other Gram-negative bacteria.
Polymyxin B (PMB)-killing effects were monitored using different concentrations of PMB (0, 0.125, 0.5 1, 2, and 4 μg/mL) in cell suspensions (106 CFU/mL) in the presence and absence of OMVs (25 μg/mL). All tested strains were incubated at 37°C for 24 hr. P. aeruginosa, P. putida, E. coli, and A. oleivorans strains were used to measure the protective effects of OMVs under PMB conditions (N = 3 biological replicates). The minimum inhibitory concentrations of PMB were 0.25, 1, 4, and 2 μg/mL in P. aeruginosa, P. putida, E. coli, and A. oleivorans strains, respectively.
Figure 7 with 1 supplement

Protective effects of outer membrane vesicles (OMVs) on human fecal microbiota and in G. mellonella infected with A. baumannii strains.
(A) The stacked bar plot shows the relative abundance of the microbiome at the genus level. The color keys indicate the 24 most abundant taxa. OMVs (25 μL/mL) were first added and allowed to stabilize, followed by incubation at 37°C after the addition of 4 μg/mL polymyxin B (PMB) for 3 hr. (B) The α-diversity analyses using rarefaction curves of operational taxonomic units for in vitro human fecal microbiota. (C) The principal coordinate analysis 3D plot of in vitro human fecal microbiota using log2-transformed Bray–Curtis distances. The distance between symbols on the ordination plot indicates the relative similarity in their community structures. (D) The growth curves of Enterococcus spp. under aerobic or anaerobic conditions. PMB treatment (4 μg/mL) was conducted daily for 5 days in identical conditions for analysis of the microbiome community (N = 3 biological replicates). (E) The G. mellonella-infection model was constructed to confirm the protective effects of OMV in vivo. 10 μL of OMVs, 106 CFU/mL of Lab-WT or PMRHigh, and 1 μg/mL PMB were mixed and injected through a syringe. For groups without OMVs, the same volume of phosphate-buffered saline was used. Mortality was defined as a lack of response or melanization for 96 hr in infected G. mellonella at 37°C (N = 3 biological replicates).
-
Figure 7—source data 1
Protective effects of outer membrane vesicles on human fecal microbiota and growth curve of Enterococcus spp. under aerobic or anaerobic conditions.
- https://cdn.elifesciences.org/articles/66988/elife-66988-fig7-data1-v2.xlsx
Figure 7—figure supplement 1
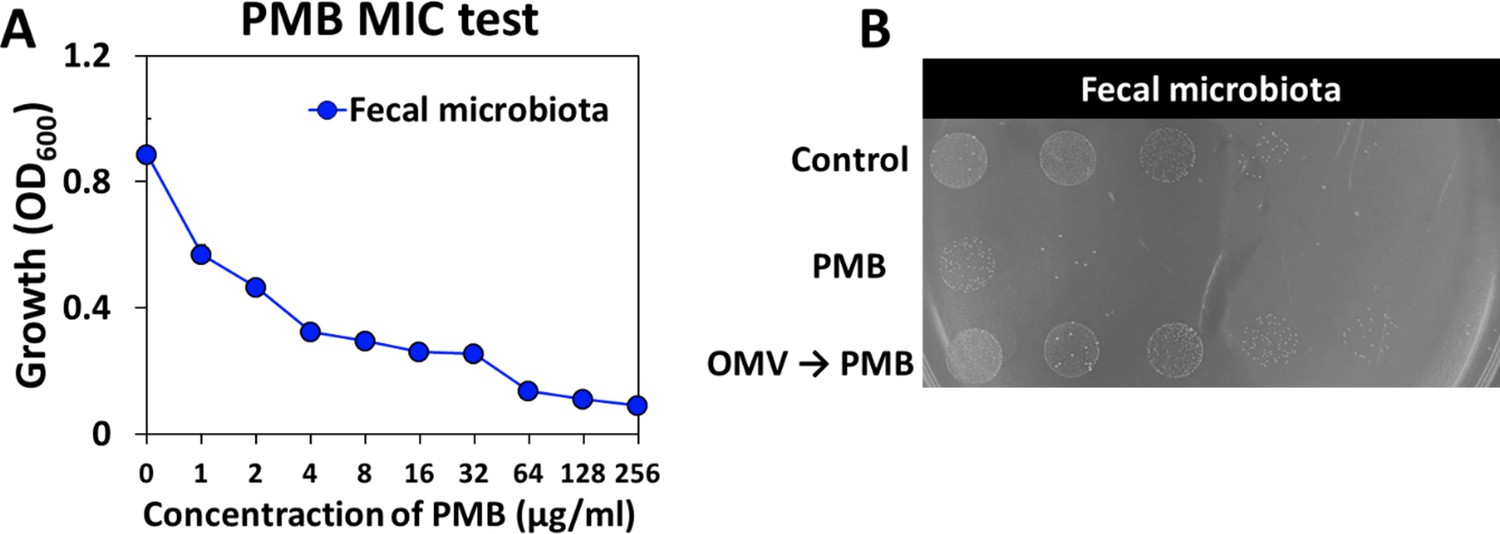
Measurement of community polymyxin B (PMB) minimum inhibitory concentration (MIC) in in vitro human fecal microbiota and protective effect of outer membrane vesicles (OMVs) under PMB conditions.
(A) MIC was measured using whole human fecal microbiota. (B) Protective role of OMVs under PMB conditions was tested by spotting whole community on LB medium with/without OMVs. Images were taken after 14 hr incubation at 37°C.
Tables
Key resources table
| Reagent type (species) or resource | Designation | Source or reference | Identifiers | Additional information |
|---|---|---|---|---|
| Strain, strain background (Escherichia coli) | DH5a | Thermo Fisher Scientific | 18265017 | |
| Strain, strain background (Escherichia coli) | S17-1λ pir | This laboratory | ||
| Strain, strain background (Acinetobacter baumannii ATCC 17978) | A. baumannii Lab-WT | This study | ||
| Strain, strain background (Acinetobacter baumannii Lab-WT) | A. baumannii PMRLow | This study | ||
| Strain, strain background (Acinetobacter baumannii Lab-WT) | A. baumannii (pRK-pmrB) | This study | ||
| Strain, strain background (Acinetobacter baumannii Lab-WT) | A. baumannii ΔpmrB | This study | CRISPR-Cas9 method | |
| Strain, strain background (Acinetobacter baumannii Lab-WT) | A. baumannii ΔftsL | This study | Single-crossover recombination method | |
| Strain, strain background (Acinetobacter baumannii Lab-WT) | A. baumannii Δlpp | This study | Single-crossover recombination method | |
| Strain, strain background (Acinetobacter baumannii Lab-WT) | A. baumannii ΔmlaC | This study | CRISPR-Cas9 method | |
| Strain, strain background (Acinetobacter baumannii Lab-WT) | A. baumannii ΔpgaB | This study | CRISPR-Cas9 method | |
| Strain, strain background (Acinetobacter baumannii Lab-WT) | A. baumannii Δudg | This study | Single-crossover recombination method | |
| Strain, strain background (Acinetobacter baumannii Lab-WT) | A. baumannii ΔfabH | This study | Homologous recombination method | |
| Strain, strain background (Acinetobacter baumannii Lab-WT) | A. baumannii ΔsurE | This study | Homologous recombination method | |
| Recombinant DNA reagent | pVIK112 (Plasmid) | This study | Addgene: Plasmid #V002240 | Produced by De Schamphelaire W et al. |
| Recombinant DNA reagent | pRK415 (Plasmid) | This study | Life Science Market Plasmid # PVT5709 | Produced by Keen NT et al. |
| Recombinant DNA reagent | pSGAb-km | Wang et al., 2019 | Addgene: Plasmid #121999 | Kmr, ColE1, WH1266 |
| Recombinant DNA reagent | pCasAb-apr | Wang et al., 2019 | Addgene: Plasmid #121998 | Aprr, oriV, broad-host-range vector |
| Commercial assay or kit | RNeasy Mini Kit | QIAGEN | 74104 | Accordance with the instructions of the manufacturer |
| Commercial assay or kit | FastDNA spin kit | MP Biomedicals | 116540600-CF | Accordance with the instructions of the manufacturer |
| Chemical compound, drug | Polymyxin B (PMB) | Sigma-Aldrich | P4932-1MU | Targets LPS |
| Chemical compound, drug | Kanamycin | Sigma-Aldrich | B5264 | Targets RNA |
| Chemical compound, drug | Apramycin | Sigma-Aldrich | A2024-1G | Targets RNA |
| Chemical compound, drug | IPTG | Gold Bio | I2481C | Induces gene expression |
| Chemical compound, drug | FM 4-64 | Thermo Fisher Scientific | T3166 | Fluoresces when bound to phospholipids |
| Chemical compound, drug | Danysl-chloride | Sigma-Aldrich | D2625-1G | |
| Chemical compound, drug | FilmTracer SYPRO Ruby | Invitrogen | F10318 | |
| Software, algorithm | CLC Genomics Workbench v.10.0.1 | QIAGEN | ||
| Software, algorithm | MUMmer | http://mummer.sourceforge.net/ | ||
| Software, algorithm | IS finder | https://isfinder.biotoul.fr/blast.php | ||
| Software, algorithm | EzGenome | http://ezgenome.ezbiocloud.net/ezg_browse | ||
| Software, algorithm | Snapgene | https://www.snapgene.com/ |
Additional files
-
Supplementary file 1
Tables listing genomic and trasncriptomic data, antibiotic resistance of all tested isolates, and oligonucleotide sequences used in this study.
(a) Findings from sequence analysis of mutated genes in the genomes of PMRLow and PMRHigh isolates. Mutations were identified using the MUMmer program. Additional PCR reactions using Pfu DNA polymerase were performed to confirm mutational positions. All position numbers are based on the genes of A. baumannii ATCC 17978. (b) Whole-genome sequence analyses of Lab-WT, PMRLow, and PMRHigh isolates using the PacBio sequencing technique. The genome sequences were downloaded from EzGenome and then their chromosomes were analyzed using the CLgenomics program. (c) Lists of deleted regions in the chromosomes of PMRLow and PMRHigh. The genome sequences were compared to the reference genome, A. baumannii ATCC 17978, and whole genomes were aligned using Snapgene. (d) Identification of antibiotic-resistance genes (ARGs) in Lab-WT, PMRLow, and PMRHigh strains. Totally 20 ARGs were detected using the CLC Genomics Workbench v.10.0.1 (QIAGEN, Germany). (e) Identification of insertion sequence (IS) elements in the Lab-WT, PMRLow, and PMRHigh. All parameters were set as default. IS elements were analyzed using the IS finder (https://isfinder.biotoul.fr/blast.php). (f) All information on the acquisition of RNA-seq data in this study. Total RNAs were extracted from exponentially grown Lab-WT, Lab-WT strain + polymyxin B (PMB), PMRHigh and PMRHigh strain + PMB. RPKM represents reads per kilobase of transcript per million mapped sequence reads. (g) List of genes that were up- or downregulated in PMRHigh, Lab-WT + PMB, and PMRHigh + PMB in comparison with control strains. Up- (fold change > 1.4, RPKM > 50) or downregulated (fold change < 0.7, RPKM > 50) genes were indicated. The intersection area and numbers are described in Figure 3—figure supplement 1. All locus tags are based on the genes of A. baumannii ATCC 17978. *TM = transmembrane region, ND = not detected. (h) Relative abundance of proteins in three conditions that increased outer membrane vesicles (OMVs): Lab-WT + PMB, PMRHigh + PMB, and PMRHigh strains compared to Lab-WT and PMRHigh. The quantity of protein in each spot was normalized to the total valid spot intensity. By comparing each gel image of proteins in strains under overproduction of OMVs, significantly changed spots were selected based on up- (fold change > 2, intensity > 1000) or down-expressed (fold change < 0.5, intensity > 1000) protein. The total number of final selected proteins for MALDI-TOF analysis was 43 spots. *ND = not detected. (i) Minimum inhibitory concentrations (MICs) of antibiotics used in this study. (j) Bacterial strains, plasmids, and primers used in this study. (k) Primers used in this study. Additional PCR reactions using Pfu DNA polymerase were performed for confirming mutational positions listed in (a) (18 genes).
- https://cdn.elifesciences.org/articles/66988/elife-66988-supp1-v2.docx
-
Transparent reporting form
- https://cdn.elifesciences.org/articles/66988/elife-66988-transrepform-v2.docx
Download links
A two-part list of links to download the article, or parts of the article, in various formats.
Downloads (link to download the article as PDF)
Open citations (links to open the citations from this article in various online reference manager services)
Cite this article (links to download the citations from this article in formats compatible with various reference manager tools)
A novel decoy strategy for polymyxin resistance in Acinetobacter baumannii
eLife 10:e66988.
https://doi.org/10.7554/eLife.66988


