The anterior cingulate cortex and its role in controlling contextual fear memory to predatory threats
- Department of Anatomy, Institute of Biomedical Sciences, University of São Paulo, Brazil
- Department of Physiology and Biophysics, Institute of Biomedical Sciences, University of São Paulo, Brazil
- Cellular and Molecular Neurobiology Laboratory (LaNeC) - Center for Mathematics, Computing and Cognition (CMCC), Federal University of ABC, Brazil
Figures
Figure 1
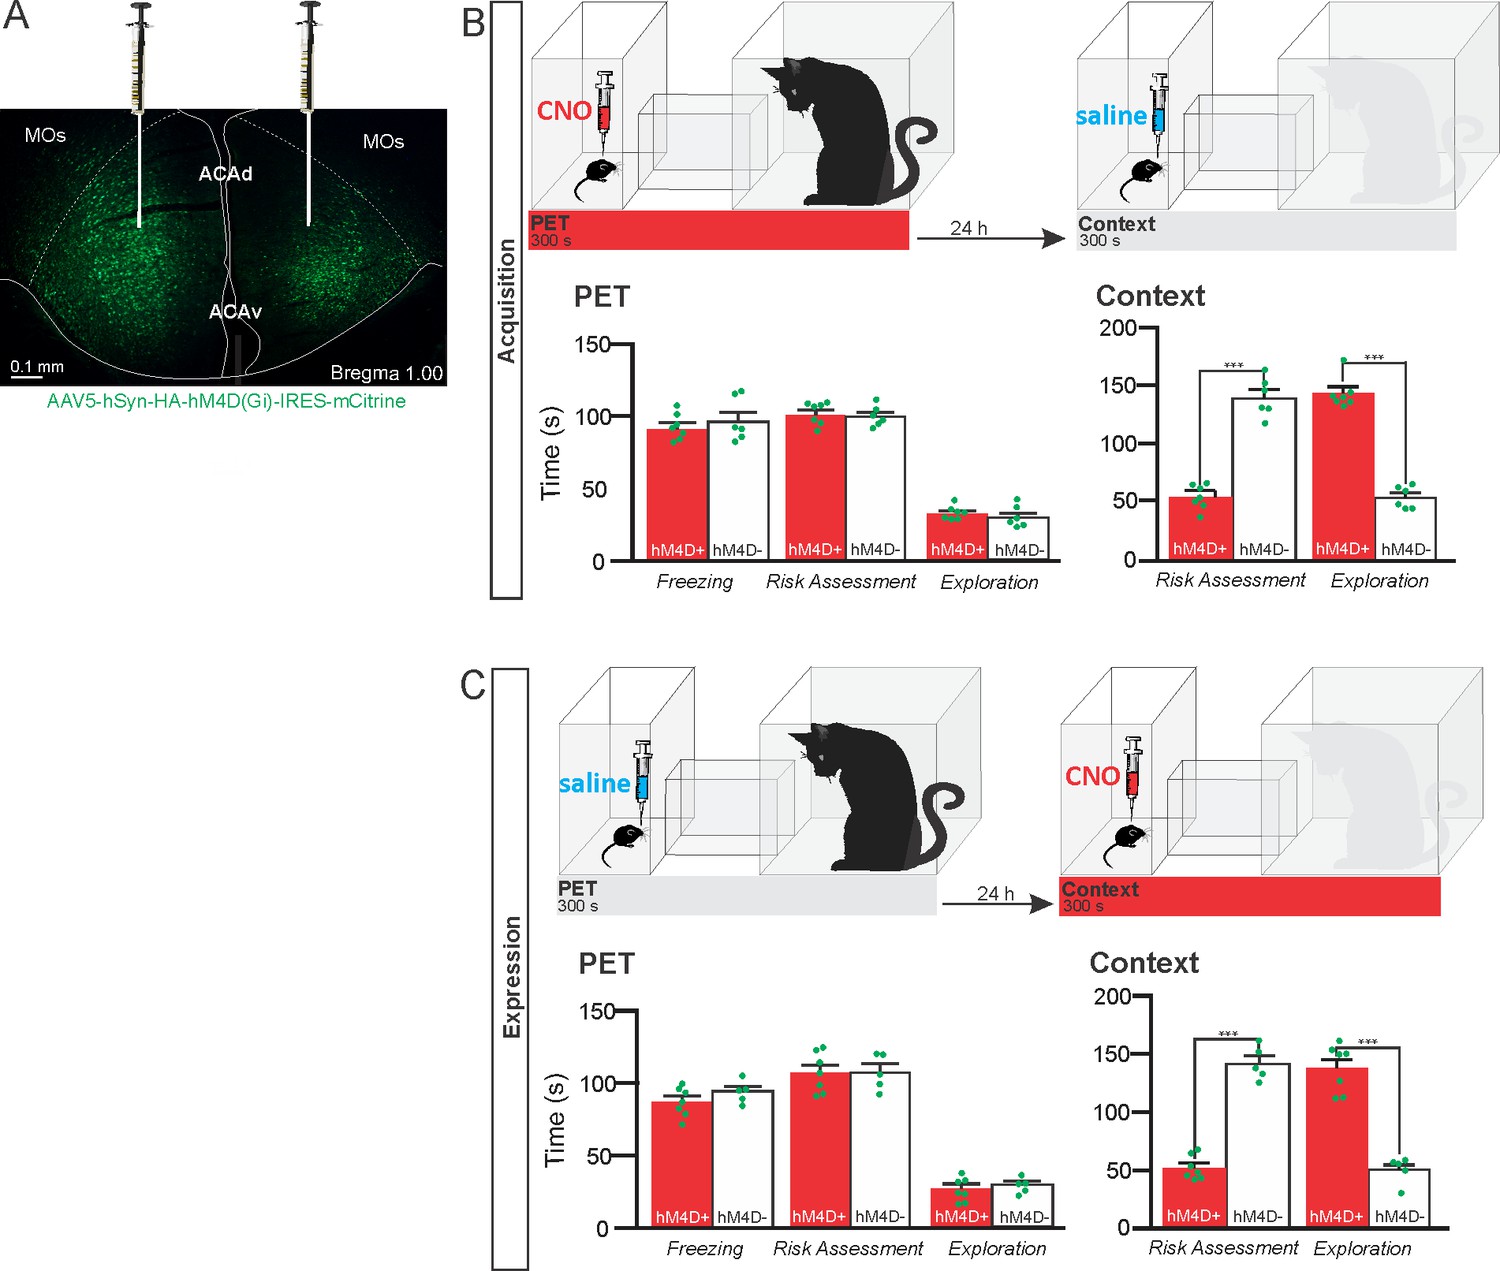
Pharmacogenetic inhibition of the ACA during acquisition and expression of contextual fear to predator threat.
(A) Fluorescence photomicrograph illustrating the bilateral injection in the ACA of a viral vector expressing inhibitory DREADD (hM4D Gi) fused with mCitrine. (B) Pharmacogenetic inhibition of the ACA during the cat exposure (acquisition phase): (top) Experimental design, and (bottom) raw (dots) and mean (± SEM) values of the behavioral responses during Predator Exposure (PET) and Predatory Context (Context). For inhibition during PET- Groups: hM4D+ (n=7) and hM4D− (n=6). (C) Pharmacogenetic inhibition of the ACA during the predatory context (expression phase): (top) Experimental design, and (bottom) raw (dots) and mean (± SEM) values of the behavioral responses during Predator Exposure (PET) and Predatory Context (Context). For inhibition during Context – Groups: hM4D+ (n=7) and hM4D− (n=5). Data are shown as raw (dots) and mean (± SEM) values. For the freezing, a 2×2 ANOVA revealed neither main effects for the factors virus (hM4D+ and hM4D−, F[1,21]=1.67; p=0.21; η2p=0.073) and phase of treatment (CNO/PET and CNO/Context, F[1,21]=1.12; p=0.30; η2p=0.051) nor an interaction between them (F[1,21]=0.064; p=0.803; η2p=0.003). For the risk assessment, a three-way ANOVA revealed a significant main effect for the factor virus (hM4D+ and hM4D−, F[1,21]=200.75; p<0.001; η2p=0.905), no main effect for the factors phase of treatment (CNO/PET and CNO/Context, F[1,21]=1.01; p=0.32; η2p=0.046) and exposure (PET and Context, F[1,21]=3.47; p=0.07; η2p=0.142), and a significant interaction between the factors virus and exposure (F[1,21]=144.5; p<0.001; η2p=0.873). Post hoc pairwise comparisons (Tukey’s HSD test) for the animals tested during the predatory context revealed for the hM4D+ animals that received CNO during cat exposure (B) and the hM4D+ group that received CNO during the predatory context (C) a significant decrease in risk assessment compared to the control hM4D− group (***p<0.001). For the relaxed exploration, a three-way ANOVA revealed a significant main effect for the factors virus (hM4D+ and hM4D−, F[1,21]=178.74; p<0.001; η2p=0.895) and exposure (PET and Context, F[1,21]=429.58; p<0.001; η2p=0.953), but no main effect for the factor phase of treatment (CNO/PET and CNO/Context, F[1,21]=1.41; p=0.25; η2p=0.063), and a significant interaction between the factors virus and exposure (F[1,21]=188.22; p<0.001; η2p=0.899). Post hoc pairwise comparisons (Tukey’s HSD test) for the animals tested during the predatory context revealed for the hM4D+ animals that received CNO during cat exposure (B) and the hM4D+ group that received CNO during the predatory context (C) a significant increase in relaxed exploration compared to the control hM4D− group (***p<0.001). Abbreviations: ACAd, anterior cingulate area, dorsal part; ACAv, anterior cingulate area, ventral part; CNO, clozapine N-oxide; MOs, secondary motor area; PET, predator exposure test.
-
Figure 1—source data 1
Spreadsheet of raw values for panels (B) and (C).
- https://cdn.elifesciences.org/articles/67007/elife-67007-fig1-data1-v1.docx
Figure 2

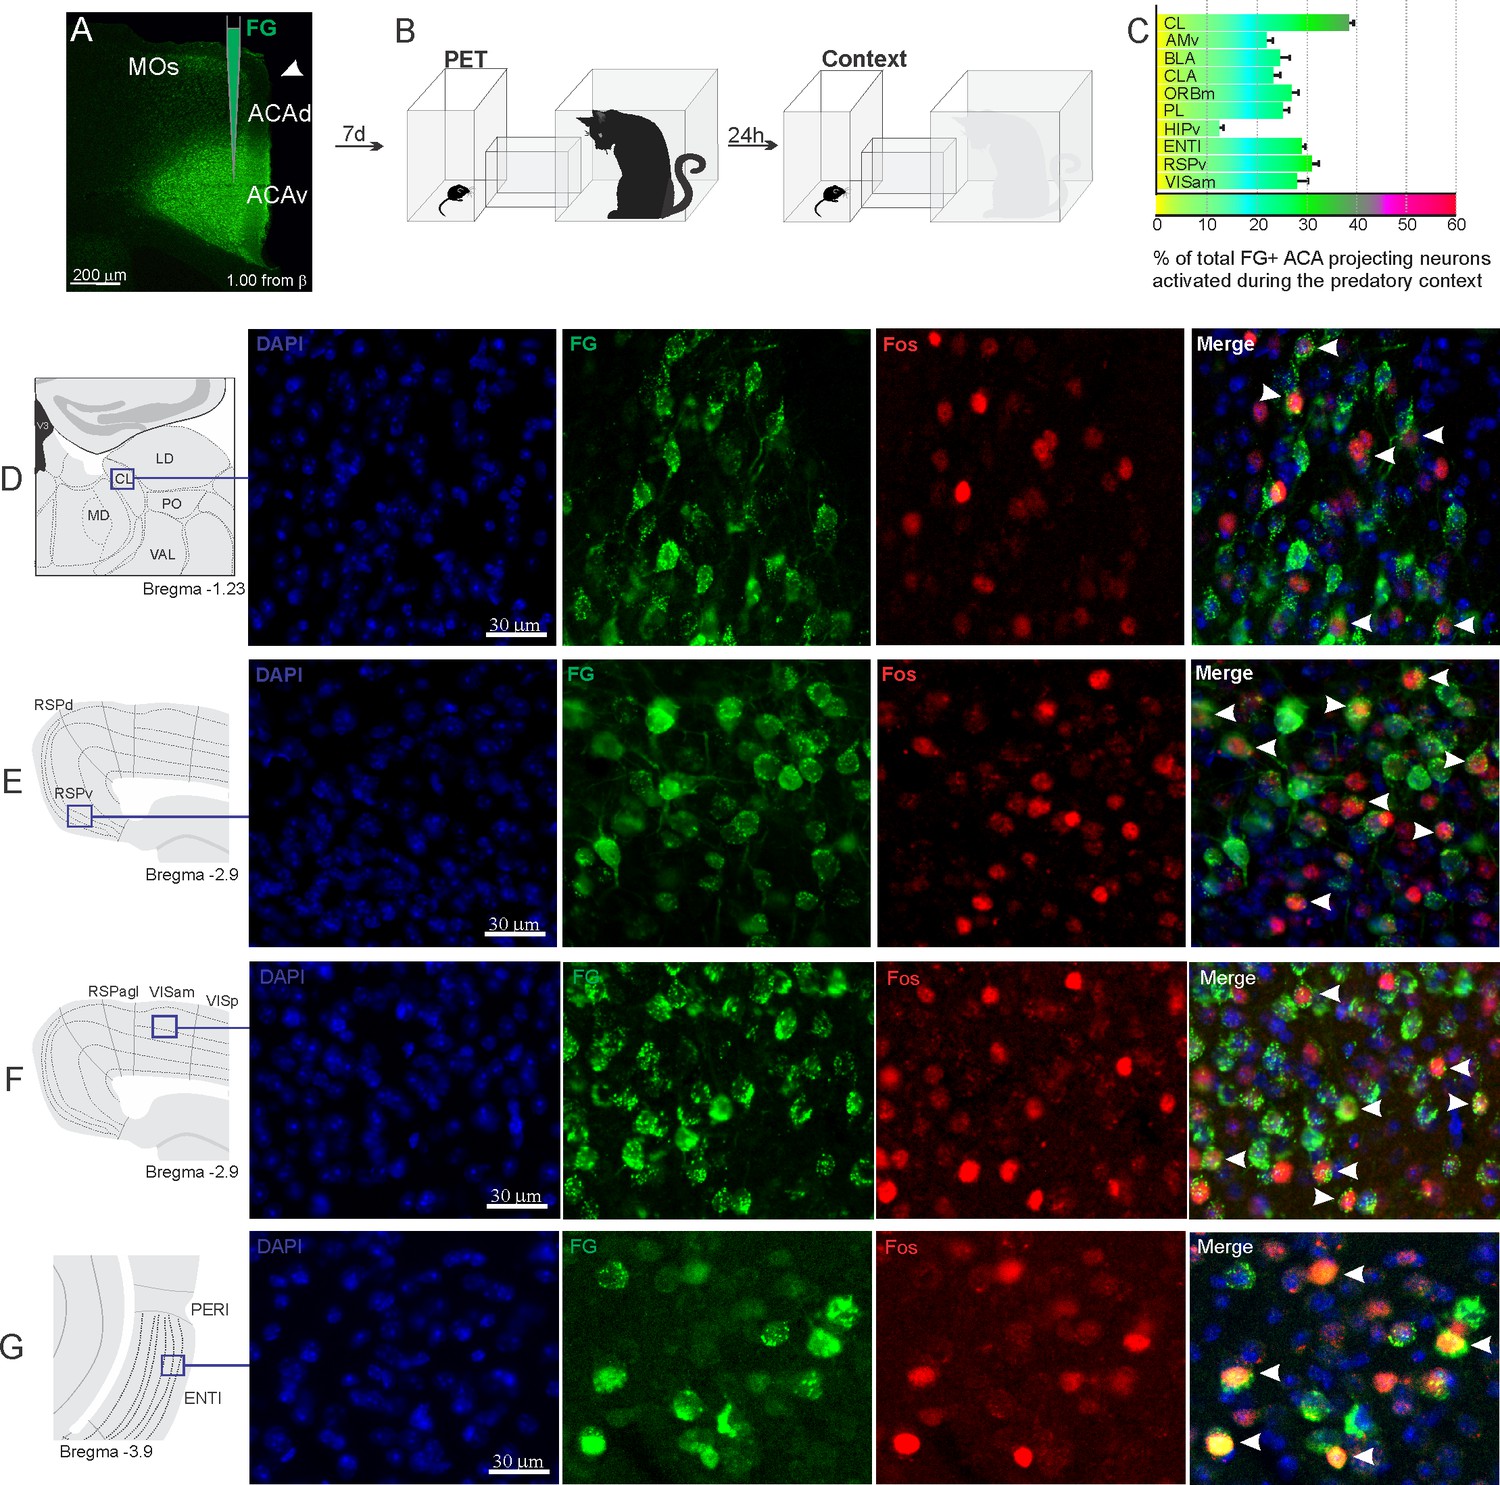
Pattern of activation of the different sources of inputs to the ACA during the exposure to the cat.
Animals received unilateral deposit of a retrograde tracer (Fluoro Gold) in the ACA (n=6, A).After 7 days, animals were exposed to the cat (PET, B) and perfused 90 min after. (C) Bar chart presents, for each designated structure, the proportion of activated neurons (FG/Fos double-labeled cells) during the PET condition, among the total of FG retrogradely labeled cells (error bars indicate 95% confidence interval for a proportion). (D–G) Schematic drawings from the Allen Mouse Brain Atlas to show the sites containing the largest proportion of FG/Fos double-labeled cells, followed by fluorescence photomicrographs illustrating DAPI-staining, FG-labeled cells in green (Alexa 488), Fos protein positive cells labeled in red (Alexa 594) and merged view of the FG and FOS labeled cells, where arrow heads indicate FG/FOS double-labeled cells. Abbreviations: ACAd, anterior cingulate area, dorsal part; ACAv, anterior cingulate area, ventral part; AMd, anteromedial thalamic nucleus, dorsal part; AMv, anteromedial thalamic nucleus, ventral part; AV, anteroventral nucleus of thalamus; BLA, basolateral amygdalar nucleus; CL, central lateral nucleus of the thalamus; CLA, claustrum; ENTl, entorhinal area, lateral part; FG, Fluoro gold; HIPv, hippocampus, ventral part; LD, lateral dorsal nucleus of the thalamus; MD, mediodorsal nucleus of the thalamus; MOs, secondary motor area; ORBm, orbital area, medial part; PET, predator exposure test; PL, prelimbic area; PO, posterior complex of the thalamus; RE, nucleus of reuniens; RSPagl, retrosplenial area, lateral agranular part; RSPd, retrosplenial area, dorsal part; RSPv, retrosplenial area, ventral part; RT, reticular nucleus of the thalamus; VAL, ventral anterior-lateral complex of the thalamus; VISam, anteromedial visual area; VISp, primary visual area.
-
Figure 2—source data 1
Spreadsheet of raw values for panel (C).
- https://cdn.elifesciences.org/articles/67007/elife-67007-fig2-data1-v1.docx
Figure 3
Pattern of activation of the different sources of inputs to the ACA during the exposure to predatory context.
Animals received unilateral deposit of a retrograde tracer (Fluoro Gold) in the ACA (n=6, A).After 7 days, animals were exposed to the cat (PET) and 24 hr later to the Predatory Context (B) and perfused 90 min after. (C) Bar chart presents, for each designated structure, the proportion of activated neurons (FG/Fos double-labeled cells) during the Context condition, among the total of FG retrogradely labeled cells (error bars indicate 95% confidence interval for a proportion). (D–G) Schematic drawings from Allen Mouse Brain Atlas to show the sites containing the largest proportion of FG/Fos double-labeled cells, followed by fluorescence photomicrographs illustrating DAPI-staining, FG-labeled cells in green (Alexa 488), Fos protein positive cells labeled in red (Alexa 594), and merged view of the FG and FOS labeled cells, where arrow heads indicate FG/FOS double-labeled cells. Abbreviations: ACAd, anterior cingulate area, dorsal part; ACAv, anterior cingulate area, ventral part; AMv, anteromedial thalamic nucleus, ventral part; BLA, basolateral amygdalar nucleus; CL, central lateral nucleus of the thalamus; CLA, claustrum; ENTl, entorhinal area, lateral part; FG, Fluoro gold; HIPv, hippocampus, ventral part; LD, lateral dorsal nucleus of the thalamus; MD, mediodorsal nucleus of the thalamus; MOs, secondary motor area; ORBm, orbital area, medial part; PET, predator exposure test; PERI, perirhinal area; PO, posterior complex of the thalamus; PL, prelimbic area; RSPagl, retrosplenial área, lateral agranular part; RSPd, retrosplenial area, dorsal part; RSPv, retrosplenial area, ventral part; VAL, ventral anterior-lateral complex of the thalamus; VISam, anteromedial visual area; VISp, primary visual area.
-
Figure 3—source data 1
Spreadsheet of raw values for panel (C).
- https://cdn.elifesciences.org/articles/67007/elife-67007-fig3-data1-v1.docx
Figure 4
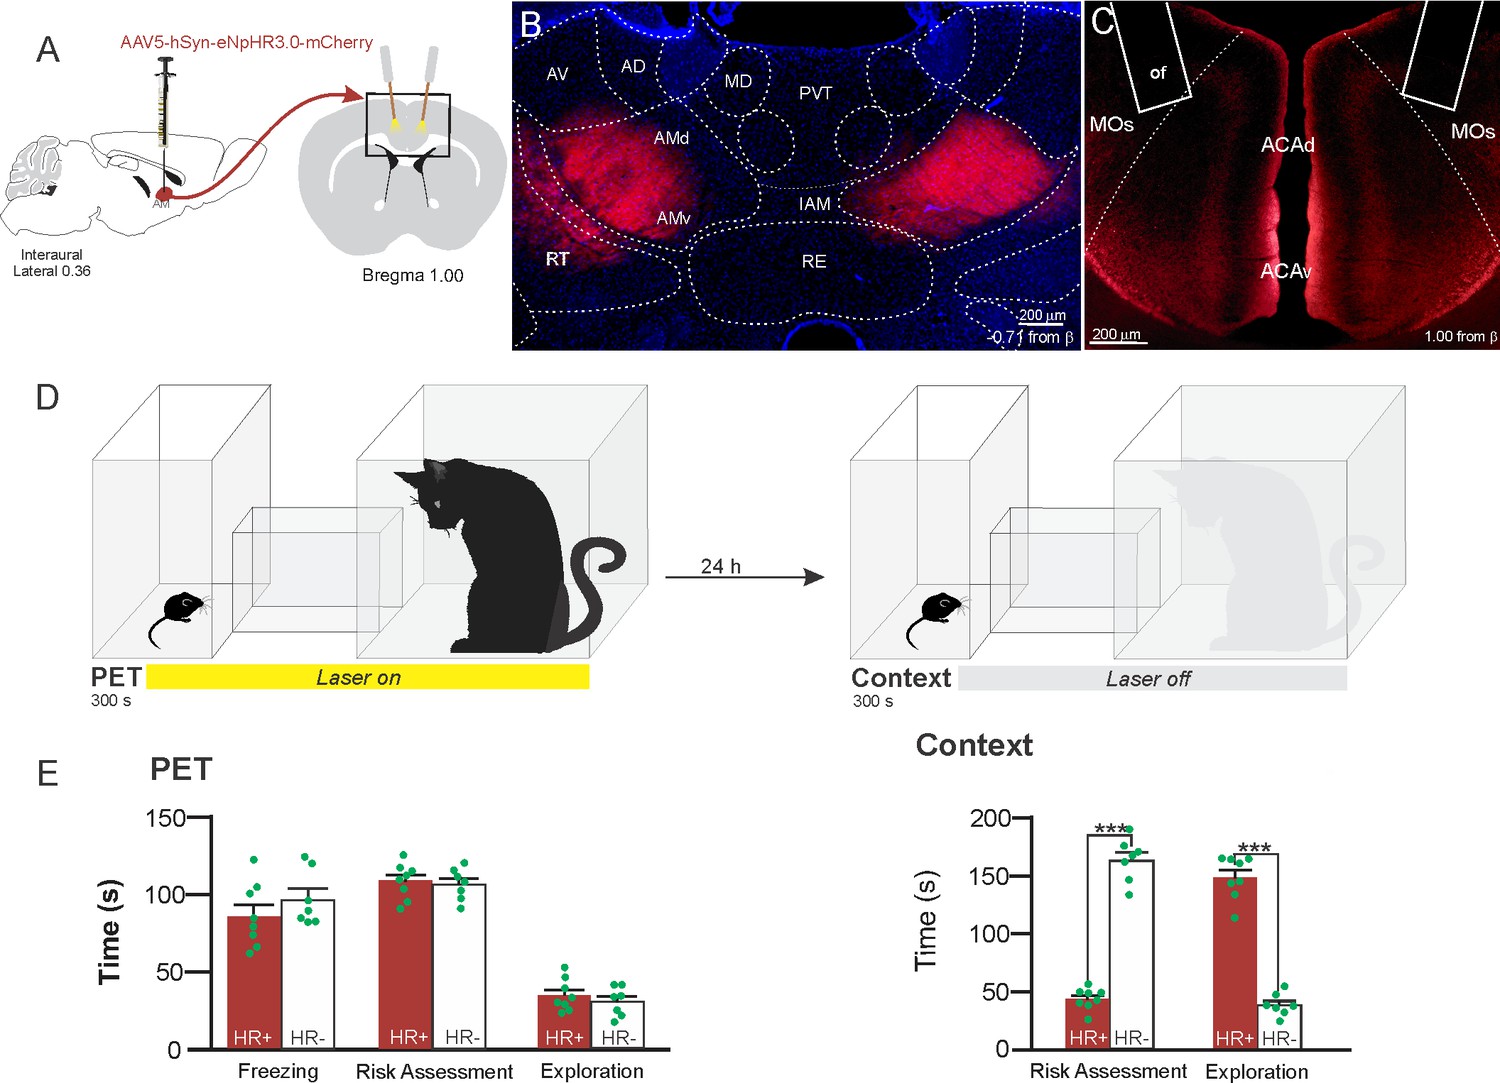
Optogenetic inhibition of anteromedial thalamic nucleus>ACA pathway during cat exposure.
(A) Schematics showing the location of the bilateral AAV viral vector injection in the anteromedial thalamic nucleus (AM) and the position of bilateral optical fibers implanted in the ACA. (B) Fluorescence photomicrographs illustrating the bilateral injection in the AM of a viral vector expressing halorhodopsin-3.0 (eNpHR3.0) fused with mCherry. (C) Fluorescence photomicrograph illustrating the mCherry anterograde labeled projection to the ACA (of – the optic fibers’ tips position). (D) Experimental design. (E) Raw (dots) and mean (± SEM) values of the behavioral responses during Predator Exposure (PET) and Predatory Context (Context). Data are shown as raw (dots) and mean (± SEM) values. Groups: HR+ (n=8) and HR− (n=7). For the freezing, a one-way ANOVA revealed no main effect for the factor virus (HR+ and HR−, F[1,13]=1.05; p=0.324; η2p=0.074). For the risk assessment, a 2×2 ANOVA revealed a main effect for the factor virus (HR+ and HR−, F[1,13]=149.79; p<0.001; η2p=0.920) and a significant interaction between the factors virus and exposure (F[1,13]=178.43; p<0.001; η2p=0.932). Post hoc pairwise comparisons (Tukey’s HSD test) revealed for the HR+ animals a significant decrease in the risk assessment during the context exposure (***p<0.001) (E). For exploration, a 2×2 ANOVA revealed a main effect for the factor virus (HR+ and HR−, F [1,13]=102.18; p<0.001; η2p=0.887) and a significant interaction between the factors virus and exposure (F [1,13]=238.00; p<0.001; η2p=0.948). Post hoc pairwise comparisons (Tukey’s HSD test) revealed for the HR+ animals a significant increase in the exploration during the context exposure (***p<0.001) (E). Abbreviations: ACAd, anterior cingulate area, dorsal part; ACAv, anterior cingulate area, ventral part; AD, anterodorsal nucleus of thalamus; AMd, anteromedial thalamic nucleus, dorsal part; AMv, anteromedial thalamic nucleus, ventral part; AV, anteroventral nucleus of thalamus; IAM, interanteromedial nucleus of the thalamus; MD, mediodorsal nucleus of the thalamus; MOs, secondary motor area; of, optical fiber; PET, predator exposure test; PVT, paraventricular; nucleus of the thalamus; RE, nucleus of reuniens; RT, reticular nucleus of the thalamus.
-
Figure 4—source data 1
Spreadsheet of raw values for panel (E).
- https://cdn.elifesciences.org/articles/67007/elife-67007-fig4-data1-v1.docx
Figure 5
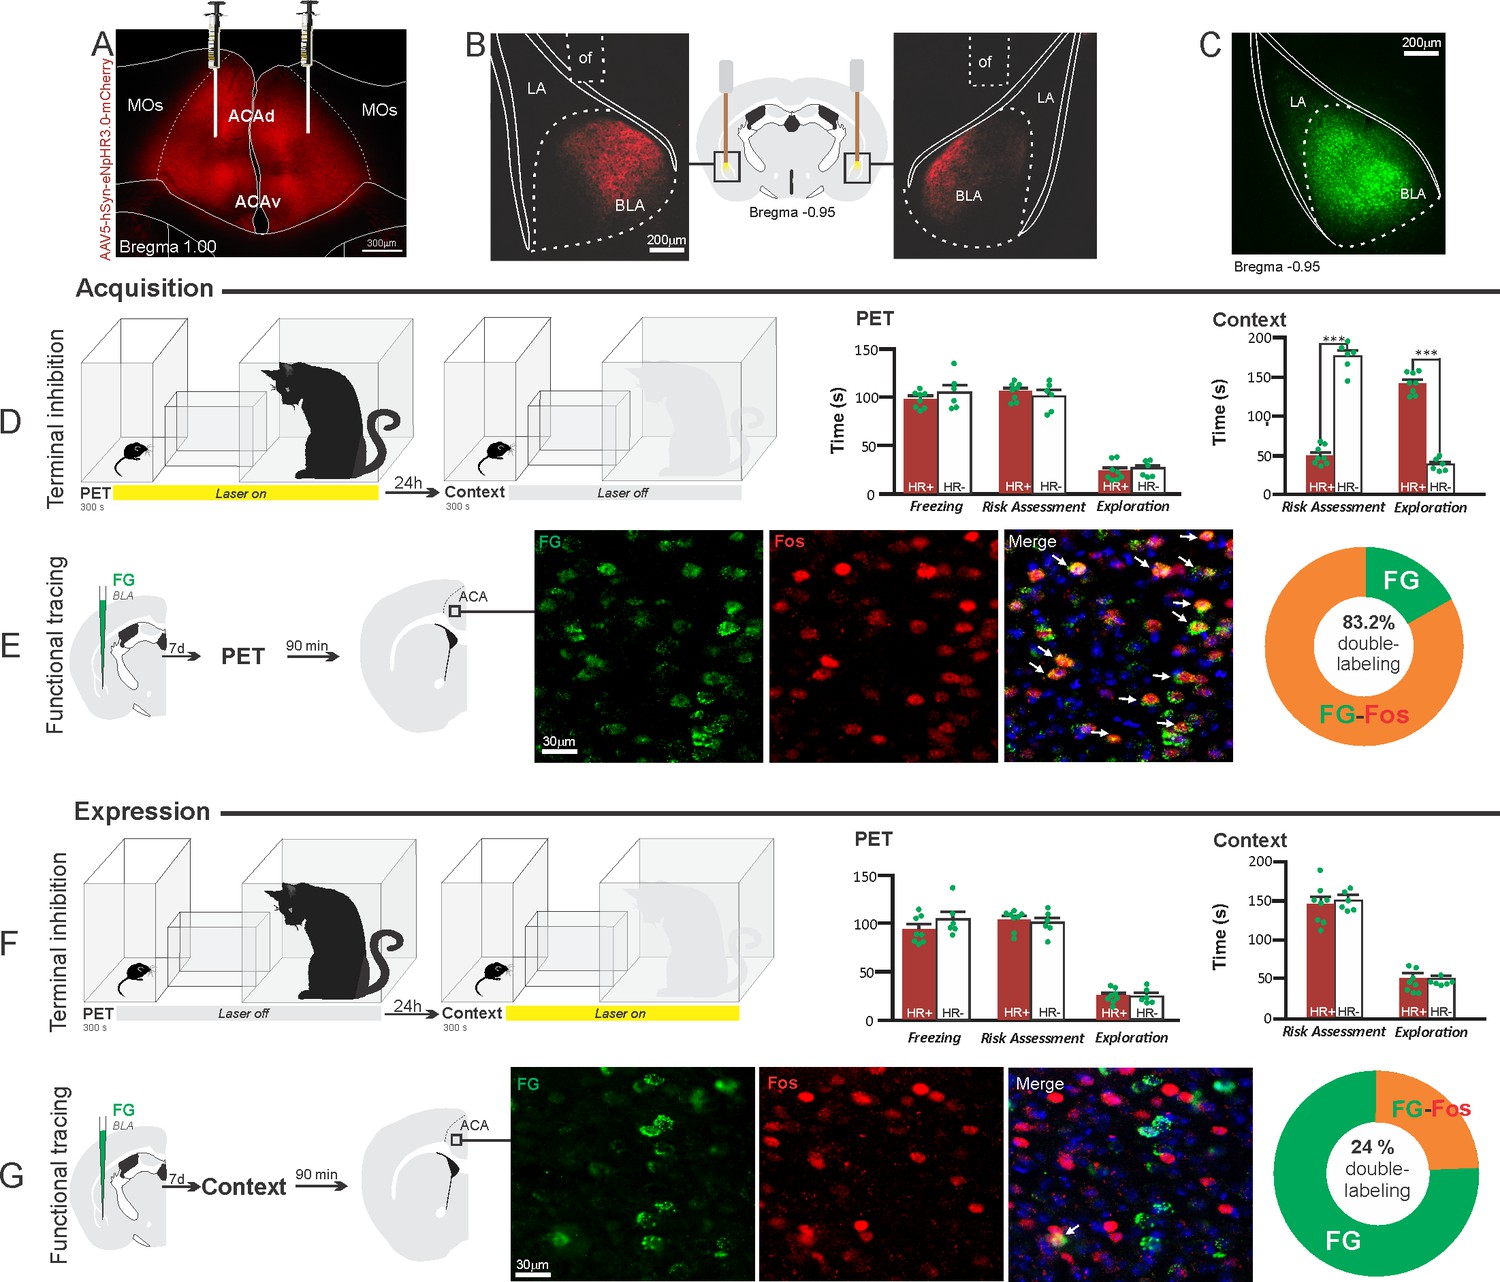
Optogenetic silencing and functional tracing of the ACA>BLA pathway during the acquisition and expression of contextual fear to predator threat.
(A) Fluorescence photomicrograph illustrating the bilateral injection in the ACA of a viral vector expressing halorhodopsin-3.0 (eNpHR3.0) fused with mCherry. (B) Schematic drawing (center) and fluorescence photomicrographs showing the ACA projections to the BLA and location of bilateral optical fibers implanted close to the basolateral amygdala (of – optic fibers’ tips position). (C) Fluorescence photomicrograph illustrating the FG injection in the BLA for the functional tracing. (D, F) Optogenetic silencing of the ACA>BLA pathway during the cat exposure (D) or predatory context (F). Experimental design (on the left) and raw (dots) and mean (± SEM) values of the behavioral responses during Predator Exposure (PET) and Predatory Context (on the right). For silencing during PET condition – Groups: HR+ (n=8) and HR− (n=6); for silencing during Context condition – Groups: HR+ (n=8) and HR− (n=6). Data are shown as raw (dots) and mean (± SEM) values. For the freezing, a 2×2 ANOVA revealed neither main effects for the factors virus (HR+ and HR−, F[1,24]=2.98; p=0.097; η2p=0.110) and phase of treatment (Photoinhibition/PET and Photoinhibition/Context, F[1,24]=0.20; p=0.656; η2p=0.008) nor an interaction between them (F[1,24]=0.053; p=0.819; η2p=0.002). For the risk assessment, a three-way ANOVA revealed significant main effects for the factors virus (HR+ and HR−, F[1,24]=78.6; p<0.001; η2p=0.766), phase of treatment (Photoinhibition/PET and Photoinhibition/Context, F[1,24]=23.83; p<0.001; η2p=0.498) and exposure (PET and Context, F[1,24]=35.38; p<0.001; η2p=0.596), as well as a significant three-way interaction among these factors (F[1,24]=45.74; p<0.001; η2p=0.656). For the animals tested during the predatory context, post hoc pairwise comparisons (Tukey’s HSD test) revealed for the HR+ animals that received photoinhibition during cat exposure a significant decrease in risk assessment compared to the control HR− group (***p<0.001) (D), whereas the HR+ group that received photoinhibition during the context did not differ from the control HR− group (p=0.99) (F). For the exploration, a three-way ANOVA revealed significant main effects for the factors virus (HR+ and HR−, F[1,24]=106.76; p<0.001; η2p=0.816), phase of treatment (Photoinhibition/PET and Photoinhibition/Context, F[1,24]=70.91; p<0.001; η2p=0.747) and exposure (PET and Context, F[1,24]=256.10; p<0.001; η2p=0.914), as well as a significant three-way interaction among these factors (F[1,24]=93.76; p<0.001; η2p=0.796). For the animals tested during the predatory context, post hoc pairwise comparisons (Tukey’s HSD test) revealed for the HR+ animals that received photoinhibition during cat exposure a significant increase in the relaxed exploration compared to the control HR− group (***p<0.001) (D), whereas the HR+ group that received photoinhibition during the context did not differ from the control HR− group (p=0.99) (F). (E, G) Functional tracing of the ACA>BLA pathway during the cat exposure (acquisition phase, E) and the predatory context (expression phase, G). Left – Experimental design: unilateral FG injection in the BLA, and 7 days later perfusion 90 min after the cat exposure (n=4, E) or the context exposure (n=4, G). Center – Fluorescence photomicrographs illustrating, in the ACA, FG-labeled cells in green (Alexa 488), Fos protein positive cells labeled in red (Alexa 594) and merged view of the FG and FOS labeled cells (arrows indicate FG/FOS double-labeled cells). Right – Graphic representation of the percentage of FG/Fos double-labeled cells in the ACA. Abbreviations: ACAd, anterior cingulate area, dorsal part; ACAv, anterior cingulate area, ventral part; BLA, basolateral amygdalar nucleus; FG, Fluoro gold; LA, lateral amygdalar nucleus; MOs, secondary motor area; of, optical fiber; PET, predator exposure test.
-
Figure 5—source data 1
Behavior data – spreadsheet of raw values for panels (D) and (F).
Cell counting – spreadsheet of raw values for panels (E) and (G).
- https://cdn.elifesciences.org/articles/67007/elife-67007-fig5-data1-v1.docx
Figure 6
Optogenetic silencing and functional tracing of the ACA>PERI pathway during the acquisition and expression of contextual fear to predator threat.
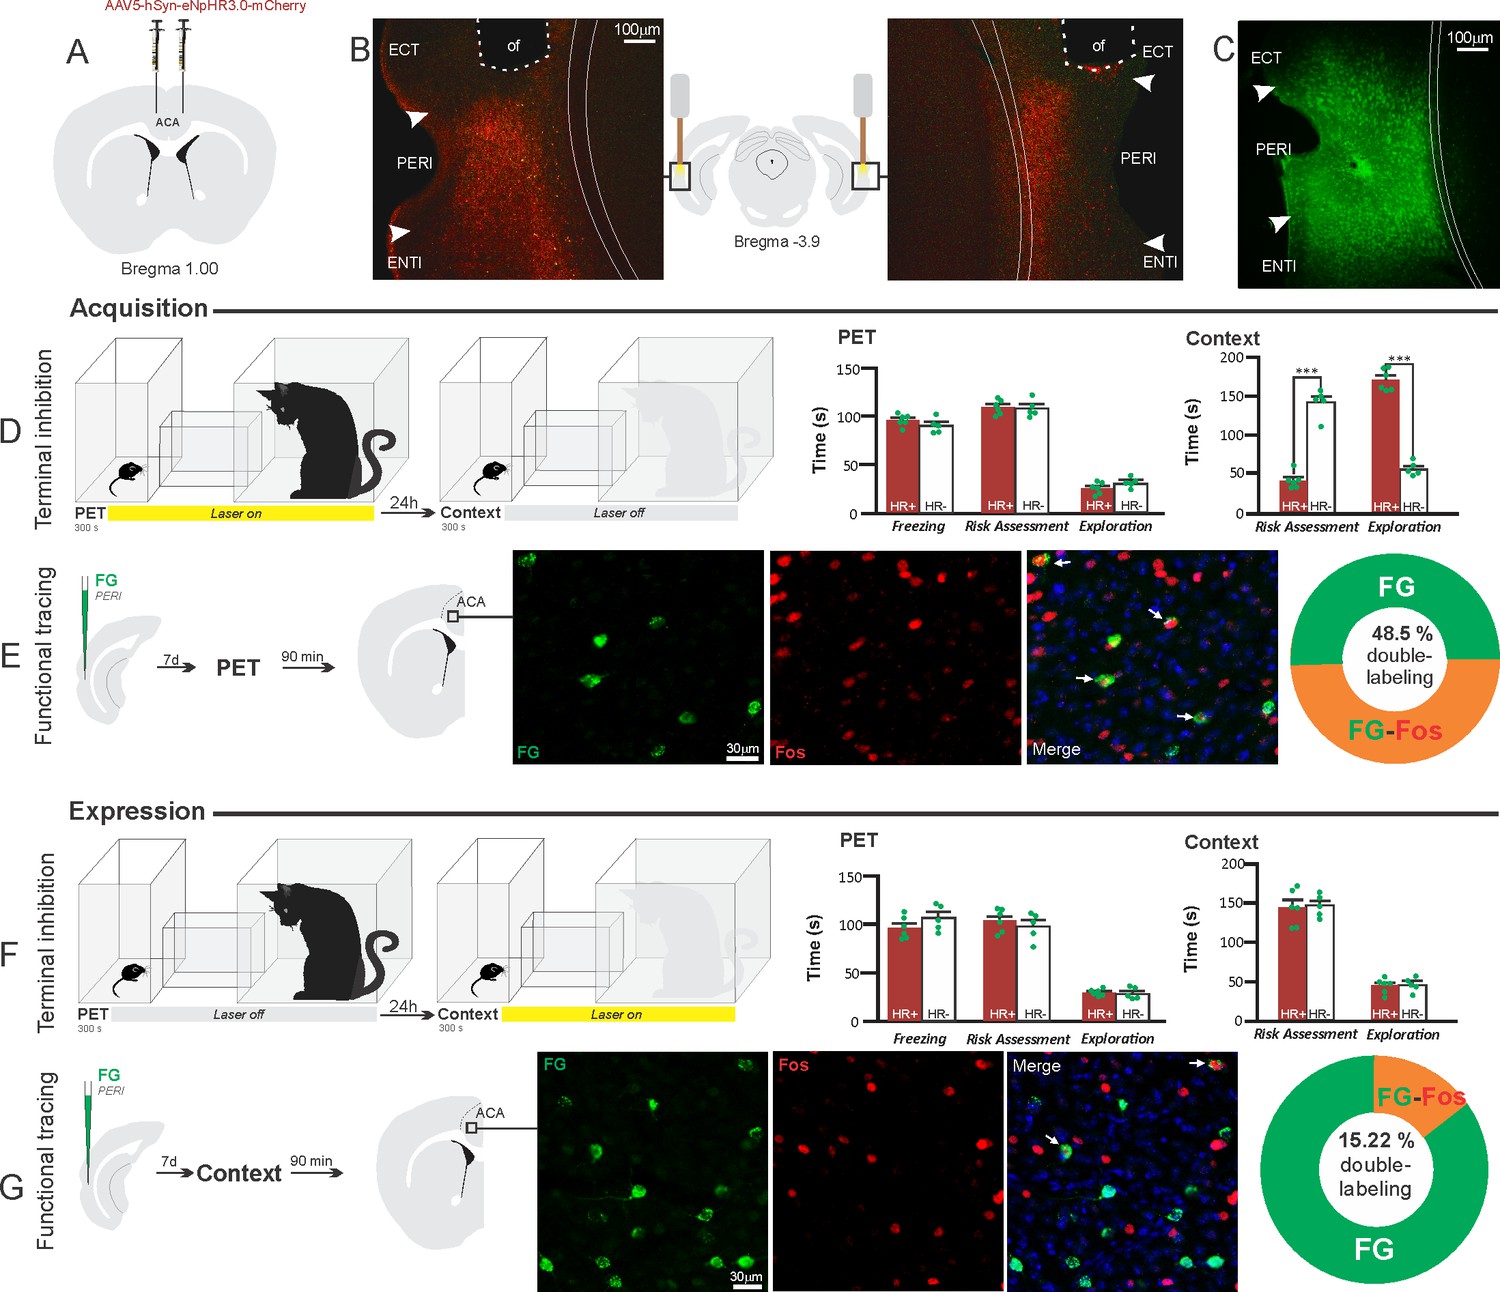
(A) Schematic drawing illustrating the bilateral injection in the ACA of a viral vector expressing halorhodopsin-3.0 (eNpHR3.0) fused with mCherry. (B) Schematic drawing (center) and fluorescence photomicrographs showing the ACA projections to the PERI and location of bilateral optical fibers implanted close to the PERI (of – optic fibers’ tips position). (C) Fluorescence photomicrograph illustrating the FG injection in the PERI for the functional tracing. (D, F) Optogenetic silencing of the ACA>PERI pathway during the cat exposure (D) or predatory context (F). Experimental design (on the left), and raw (dots) and mean (± SEM) values of the behavioral responses during Predator Exposure (PET) and Predatory Context (on the right). For silencing during PET condition – Groups: HR+ (n=6) and HR− (n=5); for silencing during Context condition – Groups: HR+ (n=6) and HR− (n=5). Data are shown as raw (dots) and mean (± SEM) values. For the freezing, a 2×2 ANOVA revealed neither main effect for the factor virus (HR+ and HR−, F[1,18]=0.259; p=0.617; η2p=0.014) and the factor phase of treatment (Photoinhibition/PET and Photoinhibition/Context, F[1,18]=4.46; p=0.049; η2p=0.198), and no significant interaction between them (F[1,18]=3.24; p=0.088; η2p=0.152). For the risk assessment, a three-way ANOVA revealed significant main effects for the factors virus (HR+ and HR−, F[1,18]=61.56; p<0.001; η2p=0.773) and phase of treatment (Photoinhibition/PET and Photoinhibition/Context, F[1,18]=63.25; p<0.001; η2p=0.778), but not for the factor exposure (PET and Context, F[1,18]=7.69; p=0.0125; η2p=0.299). There was a significant three-way interaction among these factors (F[1,18]=19.36; p<0.001; η2p=0.518). For the animals tested during the predatory context, post hoc pairwise comparisons (Tukey’s HSD test) revealed for the HR+ animals that received photoinhibition during cat exposure a significant decrease in risk assessment compared to the control HR− group (***p<0.001) (D), whereas the HR+ group that received photoinhibition during the context did not differ from the control HR− group (p=0.96) (F). For the exploration, a three-way ANOVA revealed significant main effects for the factors virus (HR+ and HR−, F[1,18]=135.44; p<0.001; η2p=0.883), phase of treatment (Photoinhibition/PET and Photoinhibition/Context, F[1,18]=204.85; p<0.001; η2p=0.919) and exposure (PET and Context, F[1,18]=343.98; p<0.001; η2p=0.950), as well as a significant three-way interaction among these factors (F[1,18]=127.74; p<0.001; η2p=0.876). For the animals tested during the predatory context, post hoc pairwise comparisons (Tukey’s HSD test) revealed for the HR+ animals that received photoinhibition during cat exposure a significant increase in the relaxed exploration compared to the control HR− group (***p<0.001) (D), whereas the HR+ group that received photoinhibition during the context did not differ from the control HR− group (p=0.99) (F). (E, G) Functional tracing of the ACA>PERI pathway during the cat exposure (acquisition phase, E) and the predatory context (expression phase, G). Left – Experimental design: unilateral FG injection in the PERI, and 7 days later perfusion 90 min after the cat exposure (n=4, E) or the context exposure (n=4, G). Center – Fluorescence photomicrographs illustrating, in the ACA, FG-labeled cells in green (Alexa 488), Fos protein positive cells labeled in red (Alexa 594), and merged view of the FG and FOS labeled cells (arrows indicate FG/FOS double-labeled cells). Right – Graphic representation of the percentage of FG/Fos double-labeled cells in the ACA. Abbreviations: ACA, anterior cingulate area; ECT, ectorhinal area; FG, Fluoro gold; of, optical fiber; PET, predator exposure test; ENTl, entorhinal area, lateral part; PERI, perirhinal area.
-
Figure 6—source data 1
Behavior data – spreadsheet of raw values for panels (D) and (F).
Cell counting – spreadsheet of raw values for panels (E) and (G).
- https://cdn.elifesciences.org/articles/67007/elife-67007-fig6-data1-v1.docx
Figure 7

Optogenetic silencing and functional tracing of the ACA>POST pathway during the acquisition and expression of contextual fear to predator threat.
(A) Schematic drawing illustrating the bilateral injection in the ACA of a viral vector expressing halorhodopsin-3.0 (eNpHR3.0) fused with mCherry. (B) Schematic drawing (center) and fluorescence photomicrographs showing the ACA projections to the POST and location of bilateral optical fibers implanted close to the POST (of – optic fibers’ tips position). (C) Fluorescence photomicrograph illustrating the FG injection in the POST for the functional tracing. (D, F) Optogenetic silencing of the ACA>POST pathway during the cat exposure (D) or predatory context (F). Experimental design (on the left) and raw (dots) mean (± SEM) values of the behavioral responses during Predator Exposure (PET) and Predatory Context (on the right). For silencing during PET condition – Groups: HR+ (n=6) and HR− (n=5); for silencing during Context condition – Groups: HR+ (n=7) and HR− (n=5). Data are shown as raw (dots) and mean (± SEM) values. For the freezing, a 2×2 ANOVA revealed neither main effects for the factors virus (HR+ and HR−, F[1,19]=1.08; p=0.311; η2p=0.054) and phase of treatment (Photoinhibition/PET and Photoinhibition/Context, F[1,19]<0.001; p=0.997; η2p<0.001) nor an interaction between them (F[1,19]=0.85; p=0.367; η2p=0.043). For the risk assessment, a three-way ANOVA revealed no main effects for the factors virus (HR+ and HR−, F[1,19]=0.37; p=0.551; η2p=0.019) and phase of treatment (Photoinhibition/PET and Photoinhibition/Context, F[1,19]=1.64; p=0.215; η2p=0.079), and a significant main effect for the factor exposure (PET and Context, F[1,19]=39.56; p<0.001; η2p=0.675). There was no significant three-way interaction among these factors (F[1,19]=0.018; p=0.894; η2p<0.001). Post hoc pairwise comparisons (Tukey’s HSD test) for the animals tested during the predatory context revealed no difference for the HR+ and HR− animals that received photoinhibition during cat exposure (p=0.994) or during the context (p=1) (D, F). For the exploration, a three-way ANOVA revealed no significant main effects for the factors virus (HR+ and HR−, F[1,19]=2.63; p=0.121; η2p=0.122) and phase of treatment (Photoinhibition/PET and Photoinhibition/Context, F[1,19]=0.19; p=0.663; η2p=0.10), and a significant main effect for the factor exposure (PET and Context, F[1,19]=18.18; p<0.001; η2p=0.489). There was no significant three-way interaction among these factors (F[1,19]=1.21; p=0.285; η2p=0.059). Post hoc pairwise comparisons (Tukey’s HSD test) for the animals tested during the predatory context revealed no difference for the HR+ and HR− animals that received photoinhibition during cat exposure (p=0.728) or during the context (p=0.999) (D, F). (E, G) Functional tracing of the ACA>POST pathway during the cat exposure (acquisition phase, E) and the predatory context (expression phase, G). Left – Experimental design: unilateral FG injection in the POST, and 7 days later perfusion 90 min after the cat exposure (n=4, E) or the context exposure (n=4, G). Center – Fluorescence photomicrographs illustrating, in the ACA, FG-labeled cells in green (Alexa 488), Fos protein positive cells labeled in red (Alexa 594), and merged view of the FG and FOS labeled cells (arrows indicate FG/FOS double-labeled cells). Right – Graphic representation of the percentage of FG/Fos double-labeled cells in the ACA. Abbreviations: ACA, anterior cingulate area; FG, Fluoro gold; of, optical fiber; PET, predator exposure test; POST, postsubiculum; PRE, presubiculum; RSPv, retrosplenial area, ventral part.
-
Figure 7—source data 1
Behavior data – spreadsheet of raw values for panels (D) and (F).
Cell counting – spreadsheet of raw values for panels (E) and (G).
- https://cdn.elifesciences.org/articles/67007/elife-67007-fig7-data1-v1.docx
Figure 8
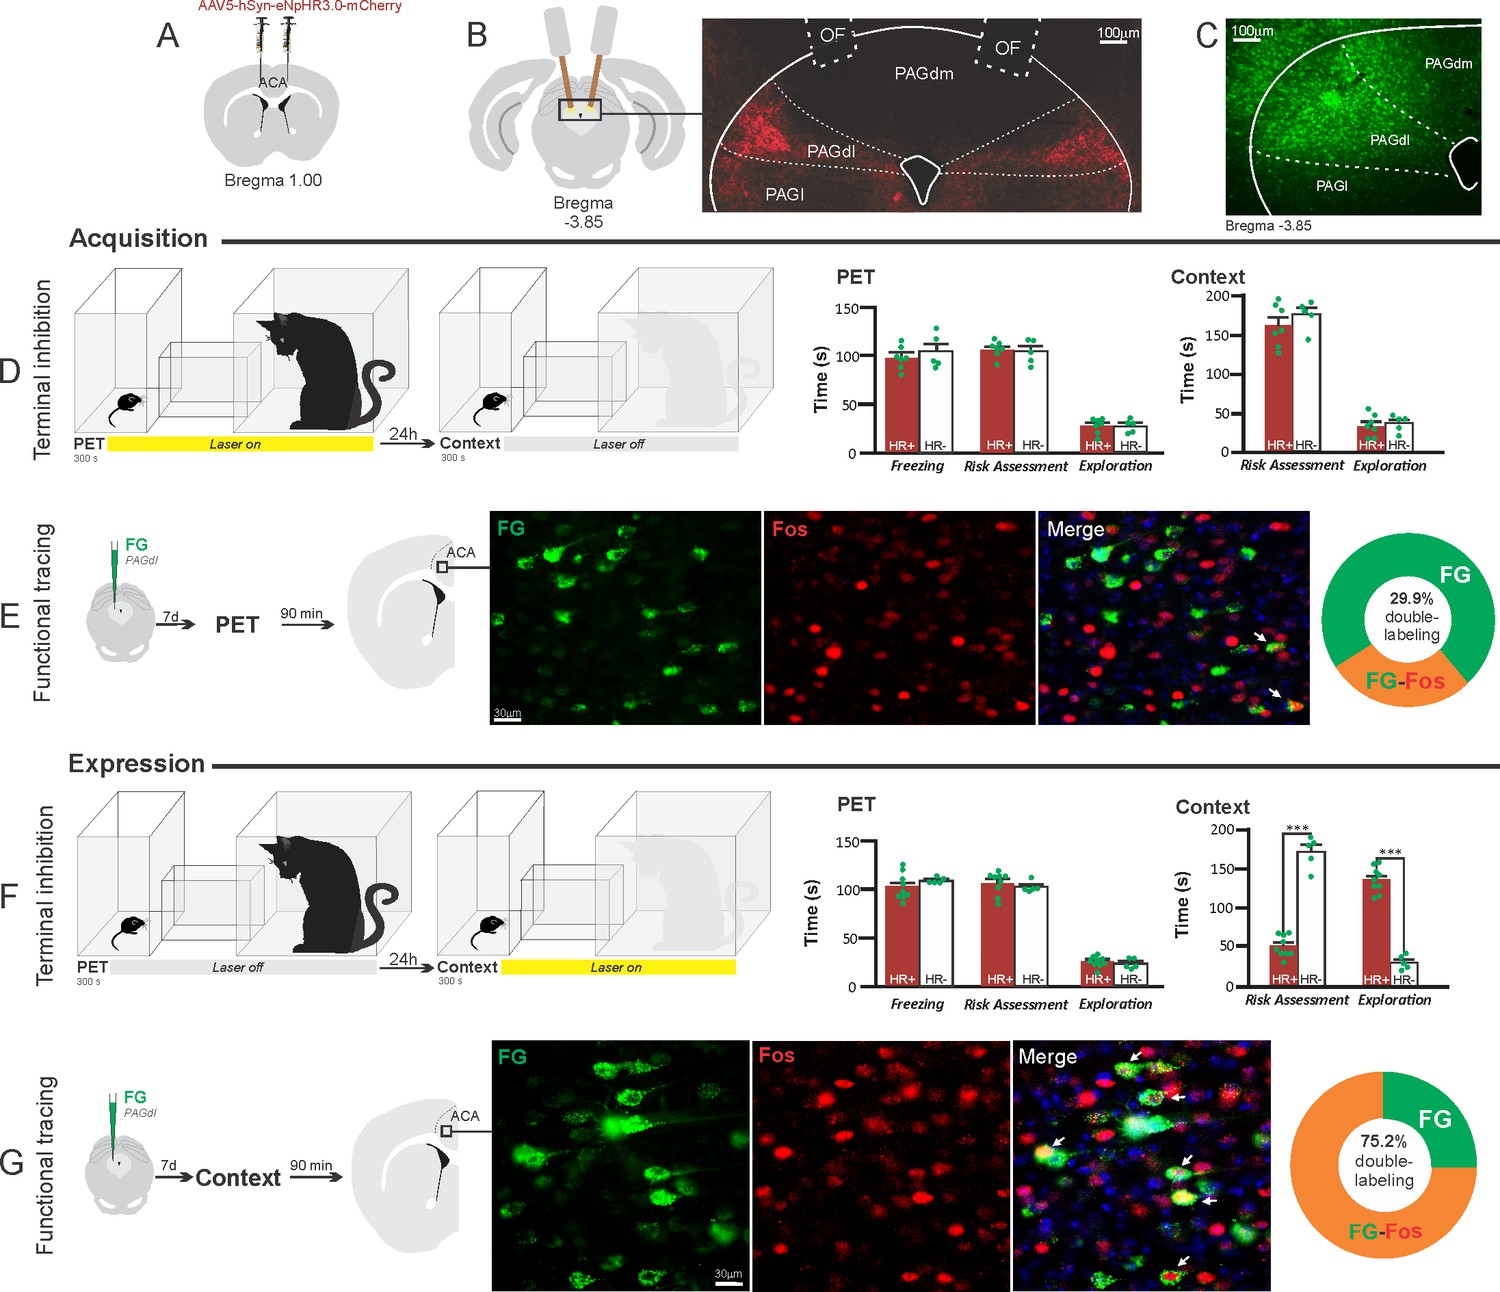
Optogenetic silencing and functional tracing of the ACA>PAGdl pathway during the acquisition and expression of contextual fear to predator threat.
(A) Schematic drawing illustrating the bilateral injection in the ACA of a viral vector expressing halorhodopsin-3.0 (eNpHR3.0) fused with mCherry. (B) Schematic drawing (left) and fluorescence photomicrograph (right) showing the ACA projections to the PAGdl and location of bilateral optical fibers implanted close to the PAGdl (of – optic fibers’ tips position). (C) Fluorescence photomicrograph illustrating the FG injection in the PAGdl for the functional tracing. (D, F) Optogenetic silencing of the ACA>PAGdl pathway during the cat exposure (D) or the predatory context (F). Experimental design (on the left) and raw (dots) and mean (± SEM) values of the behavioral responses during Predator Exposure (PET) and Predatory Context (on the right). For silencing during PET condition – Groups: HR+ (n=7) and HR− (n=5); for silencing during Context condition – Groups: HR+ (n=9) and HR− (n=5). Data are shown as raw (dots) and mean (± SEM) values. For the freezing, a 2×2 ANOVA revealed neither main effects for the factors virus (HR+ and HR−, F[1,22]=1.40; p=0.249; η2p=0.059) and phase of treatment (Photoinhibition/PET and Photoinhibition/Context, F[1,22]=1.11; p=0.302; η2p=0.048) nor an interaction between them (F[1,22]=0.01; p=0.923; η2p<0.001). For the risk assessment, a three-way ANOVA revealed significant main effects for the factors virus (HR+ and HR−, F[1,22]=38.05; p<0.001; η2p=0.634), phase of treatment (Photoinhibition/PET and Photoinhibition/Context, F[1,22]=33.25; p<0.001; η2p=0.602) and exposure (PET and Context, F[1,22]=77.22; p<0.001; η2p=0.778), as well as a significant three-way interaction among these factors (F[1,22]=45.23; p<0.001; η2p=0.673). For the animals tested during the predatory context, post hoc pairwise comparisons (Tukey’s HSD test) revealed for the HR+ animals that received photoinhibition during the context a significant decrease in risk assessment compared to the control HR− group (***p<0.001) (F), whereas the HR+ group that received photoinhibition during cat exposure did not differ from the control HR− group (p=0.852) (D). For the exploration, a three-way ANOVA revealed significant main effects for the factors virus (HR+ and HR−, F[1,22]=90.20; p<0.001; η2p=0.804), phase of treatment (Photoinhibition/PET and Photoinhibition/Context, F[1,22]=64.93; p<0.001; η2p=0.747) and exposure (PET and Context, F[1,22]=103.45; p<0.001; η2p=0.825), as well as a significant three-way interaction among these factors (F[1,22]=62.25; p<0.001; η2p=0.739). For the animals tested during the predatory context, post hoc pairwise comparisons (Tukey’s HSD test) revealed for the HR+ animals that received photoinhibition during the context a significant increase in the exploration compared to the control HR− group (***p<0.001) (F), whereas the HR+ group that received photoinhibition during the cat exposure did not differ from the control HR− group (p=0.99) (D). (E, G) Functional tracing of the ACA>PAGdl pathway during the cat exposure (acquisition phase, E) and the predatory context (expression phase, G). Left – Experimental design: unilateral FG injection in the PAGdl, and 7 days later perfusion 90 min after the cat exposure (n=4, E) or the context exposure (n=4, G). Center – Fluorescence photomicrographs illustrating, in the ACA, FG-labeled cells in green (Alexa 488), Fos protein positive cells labeled in red (Alexa 594), and merged view of the FG and FOS labeled cells (arrows indicate FG/FOS double-labeled cells). Right – Graphic representation of the percentage of FG/Fos double-labeled cells in the ACA. Abbreviations: ACA, anterior cingulate area; FG, Fluoro gold; of, optical fiber; PAGdl, periaqueductal gray, dorsolateral part; PAGdm, periaqueductal gray, dorsomedial part; PAGl, periaqueductal gray, lateral part; PET, predator exposure test.
-
Figure 8—source data 1
Behavior data – spreadsheet of raw values for panels (D) and (F).
Cell counting – spreadsheet of raw values of panels (E) and (G).
- https://cdn.elifesciences.org/articles/67007/elife-67007-fig8-data1-v1.docx
Appendix 1—figure 1
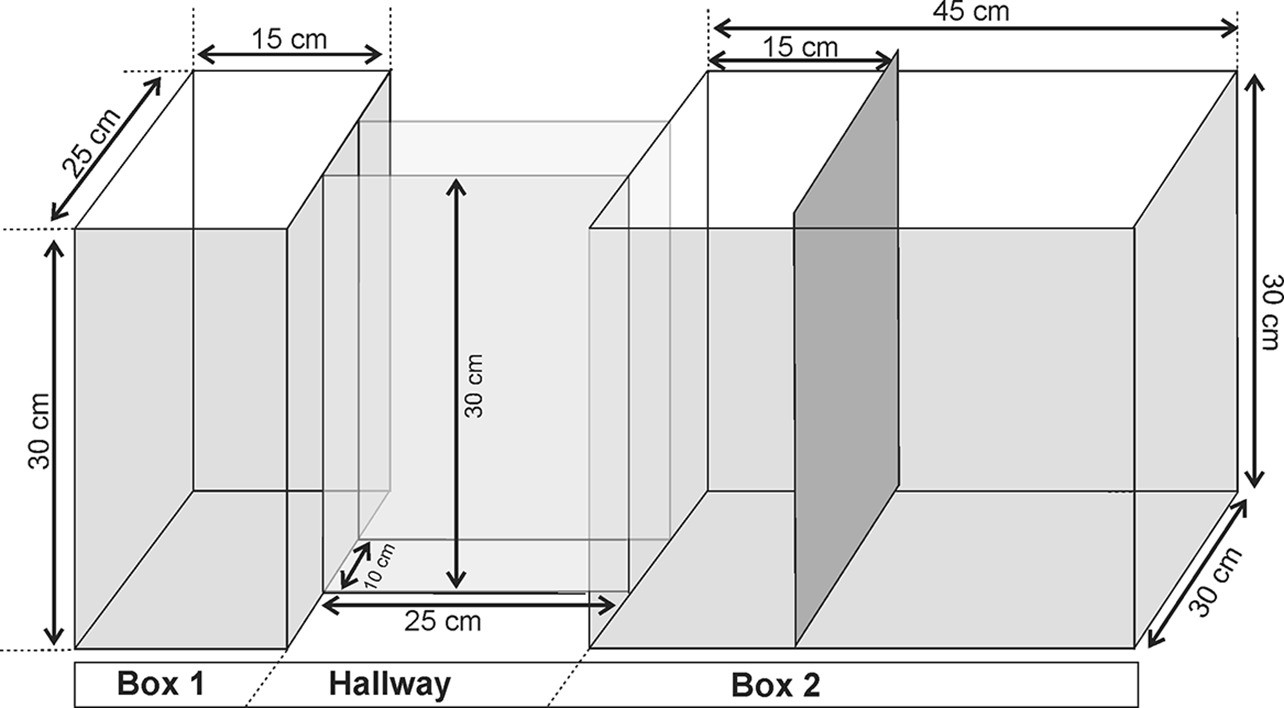
Experimental apparatus used for exposure to the Predator and Predatory Context.
Appendix 1—figure 2

Timeline to illustrate the experimental procedure.
Appendix 1—figure 3
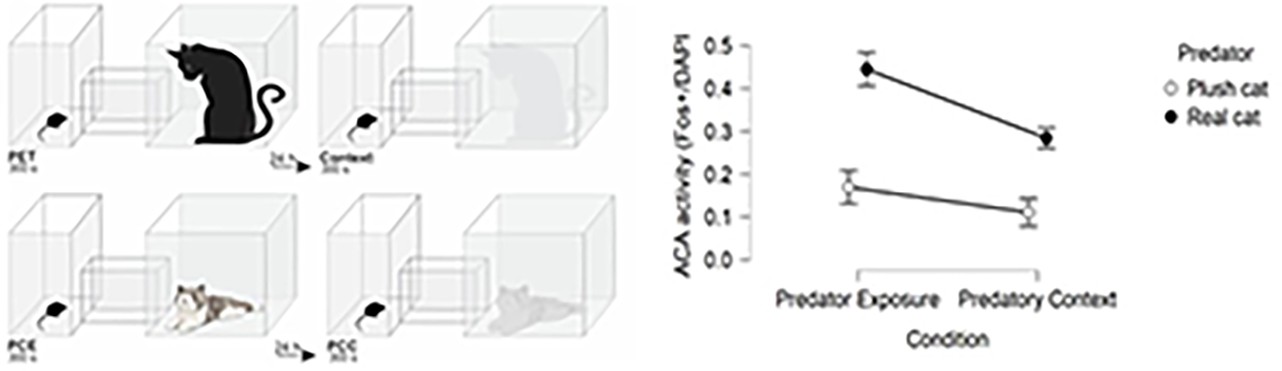
Comparison of ACA activity in response to cat and novel non-threat stimulus.
On the left, drawings to illustrate the experimental conditions PET (predator exposure test), Context (real cat related context), PCE (plush cat exposure), and PCC (plush cat context). On the right, histogram showing the ACA activity expressed as the Fos+/DAPI fraction in both conditions (Predator exposure and Predatory context) when the predator was either a real cat or a plush cat (error bars are 95% C I.).
Appendix 1—figure 4
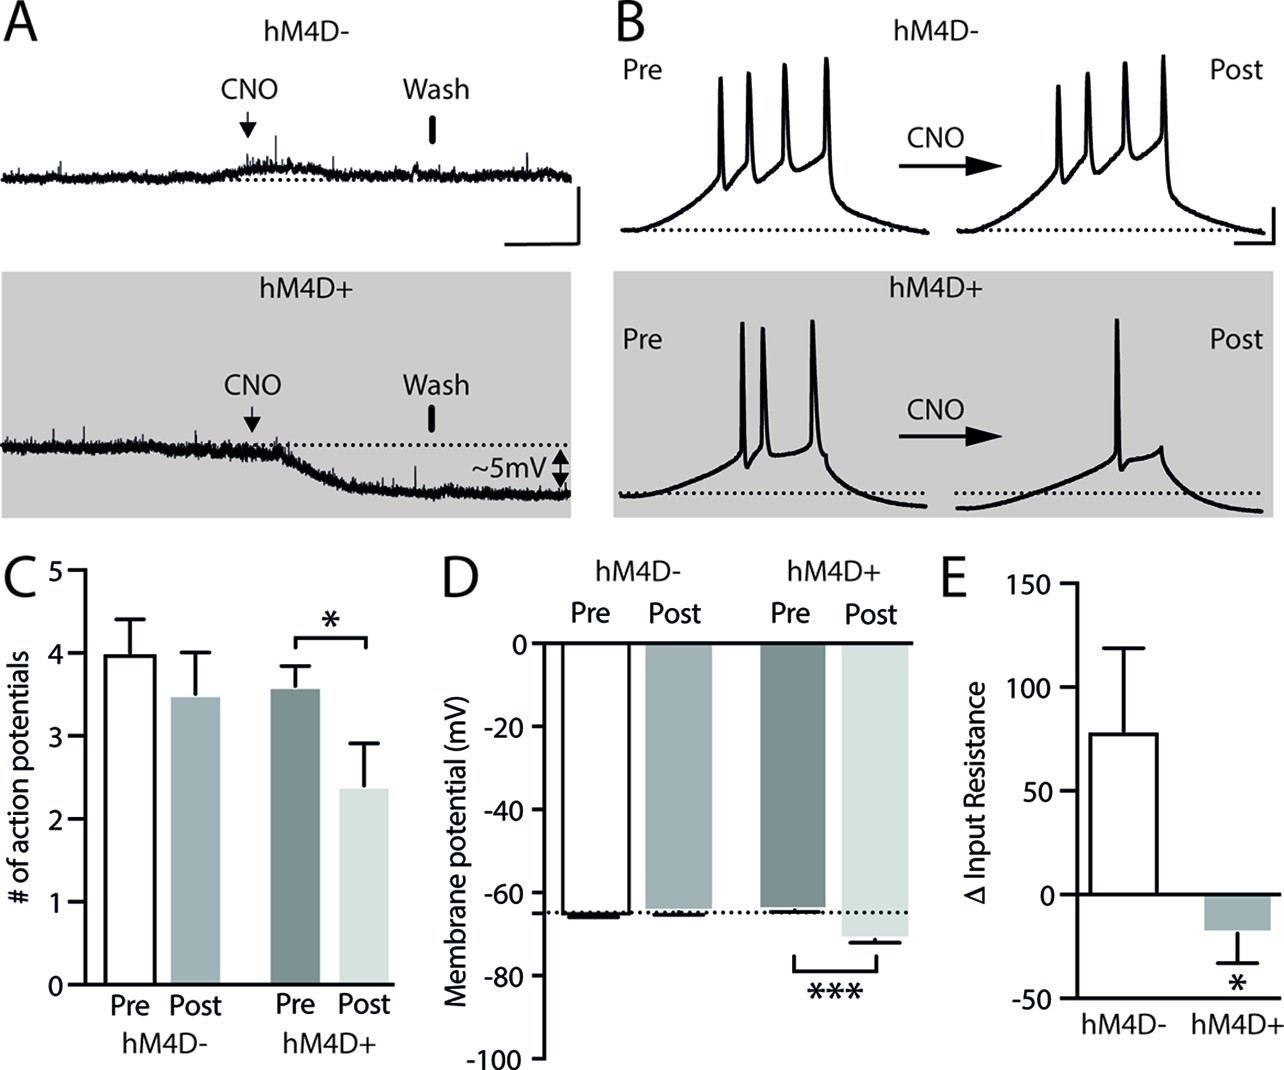
Impact of CNO on resting membrane potential and neuronal excitability in hM4D+ transfected neurons.
(A) Representative traces of resting membrane potential from hM4D− neurons (control – upper panel) or hM4D+ neurons (lower panel). hM4D+ neurons hyperpolarized as they underwent extracellular CNO. The arrows show the application of the CNO (lasting around 3 min) and the bars show the start of drug washing. Scale bar for panel (A): 10 mV, 1.5 min. (B): A ramp protocol (100 ms pulse of 500 pA) was used to assess cellular excitability after applying CNO. Representative traces of APs evoked during the ramp protocol in hM4D− and hM4D+ neurons before and after CNO application. (C) Bar graph shows a significant decrease in the triggering of APs after 10 µM CNO in hM4D+ neurons (pre: 3.6±0.2 and post 2.4±0.5; n=5) when compared to hM4D− neurons (pre: 4±0.4 and post 3.5±0.5; n=5). (D, E) Quantification of the reduction in the resting membrane potential (hM4D−: pre: –65.8±0.14 and post: –64.7±0.6; n=5; hM4D+: pre: –66.1±0.4 and post: –71.3±0.8; n=6; ***p<0.001, paired t-test) and input resistance (hM4D−: 78.8±40; n=5; hM4D+: –18.8±14.2; n=5; *p<0.05, unpaired t-test) caused by the application of CNO. The input resistance was calculated as the slope of the I-V curve and quantified before and after the application of CNO, the difference () being reported in the graph. Bars represent mean ± SEM. The dotted line on panels (A), (B), and (D) represents –65 mV.
Appendix 1—figure 5
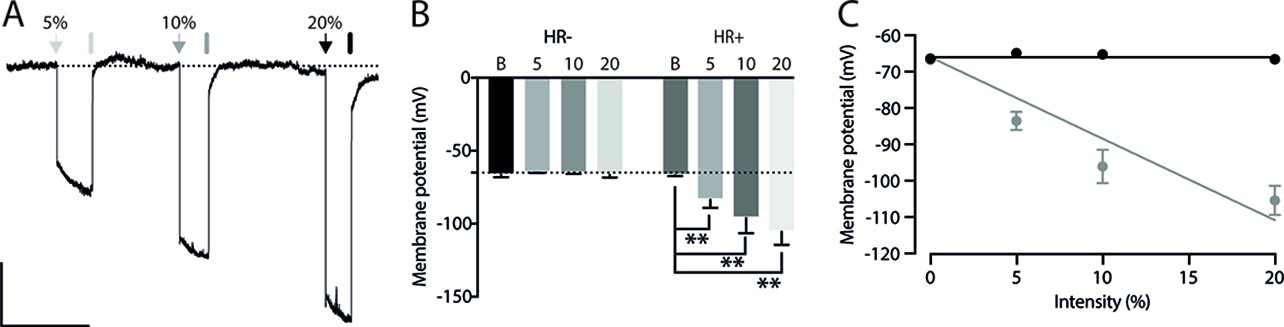
Light-induced hyperpolarization in Halorhodopsin positive neurons (HR+).
(A) Representative trace of membrane potential from an HR+ neuron. The arrows and bars represent the light on and off, respectively. The percentage on the top of the panel indicates the intensity of the light which corresponds to 12.8 (5%), 25 (10%), and 50.6 (20%) μW. Scale bar for panel (A): 10 mV, 0.5 min. (B): Membrane potential recorded during 585 nm-lights on in the control (HR−) (Basal: –66.4±0.8; 5%: –64.9±0.2; 10%: –65.27±0.3; and 20%: –66.6±0.8; n=5) and HR+ neurons (Basal: –66.8±0.2; 5%: –83.5±2.5; 10%: –96.1±4.6; and 20%: –105.4±4; n=5, **p<0.01). Hyperpolarization was quantified in the last 100 ms before turning off the light. Bars represent mean ± SEM. Dotted line represents –65 mV. (C) Linear regression of hyperpolarization caused by halorhodopsin activation due to different light intensities (HR−: slope = –0.001; HR+: slope = –2.241. Using a holding potential of –66 mV as a constraint). Points represent mean ± SEM.
Appendix 1—figure 6
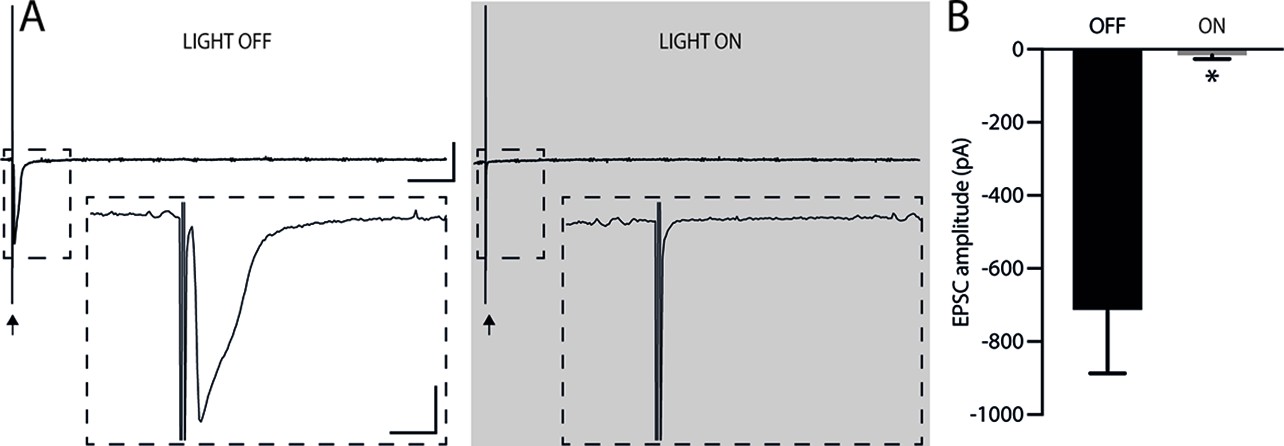
Efficiency of pre-synaptic inhibition.
(A) Representative EPSC traces before and after illumination at 585 nm (25 μW) with the arrows marking the stimulation (stimulus artifact). The upper traces show that there was no rebound excitation after halorhodopsin activation. Bars: 500 pA; 20 ms. The inserts illustrate the reduction in postsynaptic EPSC amplitude during presynaptic halorhodopsin activation. Bars: 200 pA; 2 ms. Illumination started 50 ms before and ended 50 ms after electrical stimulation (Kaneda et al., 2011; Mahn et al., 2016). (B) Quantification of the EPSC amplitude reduction due to halorhodopsin activation in the presynaptic neuron (Light off: –713.2±174.1 mV; Light on: –16.3±9.8 mV; n=4, *p<0.05, paired t-test). After activation of presynaptic halorhodopsin, EPSCs showed an 81% reduction in amplitude. Holding potential of –60 mV. Bars represent mean ± SEM.
Appendix 1—figure 7
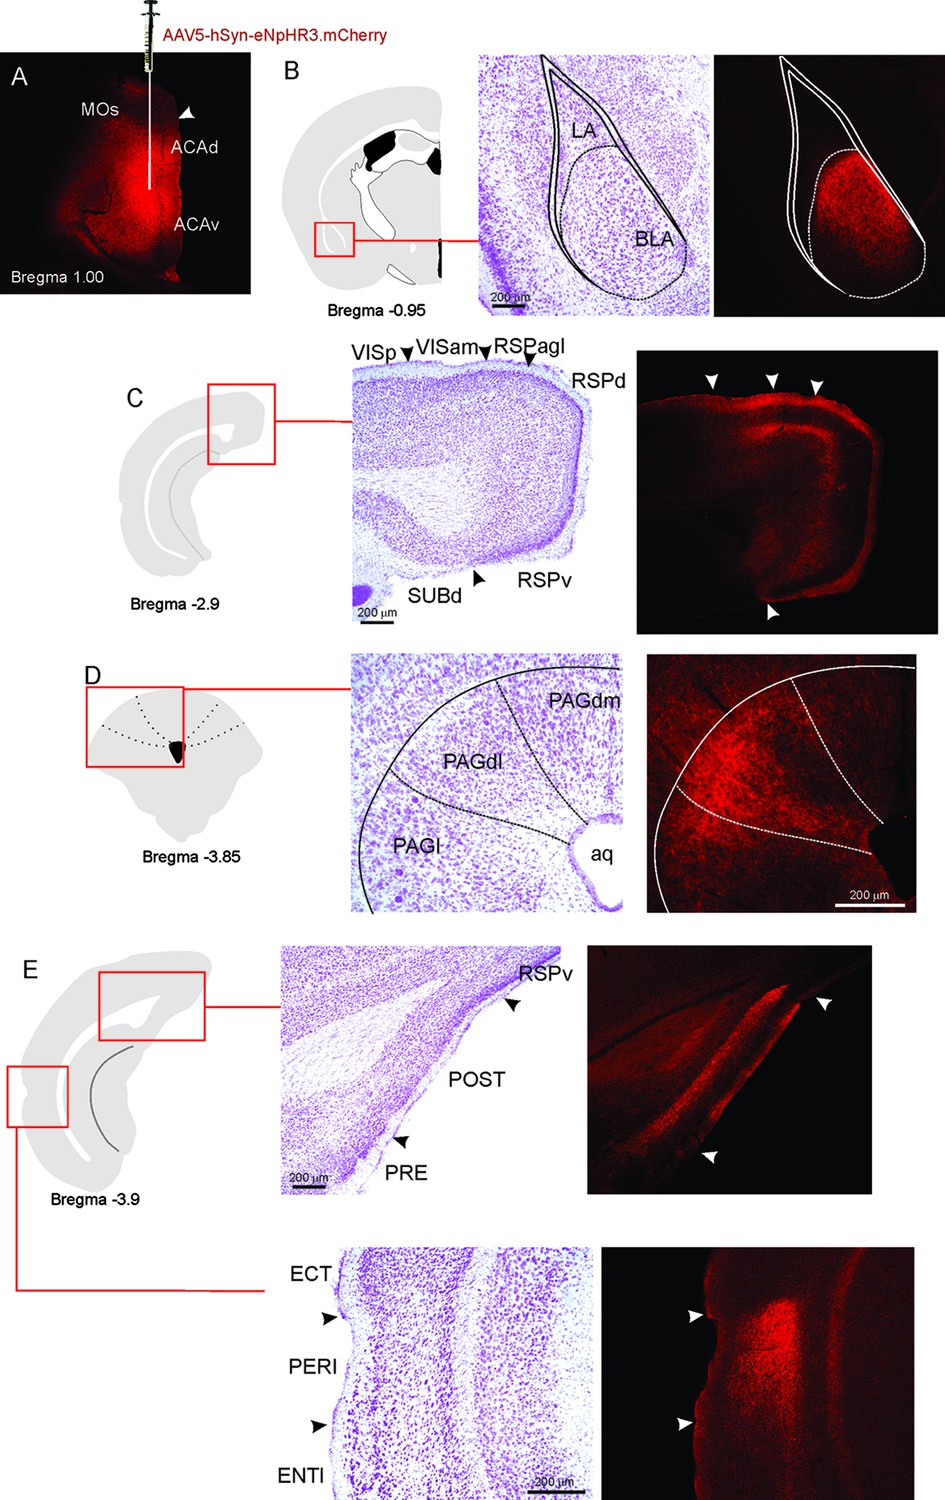
ACA projections.
(A) Fluorescence photomicrograph illustrating the extent and location of unilateral viral injection in the ACA. (B–E) On the left, schematic drawings from the Allen Mouse Brain Atlas to indicate the locations of the higher magnification nissl-stained and accompanying fluorescence photomicrographs (on the right) to show the ACA projections to the BLA (B), anteromedial visual and retrosplenial areas (C), PAGdl (D), and POST and PERI (E). Abbreviations: ACAd, anterior cingulate area, dorsal part; ACAv, anterior cingulate area, ventral part; Aq, aqueduct; BLA, basolateral amygdalar nucleus; ECT, ectorhinal area; ENTl, entorhinal area, lateral part; LA, lateral amygdalar nucleus; MOs, secondary motor area; PAGdl, periaqueductal gray, dorsolateral part; PAGdm, periaqueductal gray, dorsomedial part; PAGl, periaqueductal gray, lateral part; PERI, perirhinal area; POST, postsubiculum; PRE, presubiculum; RSPagl, retrosplenial área, lateral agranular part; RSPd, retrosplenial area, dorsal part; RSPv, retrosplenial area, ventral part; SUBd, subiculum, dorsal part; VISam, anteromedial visual area; VISp, primary visual area.
Appendix 1—figure 8
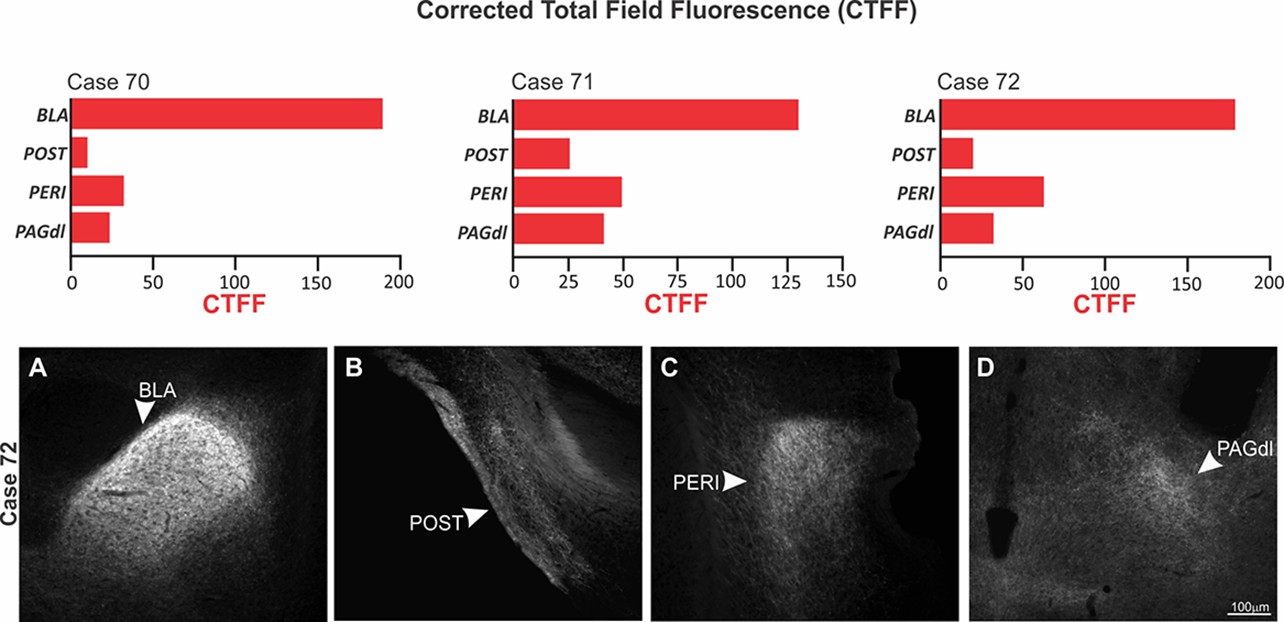
Density of ACA terminal fields in BLA, POST, PERI, and PAGdl.
Upper panel: Corrected total field fluorescence (CTFF) values for the cases 70, 71, and 72 showing the CTFF values for the ACA terminal fields to the BAL, POST, PERI, and PAGdl in a selected case (case 72). Bottom panel: Fluorescence photomicrograph illustrating the ACA projection fields in the BLA (A), POST (B), PERI (C), and PAGdl (D). Abbreviations: BLA, basolateral amygdalar nucleus; PAGdl, periaqueductal gray, dorsolateral part; PERI, perirhinal area; POST, postsubiculum.
Appendix 1—figure 9
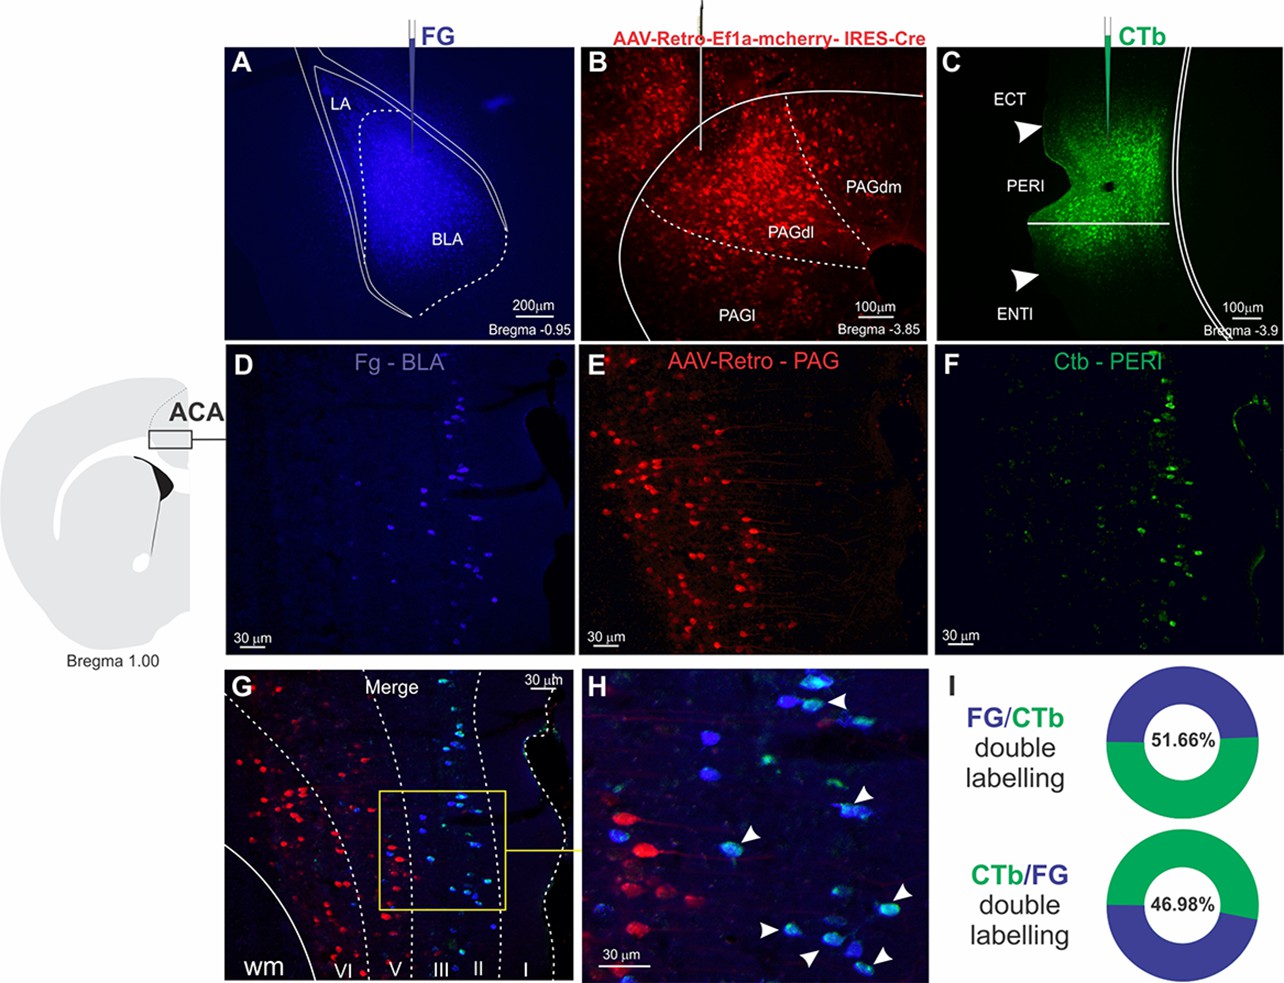
Triple retrograde tracing illustrating the distribution of ACA neurons projecting to the BLA, PERI, and PAGdl.
Upper panel: Fluorescence photomicrographs illustrating the extent and location of unilateral Fluoro Gold deposit in the BLA (A), AAV-Retro-Ef1a-mcherry-IRES-Cre deposit in the PAGdl (B), and Cholera toxin B deposit in the PERI (C). Intermediate panel: Schematic drawing from the Allen Mouse Brain Atlas to indicate the locations of the ACA (on the left), where the fluorescence photomicrographs illustrate the retrogradely labeled cells from the injections placed in the BLA (D), the PAGdl (E), and the PERI (F). Bottom panel: (G) fluorescence photomicrograph merging the images shown in (D), (E), and (F) to illustrate the laminar distribution of the ACA retrogradely labeled cells projecting to BLA, PERI, and PAGdl. (G) Higher magnification of the insert shown in (G) to illustrate double FG-CTb labeled cells, which are indicated with arrowheads. (I) Percentage of Fluoro Gold-labeled cells double labeled for CTb (FG/CTb double labeling), and percentage of CTb labeled cells double labeled for Fluoro Gold (CTb/FG double labeling). Abbreviations: ACA: Anterior cingulate area; BLA, basolateral amygdalar nucleus; CTb, Cholera toxin B; ECT, ectorhinal area; ENTl, entorhinal area, lateral part; FG, Fluoro Gold; PAGdl, dm, l, periaqueductal gray, dorsolateral, dorsomedial and lateral parts; PERI, perirhinal area.
Appendix 1—figure 10
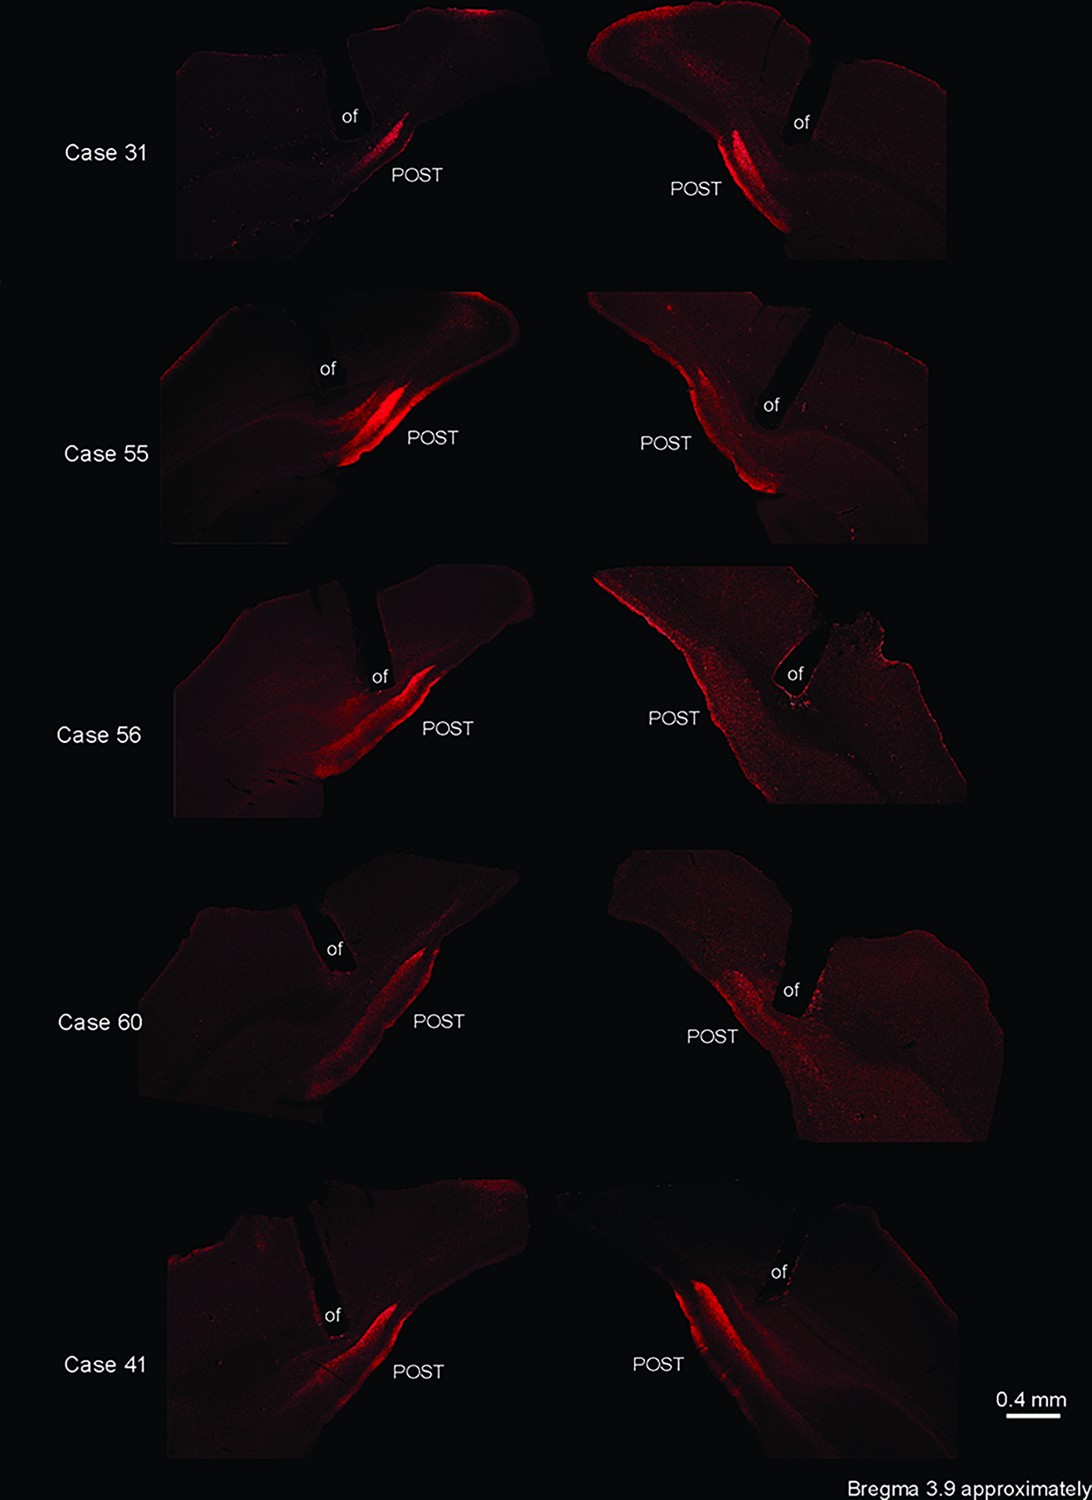
Optic fiber location for optogenetic silencing of the ACA>POST pathway.
Fluorescence photomicrographs illustrating the optic fiber position in five experiments of the group HR+ that received optogenetic silencing of the ACA>POST pathway during cat exposure. Note that in these experiments, there was a large overlap of the optic fiber’s positions, which were suitable to inactivate the ACA>POST pathway. Abbreviations: of, optic fiber; POST, postsubiculum.
Appendix 1—figure 11
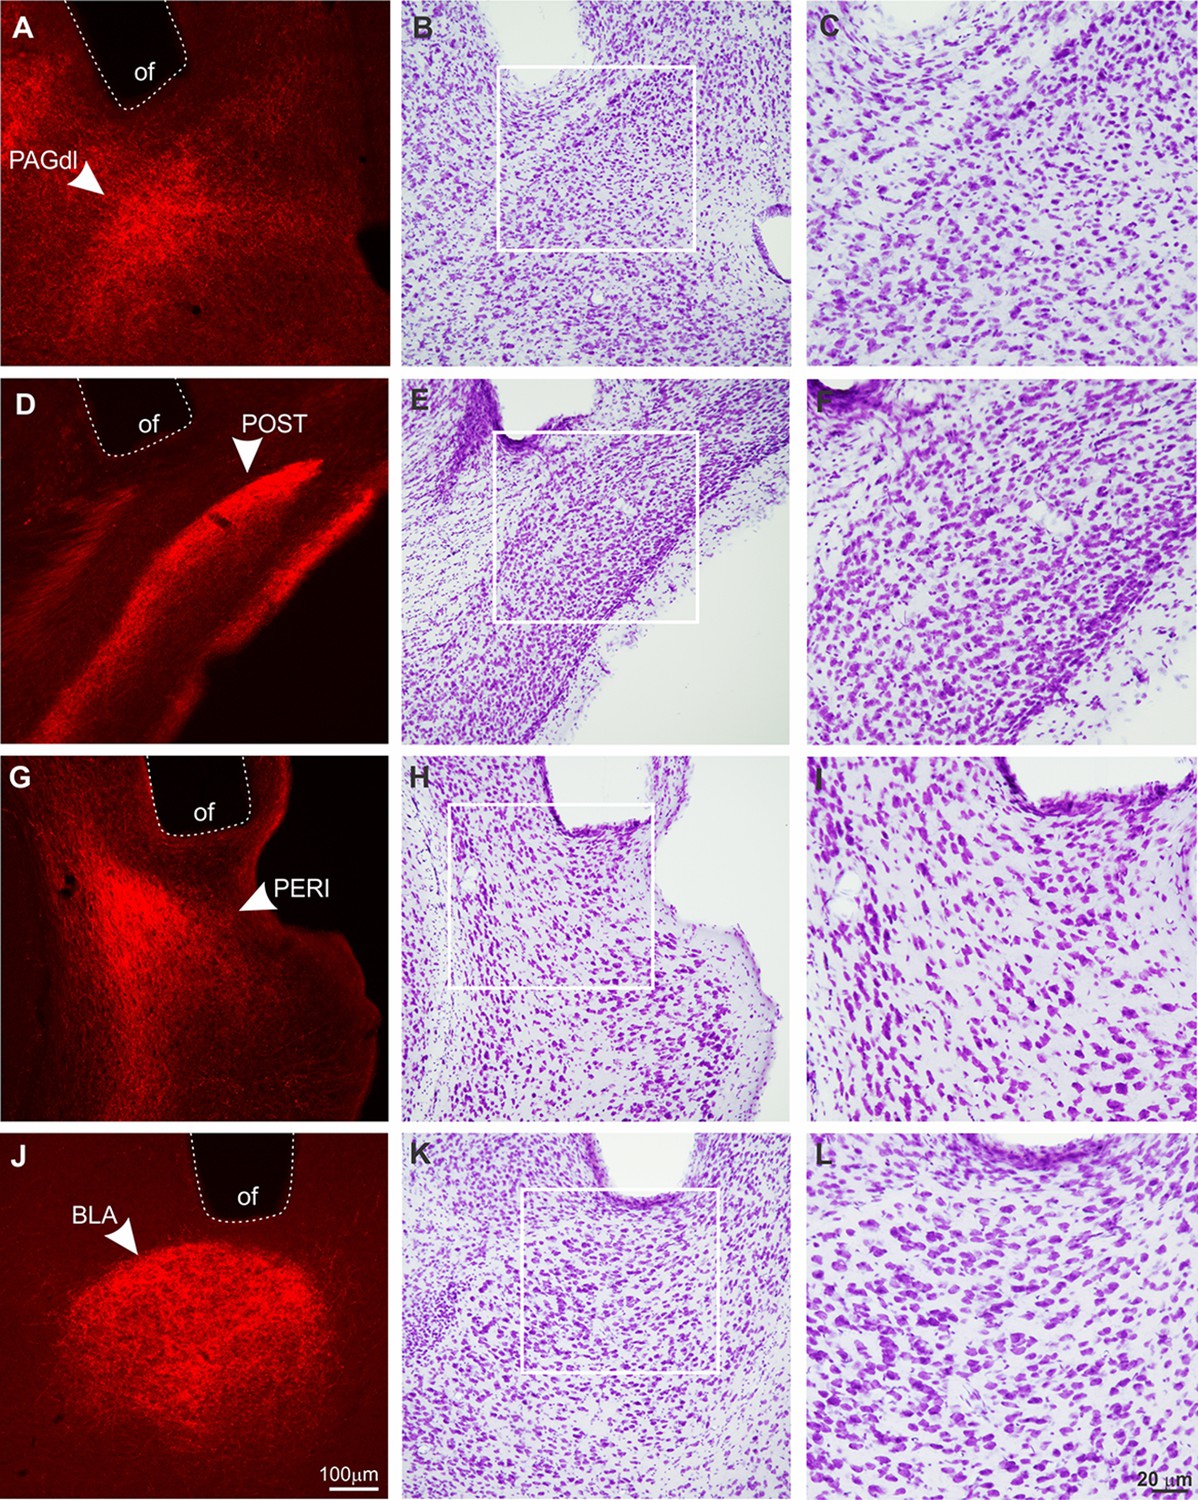
Histological analysis on the surroundings of the optic fiber tips.
Frontal sections showing the optic fibers (of) tip surroundings at the dorsolateral PAG (PAGdl; A–C), postsubiculum (POST; D–F), perirhinal area (PERI; G–I), and basolateral amygdalar nucleus (BLA; J–L). Animals were perfused after behavioral tests. The images shown in (A), (D), (G), and (J) illustrate the optic fibers position right above the ACA terminal fields in the PAGdl, POST, PERI, and BLA, respectively. After capturing these images, the same slices were submitted to the Nissl staining protocol (lower magnification – B, E, H, and K; higher magnification – C, F, I, and L). Note that Nissl staining revealed no tissue damage close to the surroundings of the optic fiber tips, evidenced by the lack of gliosis or neuronal loss. Abbreviations: BLA, basolateral amygdalar nucleus; of, optic fiber; PAGdl, periaqueductal gray, dorsolateral part; PERI, perirhinal area; POST, postsubiculum.
Videos
Appendix 1—video 1
Exposure to the predator and predatory context.
Video to illustrate the behavioral responses of a male mice (C57BL/6) exposed to the cat (PET condition) and the predator-associated environment (Context condition).
Tables
Key resources table
| Reagent type (species) or resource | Designation | Source or reference | Identifiers | Additional information |
|---|---|---|---|---|
| Strain, strain background (Mus musculus) | C57BL/6 | Local breeding facilities | ||
| Strain, strain background (Felis catus) | Male cat | Domestic | ||
| Transfected construct(adeno-associated virus) | AAV5-hSyn-HA-hM4D(Gi)-IRES-mCitrine | Addgene plasmid #50464(RRID: Addegene_50464) | Dr. Bryan Roth; titer≥7×10¹² vg/ml | |
| Transfected construct (adeno-associated virus) | AAV5- hSyn-eGFP | Addgene viral prep #50465 | Dr. Bryan Roth; titer≥7×10¹² vg/ml | |
| Transfected construct(adeno-associated virus) | AAV5-hSyn-eNpHR3-mCherry | University of North Carolina, Vector Core | Titer ≥1×10¹³ vg/ml | |
| Transfected construct(adeno-associated virus) | AAV5-hSyn-mCherry | University of North Carolina, Vector Core | Titer ≥7×10¹² vg/ml | |
| Transfected construct(adeno-associated virus) | AAV-Retro-Ef1a-mcherry- IRES-Cre | Addgene catalog #55632-AAVrg | Karl Deisseroth; Titer ≥7×10¹² vg/ml | |
| Antibody | (Polyclonal rabbit anti-c-Fos) | PC-38; Calbiochem-Millipore (RRID:AB_2106755) | (1:20,000) | |
| Antibody | (Polyclonal anti-rabbit Alexa 594 goat IgG) (H+L) | Invitrogen (RRID:AB_2534079) | (1:500) | |
| Antibody | (Polyclonal rabbit anti-FG antibody) | Chemicon International, CA | (1:5000) | |
| Antibody | (Polyclonal anti-rabbit Alexa 488 Goat IgG) (H+L) | Invitrogen (RRID:AB_143165) | (1:1000) | |
| Antibody | (Polyclonal anti-rabbit Alexa 405 goat IgG) (H+L) | Invitrogen (RRID:AB_221605) | (1:500) | |
| Antibody | (Polyclonal goat anti-CTb) | List Biological Laboratories, Campbell, CA | (1:20,000) | |
| Antibody | (Polyclonal anti-goat Alexa 488 donkey IgG) (H+L) | Invitrogen (RRID:AB_2534102) | (1:500) | |
| Chemical compound, drug | Fluoro Gold | Fluorochrome Inc, CO | FG | |
| Chemical compound, drug | Isoforine | Cristália Laboratories, SP, Brazil | ||
| Chemical compound, drug | Clozapine-N-oxide | Tocris Bioscience, UK | CNO | |
| Chemical compound, drug | Subunit B of the cholera toxin | List Biological Laboratories, Campbell, CA | CTb | |
| Software, algorithm | Fiji | https://imagej.net/software/fiji/ (RRID:SCR_002285) | ||
| Software, algorithm | BORIS software | DOI: 10.1111/2041–210X.12584 (RRID:SCR_021434) | Behavior Observation Research Interactive Software | |
| Software, algorithm | pClamp 10.7 | Molecular Devices, USA (RRID:SCR_011323) | ||
| Software, algorithm | Clampfit 10.7 | Molecular Devices, USA | ||
| Software, algorithm | CorelDraw 2018 | https://www.coreldraw.com/br/pages/coreldraw-2018/ (RRID:SCR_014235) | ||
| Software, algorithm | Statistica 7.0 | StatSoft (RRID:SCR_014213) | ||
| Other | DAPI | Sigma-Aldrich | 1:20,000 |
Appendix 1—table 1
Behavioral data from male (n=6) and female (n=6) mice during the PET and Context conditions.
| Predator exposure test (PET) | Context | |||
|---|---|---|---|---|
| Male | Female | Male | Female | |
| Freezing | 102.8±4.1 | 98.2±5.5 | 0±0 | 0±0 |
| Risk assessment | 107.6±3.5 | 110.9±6.2 | 161.6±8.2 | 162.8±6.9 |
| Exploration | 25.8±2.5 | 31.9±3.0 | 37.9±4.4 | 34.7±5.2 |
Appendix 1—table 2
Escape responses.
| ACA – Pharmaco inhibition | AM>ACA Opto inhibition | |||||||
|---|---|---|---|---|---|---|---|---|
| Phase | GROUP | PET_Esc | CONT_Esc | Phase | GROUP | PET_Esc | Cont_Esc | |
| Acquisition | hM4D+ | 1.57±0.3 | 0.43±0.2 | Acquisition | HR+ | 1.5±0.28 | 0.5±0.26 | |
| Acquisition | hM4D− | 1.67±0.21 | 0.33±0.33 | Acquisition | HR− | 1.43±0.3 | 0.43±0.2 | |
| Expression | hM4D+ | 1.57±0.3 | 0.57± 0.2 | |||||
| Expression | hM4D− | 1.6±0.4 | 0.4±0.24 | |||||
| ACA>BLA Opto inhibition | ACA>PERI Opto inhibition | |||||||
| Phase | GROUP | PET_Esc | CONT_Esc | Phase | GROUP | PET_Esc | CONT_Esc | |
| Acquisition | HR+ | 1.5±0.26 | 0.37±0.18 | Acquisition | HR+ | 1.66±0.33 | 0.16±0.16 | |
| Acquisition | HR− | 1.33±0.21 | 0.33±0.21 | Acquisition | HR− | 1.4± 0.24 | 0.4±0.24 | |
| Expression | HR+ | 1.28±0.18 | 0.5±0.27 | Expression | HR+ | 1.5±0.22 | 0.16±0.16 | |
| Expression | HR− | 1.5±0.34 | 0.33±0.21 | Expression | HR− | 1±0 | 0.2±0.19 | |
| ACA>POST Opto inhibition | ACA>PAG Opto inihibition | |||||||
| Phase | GROUP | PET_Esc | CONT_Esc | Phase | GROUP | PET_Esc | CONT_Esc | |
| Acquisition | HR+ | 1.33±0.21 | 0±0 | Acquisition | HR+ | 1.43±0.14 | 0.14±0.14 | |
| Acquisition | HR− | 1.2±0.37 | 0.4±0.24 | Acquisition | HR− | 1.4±0.24 | 0.2±0.22 | |
| Expression | HR+ | 1.16±0.18 | 0.33±0.18 | Expression | HR+ | 1.5±0.24 | 0.33±0.23 | |
| Expression | HR− | 1.2±0.19 | 0±0 | Expression | HR− | 1±0 | 0.2±0.19 | |
Additional files
Download links
A two-part list of links to download the article, or parts of the article, in various formats.
Downloads (link to download the article as PDF)
Open citations (links to open the citations from this article in various online reference manager services)
Cite this article (links to download the citations from this article in formats compatible with various reference manager tools)
The anterior cingulate cortex and its role in controlling contextual fear memory to predatory threats
eLife 11:e67007.
https://doi.org/10.7554/eLife.67007


