Motor planning under uncertainty
- John A. Paulson School of Engineering and Applied Sciences, Harvard University, United States
- Center for Brain Science, Harvard University, United States
Figures
Figure 1
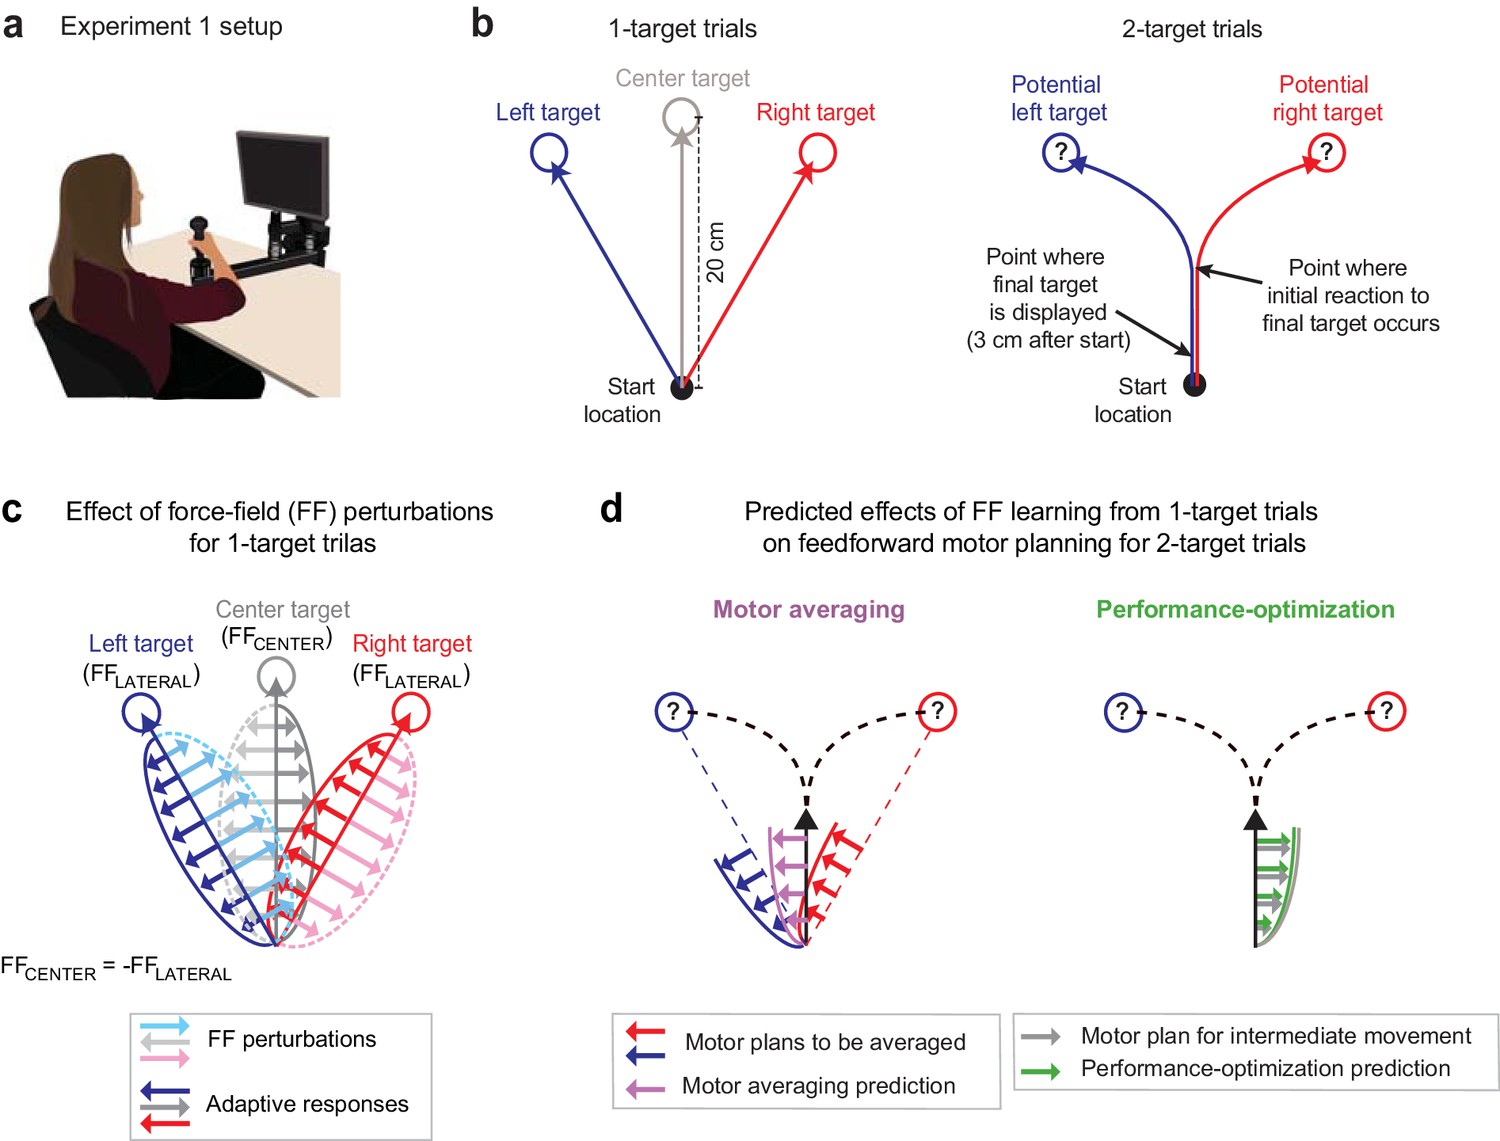
Multiple force-field (multi-FF) environment paradigm.
(a) Setup for the multi-FF environment experiments. We altered environmental dynamics by exposing participants to viscous curl FFs in which the force vector perturbing reaching movements was proportional in magnitude and perpendicular in direction to the velocity of the hand (see Materials and methods). (b) Diagram of unperturbed 1- and 2-target trial types. On 1-target trials (left panel), a single target located in the left (+30°), right (−30°), or center (0°) direction was presented, and participants were instructed to initiate rapid 20 cm reaching movements to the target after an auditory go cue. On 2-target trials (right panel), a pair of potential targets, always in the left and right target directions, was presented before the go cue. Then, 3 cm after movement onset, we extinguished one target and highlighted the other to indicate the final goal. Delaying the precise goal information in this manner typically leads to initial reaching movements directed in-between potential target locations before participants produce in-flight movement corrections towards the final target. (c) Individual-target FF perturbations. During 1-target trials, we perturbed movements to the left and right targets with FFLATERAL (light blue and pink arrow and dotted trace sets, respectively) and the center target with FFCENTER (light gray arrow and dotted trace sets). The directions of FFLATERAL and FFCENTER were counterbalanced across participants, but always with FFCENTER = -FFLATERAL. Training in this composite environment alters the adaptive responses (darker solid arrow trace sets) in accordance with the FF imposed on each target. Note that the adaptive response on 1- and 2-target trials was measured as the force patterns participants produced on error clamp and partial error clamp trials, respectively (see Materials and methods). (d) Predictions for motor averaging (MA) and performance optimization (PO) for feedforward motor planning during uncertainty. Because both potential targets (left and right) were associated with FFLATERAL, MA (purple arrows) predicts a force pattern consistent with FFLATERAL on 2-target trials. However, since the initial motion on these 2-target trials is in the direction of the center target, PO (green arrows) predicts the force pattern consistent with FFCENTER, which is opposite the MA prediction.
Figure 2
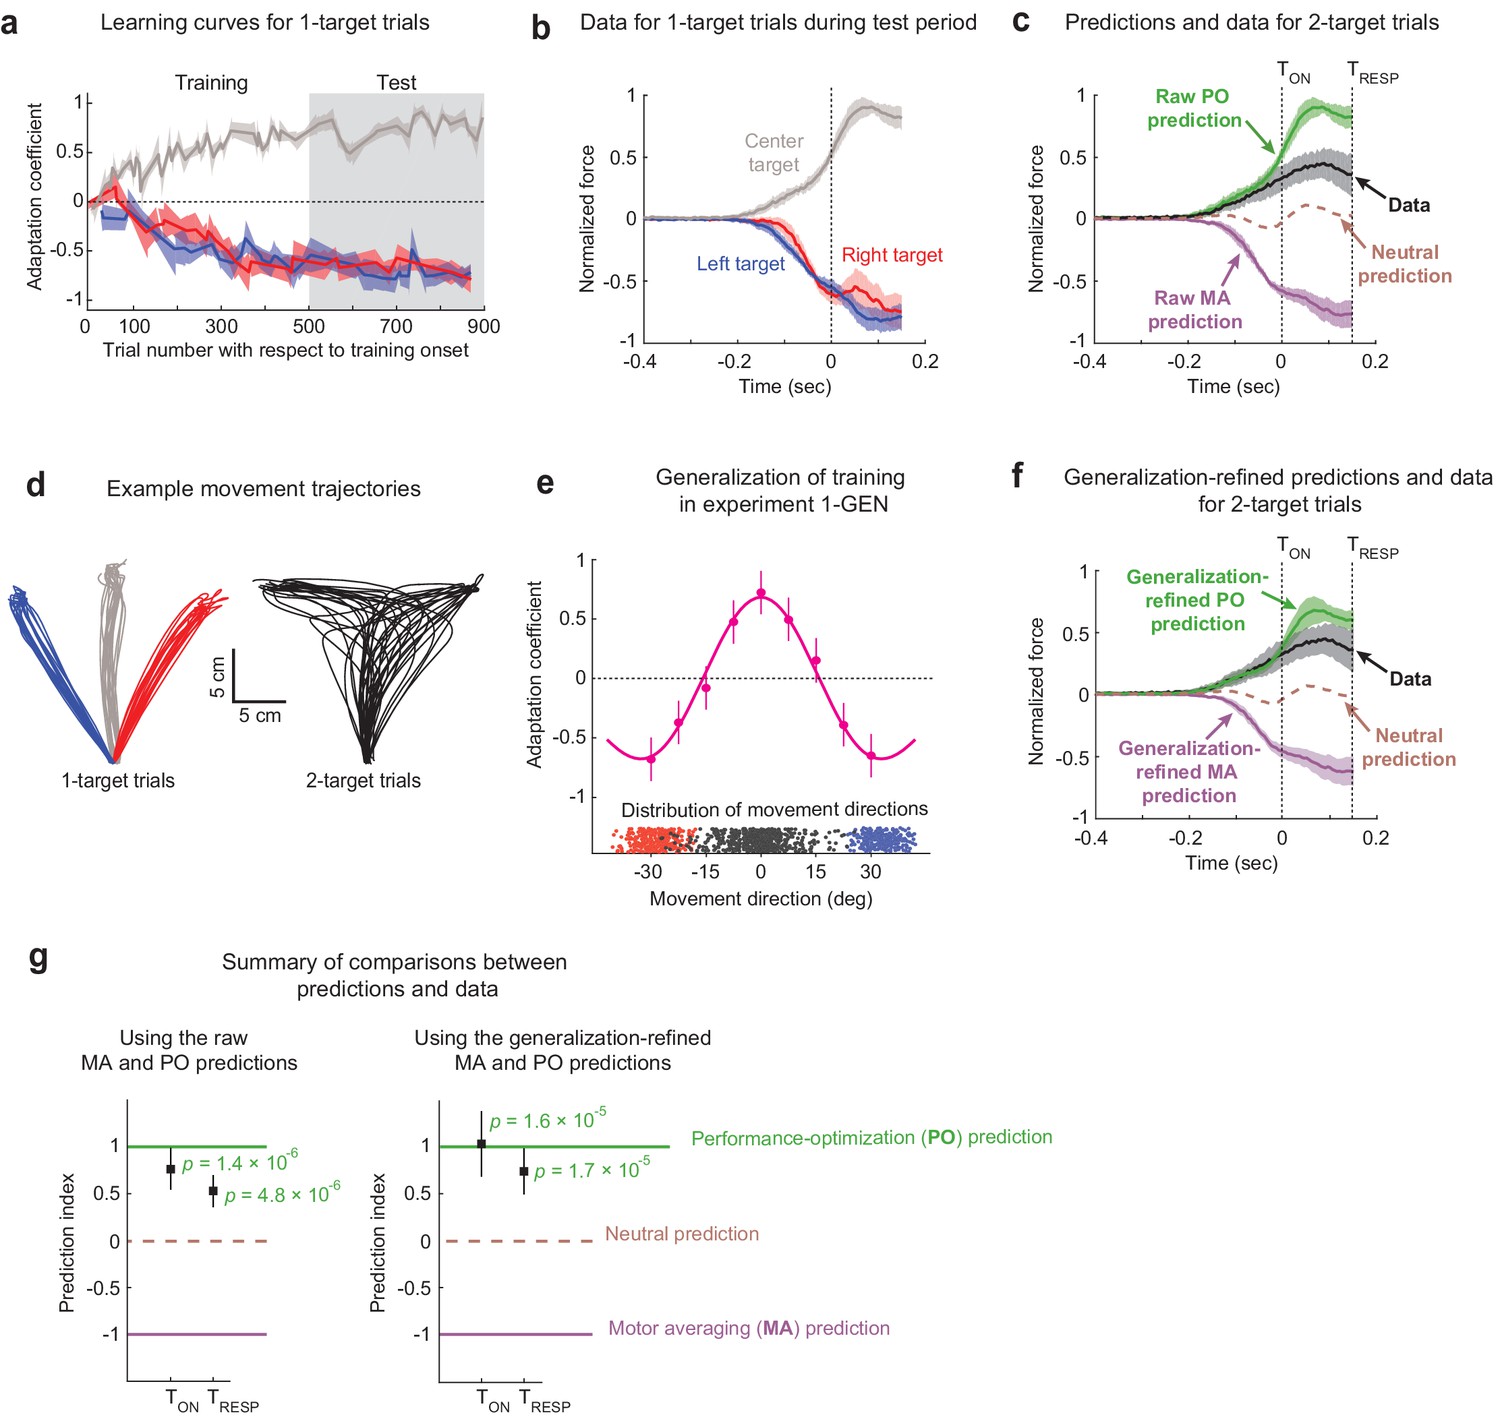
The effects of motor adaptation induced by novel environmental dynamics indicate performance optimization (PO) during uncertainty.
(a) Learning curves for 1-target trials. Participants (n = 16) readily adapted left (blue), right (red), and center (gray) 1-target trial movements during the training period and maintained this adaptation during the test period. Note that experiments were balanced with +15/–15/+15 Ns/m force-fields (FFs) applied for the left/center/right targets in half the participants and −15/+15/−15 Ns/m in the other half, and that adaptation coefficients of +1 refer to ideal learning for the center target FF, and adaptation coefficients of −1 refer to ideal learning for the left/right target FFs. (b) Population-averaged force profiles from 1-target error clamp trials measured during the test period. Data is normalized so that +1 refers to the amplitude of the maximum force in the ideal adaptive response for the FF associated with the center target. (c) Raw predictions (green and purple) and force profile data (black) for 2-target partial error clamp trials. The raw PO prediction is based on the adaptive response for the center target, and the raw motor averaging (MA) prediction is based on averaging the adaptive responses for the two (right and left) potential targets. The midpoint between the MA and PO predictions provides a neutral prediction reference (brown dashed trace), indicating that the experimental data are more closely aligned with PO than MA. (d) Randomly selected trajectories from an example participant demonstrate non-trivial variability for movement directions in both 1- and 2-target trials. (e) Generalization data (magenta) from Expt 1-GEN (n = 10) is well characterized by a function obtained by summing Gaussians centered on each trained direction (+30°/0°/−30°). Blue and red dots indicate movement direction distributions for left and right 1-target trials, and black dots indicate the corresponding distribution for 2-target trials across all participants. (f) Generalization-refined predictions and force profile data from 2-target partial error clamp trials, where we used data from Expt 1-GEN to account for the effect of movement direction variability on the MA and PO predictions from Expt 1 (see Materials and methods). (g) Summary comparison between the data (black squares) and predictions (dashed lines). Both panels show a prediction index where −1 corresponds to the MA prediction and +1 corresponds to the PO prediction. This index was calculated by comparing the mean value for the force profile in the data to that from both model predictions, with means computed from the time of the go cue until either the target cue onset (TON) or when target-specific responses were first statistically detectable (TRESP). The left panel shows results based on the raw predictions in panel (c), and the right panel shows results based on the refined predictions in panel (f). The experimental data are significantly closer to the PO prediction than the nearly opposite MA prediction for both raw and generalization-refined versions of the predictions. In all panels, the shaded regions and error bars represent 95% CIs.
Figure 3
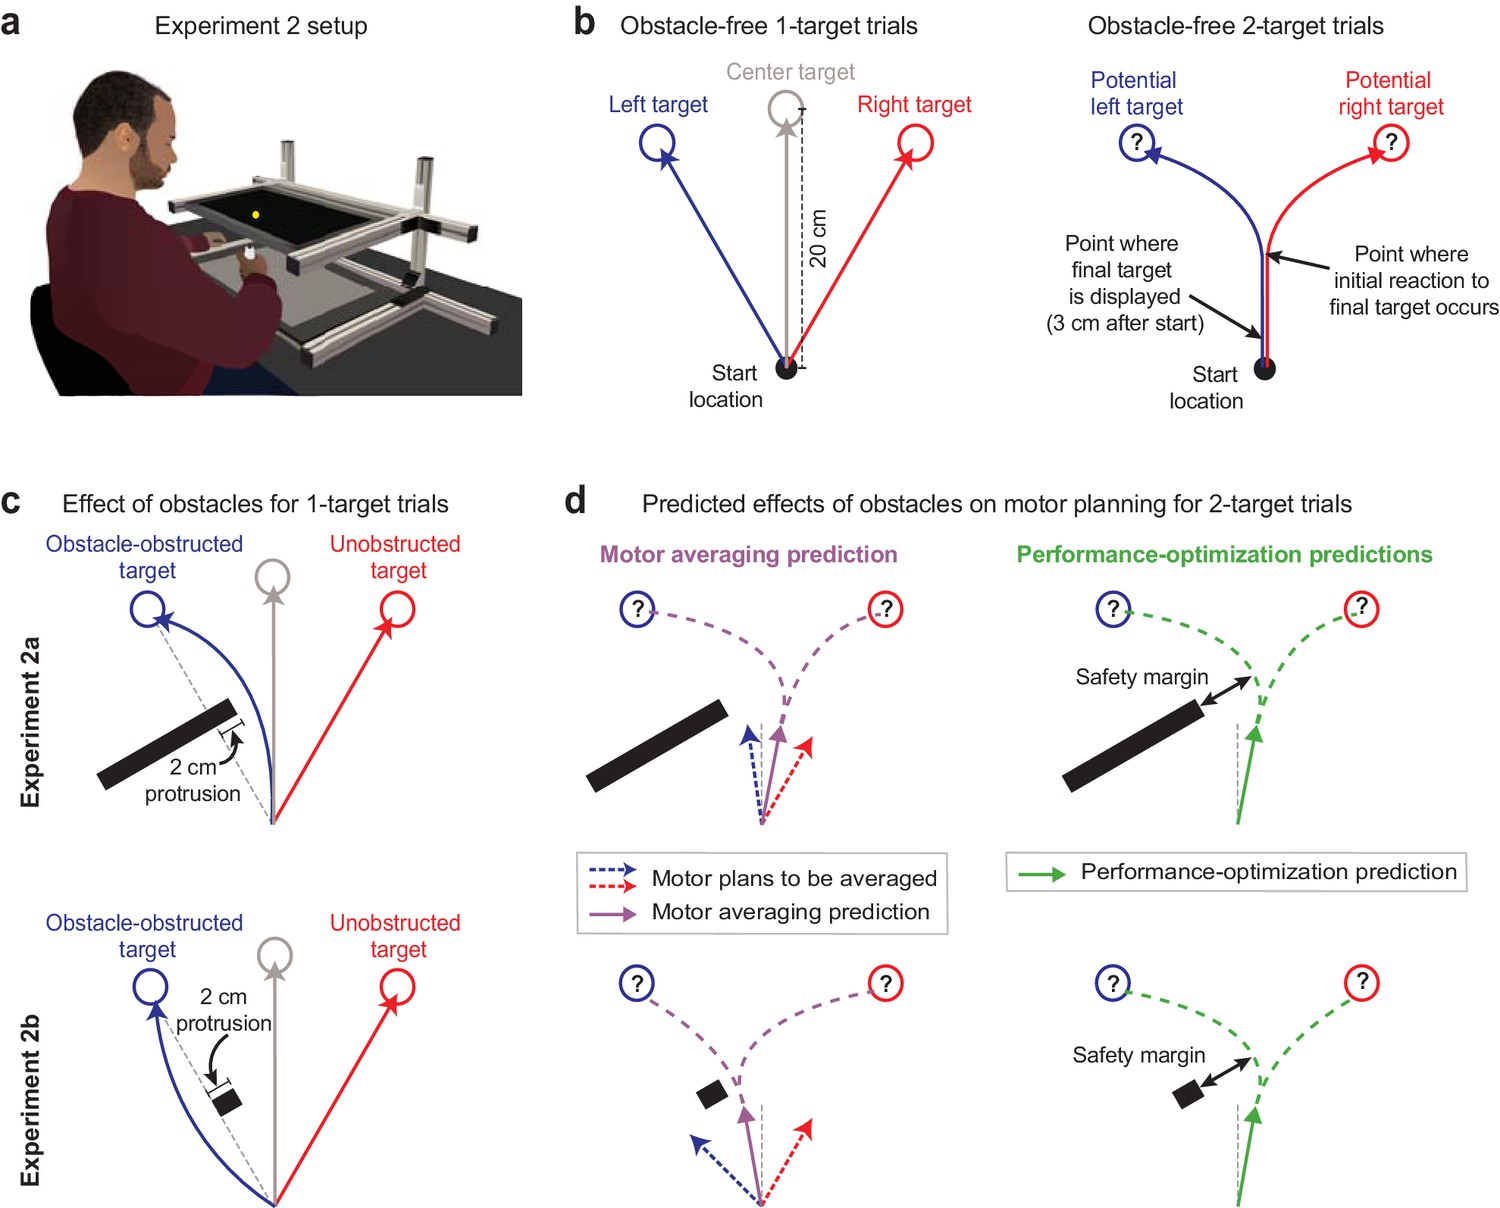
Obstacle avoidance paradigm.
(a) Setup for the obstacle avoidance experiments, where virtual obstacles could obstruct movements to on-screen targets. (b) Illustration of obstacle-free 1-target and 2-target trials, similar to Figure 1b. (c) Diagram of left-side obstacle-present 1-target trials. The obstacle in Expt 2a was designed to elicit rightward movement deflections for left 1-target trials. The obstacle in Expt 2b, which included an identical protrusion towards the midline, was designed to promote a leftward deflection for left 1-target target trials. (d) Predictions during uncertainty. Left panels: motor averaging (MA; purple arrow) would average the plans for the obstacle-obstructed left and unobstructed right 1-target trial movements. It thus predicts initial movement directions on 2-target trials with opposite deflections from the midline for Expts 2a and 2b (away from the obstacle in Expt 2a, but towards the obstacle in Expt 2b, where the safety margin around the obstacle would be reduced). Right panels: performance optimization (PO; green) would promote task success by balancing the costs of safely avoiding the obstacle and rapid target acquisition. It thus predicts initial movement directions on 2-target trials to be consistently deflected away from the obstacle. Thus, PO and MA make similar predictions in Expt 2a, but opposite predictions in Expt 2b. Note that (c) and (d) depict a left-side obstacle condition, but that the experiments were balanced within participants, with an equal number of trials for left- and right-side obstacles. A right-side obstacle condition would lead to mirror-opposite predictions for both MA and PO.
Figure 4 with 1 supplement
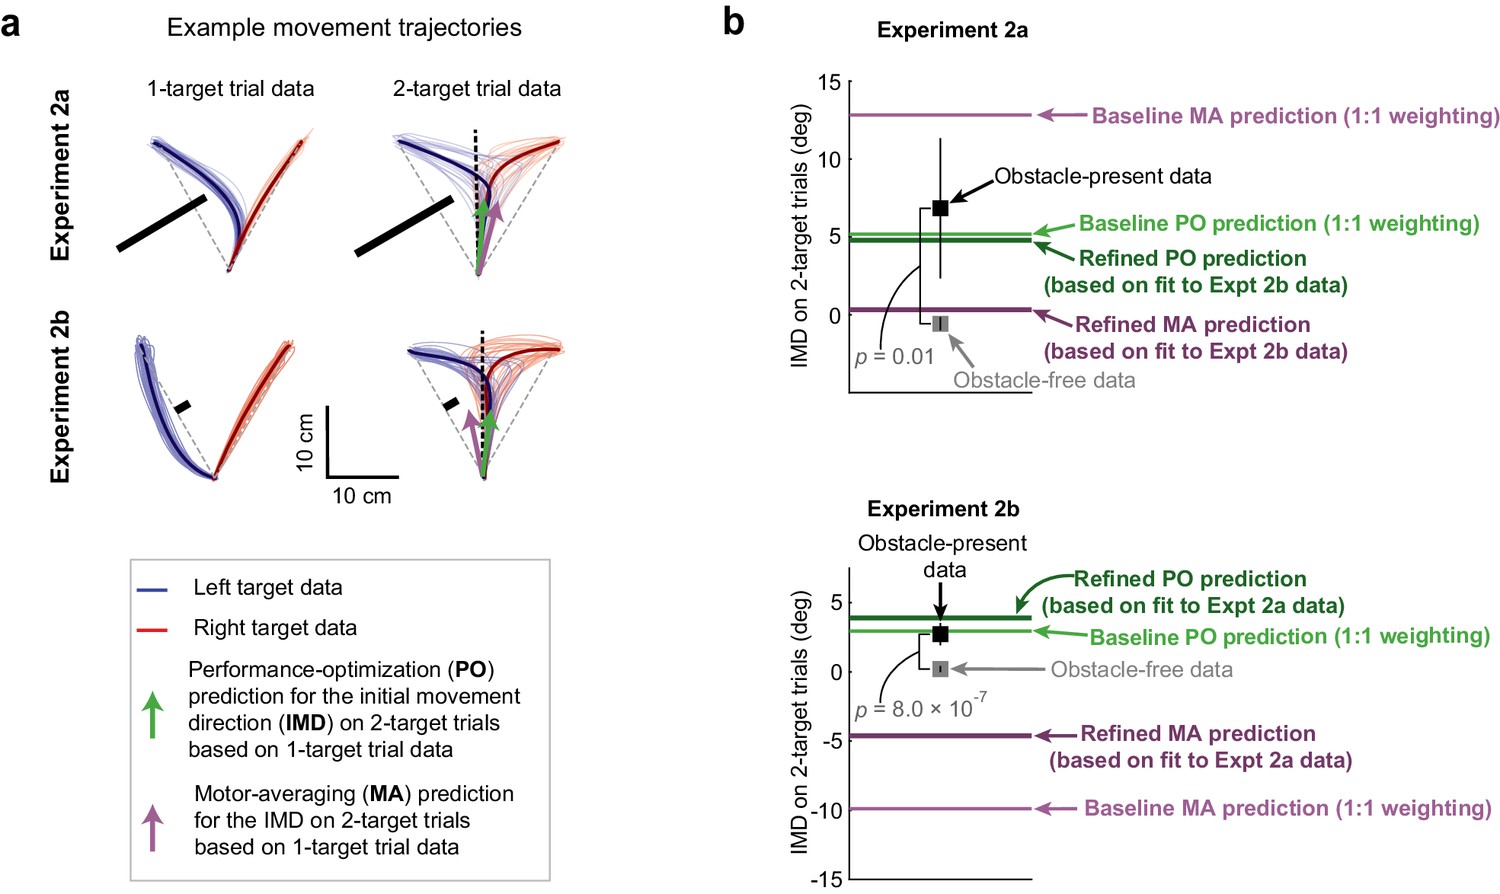
Obstacle avoidance patterns indicate performance optimization (PO) during uncertainty.
(a) Hand paths showing the effect of obstacles on 1- and 2-target trials for sample participants in Expts 2a and 2b. Thin lines indicate a random sampling of trajectories on individual trials where the left (blue) or right (red) targets were cued, and bold traces indicate trial-averaged trajectories. On 1-targets, the obstacles induce substantial deflections for movements towards the obstacle-obstructed target, but in opposite directions for Expt 2a (n = 8) and Expt 2b (n = 26). Motor averaging (MA) PO predictions for the initial movement direction (IMD) on obstacle-present 2-target trials are displayed as purple and green arrows. These two predictions are similar in Expt 2a, but more distinct in Expt 2b. (b) Population-averaged IMDs on obstacle-free (gray squares) and obstacle-present (black squares) 2-target trials are shown alongside model predictions by MA (purple lines) and PO (green lines). Predictions from two versions of the MA model and two versions of the PO model are displayed. The ‘baseline’ predictions (which were used in panel a) were parameter-free and used equal weighting of the two potential motor plans for MA and of the two objectives for PO (see Equations 1 and 2). The ‘refined’ predictions each incorporated a single weighting parameter that determined the relative contributions of the two potential motor plans for MA and of the two objectives for PO (see Equations 3 and 4). Cross-validated predictions are shown for these ‘refined’ single-parameter models, where the weighting parameter applied to the Expt 2a data was determined from the Expt 2b data, and vice versa (see Materials and methods). Results indicate that on obstacle-present 2-target trials, IMDs were systematically biased away from the obstacle and were significantly larger than the IMDs observed on obstacle-free 2-target trials (compare black vs grey squares). Both the baseline and refined PO models predict the obstacle-present 2-target trial data significantly better than the baseline and refined MA models in Expt 2b, where gross differences in the model predictions were expected (compare black squares vs purple and green lines). In Expt 2a, where qualitative differences between the model predictions were not expected, we found that the baseline and refined PO models predicted the obstacle-present 2-target trial data only nominally better than the baseline and refined MA models. Error bars represent 95% CIs.
Figure 4—figure supplement 1
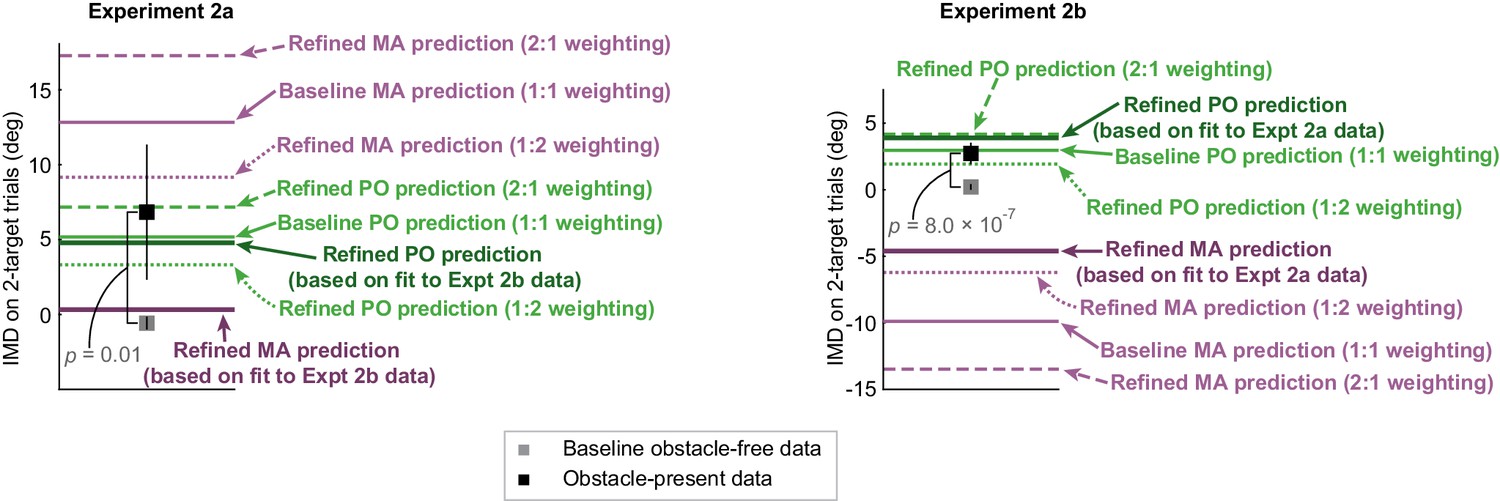
Model sensitivity analysis.
In addition to the baseline and refined predictions that we examined in Figure 4b, we also examined predictions that were driven by a distinct set of weighting coefficients so that we might better understand each model’s sensitivity to its weighting parameter (see Equation 3 and 4 for more information about these weighting coefficients). Specifically, in the motor averaging (MA) model, we examined predictions that were based on 1:2 and 2:1 weighting for the obstacle-obstructed and unobstructed target (i.e., one model prediction with and another with ) and analogously, in the performance optimization (PO) model, we examined predictions that were based on 1:2 and 2:1 weighting for the motor costs associated with movement timing and obstacle avoidance (i.e., one model prediction with and another with ). The population-averaged MA and PO model predictions based on these weighting coefficients are displayed, and are presented alongside the baseline and refined predictions shown in Figure 4b. In Expt 2a, we found that the MA and PO predictions based on 1:2 weighting resulted in mean squared errors (MSEs) of 40.37 ± 19.12 deg2 vs. 48.48 ± 39.92 deg2, respectively, and a prediction index that indicates no significant difference between the models’ abilities to predict the data (prediction index = −0.30 ± 1.73; p=0.75, t(7) = −0.34; t-test). Furthermore, we found the models resulted in similar predictive ability even when they were driven by 2:1 weighting instead (we found MSEs of 140.54 ± 28.18 deg2 vs. 37.03 ± 25.53 deg2 for MA and PO, respectively; prediction index = 1.01 ± 0.89; p=0.06, t(7) = 2.23; t-test). Thus the MA and PO predictions based on 1:2 and 2:1 weighting resulted in similar predictions in Expt 2a, where gross differences between MA and PO were not expected. These results are in line with those based on the baseline and refined predictions from Figure 4b. In Expt 2b, we found that the MA and PO predictions based on 1:2 weighting resulted in predictions that were very different from one another, and significantly favored PO (we found MSEs of 84.30 ± 8.51 deg2 vs. 4.77 ± 2.07 deg2 for MA and PO, respectively; prediction index = 1.19 ± 0.20; p=9.33 × 10⁻¹², t(25) = 11.85; t-test). The PO model’s ability to outperform the MA model also held when the weighting coefficients were based on 2:1 weighting (MSEs of 269.65 ± 14.49 deg2 vs. 5.66 ± 1.15 deg2 for MA and PO, respectively; prediction index = 0.86 ± 0.0.09; p=4.70 × 10⁻¹⁶, t(25) = 18.41; t-test). Thus, in Expt 2b, where gross differences between MA and PO were expected, the MA model based on both 1:2 and 2:1 weighting failed to predict the experimental data, whereas the PO model based on the same weights maintained the predictive ability that was found in the baseline and refined PO models from Figure 4b. These results suggest that the models’ sensitivity to the weighting parameters is unlikely to be the reason why PO predicts feedforward motor planning during uncertainty, and why MA consistently fails.
Figure 5
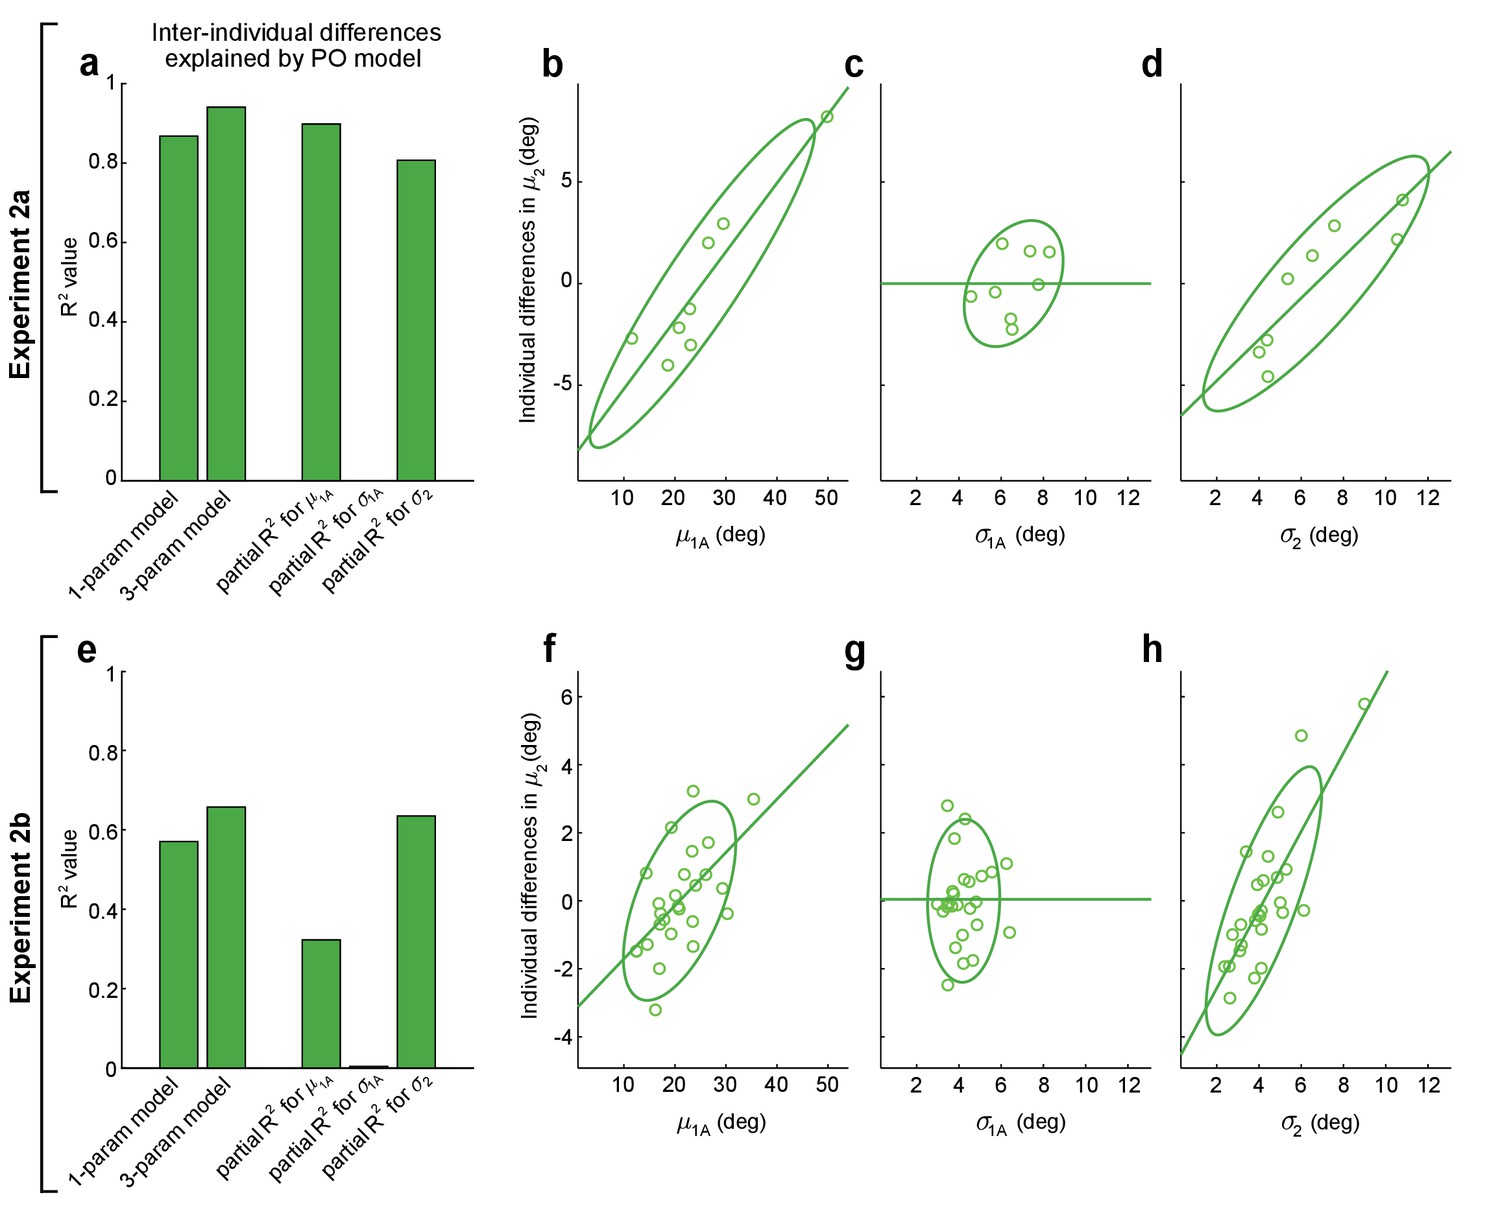
Performance optimization (PO) predicts individual differences in obstacle avoidance.
(a–d) show analogous analyses to (e–h), for Expts 2a and 2b, respectively. (a, e) The first and second bars show the proportion of variance explained (R2) for inter-individual differences in mean movement directions on obstacle-present 2-target trials, , for the one-parameter-plus-offset and the three-parameter-plus-offset versions of the PO model (Equations 5 and 6). The remaining three bars show the proportion of variance explained (partial-R2) for the three-parameter-plus-offset PO model attributable to each of the three input variables: the safety margin observed on obstacle-obstructed 1-target trials (), the motor variability observed on obstacle-obstructed 1-target trials (), and the motor variability observed on obstacle-present 2-target trials (). The contributions of each input variable are illustrated in (b–d) for Expt 2a and (f–h) for Expt 2b, where the relationship is shown between each input variable and the individual differences in that remain after controlling for the effects of the other two input variables (see Materials and methods). In both Expts 2a and 2b, results indicate that and contribute significantly but does not. The lack of contribution from may be due to its small dynamic range seen in (c) and (g). Notably, the results in (f) are odds with motor averaging (MA), which predicts a negative relationship between and in Expt 2b, as are the results in (d) and (h), where MA would predict no relationship between and . Green lines show linear fits to the data and ellipses show 95% CIs.
Author response image 1

Author response image 2

Additional files
Download links
A two-part list of links to download the article, or parts of the article, in various formats.
Downloads (link to download the article as PDF)
Open citations (links to open the citations from this article in various online reference manager services)
Cite this article (links to download the citations from this article in formats compatible with various reference manager tools)
Motor planning under uncertainty
eLife 10:e67019.
https://doi.org/10.7554/eLife.67019


