RSC primes the quiescent genome for hypertranscription upon cell-cycle re-entry
- Basic Sciences Division, Fred Hutchinson Cancer Research Center, United States
Figures
Figure 1 with 2 supplements
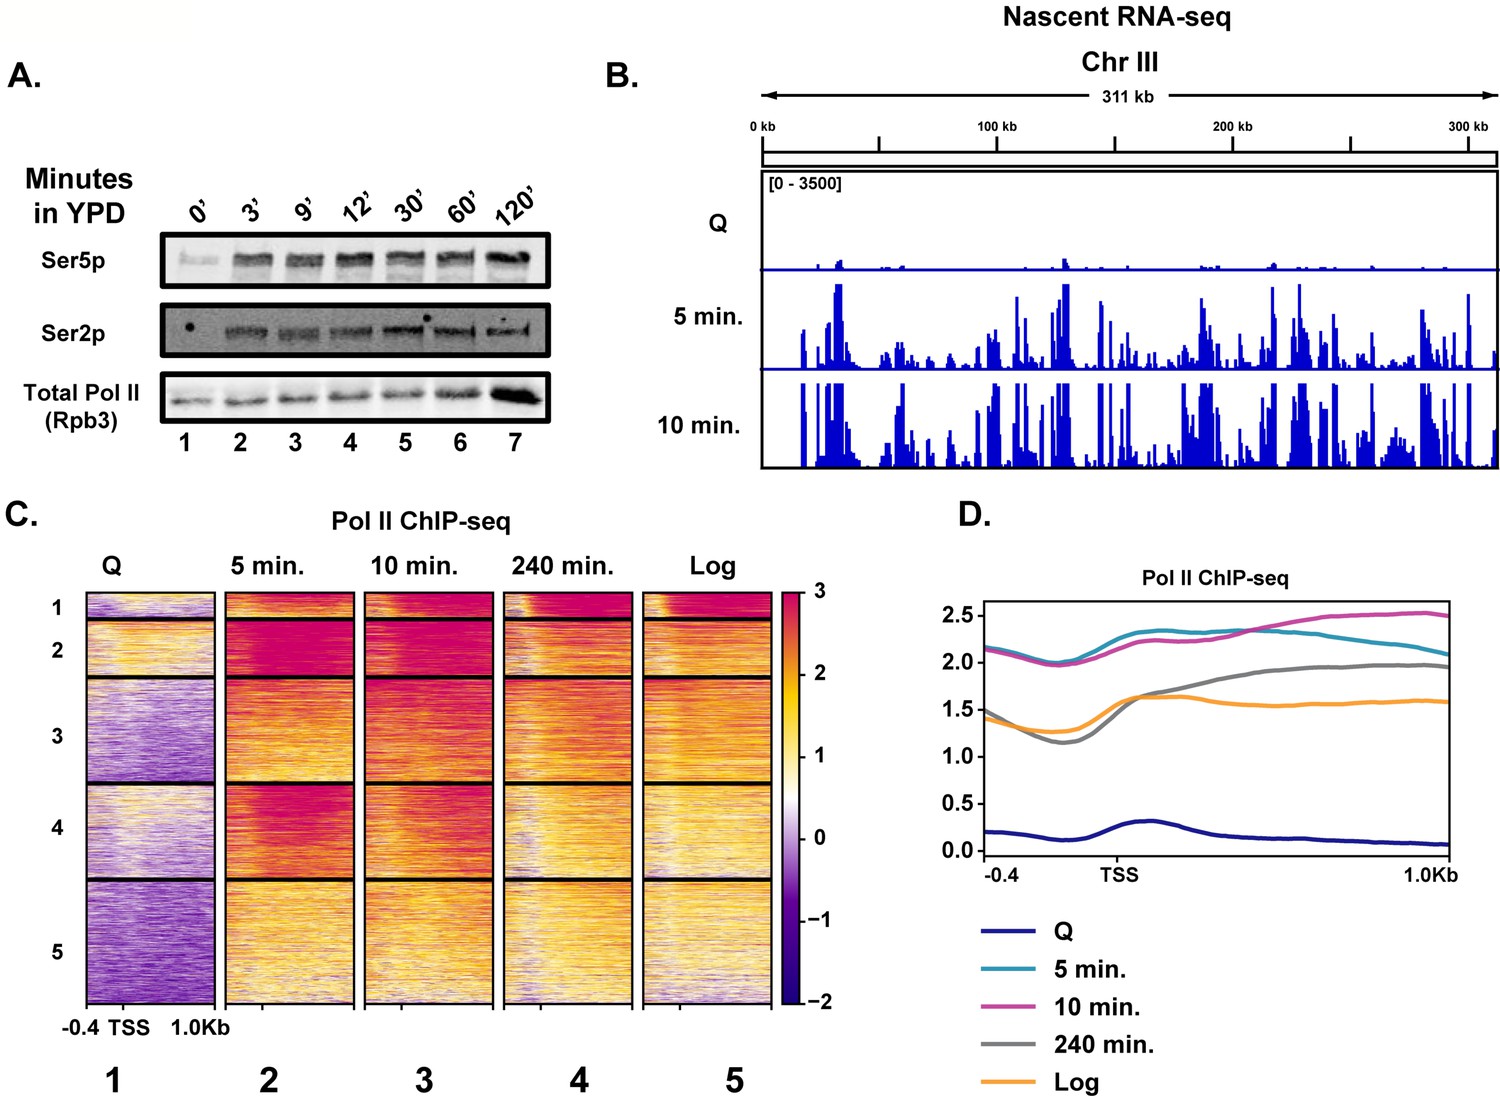
Rapid hypertranscription occurs upon nutrient repletion of quiescent cells.
(A) Western blots were probed with antibodies to detect Ser5p and Ser2p of the CTD of Rpb1 subunit of Pol II. An antibody against the Rpb3 subunit of Pol II was used as a loading control. (B) Nascent RNA-seq analysis. (C) Pol II ChIP-seq analysis. Heatmaps show k-means clusters of 6030 genes. Genes are linked across the heatmaps. (D) Metaplots of ChIP-seq data shown in (C) without k-means clustering.
-
Figure 1—source data 1
Gene Ontology analysis of genes transcribed during quiescence exit.
- https://cdn.elifesciences.org/articles/67033/elife-67033-fig1-data1-v2.txt
Figure 1—figure supplement 1
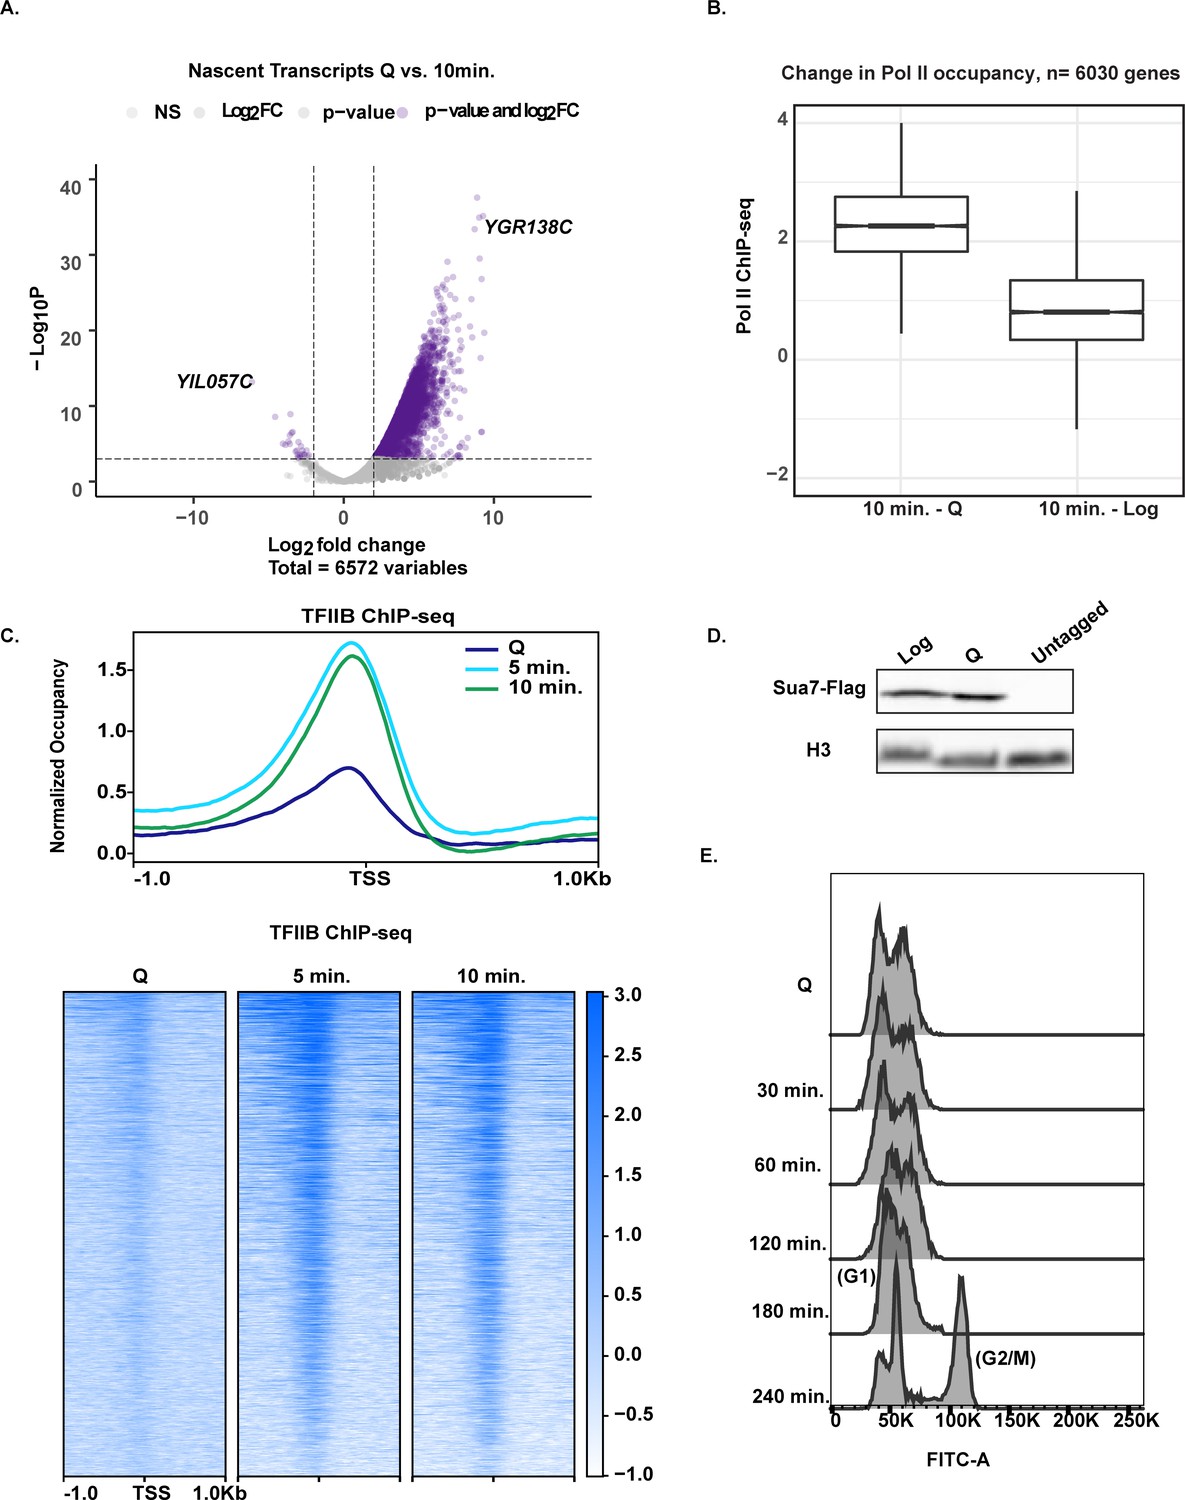
Rapid and broad transcription occurs during the first minutes of exit.
(A) Volcano plot of nascent transcripts comparing significant changes in expression using a two-fold cutoff. (B) Boxplots illustrating the difference in Pol II ChIP-seq signals across genes. Log2 ratio values were subtracted (ex: Q log2 values were subtracted from 10 min log2 values). (C) TFIIB ChIP-seq analysis in Q cells and exit time points. Genes are linked across the time points and are aligned to TSS. (D) Western blot of flag-tagged Sua7 in Q and log cells with H3 as a loading control. (E) DNA content FACS analysis indicating cell-cycle progress during Q exit.
-
Figure 1—figure supplement 1—source data 1
Differential expression analysis of genes expressed in exit.
- https://cdn.elifesciences.org/articles/67033/elife-67033-fig1-figsupp1-data1-v2.xlsx
Figure 1—figure supplement 2
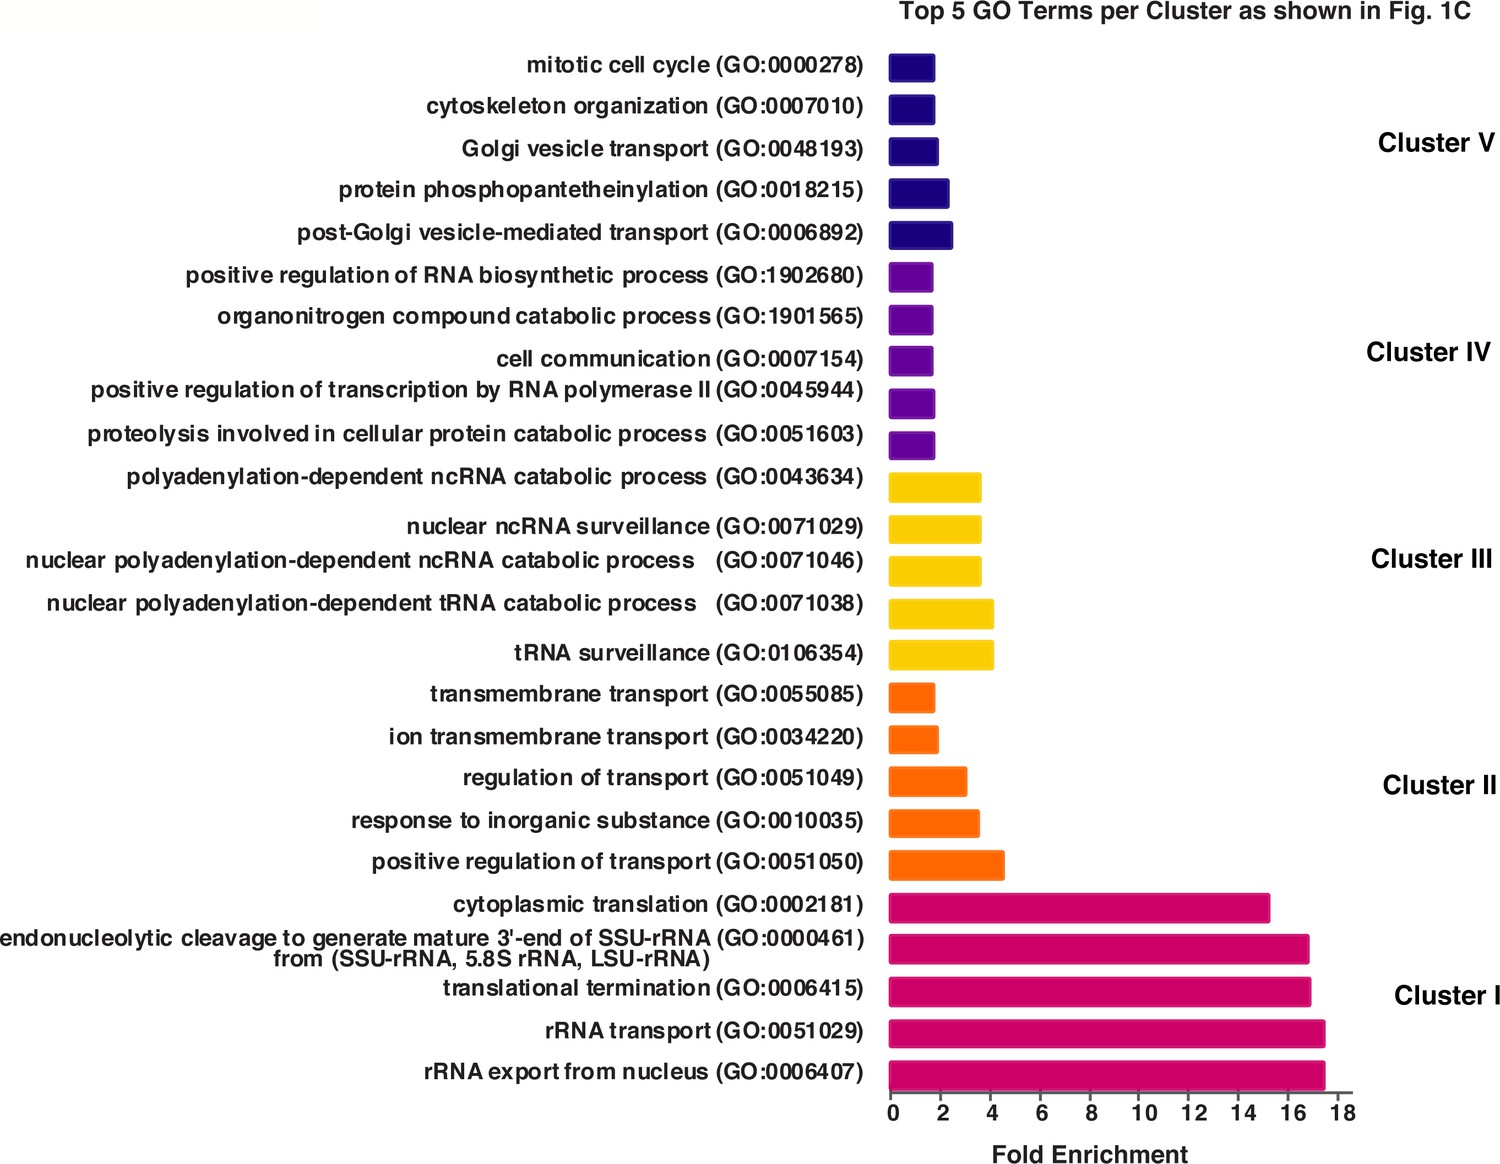
Genes enriched in each cluster of genes shown in Figure 1C.
Gene Ontology (GO) analysis of genes within each cluster from k-means clustering shown in Figure 1C. The top five GO terms are presented per cluster and shown is the Fold-Enrichment of GO terms using an false discovery rate cutoff of <0.05.
Figure 2
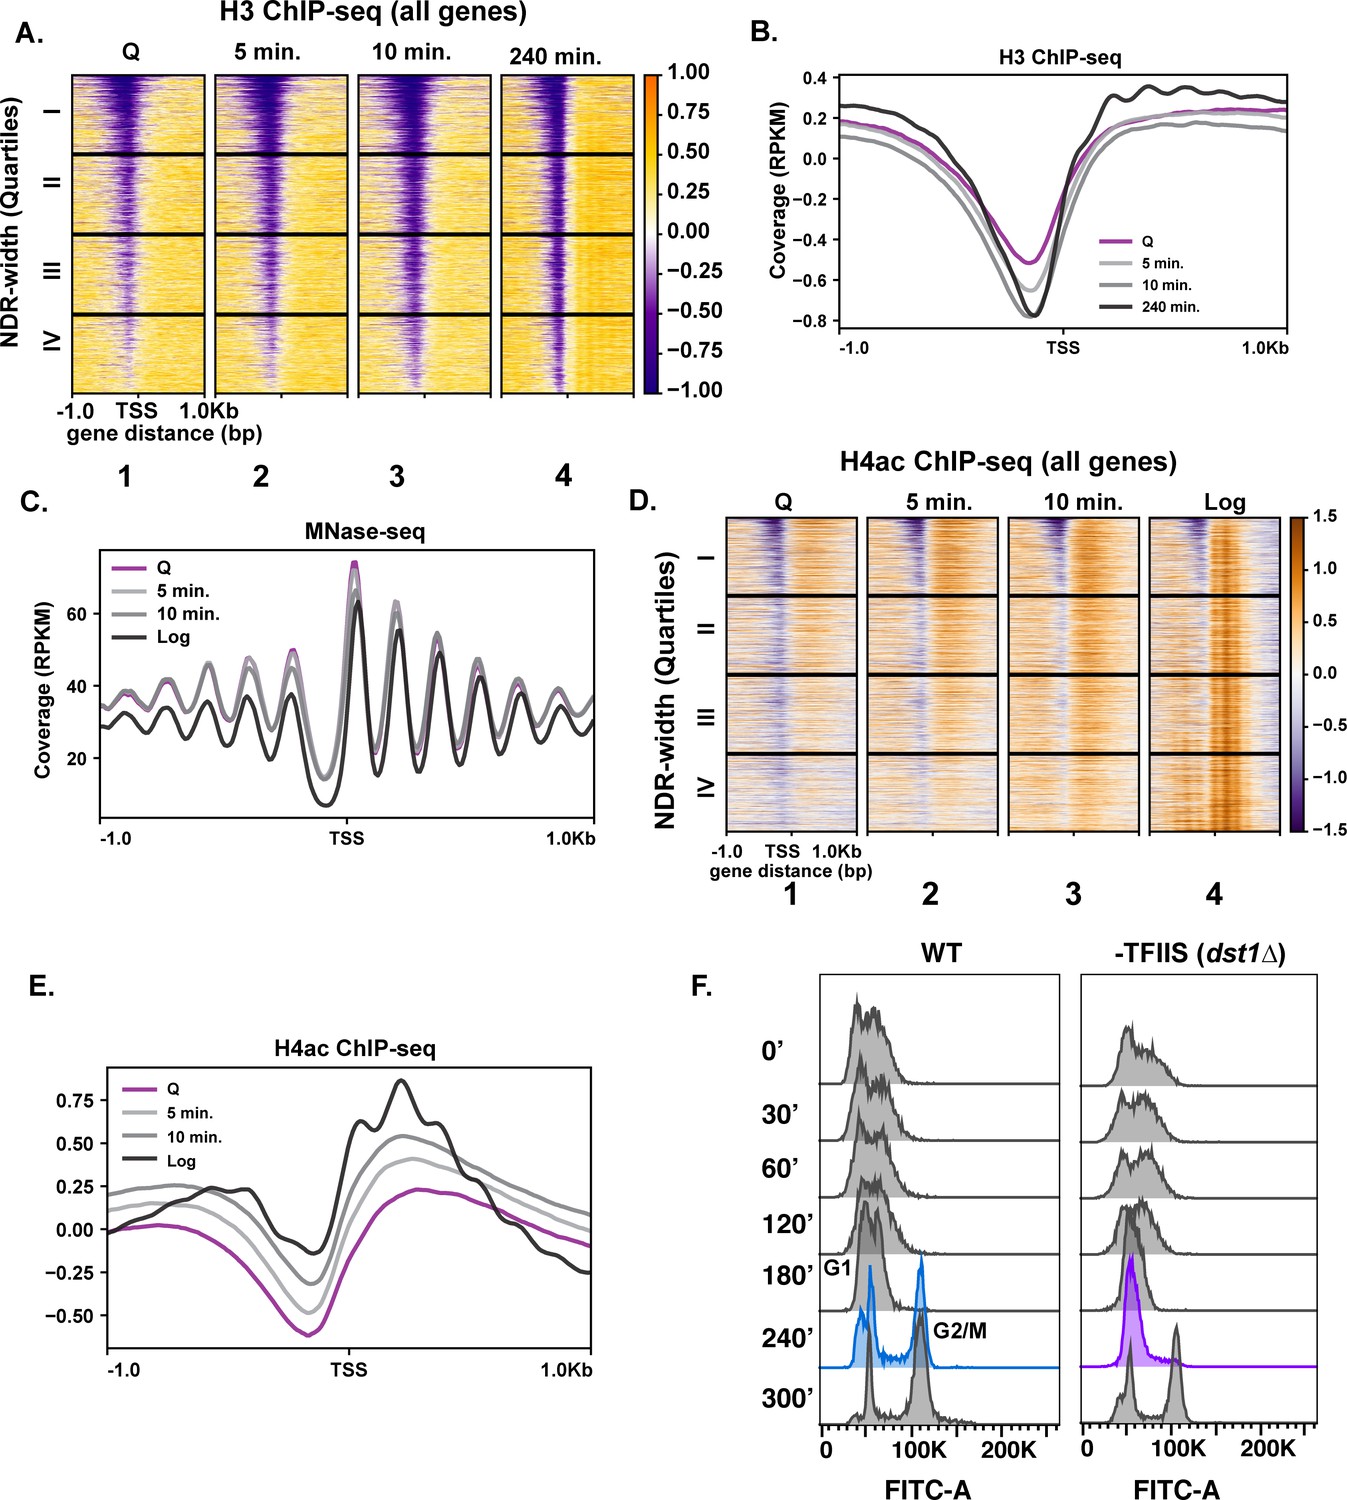
Repressive chromatin persists during early quiescence exit.
(A, B) ChIP-seq of total H3 in quiescent cells and exit time points sorted into quartiles based on NDR width. (C) MNase-seq analysis of 6030 genes in Q (pink line), log (black line), and Q-exit time points 5 min (light gray line) and 10 min (dark gray line). (D, E) ChIP-seq analysis of penta-acetylated H4 (H4ac) in Q and log cells and exit time points. Genes are separated as in (B). (F) DNA content FACS analysis following Q exit in WT and a TFIIS-absent strain (dst1∆).
Figure 3 with 3 supplements
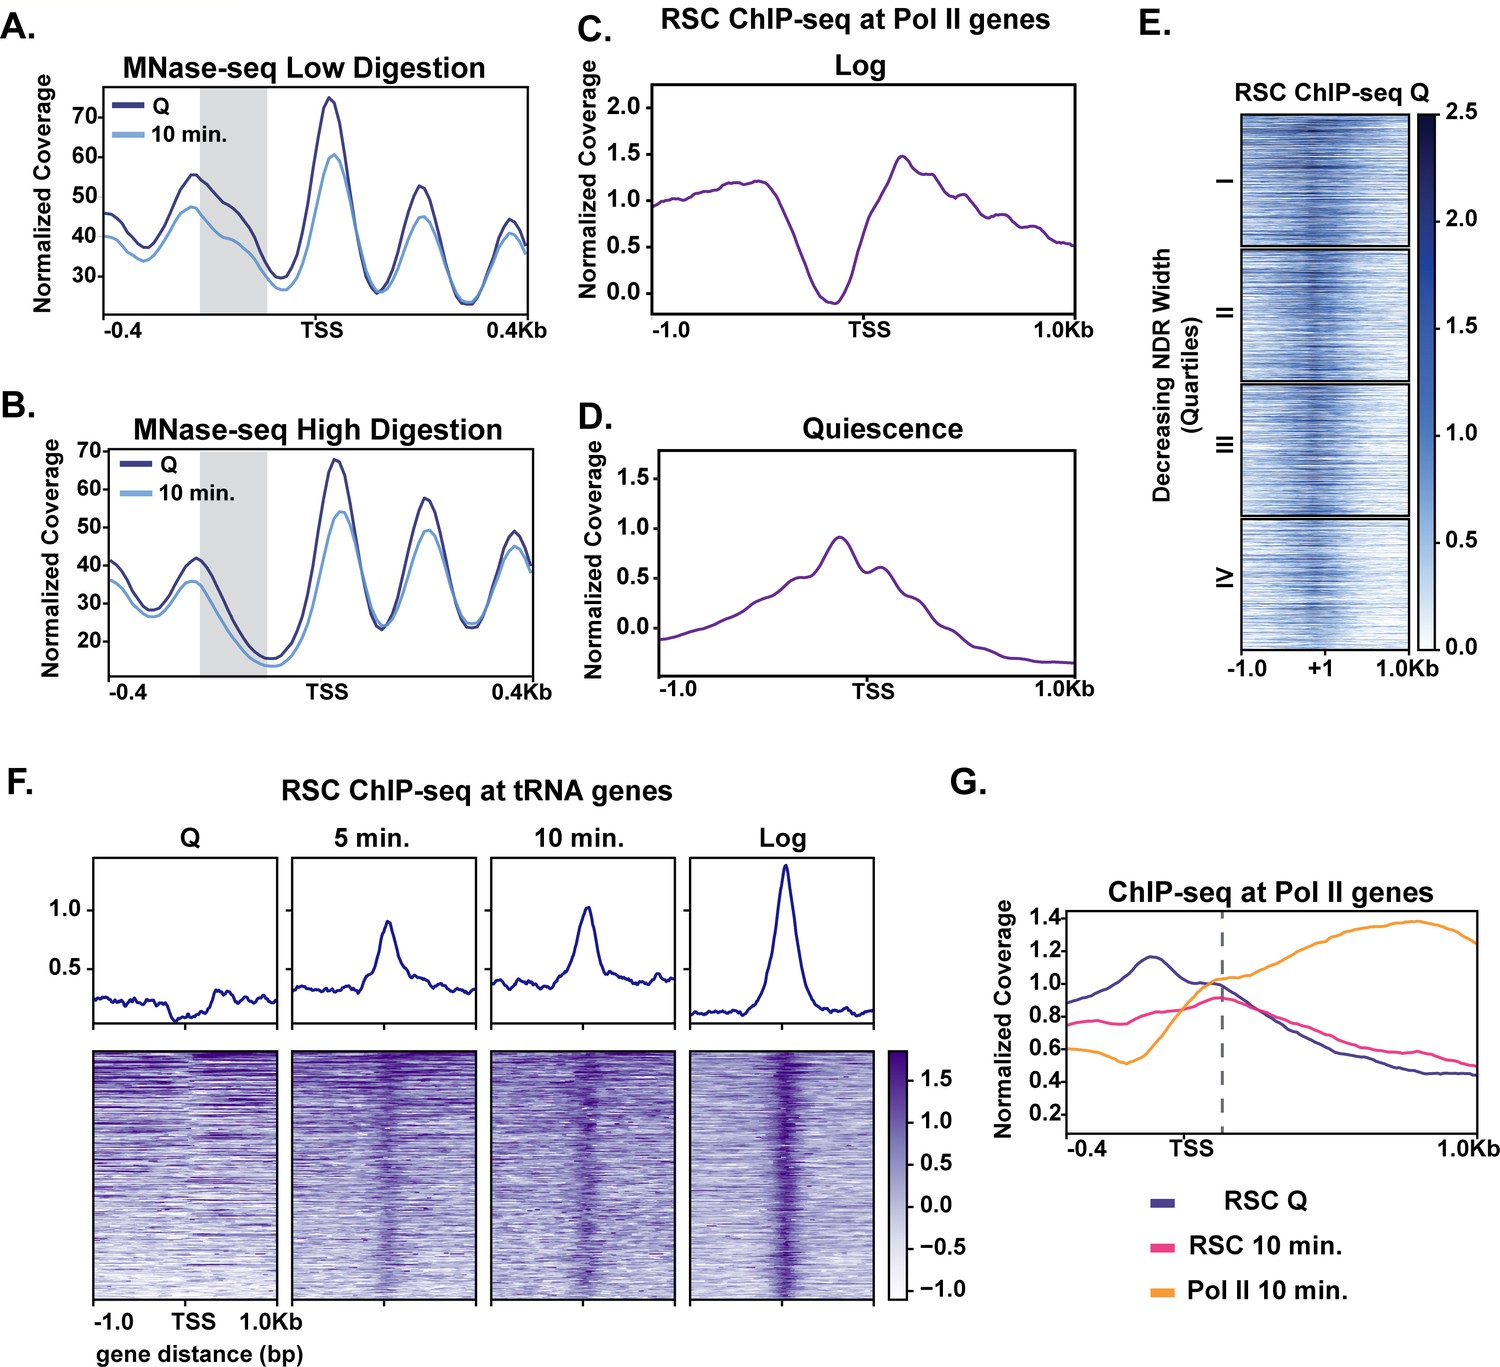
MNase sensitivity and quiescence-specific RSC re-localization indicate remodeling activity required for early exit.
(A) MNase-digested chromatin to 10% mononucleosomes (low digestion). (B) Metaplot of MNase-digested chromatin to 80% mononucleosomes (high digestion) in Q and 10 min time points. (C, D) ChIP-seq of the catalytic RSC subunit in quiescent and log cells at Pol II-transcribed genes. (E) ChIP-seq analysis of RSC shown across quartiles based on MNase-seq determined NDR width. (F) ChIP-seq of RSC at tRNA genes. (G) ChIP-seq of RSC and Pol II comparing RSC movement with Pol II into gene bodies.
Figure 3—figure supplement 1
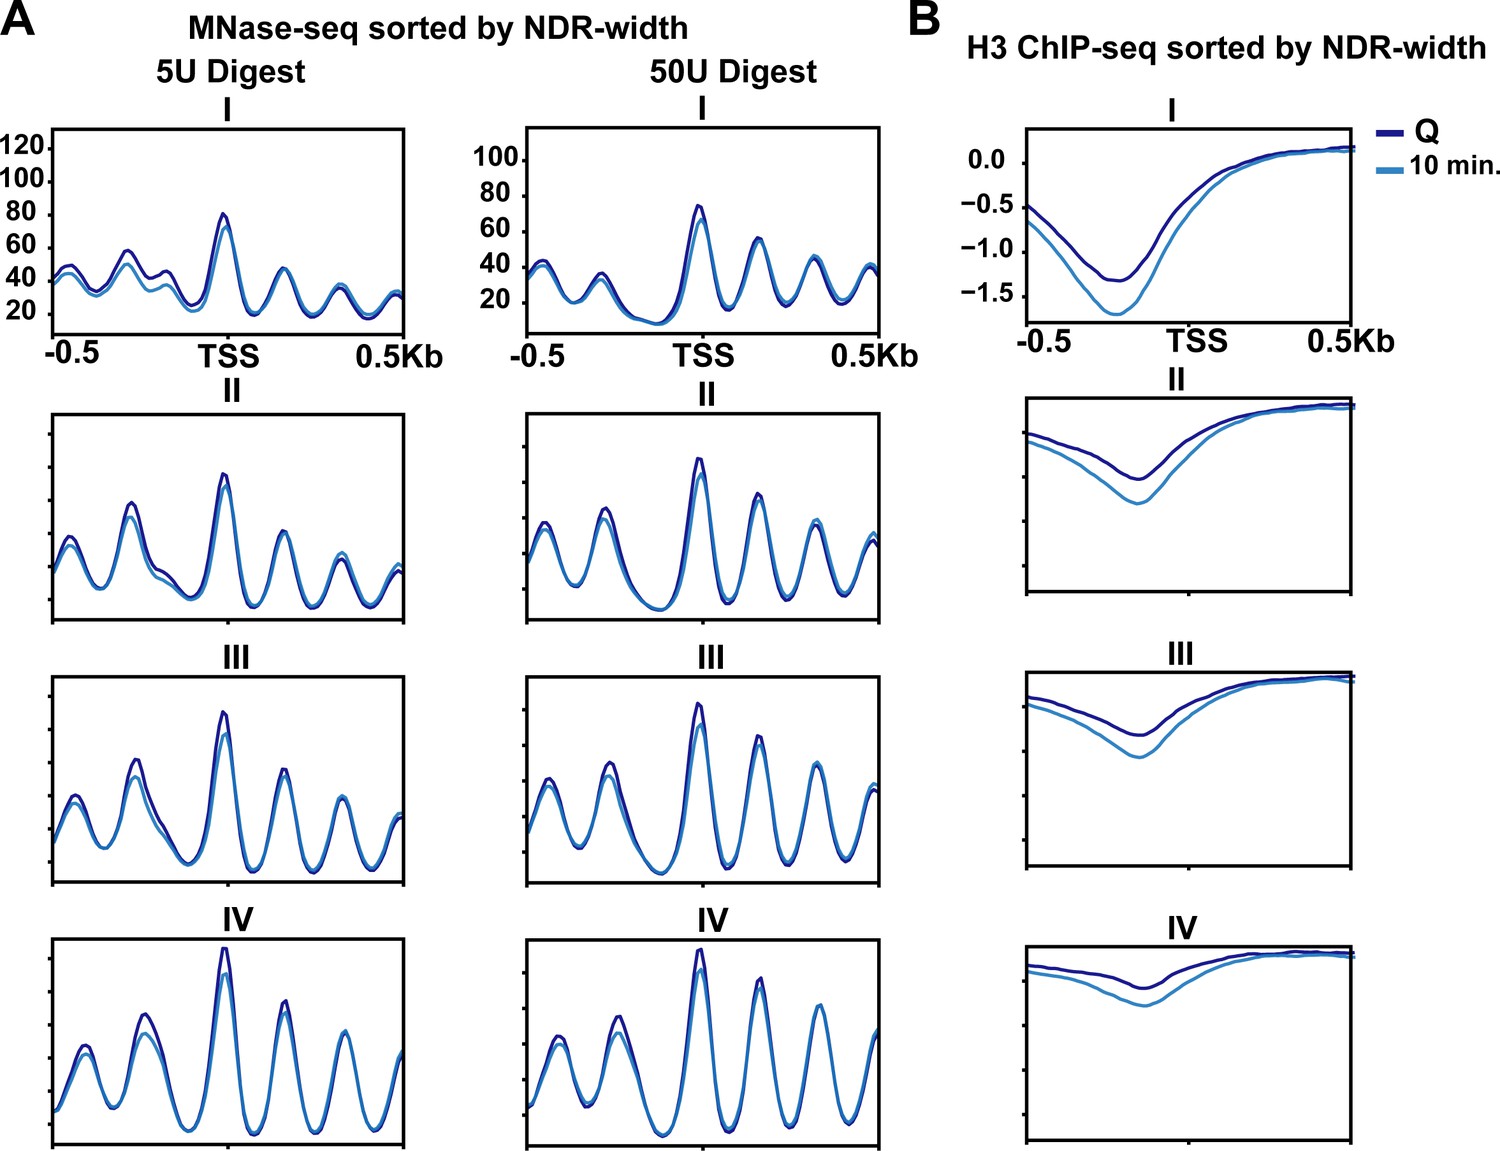
MNase-sensitive fragments and histone occupancy vary depending on genes transcribed in exit.
(A) MNase-digested chromatin to 10% mononucleosomes (5 U) or 80% mononucleosomes (50 U) in Q (dark blue line) and 10 min time points (light blue line). (B) ChIP-seq of H3 in quiescent cells (dark blue line) and 10 min of exit (light blue line). All panels show quartiles based on NDR width as described in the Materials and methods section.
Figure 3—figure supplement 2
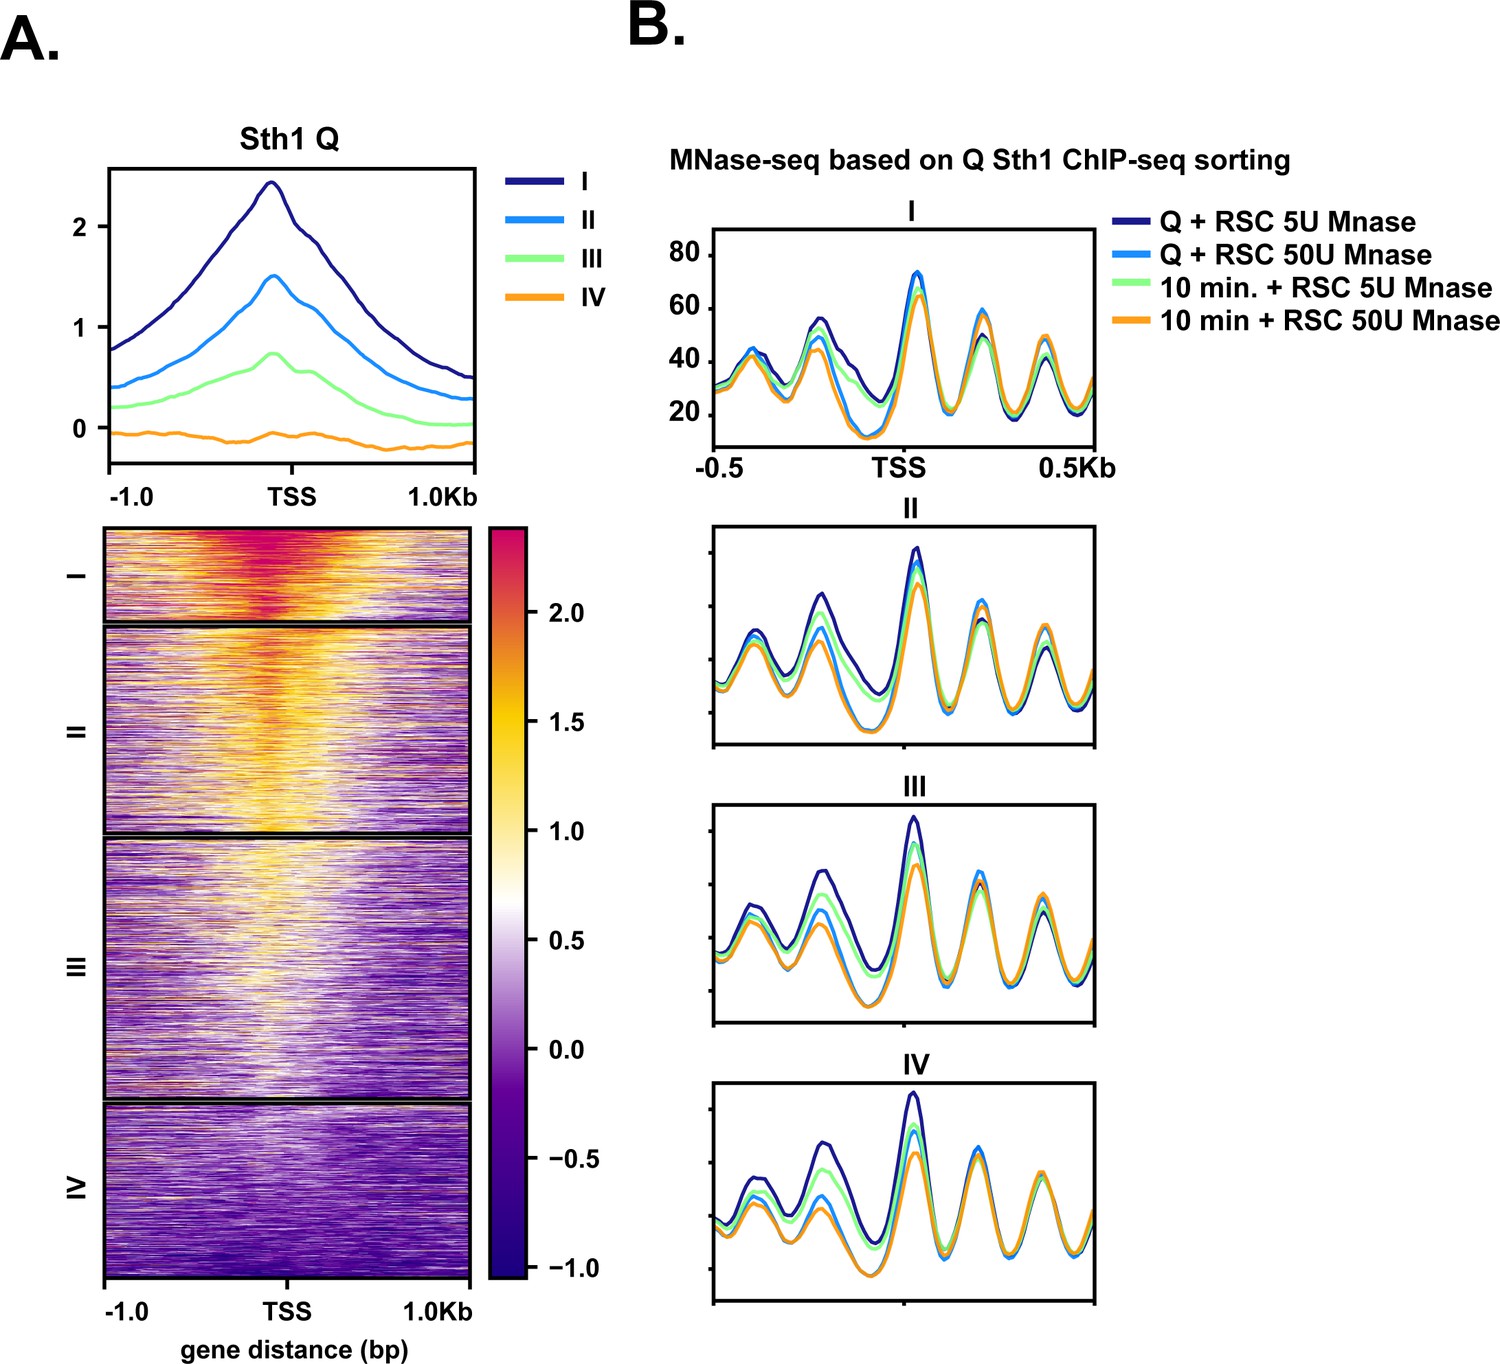
Sth1 occupancy mirrors MNase-sensitive fragments.
(A) Sth1 ChIP-seq from Q cells sorted into k-means clusters based on Sth1 occupancy. (B) MNase-seq data sorted into clusters shown in (A). Both low (5 U) and high (50 U) digests are shown on the graph for both Q and 10 min time points.
Figure 3—figure supplement 3
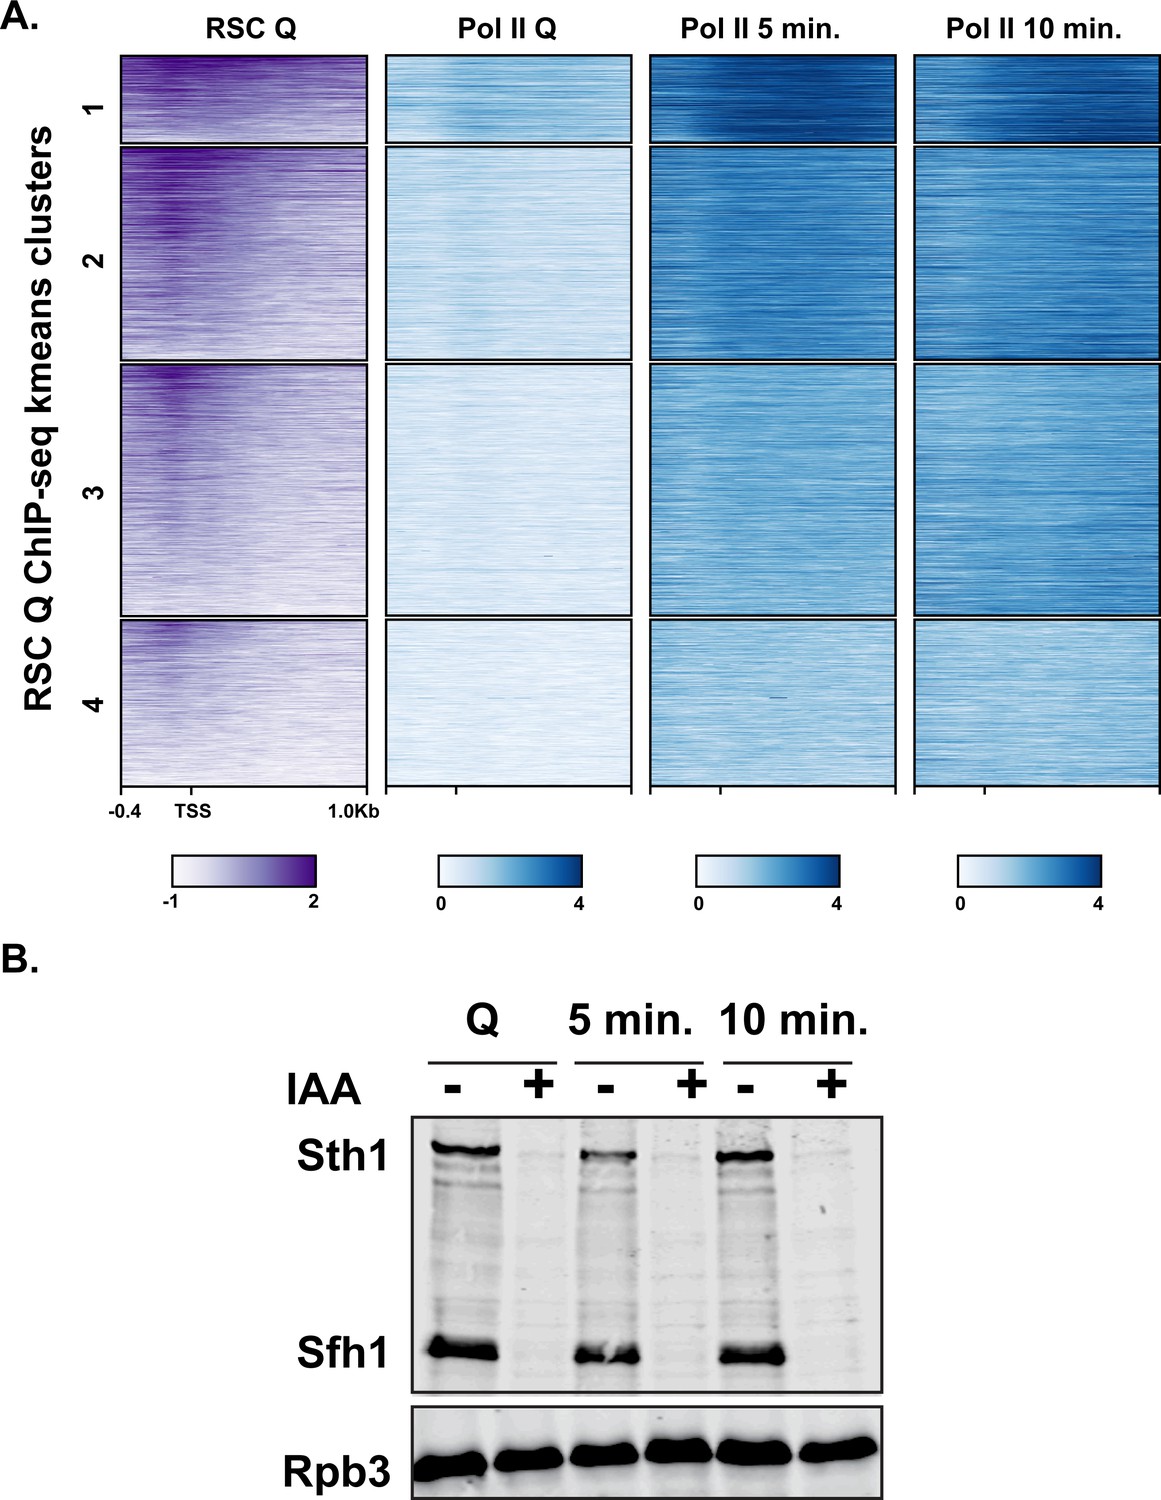
RSC binds NDRs upstream of genes turned on in exit.
(A) ChIP-seq analysis of RSC and Pol II using antibodies against Flag-tagged Sth1 and Rpb3, respectively. Genes are sorted into k-means clustered and are linked across the different ChIPs. (B) Western blot analysis of RSC depletion. Both Sth1 and Sfh1 contain C-terminal HSV and AID tags for detection and depletion using IAA. Western blot was probed with an antibody recognizing the HSV epitope tag and Rpb3 (Pol II subunit) as a loading control. The addition of IAA is indicated by − or +.
Figure 4 with 1 supplement
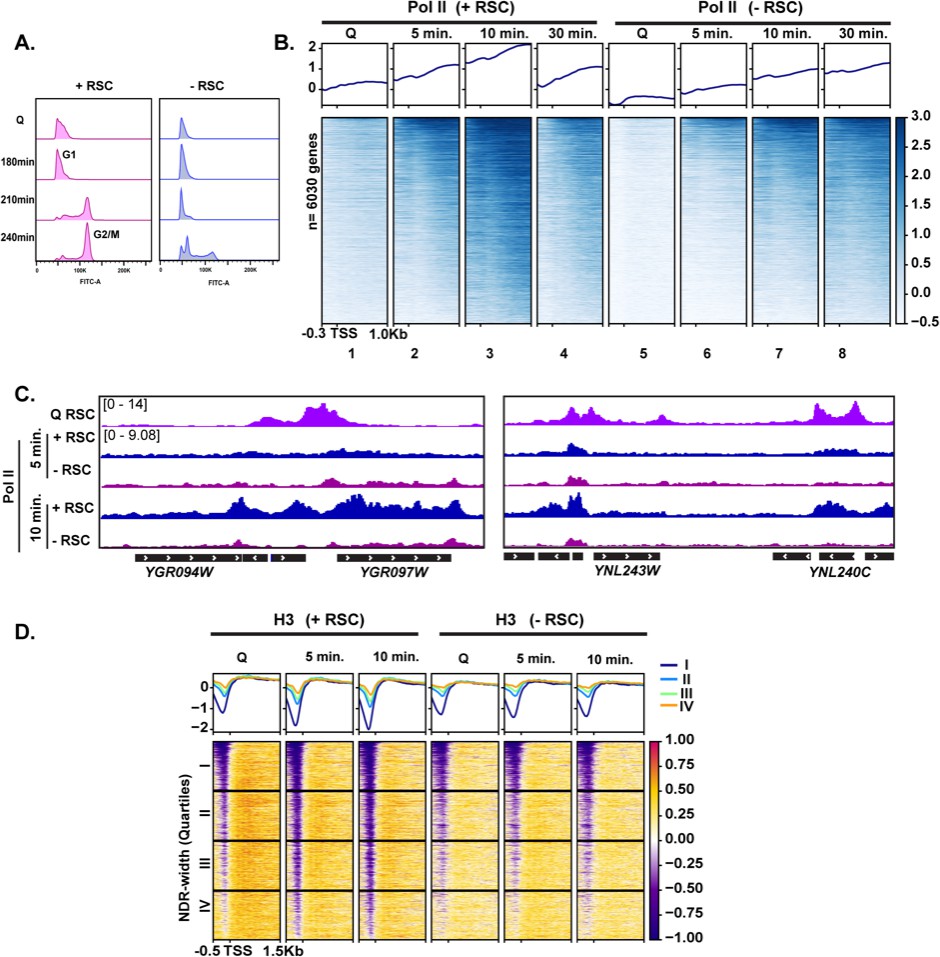
RSC is required for normal quiescence exit and hypertranscription upon nutrient repletion.
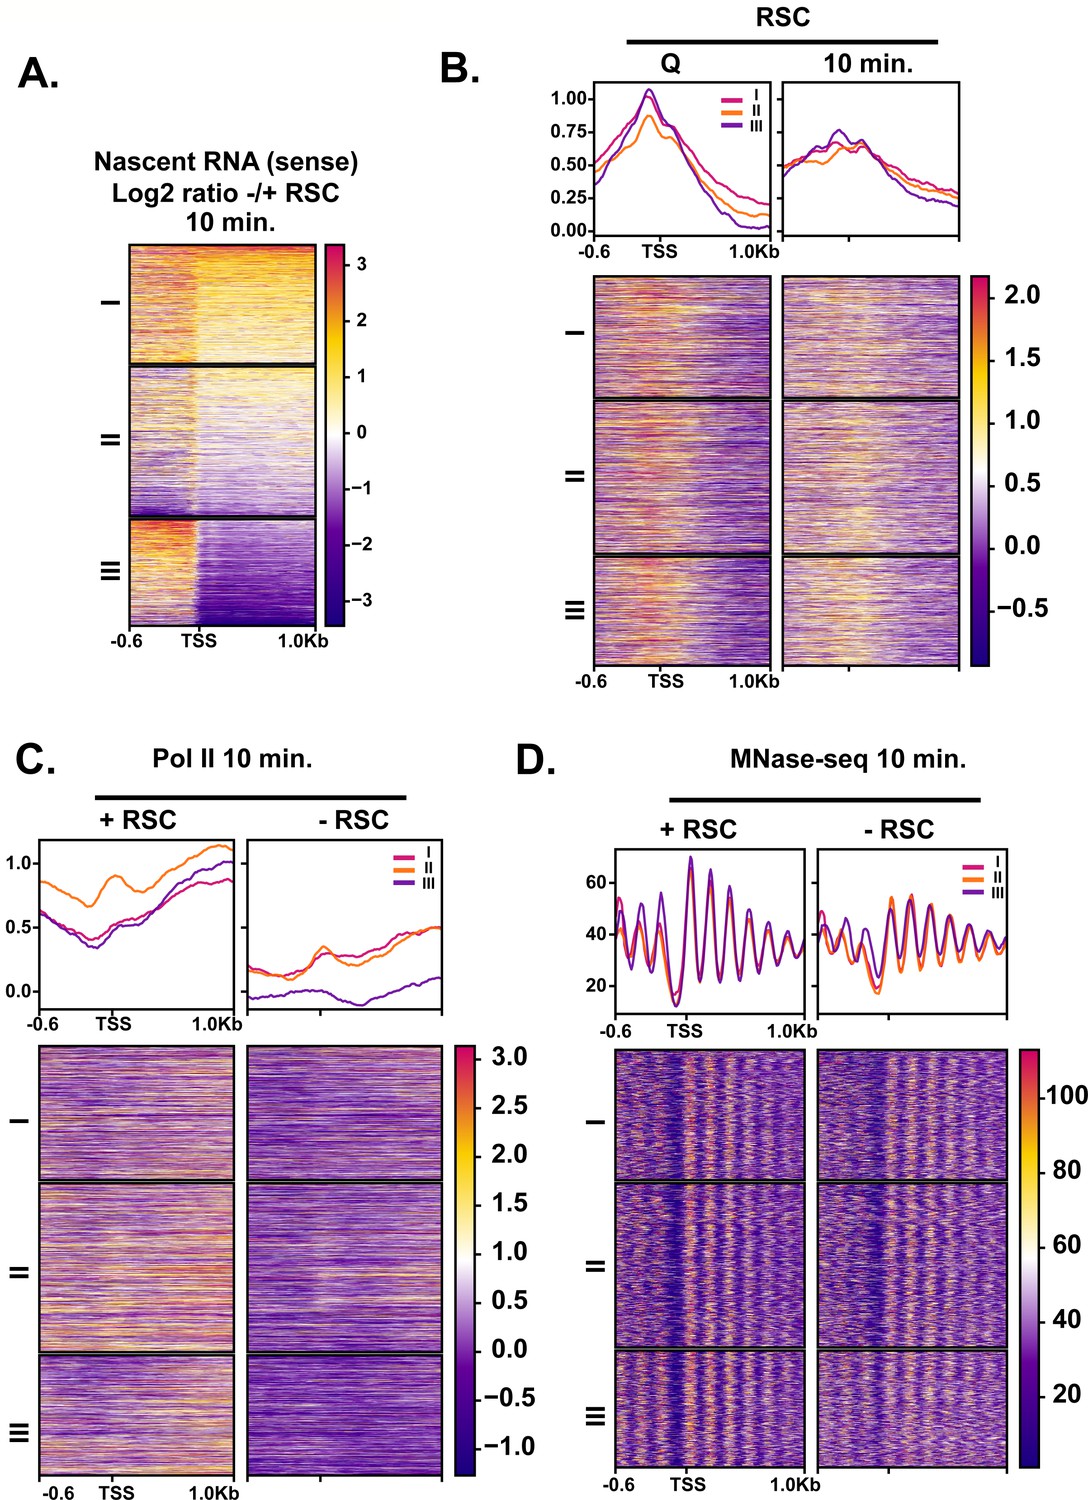
(A) DNA content FACS analysis indicating cell-cycle progression during Q exit in the presence (+) or absence (−) of RSC. (B) ChIP-seq analysis of Pol II across time in the presence or absence of RSC. Genes are sorted in the same fashion for all heatmaps. (C) Example tracks of data shown in (B) with RSC ChIP-seq in Q cells added. (D) H3 ChIP-seq sorted by NDR width (as determined by MNase-seq experiments).
Figure 4—figure supplement 1
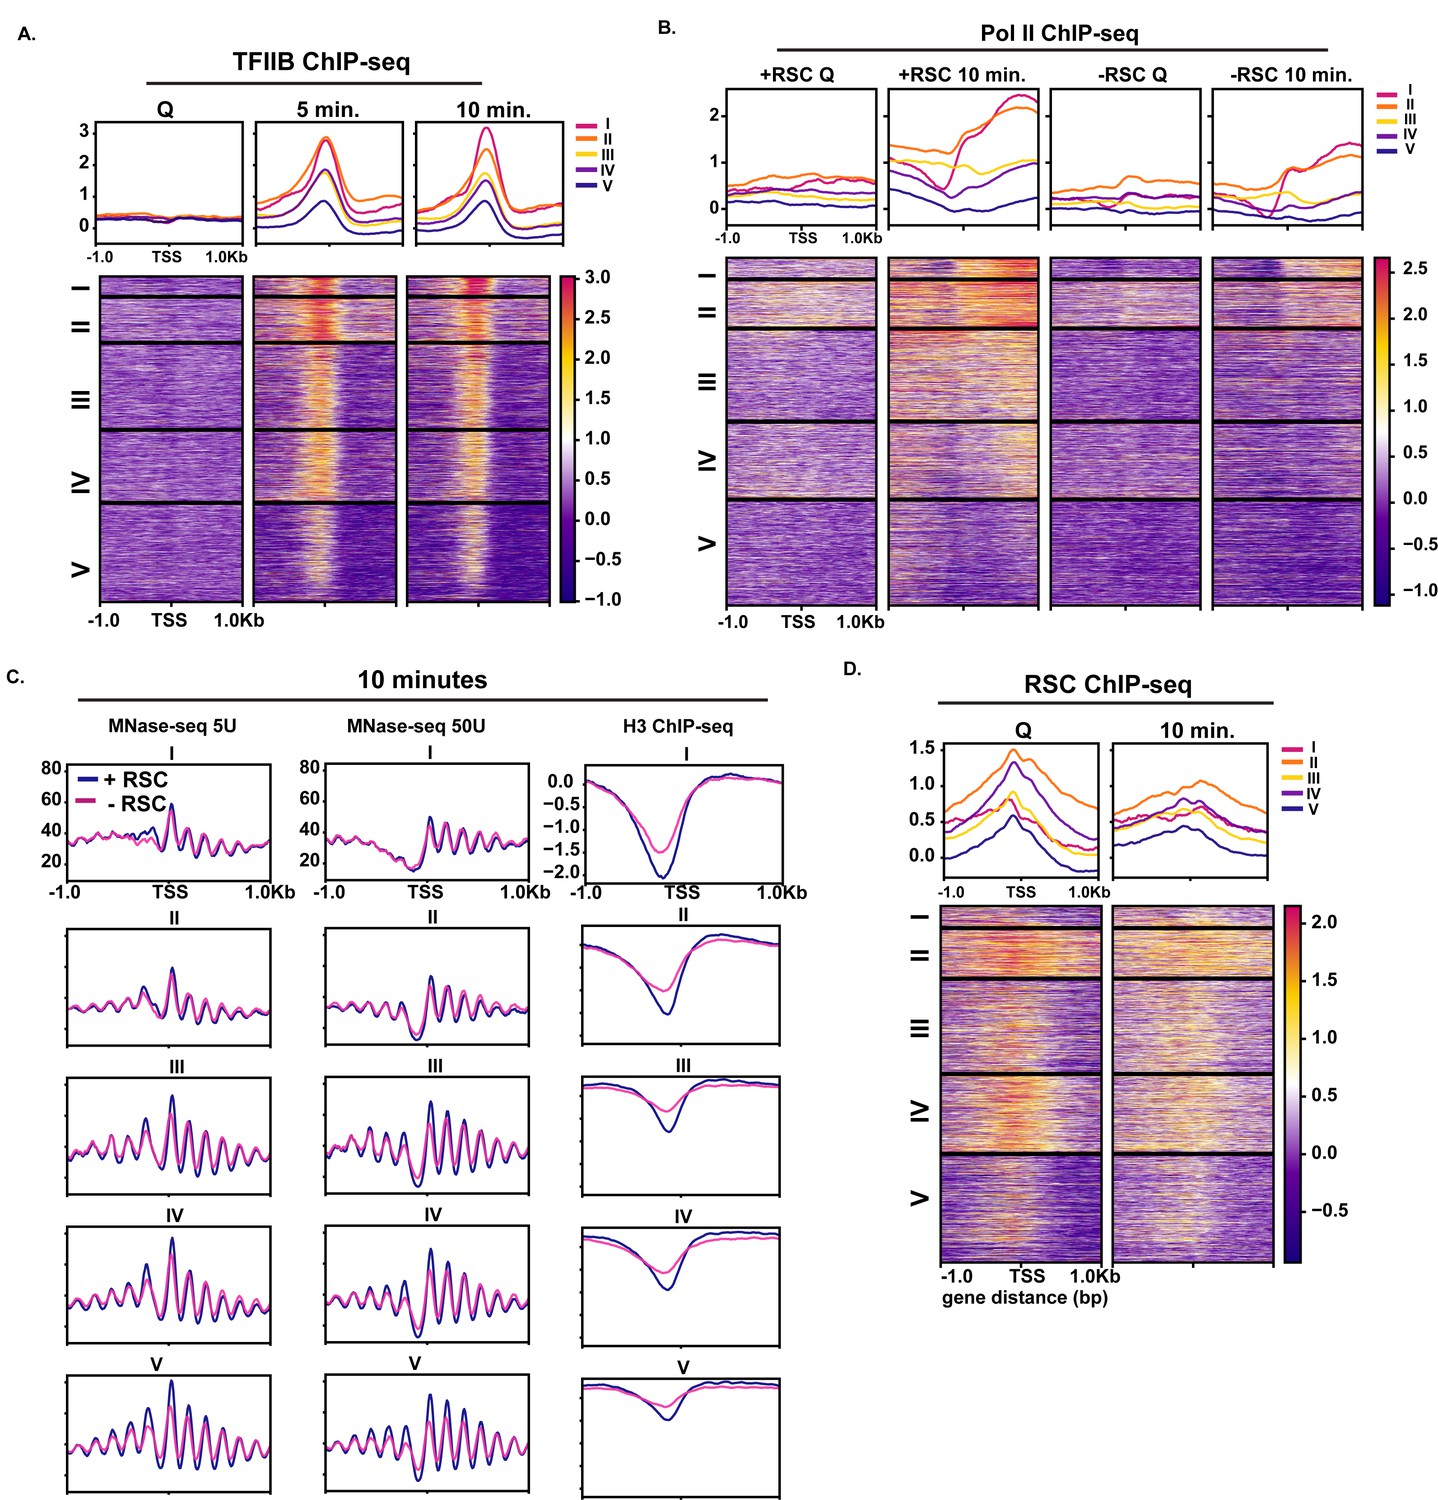
Comparison of different classes of genes transcribed in exit.
(A) TFIIB ChIP-seq sorted into k-means clusters as in Figure 1C. (B) Pol II ChIP-seq sorted into k-means clusters as in Figure 1C. (C) MNase-seq of lowly digest (5 U) and highly (50 U) digested chromatin and H3 ChIP-seq at the 10 min time point with (blue line) and without (magenta line) RSC sorted into k-means clusters as in Figure 1C. (D) RSC (Sth1) ChIP-seq sorted into k-means clusters as in Figure 1C.
Figure 5 with 1 supplement

RSC depletion causes severe Pol II mislocalization defects during quiescence exit.
(A) ChIP-seq of RSC in Q and 10 min time points. Genes are linked. (B) ChIP-seq of RSC at 10 min of exit in the presence and absence of the transcription inhibitor 1,10-phenanthroline. (C, D) ChIP-seq of RSC and Pol II during exit. (E, F) H3 ChIP-seq in quiescence and during exit in the presence and absence of RSC.
Figure 5—figure supplement 1
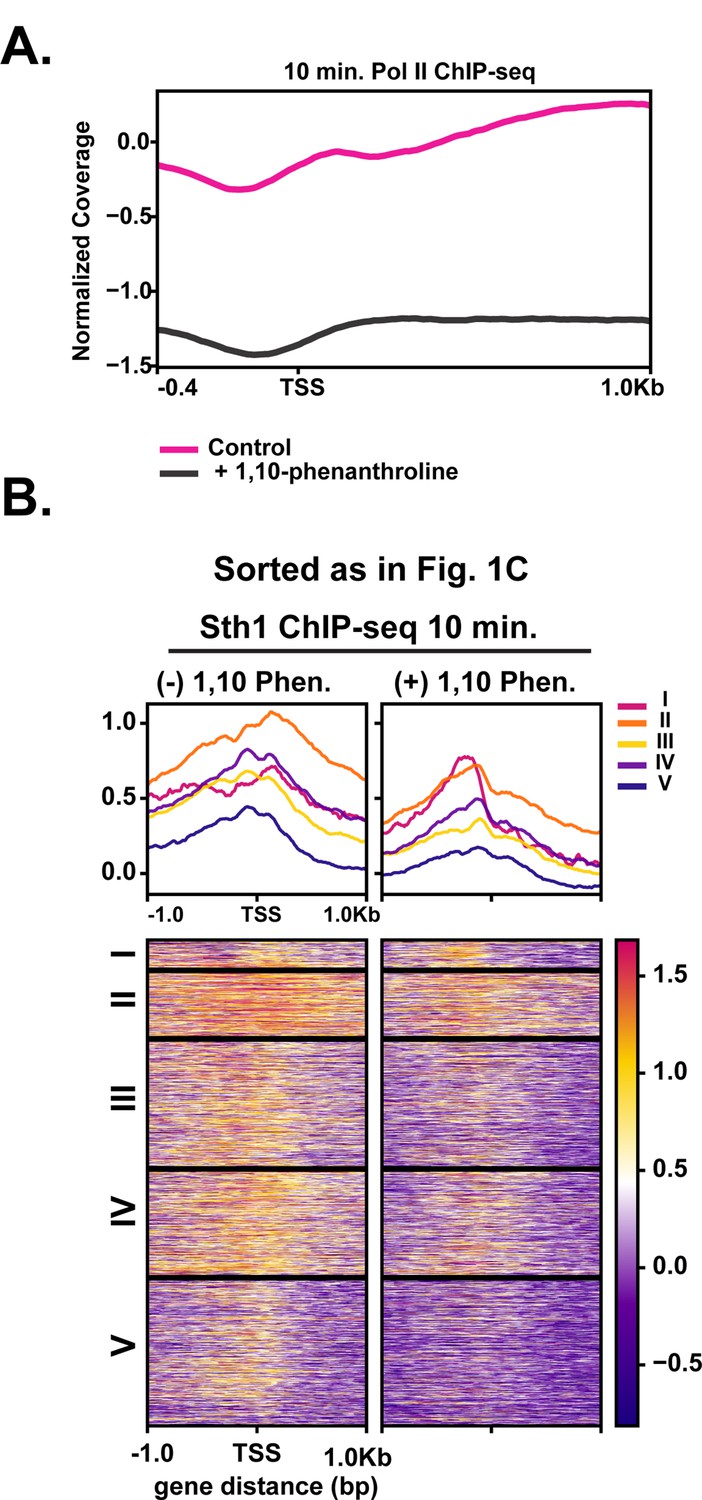
Inhibition of Pol II reduces Pol II occupancy and Sth1 movement into gene bodies.
(A) ChIP-seq analysis of Pol II in the absence and presence of the transcription inhibitor 1,10-phenanthroline. (B) MNase-seq analysis assessing differences in MNase sensitivity in Q and 10 min for cells with and without RSC. The +2 nucleosome MNase-digestion differences are highlighted by the pink arrows.
Figure 6 with 1 supplement
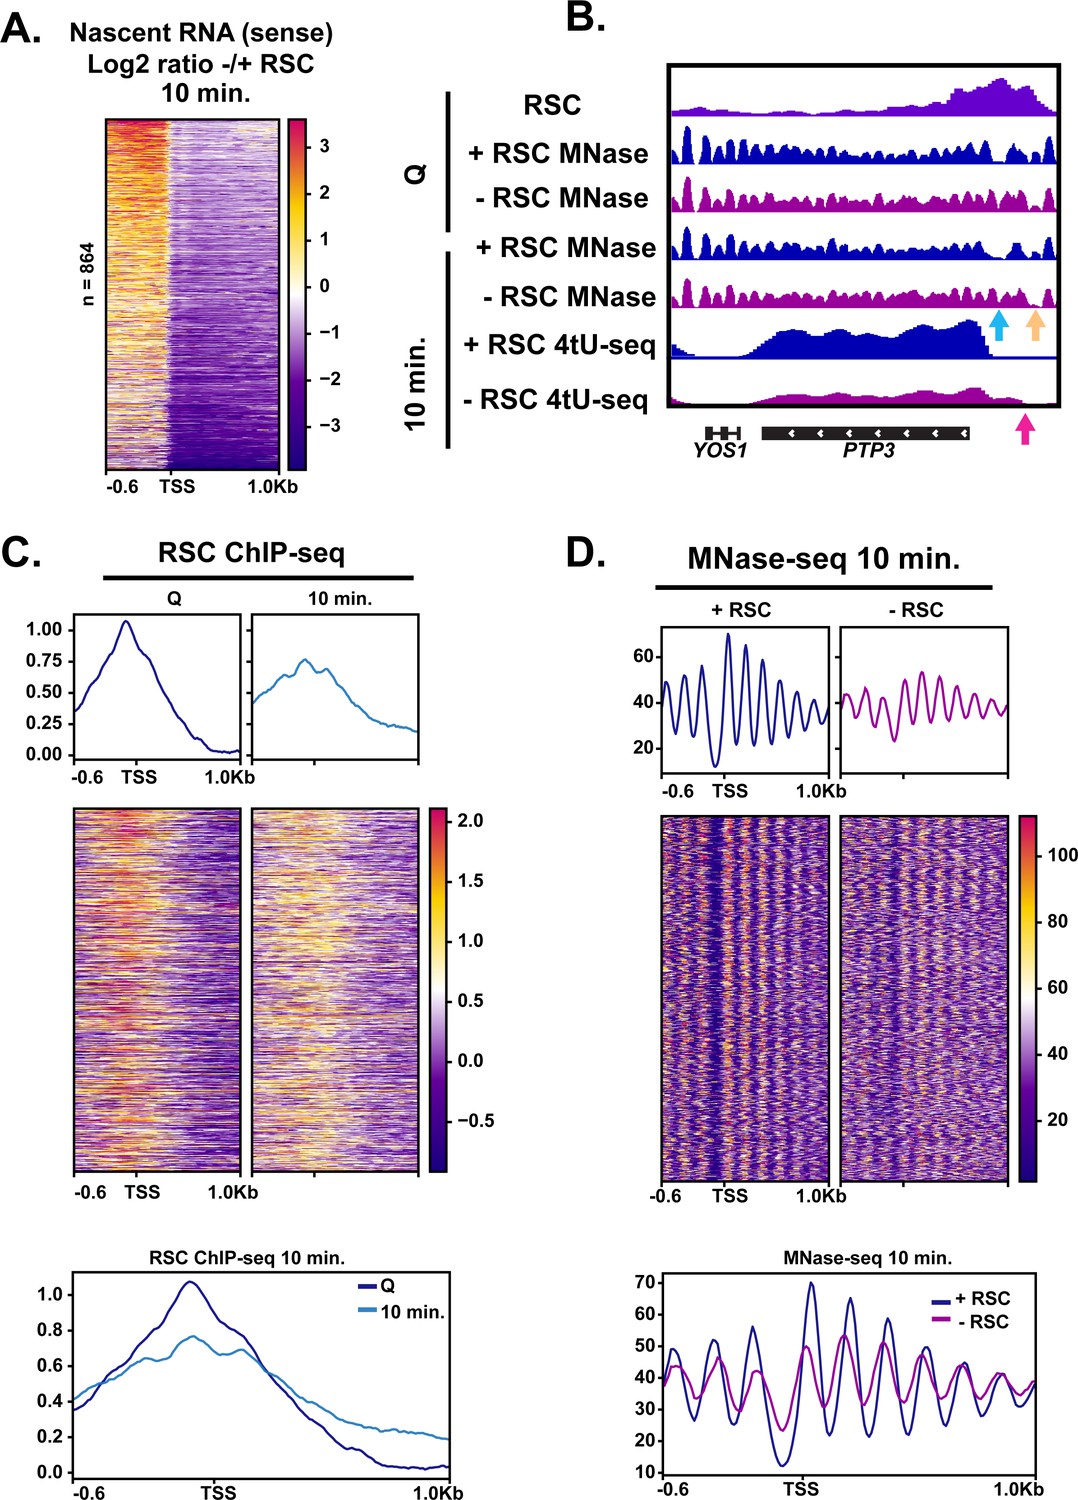
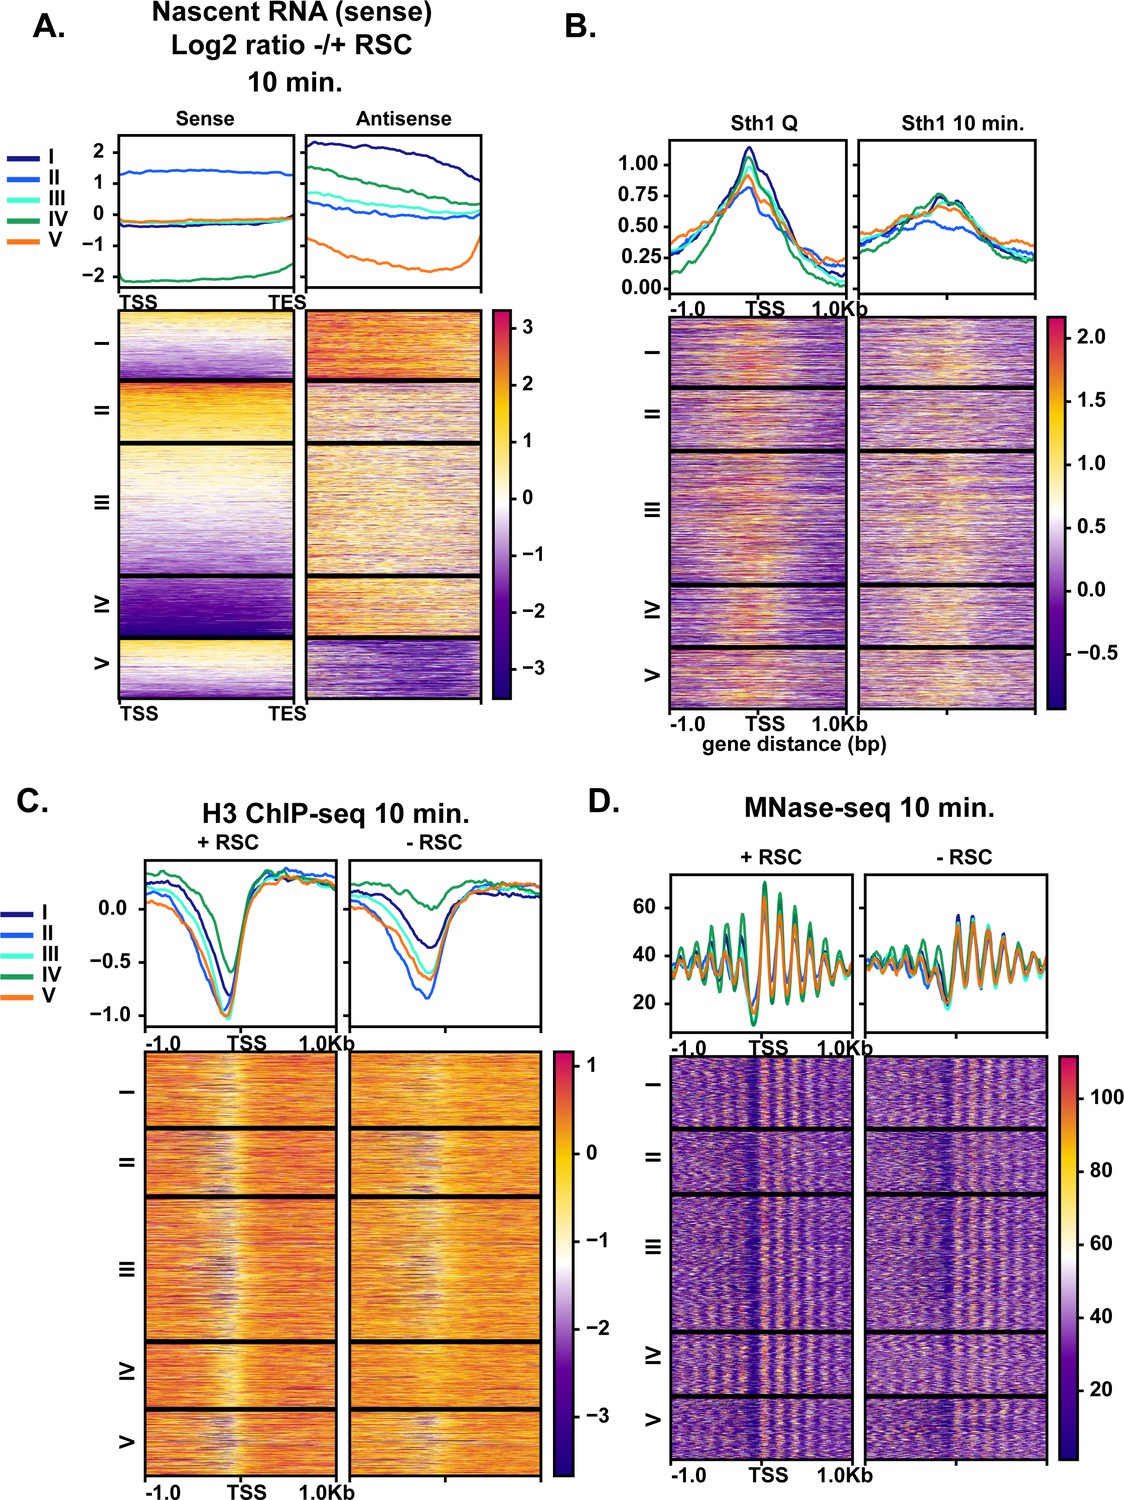
RSC depletion causes upstream transcription relative to canonical TSS.
(A) Heatmap showing the log2 ratio of nascent sense transcripts in RSC-depleted versus non-depleted cells. Shown are 864 genes that have upregulated transcripts upstream of genes in the sense direction and have RSC ChIP signals. (B) Example gene of aberrant upstream transcript. Arrows direct to defects: blue arrow points to loss of NDR, yellow arrow points to gain of NDR, and pink arrow points to upstream RNA signal. (C) Heatmaps and metaplots of RSC ChIP-seq during Q and exit at genes shown in (A). (D) Heatmaps and metaplots of MNase-seq in exit at the genes shown in (A).
-
Figure 6—source data 1
List of genes with aberrant upstream start sites.
- https://cdn.elifesciences.org/articles/67033/elife-67033-fig6-data1-v2.txt
Figure 6—figure supplement 1
Genes with cryptic upstream start sites when RSC is depleted have the most narrow NDRs in the absence of RSC.
(A) Heatmap showing the log2 ratio of nascent sense transcripts in RSC-depleted versus non-depleted cells. Genes were clustered using k-means clustering based on nascent RNA signal. (B) ChIP-seq of RSC sorted in the same order as (A). (C) ChIP-seq of Pol II sorted in the same order as in (A). (D) MNase-seq of chromatin digested to 80% mononucleosomes (50 U) sorted into the same order as in (A). Note cluster III is the cluster chosen for the main Figure 6.
-
Figure 6—figure supplement 1—source data 1
List of genes in each cluster.
- https://cdn.elifesciences.org/articles/67033/elife-67033-fig6-figsupp1-data1-v2.txt
Figure 7
Aberrant antisense transcription arises when chromatin around sense transcripts is abrogated in the absence of RSC.
(A) Heatmaps of the log2 ratio of nascent RNAs that are RSC targets and give rise to antisense transcripts. Data are sorted into 5 k-means clusters based on the antisense transcripts. All data in this figure are sorted in the same fashion. (B) ChIP-seq of RSC in quiescent cells and during exit. (C) H3 ChIP-seq at the 10 min time point with and without RSC. (D) MNase-seq at the 10 min time point with and without RSC.
-
Figure 7—source data 1
List of genes in each cluster.
- https://cdn.elifesciences.org/articles/67033/elife-67033-fig7-data1-v2.txt
Figure 8
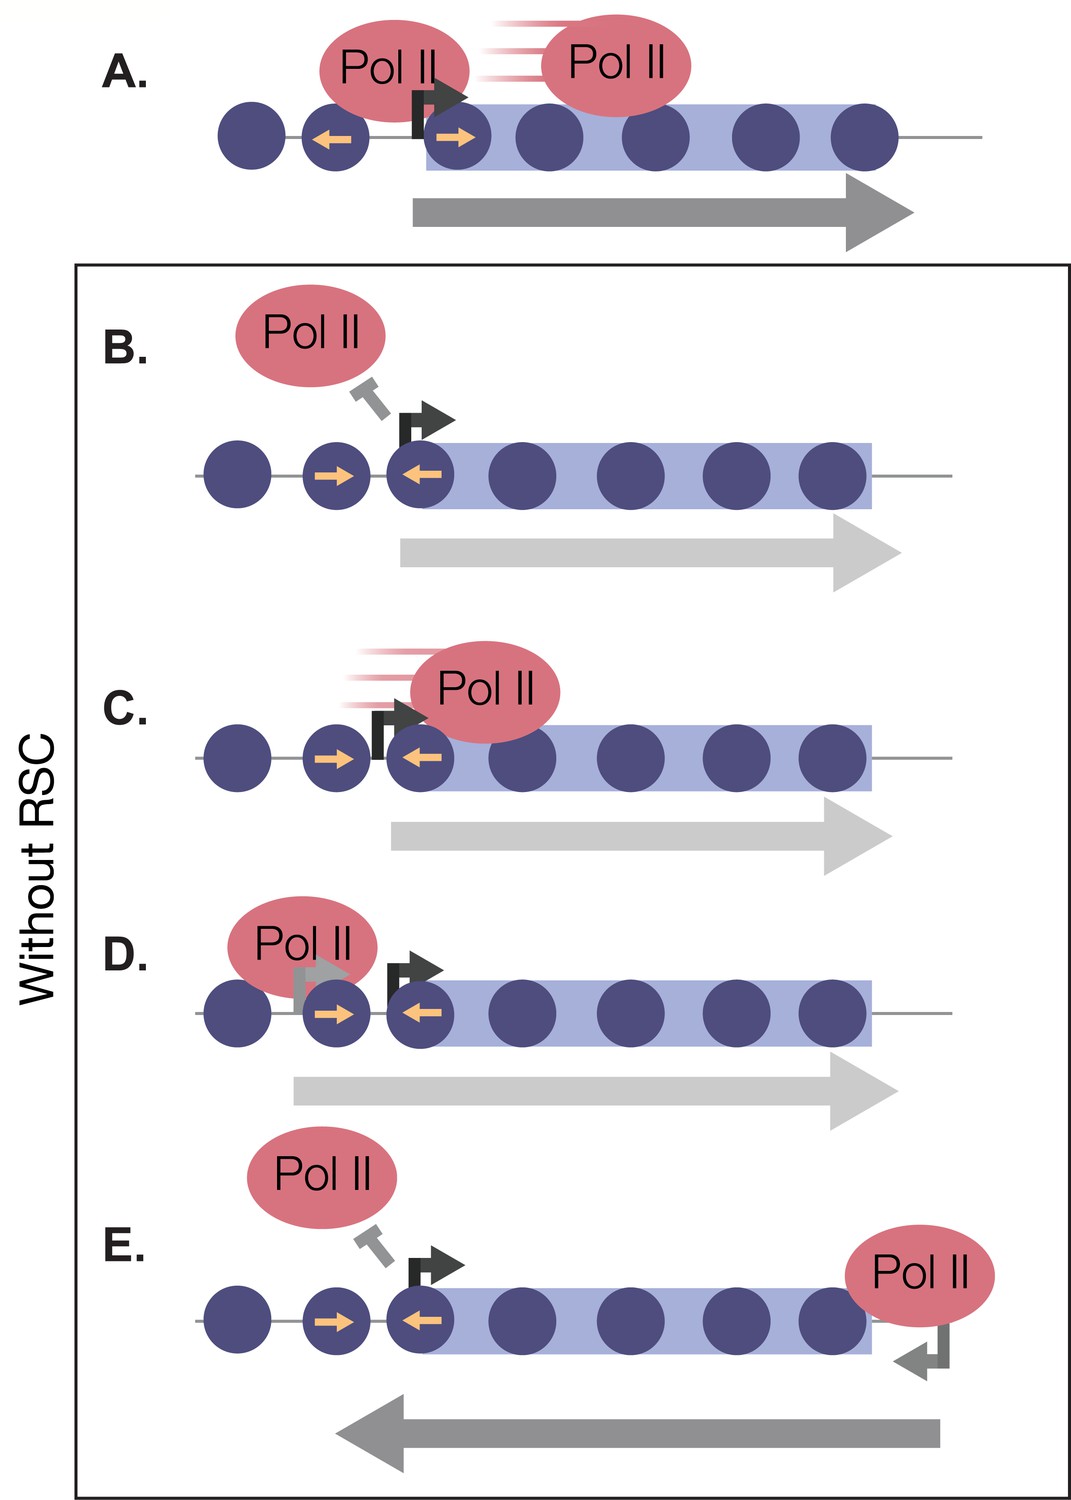
RSC bound to NDRs is poised in quiescence to safeguard the genome from aberrant transcription during quiescence exit.
Upon quiescence exit, RSC shifts the +1 nucleosome to allow for Pol II occupancy and traverses into gene bodies (A). In the absence of RSC, NDRs are globally narrower and transcription initiation is blocked (B). At a subset of genes, RSC is required for efficient Pol II passage past the +1 nucleosome (C) and prevents upstream TSS selection (D). NDRs that are open despite RSC depletion become cryptic promoters and are utilized by transcription machinery to generate aberrant lncRNAs and antisense transcripts (E).
Tables
Key resources table
| Reagent type (species) or resource | Designation | Source or reference | Identifiers | Additional information |
|---|---|---|---|---|
| Strain, strain background (S. cerevisiae) | WT; prototroph | Tsukiyama Lab | YTT5781 | MATa RAD5+ |
| Strain, strain background (S. cerevisiae) | WT; prototroph | Tsukiyama Lab | YTT5782 | MATa RAD5+ |
| Strain, strain background (S. cerevisiae) | Sth1 and Sfh1 degrons | Tsukiyama Lab | YTT7222 | MATa can1-100 RAD5 + Sth1-3HSV-IAA1-T10-KanMX Sfh1-3HSV-IAA1-T10-Hyg |
| Strain, strain background (S. cerevisiae) | Sth1 and Sfh1 degrons | Tsukiyama Lab | YTT7224 | MATa can1-100 RAD5 + Sth1-3HSV-IAA1-T10-KanMX Sfh1-3HSV-IAA1-T10-Hyg |
| Strain, strain background (S. cerevisiae) | dst1∆ | Tsukiyama Lab | YTT7308 | MATa RAD5 + dst1∆::KanMX |
| Strain, strain background (S. cerevisiae) | dst1∆ | Tsukiyama Lab | YTT7309 | MATa RAD5 + dst1∆::KanMX |
| Chemical compound, drug | Indole-3-acetic acid (IAA) | Sigma | I3750-5G-A | 1 mg/mL powder added to culture |
| Antibody | Rpb3 (mouse monoclonal) | Biolegend | 665003 | WB: (1:1000) dilution ChIP: (2 μL) |
| Antibody | Ser5p (rat monoclonal) | Active Motif | 61085 | WB: (1:1000) |
| Antibody | Ser2p (rat monoclonal) | Active Motif | 61083 | WB: (1:1000) |
| Antibody | HSV (rabbit polyclonal) | Sigma | H6030-200UG | WB: (1:5000) |
| Antibody | H3 (rabbit polyclonal) | Abcam | 1791 | WB: (1:1000) ChIP: (1 μL) |
| Antibody | Flag (mouse monoclonal) | Sigma | F1804 | ChIP: (2 μL) |
| Other | Protein G magnetic | Invitrogen | 10004D | ChIP: (20 μL) |
| Peptide, recombinant protein | Zymolyase 100T | AMSBIO | 120493–1 | MNase-seq; 10 mg per 100 units OD660 cells |
| Peptide, recombinant protein | Micrococcal nuclease | Worthington | LS004798 | MNase-seq 50U (high digests) 5U (low digests) |
| Other | AMPure XP | Beckman | A63880 | - |
| Strain, strain background (K. lactis) | Spike-in control strain | Nathan Clark Lab | NRRL Y-1140 | 100:1 cell mixture (S. cerevisiae: K. lactis) |
| Chemical compound, drug | 4-Thiouracil | Sigma | 440736–1G | 5 mM |
| Commercial assay or kit | RiboPure Yeast Kit | Thermo Fisher | AM1926 | |
| Chemical compound, drug | MTSEA biotin-XX | Biotium | 90066 | 16.4 μM in 20 mM HEPES pH 7.4 1 mM EDTA |
| Other | Streptavidin beads | Invitrogen | 65001 | (40 μL) |
| Commercial assay or kit | miRNeasy kit | Qiagen | 217084 | - |
| Commercial assay or kit | Ovation SoLo kit; custom AnyDeplete | NuGEN/Tecan | Contact rep for custom reagent (yeast rRNA depletion) | - |
Additional files
Download links
A two-part list of links to download the article, or parts of the article, in various formats.
Downloads (link to download the article as PDF)
Open citations (links to open the citations from this article in various online reference manager services)
Cite this article (links to download the citations from this article in formats compatible with various reference manager tools)
RSC primes the quiescent genome for hypertranscription upon cell-cycle re-entry
eLife 10:e67033.
https://doi.org/10.7554/eLife.67033


