Signaling levels mold the RAS mutation tropism of urethane
- Pharmacology and Cancer Biology, Duke University, United States
Figures
Figure 1 with 1 supplement
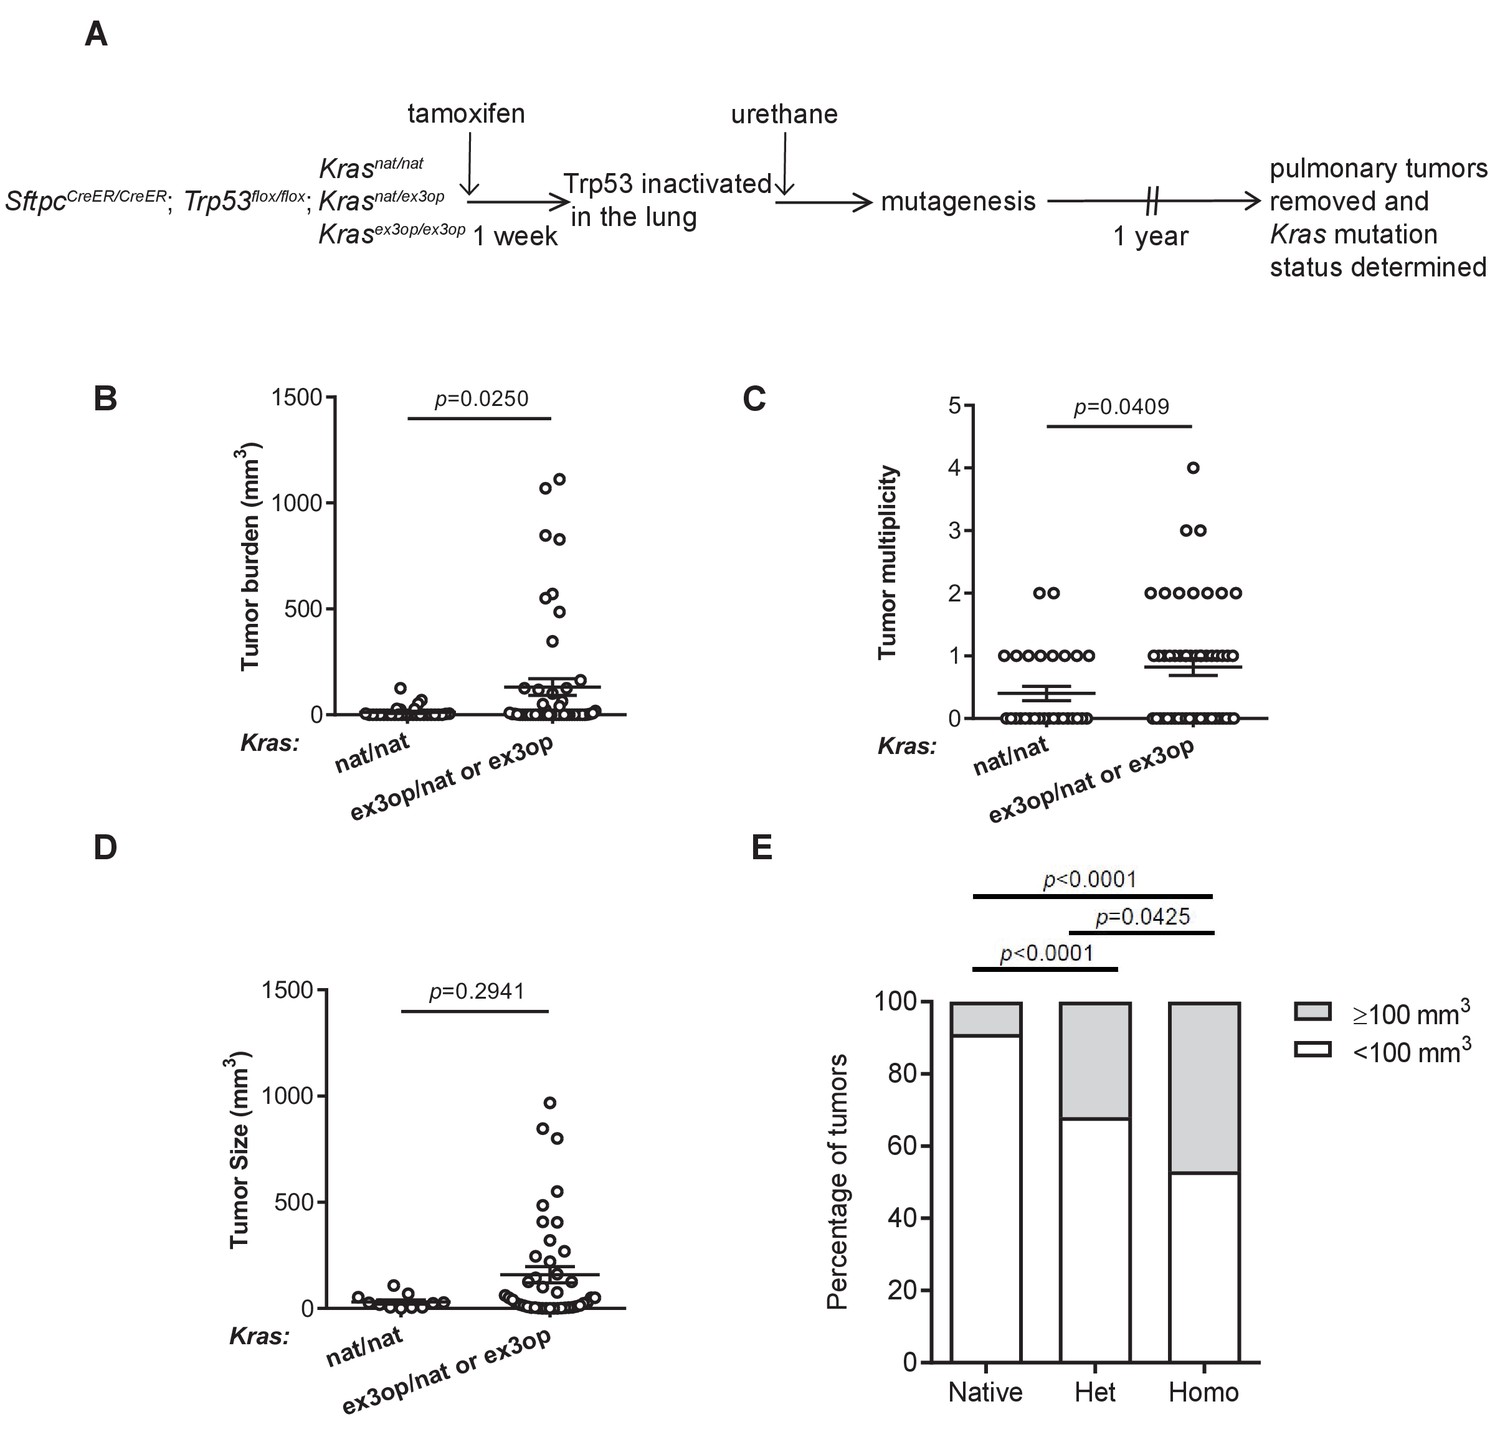
Loss of p53 converts the Krasex3op allele from suppressing to enhancing urethane carcinogenesis.
(A) Experimental design to evaluate the effect of inactivating p53 specifically in the lung on urethane carcinogenesis upon increase in Kras expression. (B–D) Mean ± SEM of urethane-induced tumor (B) burden, (C) multiplicity, and (D) size in tamoxifen-treated SftpcCreER/CreER;Trp53fl/fl mice in a homozygous native (B, C: n = 30 mice; D: n = 11 tumors) and heterozygous or homozygous (B, C: n = 51 mice; D: n = 42 tumors) ex3op Kras background. Mann–Whitney test. (E) % of tumors ≥ (gray bar) or < (white bar) 100 mm3 in tamoxifen-treated SftpcCreER/CreER;Trp53fl/fl mice in Krasnat/nat (n = 11 tumors), Krasex3op/nat (n = 25 tumors), or Krasex3op/ex3op (n = 17 tumors) backgrounds after urethane exposure. Two-sided Fisher’s exact test.
-
Figure 1—source data 1
Raw data for Figure 1B–E, Figure 1—figure supplement 1B–E.
- https://cdn.elifesciences.org/articles/67172/elife-67172-fig1-data1-v1.xlsx
Figure 1—figure supplement 1
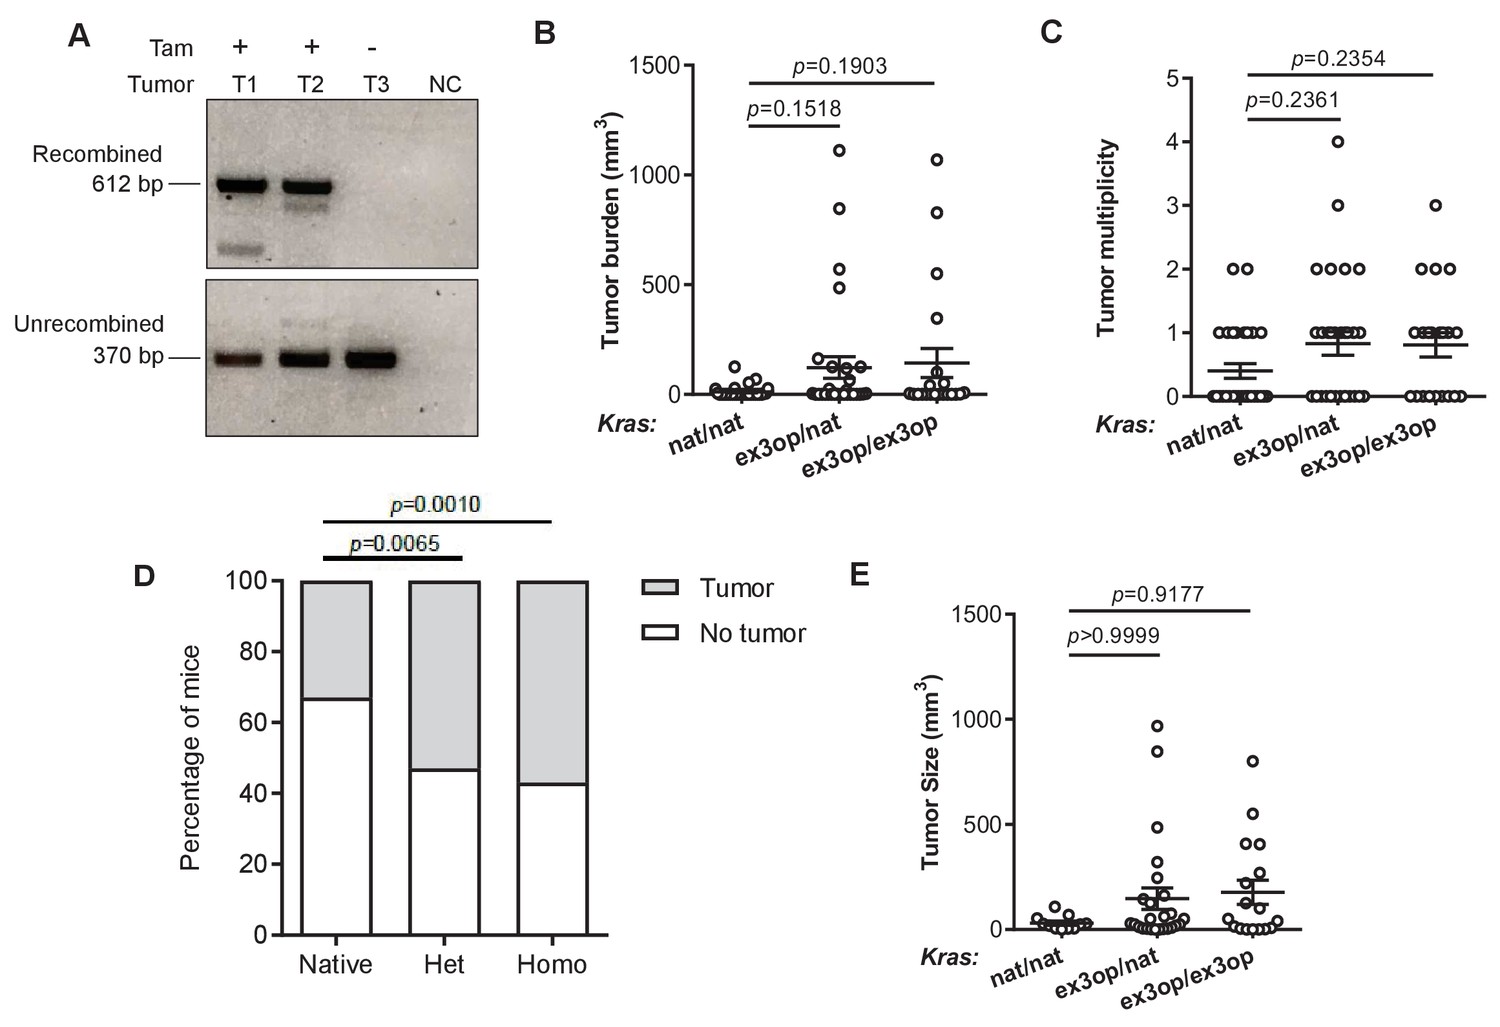
The effect of Krasex3op allele on urethane-mediated lung tumorigenesis in the absence of p53.
(A) PCR analysis of the status of the Trp53flox allele in DNA isolated from lung tumors in SftpcCreER/CreER;Trp53fl/fl;Krasex3op/nat (T1, T3) or SftpcCreER/CreER;Trp53fl/fl;Krasex3op/exeop (T2) mice treated (+) or not treated (-) with tamoxifen (Tam). NC: no DNA control. (B, C, E) Mean ± SEM of urethane-induced tumor (B) burden, (C) multiplicity, and (E) size in tamoxifen-treated SftpcCreER/CreER;Trp53fl/fl mice in a homozygous native (B, C: n = 30 mice; E: n = 11 tumors), heterozygous (B, C: n = 30 mice; E: n = 25 tumors), and homozygous (B, C: n = 21 mice; E: n = 17 tumors) ex3op Kras backgrounds. Dunn's multiple comparison test following Kruskal–Wallis test. (D) % of mice with (gray bar) or without (white bar) a tumor in tamoxifen-treated SftpcCreER/CreER;Trp53fl/fl mice in Krasnat/nat (n = 30 mice), Krasex3op/nat (n = 30 mice), or Krasex3op/ex3op (n = 21 mice) backgrounds after urethane exposure. Two-sided Fisher’s exact test.
Figure 2 with 1 supplement
Loss of p53 reprograms the RAS mutation tropism of urethane.
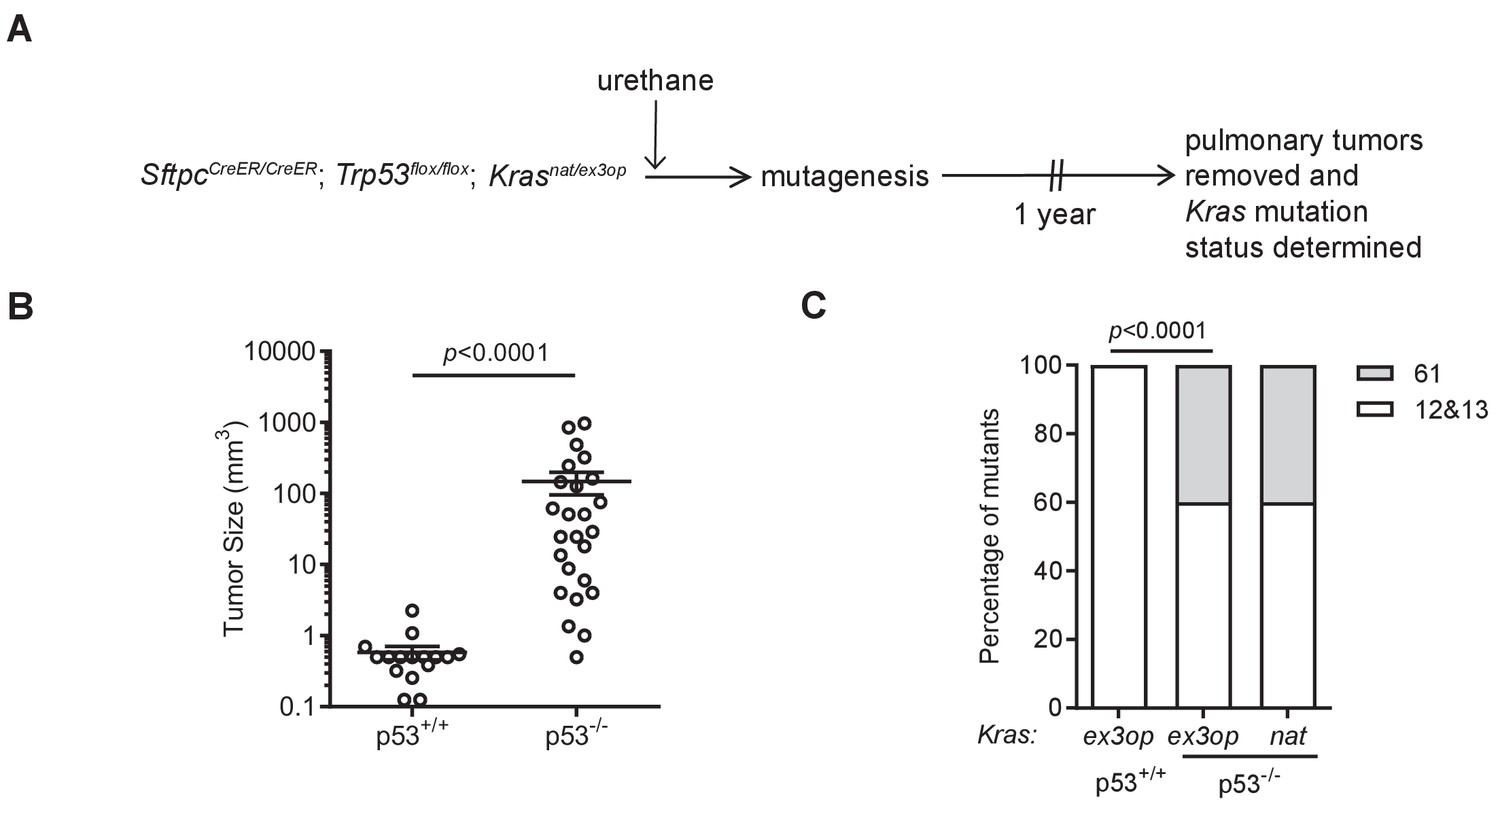
(A) Experimental design to obtain urethane-induced lung tumors from p53+/+ mice. (B) Mean ± SEM of urethane-induced tumor size in SftpcCreER/CreER;Trp53fl/fl;Krasex3op/nat mice not treated (p53+/+, n = 16 tumors) or treated with tamoxifen (p53-/-, n = 25 tumors). Mann–Whitney test. (C) % of urethane-induced tumors with an oncogenic mutation at codon G12/13 (white bar) versus Q61 (gray bar) in the Krasnat versus Krasex3op allele in SftpcCreER/CreER;Trp53fl/fl;Krasex3op/nat mice not treated (p53+/+) or treated with tamoxifen (p53-/-) where indicated. n = 4 tumors ex3op p53+/+, 5 tumors nat p53-/-, and 10 tumors ex3op p53-/-. Two-sided Fisher’s exact test.
-
Figure 2—source data 1
Raw data for Figure 2B, C, Figure 2—figure supplement 1A–C.
- https://cdn.elifesciences.org/articles/67172/elife-67172-fig2-data1-v1.xlsx
Figure 2—figure supplement 1
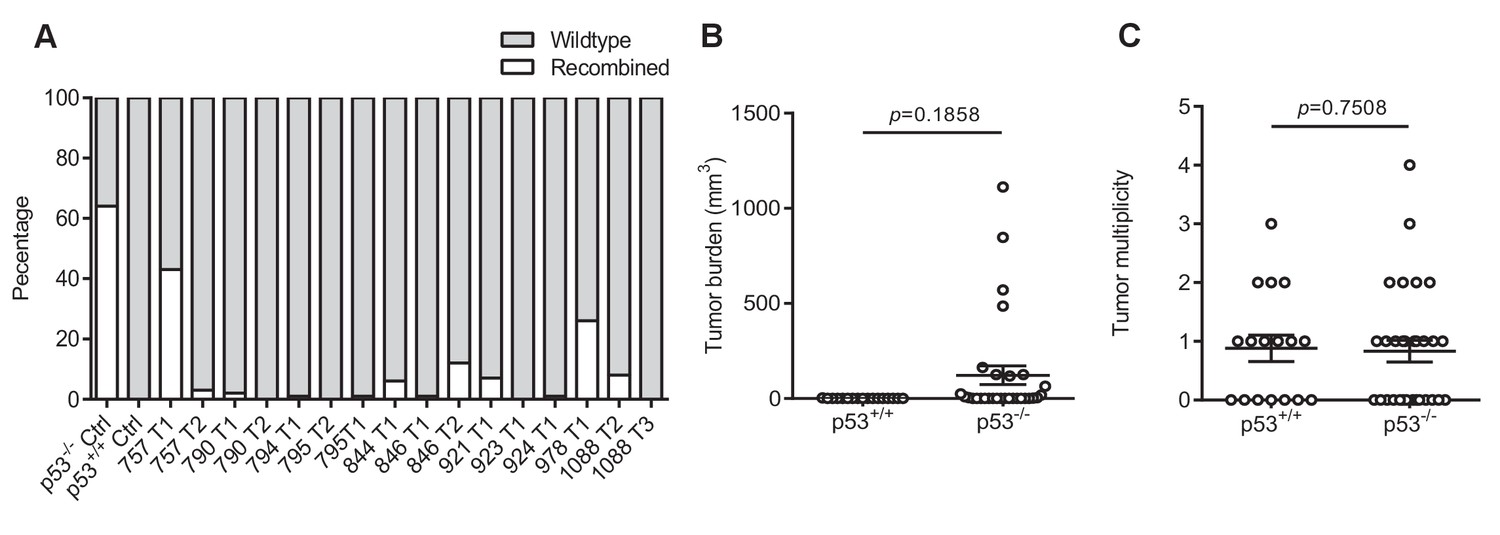
The effect of p53 loss on tumor burden and multiplicity.
(A) Proportion of recombined p53 allele and wildtype allele in tumors from mice not treated with tamoxifen by qPCR. (B, C) Mean ± SEM tumor (B) burden and (C) multiplicity of SftpcCreER/CreER;Trp53fl/fl;Krasex3op/nat mice not treated (p53+/+, n = 17 mice) or treated (p53-/-, n = 30 mice) with tamoxifen. Mann–Whitney test.
Figure 3 with 1 supplement
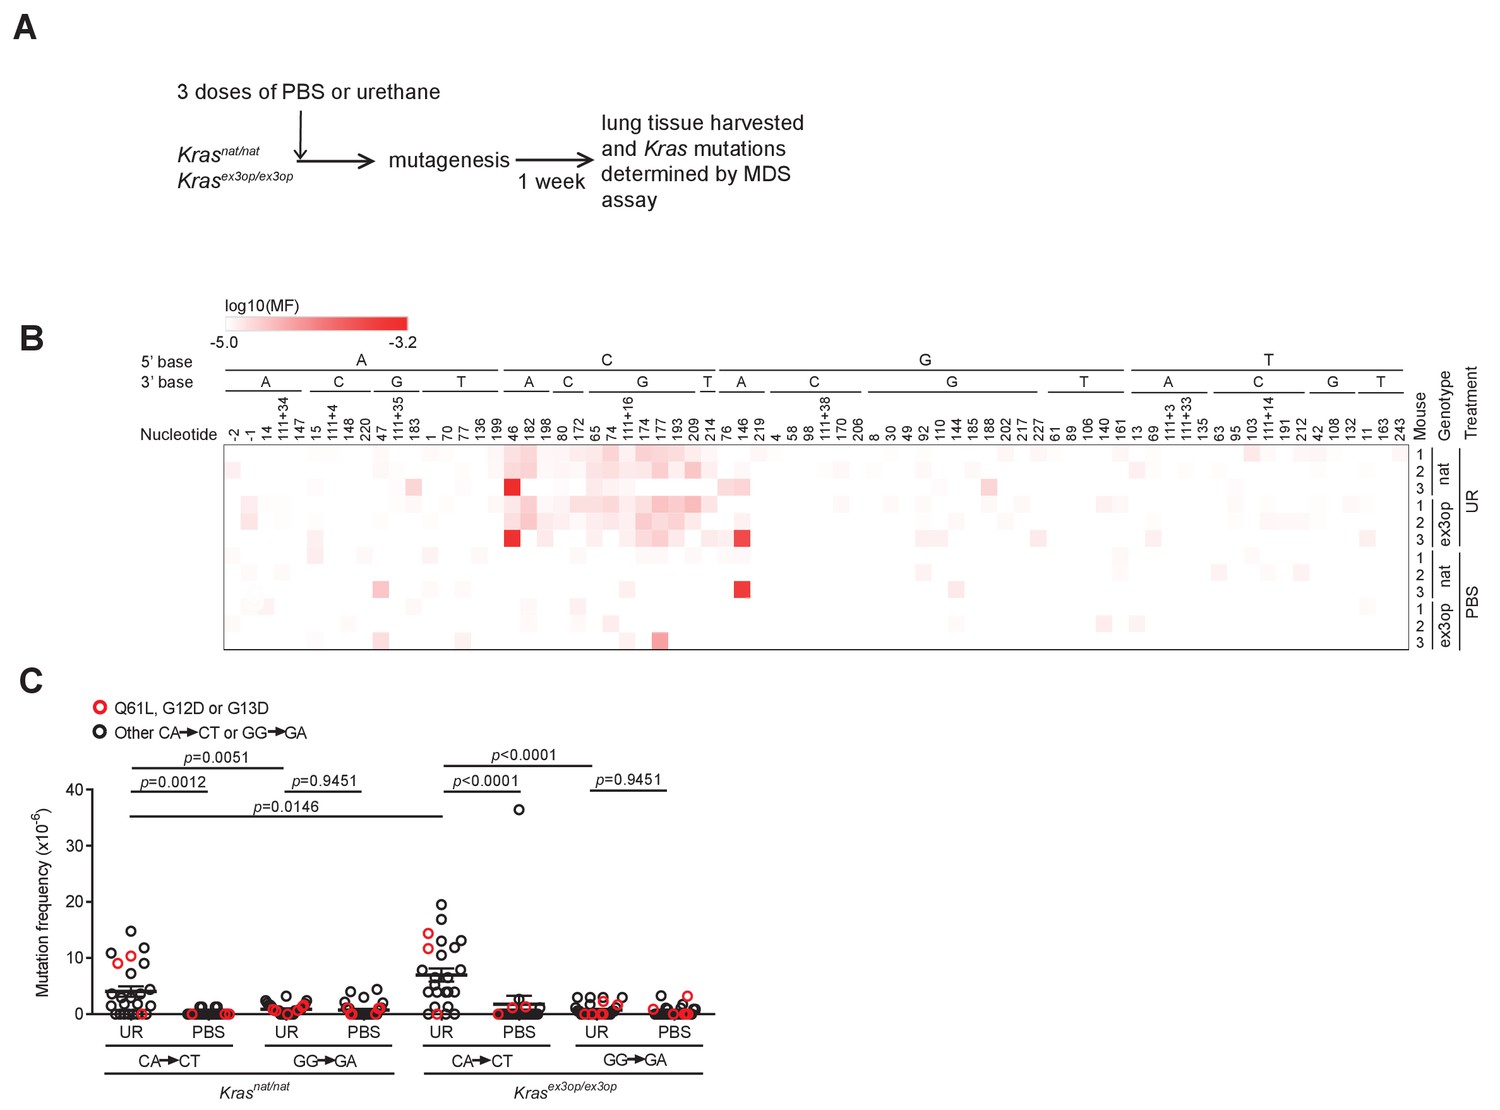
The mutation signature of urethane is not affected by the Krasex3op allele.
(A) Experimental design to identify mutations induced by urethane in mouse lung in a Krasnat versus Krasex3op background. (B) Heatmap of the log-transformed mutation frequency (MF) of A>T transversions determined by maximum depth sequencing (MDS) sequencing the exons 1 and 2 of Kras from the lungs of mice exposed to urethane (UR) in a Krasnat/nat (nat) (n = 3 mice) versus Krasex3op/ex3op (ex3op) (n = 3 mice) background. Nucleotide number as well as the 5′ and 3′ base of the substituted A are shown at the top; ‘-’ indicates nucleotides upstream of ATG start codon in 5′UTR; ‘111+’ indicates nucleotides in the intron downstream of exon 1. (C) Mean ± SEM mutation frequency of all CA>CT mutations in Kras exon 2, with Q61L mutation highlighted in red, as well as all GG>GA mutations in Kras exon 1, with G12D and G13D mutations highlighted in red, derived from the aforementioned MDS sequencing of Kras exons 1 and 2 from the lungs of Krasnat/nat versus Krasex3op/ex3op mice treated with either urethane or PBS (n = 3 mice each). Holm–Sidak multiple comparisons test following one-way ANOVA.
-
Figure 3—source data 1
Raw data for Figure 3C, Figure 3—figure supplement 1B, C.
- https://cdn.elifesciences.org/articles/67172/elife-67172-fig3-data1-v1.xlsx
Figure 3—figure supplement 1
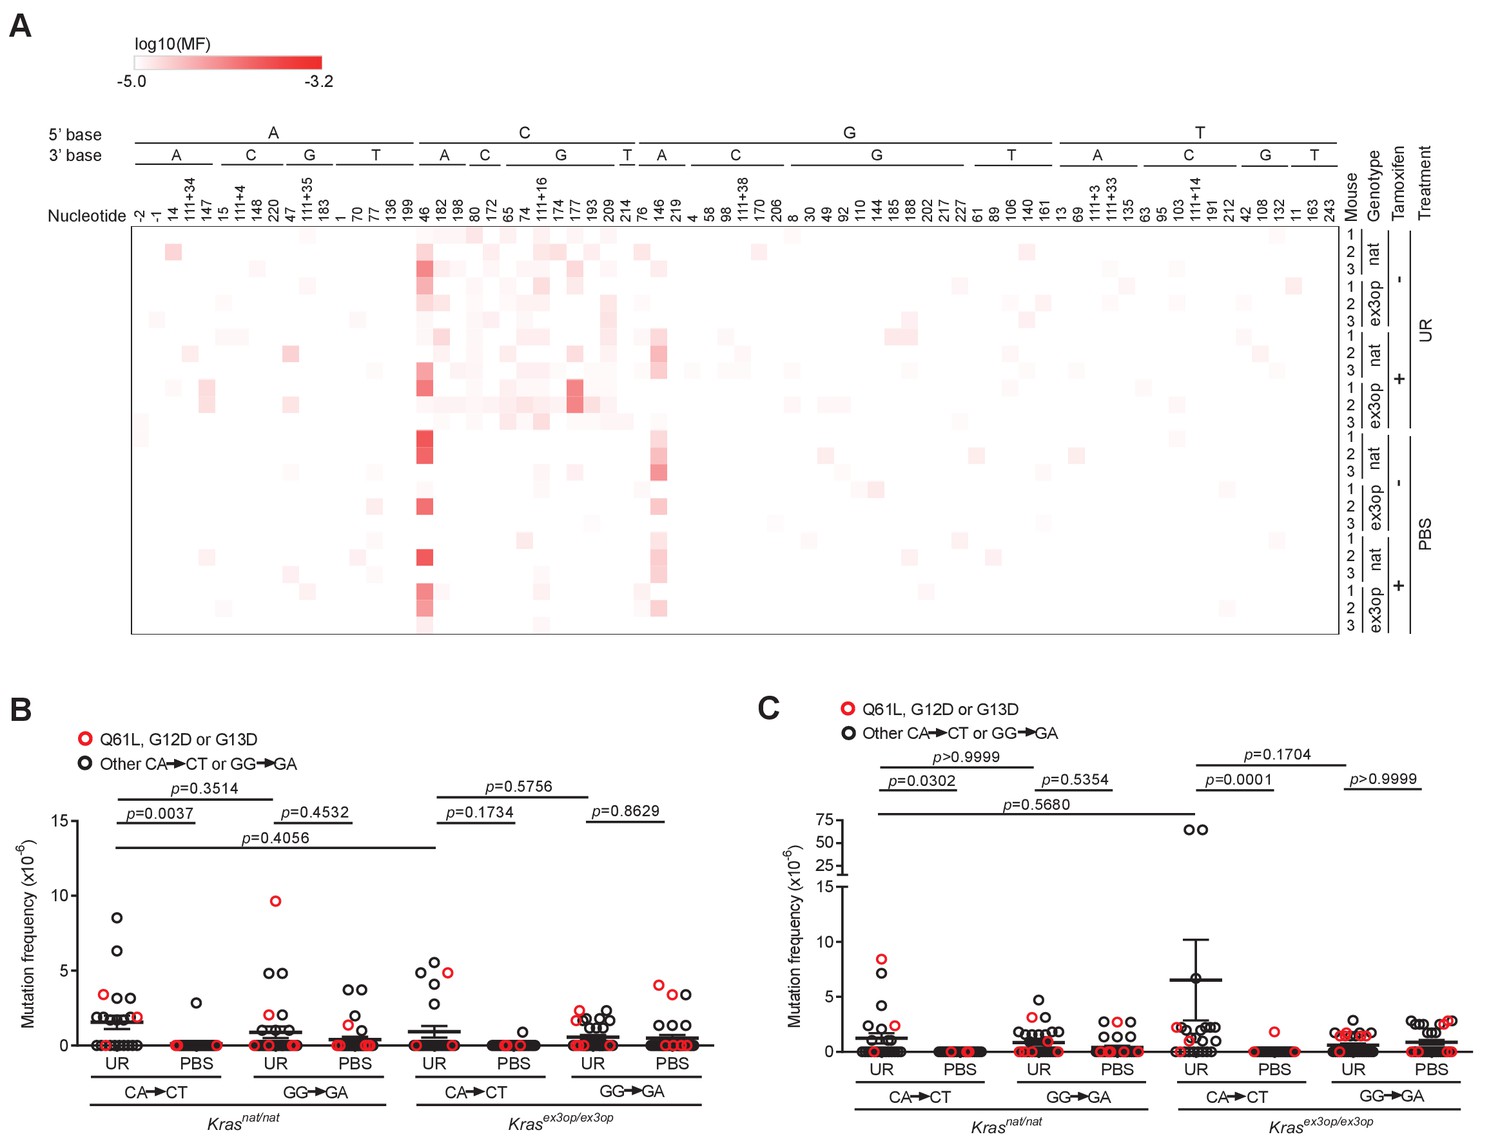
Mutagenesis profile of SftpcCreER/CreER;Trp53fl/fl;Krasnat/nat and SftpcCreER/CreER;Trp53fl/fl;Krasex3op/ex3op mice.
(A) Heatmap of the log-transformed mutation frequency (MF) determined by maximum depth sequencing (MDS) sequencing the exons 1 and 2 of Kras from the lungs of mice treated (+) or not treated with tamoxifen (-), exposed to urethane (UR) or PBS, in a SftpcCreER/CreER;Trp53fl/fl;Krasnat/nat (nat) or SftpcCreER/CreER;Trp53fl/fl;Krasex3op/ex3op (ex3op) background (n = 3 mice) for each A>T transversions (nucleotide number as well as the 5′ and 3′ base of the substituted A are shown at the top, ‘-’ indicates nucleotides upstream of ATG start codon in 5′UTR, ‘111+’ indicates nucleotides in the intron downstream of exon 1). (B, C) Mean ± SEM mutation frequency of all CA>CT mutations in Kras exon 2, including Q61L mutation highlighted in red, as well as all GG>GA mutations in Kras exon 1, including G12D and G13D mutations highlighted in red, derived from MDS sequencing of Kras exons 1 and 2 from the lungs of SftpcCreER/CreER;Trp53fl/fl;Krasnat/nat versus SftpcCreER/CreER;Trp53fl/fl;Krasex3op/ex3op mice (B) not treated or (C) treated with tamoxifen and exposed to either urethane (UR) or PBS (n = 3 mice). (B) Holm–Sidak multiple comparisons test following one-way ANOVA. (C) Dunn’s multiple comparison test following Kruskal–Wallis test.
Figure 4 with 2 supplements
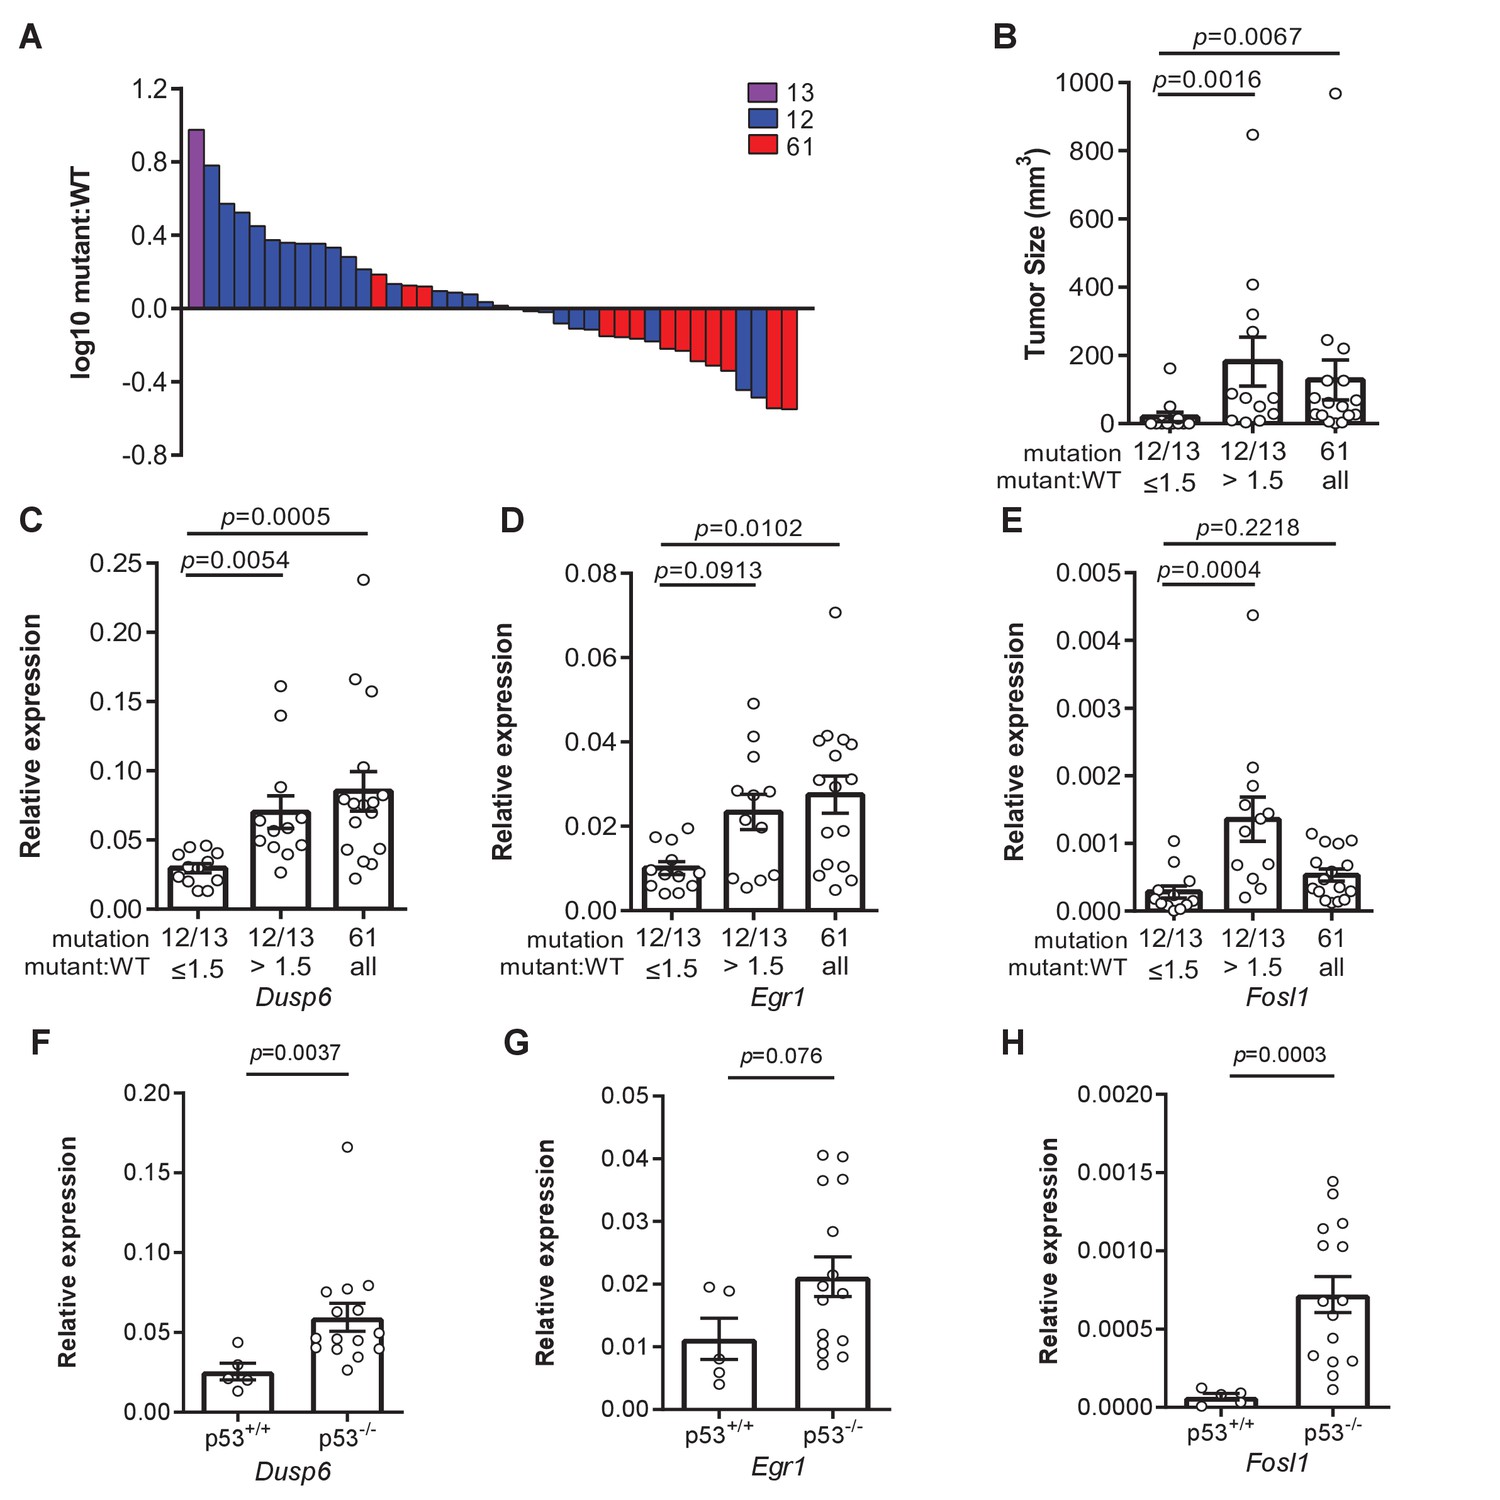
Loss of p53 promotes higher expression of weaker oncogenic mutations.
(A) Log10-transformed ratio of mutant to wildtype Kras mRNA determined by RT-qPCR in all Kras hotspot-mutant tumors (n = 40) derived from Figures 1 and 2. (B) Mean ± SEM size of tumors with a G12/13 oncogenic Kras mutation with a high (>1.5, n = 12 tumors) versus low (≤1.5, n = 12 tumors) mutant:WT ratio versus tumors with a Q61 oncogenic Kras mutation (n = 16 tumors). Dunn's multiple comparison test following Kruskal–Wallis test. (C–H) Mean ± SEM levels of the indicated mRNAs normalized to β-actin (relative expression) in (C–E) tumors with a G12/13 oncogenic Kras mutation with a high (>1.5, n = 12 tumors) versus low (≤1.5, n = 12 tumors) mutant:WT ratio versus tumors with a Q61 oncogenic Kras mutation (n = 16 tumors) or (F–H) tumors from SftpcCreER/CreER;Trp53fl/fl;Krasex3op/nat mice not treated (p53+/+, n = 5 tumors) or treated with tamoxifen (p53-/-, n = 15 tumors) partitioned by p53 mutation status. (C–E) Dunn's multiple comparison test following Kruskal–Wallis test. (F–H) Mann–Whitney test.
Figure 4—figure supplement 1
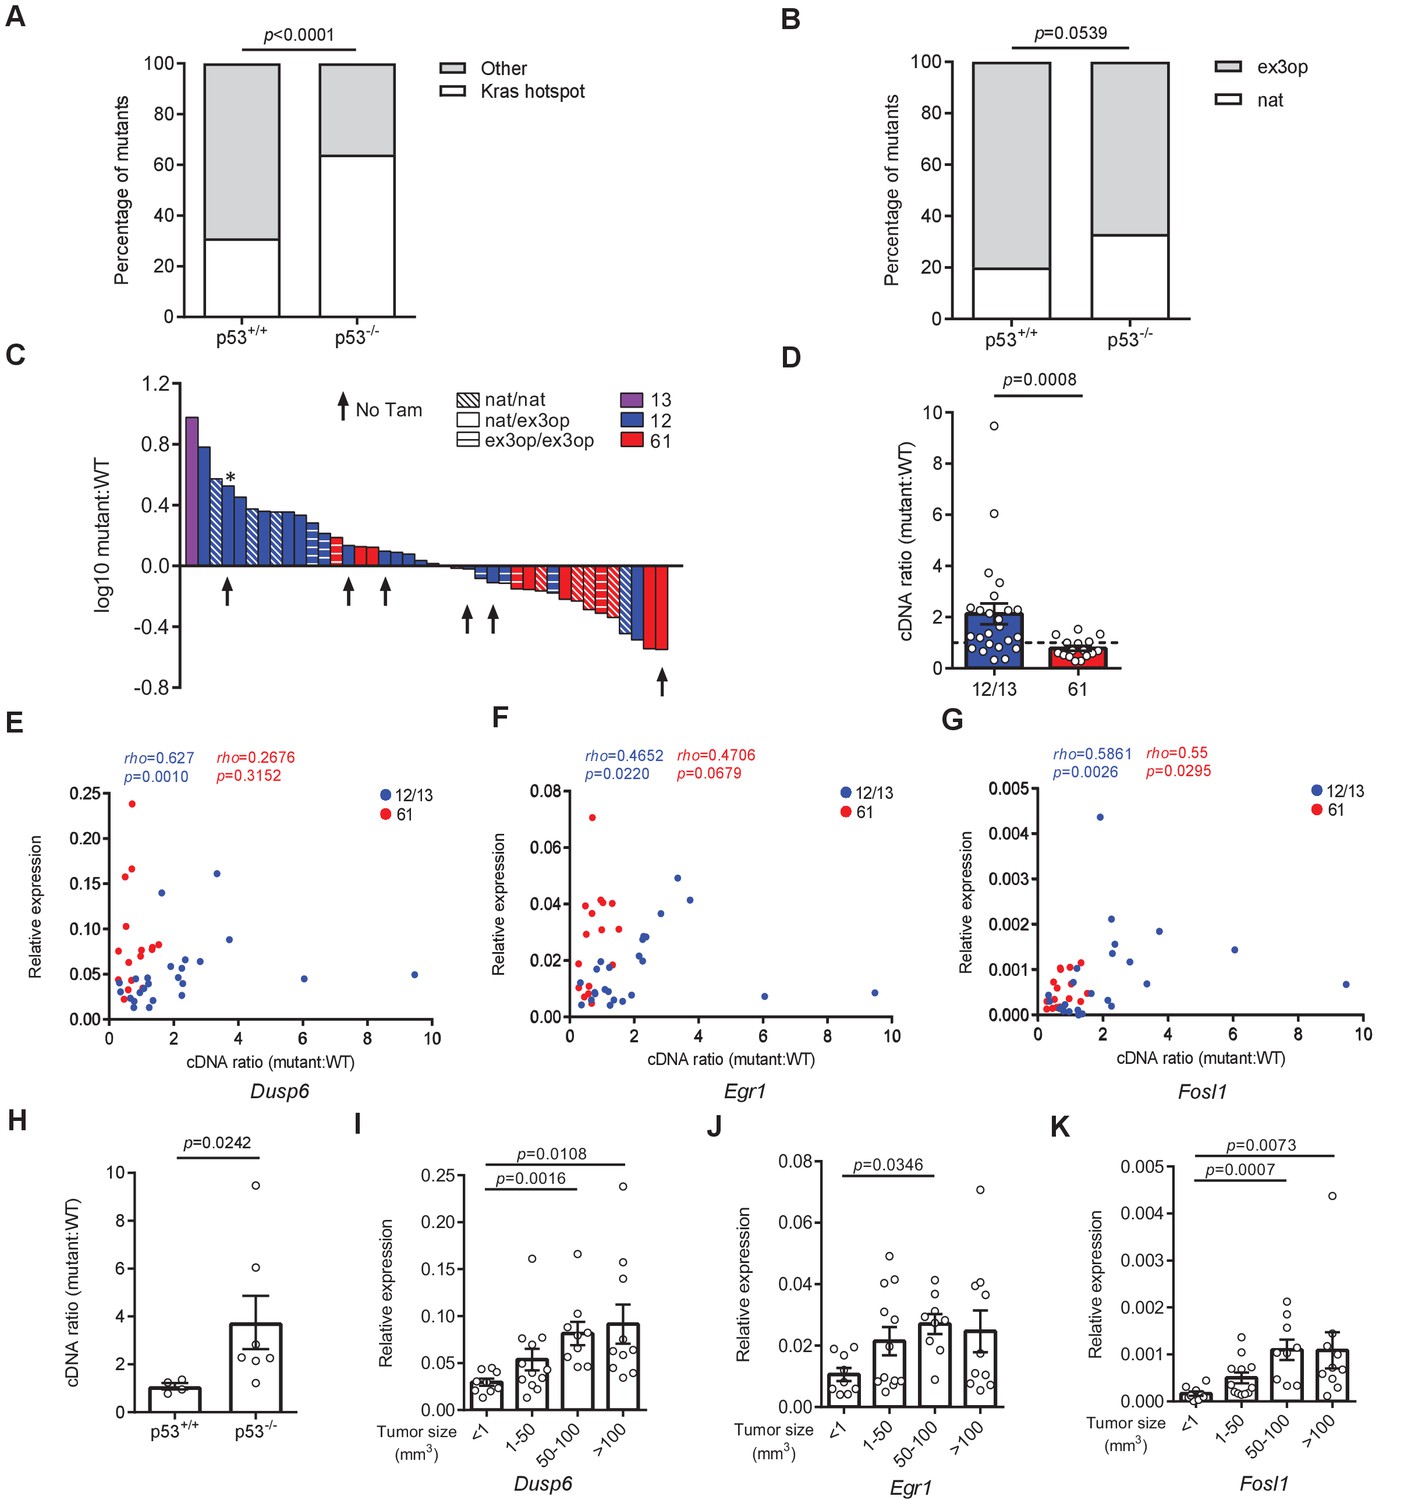
Allelic imbalance and MAPK signaling in Kras hotspot-mutant tumors.
(A) % of tumors with an oncogenic mutation at Kras hotspot (white bar) versus other tumors (gray bar) from SftpcCreER/CreER;Trp53fl/fl;Krasex3op/nat mice not treated (p53+/+, n = 16 tumors) or treated (p53-/-, n = 25 tumors) with tamoxifen. Two-sided Fisher’s exact test. (B) % of tumors with Kras hotspot mutations occurring in the native (white bar) or ex3op (gray bar) allele from SftpcCreER/CreER;Trp53fl/fl;Krasex3op/nat mice not treated (p53+/+, n = 5 tumors) or treated (p53-/-, n = 15 tumors) with tamoxifen. Two-sided Fisher’s exact test. (C) Log10-transformed ratio of mutant to wildtype Kras mRNA determined by RT-qPCR in all Kras hotspot-mutant tumors (n = 40 tumors) derived from Figures 1 and 2. Asterisk indicates tumor 757T1 with a p53 deficiency. (D) Mean ± SEM ratio of mutant to wildtype Kras mRNA in tumors with G12/13 (n = 24 tumors) and Q61 (n = 16 tumors) mutations. (E–G) Correlation between the levels of the indicated mRNAs normalized to β-actin (relative expression) and the ratio of mutant to wildtype Kras mRNA. Rho and p values are from Spearman correlation analysis. Mann–Whitney test. (H) Mean ± SEM ratio of G12/13 mutant Krasex3op to wildtype Krasnat mRNA in tumors from SftpcCreER/CreER;Trp53fl/fl;Krasex3op/nat mice not treated (p53+/+, n = 4 tumors) or treated with tamoxifen (p53-/-, n = 7 tumors). Mann–Whitney test. (I–K) Mean ± SEM levels of the indicated mRNAs normalized to β-actin (relative expression) for tumors that are <1 (n = 9 tumors), 1–50 (n = 12 tumors), 50–100 (n = 9 tumors), and >100 (n = 10 tumors) mm3. Dunn's multiple comparison test following Kruskal–Wallis test.
Figure 4—figure supplement 2
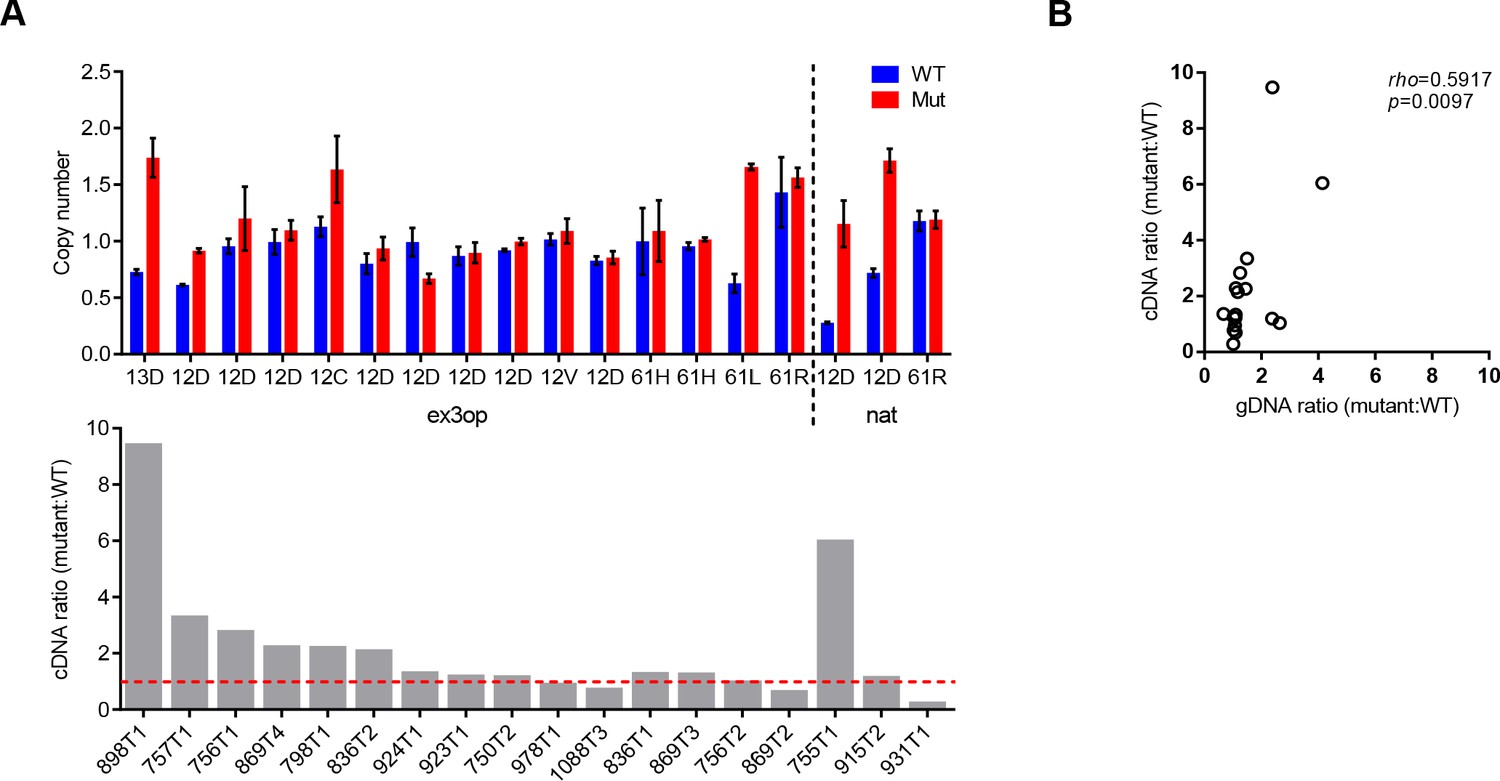
The imbalance at mRNA level could not be fully attributed to the imbalance of DNA copy number.
(A) Top: copy number of the mutant or wildtype allele in tumors from SftpcCreER/CreER;Trp53fl/fl;Krasex3op/nat mice estimated by qPCR copy number assay (Tert as reference gene). Mutant type and the allele with mutation are indicated. Bottom: the ratio of mutant to wildtype Kras mRNA and ID of the tumors listed in the top graph. Data shown are mean ± SEM of two technical replicates. (B) Correlation between the mRNA ratio and genomic DNA (gDNA) ratio of mutant to wildtype Kras allele. Rho and p values are from Spearman correlation analysis.
Figure 5
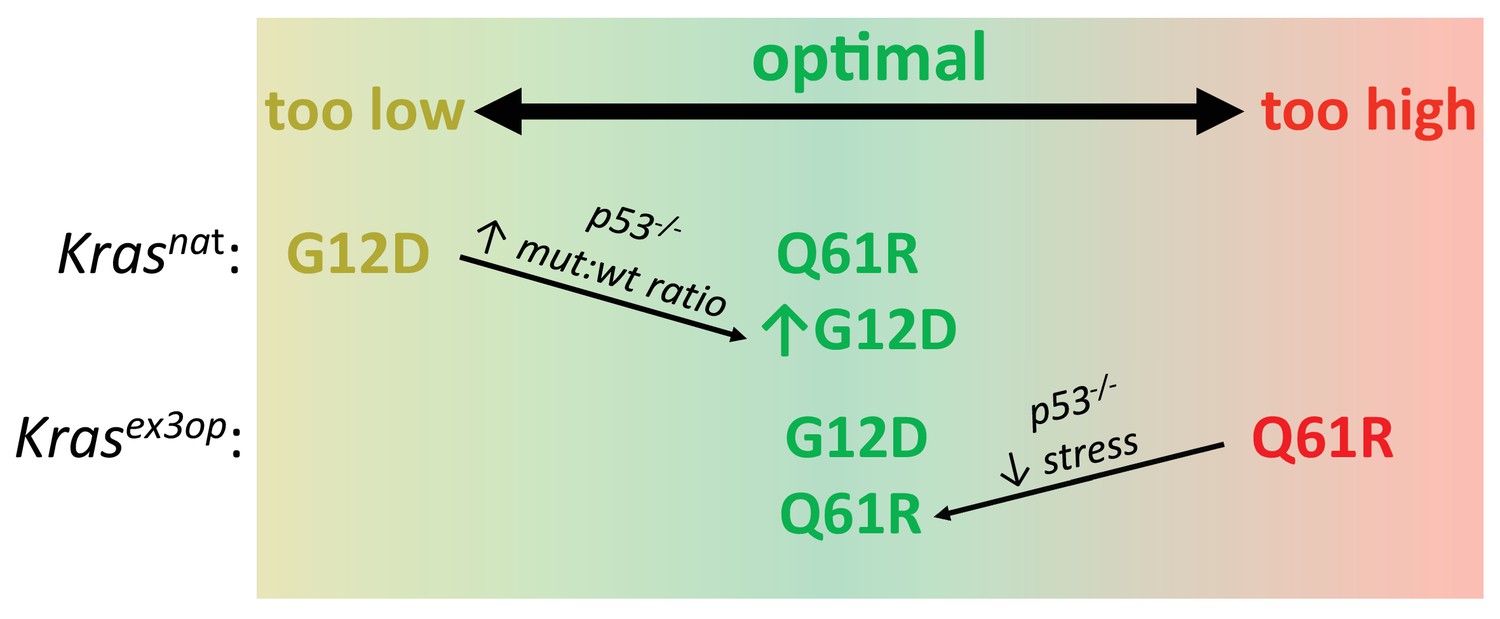
Optimal signaling is required for effective tumor initiation.
Signaling from a G12D mutation in the native (nat) Kras allele and from a Q61R mutation in the codon-optimized (ex3op) Kras allele is outside of the window of optimal signaling level achieved by Krasnat(G12D) and Krasex3op(Q61R). Loss of p53 alleviates the selection against oncogenic stress and allows the recovery of a Q61R mutation in Krasex3op allele or a G12D mutation in the Krasnat allele with elevated mutant:wildtype (mut:wt) mRNA allelic ratio.
Tables
Key resources table
| Reagent type (species) or resource | Designation | Source or reference | Identifiers | Additional information |
|---|---|---|---|---|
| Strain, strain background (Mus musculus) | 129 background - Krasex3op | Pershing et al., 2015, MMRRC | Stock 050601-UNC; MGI:5708830 | |
| Strain, strain background (Mus musculus) | B6.129 mixed background -Trp53flox/flox | The Jackson Laboratory | Stock 008462; MGI:1931011 | |
| Strain, strain background (Mus musculus) | B6.129 mixed background -SftpcCreER/CreER | Xu et al., 2012, gift from Mark Onaitis | MGI:5305340 | |
| Strain, strain background (Mus musculus) | B6.129 mixed background - SftpcCreER/CreER;Trp53flox/flox;Krasex3op | This paper | N/A | See Materials and methods section ‘Mice’ |
| Sequence-based reagent | Krasex3op genotyping F | This paper | PCR primers | TGGTAGGGTAGAAACTAGGATTC |
| Sequence-based reagent | Krasex3op genotyping R | This paper | PCR primers | GAGTACACAGAGAGACCATTTCAAC |
| Sequence-based reagent | Trp53 genotyping F | This paper | PCR primers | CACAAAAAACAGGTTAAACCCA |
| Sequence-based reagent | Trp53 genotyping WT R | This paper | PCR primers | AGCACATAGGAGGCAGAGAC |
| Sequence-based reagent | Trp53 genotyping Del R | This paper | PCR primers | GAAGACAGAAAAGGGGAGGG |
| Sequence-based reagent | Sftpc genotyping F | This paper | PCR primers | GCTTCACAGGGTCGGTAG |
| Sequence-based reagent | Sftpc genotyping R | This paper | PCR primers | GAGGCACCGCTCCGCGAG |
| Sequence-based reagent | Sftpc genotyping CreER R | This paper | PCR primers | CAACTCACAACGTGGCACTG |
| Sequence-based reagent | Tumor sequencing primers | This paper | PCR primers | Supplementary file 3 |
| Sequence-based reagent | qPCR primers | This paper | PCR primers | Supplementary file 3 |
| Sequence-based reagent | MDS assay primers | This paper | PCR primers | Supplementary file 3 |
| Peptide, recombinant protein | Proteinase K | New England Biolabs | Cat# P8107S | |
| Peptide, recombinant protein | RNase A | Sigma | Cat# R4642 | |
| Peptide, recombinant protein | EcoRV | New England Biolabs | Cat# R3195 | |
| Peptide, recombinant protein | EcoRI | New England Biolabs | Cat# R3101 | |
| Peptide, recombinant protein | XmnI | New England Biolabs | Cat# R0194 | |
| Peptide, recombinant protein | Exonuclease I | New England Biolabs | Cat# M0293 | |
| Commercial assay or kit | iScript cDNA synthesis kit | Bio-Rad | Cat# 1708890 | |
| Commercial assay or kit | Platinum Taq Polymerase | Thermo Fisher Scientific | Cat# 10966083 | |
| Commercial assay or kit | QIAquick PCR Purification Kit | Qiagen | Cat# 28104 | |
| Commercial assay or kit | Q5 Hot Start High-Fidelity DNA Polymerase | New England Biolabs | Cat# M0493 | |
| Commercial assay or kit | Agencourt AMPure XP | Beckman Coulter | Cat# A63880 | |
| Commercial assay or kit | iTaq Universal SYBR Green Supermix | Bio-Rad | Cat# 1725120 | |
| Commercial assay or kit | PrimeTime Gene Expression Master Mix | Integrated DNA Technologies | Cat# 1055770 | |
| Chemical compound, drug | Tamoxifen | Sigma | Cat# T5648 | |
| Chemical compound, drug | Corn oil | Sigma | Cat# C8267 | |
| Chemical compound, drug | Urethane | Sigma | Cat# U2500 | |
| Chemical compound, drug | RLT buffer | Qiagen | Cat# 79216 | |
| Chemical compound, drug | β-Mercaptoethanol | Thermo Fisher Scientific | Cat# 21985023 | |
| Chemical compound, drug | Trizol LS | Thermo Fisher Scientific | Cat# 10296010 | |
| Chemical compound, drug | dNTP | New England Biolabs | Cat# N0447S | |
| Chemical compound, drug | Agarose | EMD Millipore | Cat# 2120-OP | |
| Chemical compound, drug | Tris | EMD Millipore | Cat# 9210-OP | |
| Chemical compound, drug | EDTA | VWR | Cat# 97061–406 | |
| Chemical compound, drug | Sodium dodecyl sulfate | Sigma | Cat# L4509 | |
| Chemical compound, drug | Phenol | Sigma | Cat# P1037 | |
| Chemical compound, drug | Chloroform | Macron Fine Chemicals | Cat# 4440-04 | |
| Chemical compound, drug | Ethanol | VWR | Cat# 89125-190 | |
| Chemical compound, drug | 10X exonuclease I buffer | New England Biolabs | Cat# B0293S | |
| Chemical compound, drug | Sodium chloride | EMD Millipore | Cat# SX0420 | |
| Chemical compound, drug | Potassium chloride | VWR | Cat# BDH0258 | |
| Chemical compound, drug | Potassium phosphate monobasic | Sigma | Cat# 795488 | |
| Chemical compound, drug | Sodium phosphate dibasic | Sigma | Cat# RDD022 | |
| Software, algorithm | fastq-join | https://usegalaxy.org/ | Galaxy Version 1.1.2–806.1 | See Materials and methods section ‘Sequencing data analysis’ |
| Software, algorithm | Filter by Quality | https://usegalaxy.org/ | Galaxy Version 1.0.0 | See Materials and methods section ‘Sequencing data analysis’ |
| Software, algorithm | Trim | https://usegalaxy.org/ | Galaxy Version 0.0.1 | See Materials and methods section ‘Sequencing data analysis’ |
| Software, algorithm | Filter sequences by length | https://usegalaxy.org/ | Galaxy Version 1.1 | See Materials and methods section ‘Analysis of MDS data’ |
| Software, algorithm | Group | https://usegalaxy.org/ | Galaxy Version 2.1.4 | See Materials and methods section ‘Sequencing data analysis’ |
| Software, algorithm | Barcode Splitter | https://usegalaxy.org/ | Galaxy Version 1.0.0 | See Materials and methods sections ‘Sequencing data analysis’ and ‘Analysis of MDS data’ |
| Software, algorithm | PEAR pair-end read merger | Zhang et al., 2014b | Version 0.9.8 | https://cme.h-its.org/exelixis/web/software/pear/ |
| Software, algorithm | Morpheus | https://software.broadinstitute.org/morpheus | N/A | Generation of heatmaps |
| Software, algorithm | Prism | GraphPad | Version 6 |
Additional files
-
Supplementary file 1
Information for mice and tumors involved in the tumorigenesis study.
- https://cdn.elifesciences.org/articles/67172/elife-67172-supp1-v1.xlsx
-
Supplementary file 2
Mutation frequency detected by maximum depth sequencing assay in the mutagenesis experiments.
- https://cdn.elifesciences.org/articles/67172/elife-67172-supp2-v1.xlsx
-
Supplementary file 3
Tumor sequencing, qPCR, and maximum depth sequencing assay primers.
- https://cdn.elifesciences.org/articles/67172/elife-67172-supp3-v1.xlsx
-
Transparent reporting form
- https://cdn.elifesciences.org/articles/67172/elife-67172-transrepform-v1.docx
Download links
A two-part list of links to download the article, or parts of the article, in various formats.
Downloads (link to download the article as PDF)
Open citations (links to open the citations from this article in various online reference manager services)
Cite this article (links to download the citations from this article in formats compatible with various reference manager tools)
Signaling levels mold the RAS mutation tropism of urethane
eLife 10:e67172.
https://doi.org/10.7554/eLife.67172


