Objective pupillometry shows that perceptual styles covary with autistic-like personality traits
- Department of Surgical Medical Molecular and Critical Area Pathology, University of Pisa, Italy
- Fondazione Stella Maris Mediterraneo, Italy
- Department of Neuroscience Psychology Pharmacology and Child Health, University of Firenze, Italy
- Department of Translational Research on New Technologies in Medicine and Surgery, University of Pisa, Italy
Figures
Figure 1
Methods.
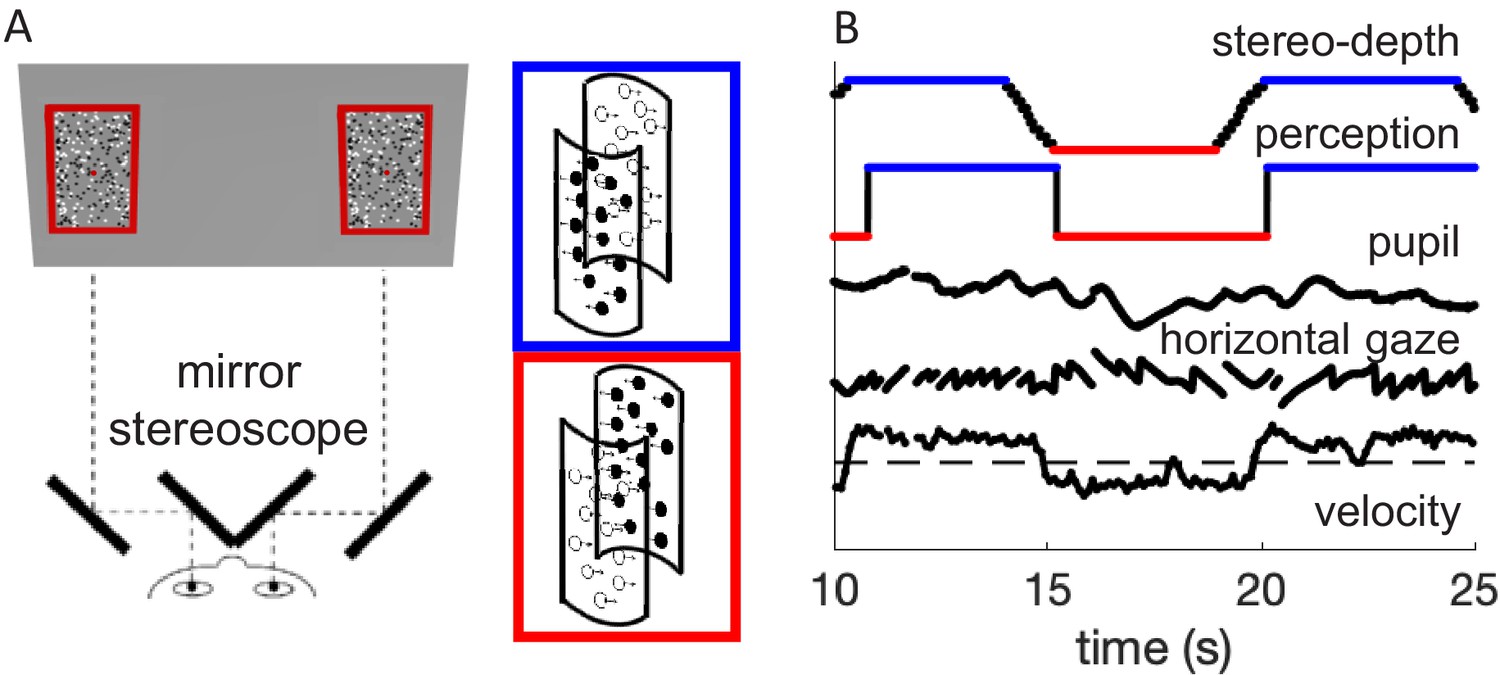
(A) Schematic diagram of the experimental setup, where participants viewed the screen through a mirror stereoscope while their left eye was tracked by a remote Eyelink camera. Note the small red fixation spot at the center of each display. Black and white dots moved in opposite directions, defining two overlapping surfaces that formed the front and rear of a rotating cylinder. Using stereopsis, we caused one of the surfaces to appear in front and the other behind the fixation plane, intermittently swapping the perceived rotation direction of the cylinder, as illustrated by the insets with colored outlines. (B) Example timecourses of stereo-depth (note the gradual change in disparity, lasting 1.2 s), perceptual reports, pupil size, horizontal gaze position (displaying OKN-like pattern), and velocity of the slow gaze shifts (fast transients filtered out).
Figure 2 with 1 supplement
Results of the main experiment.
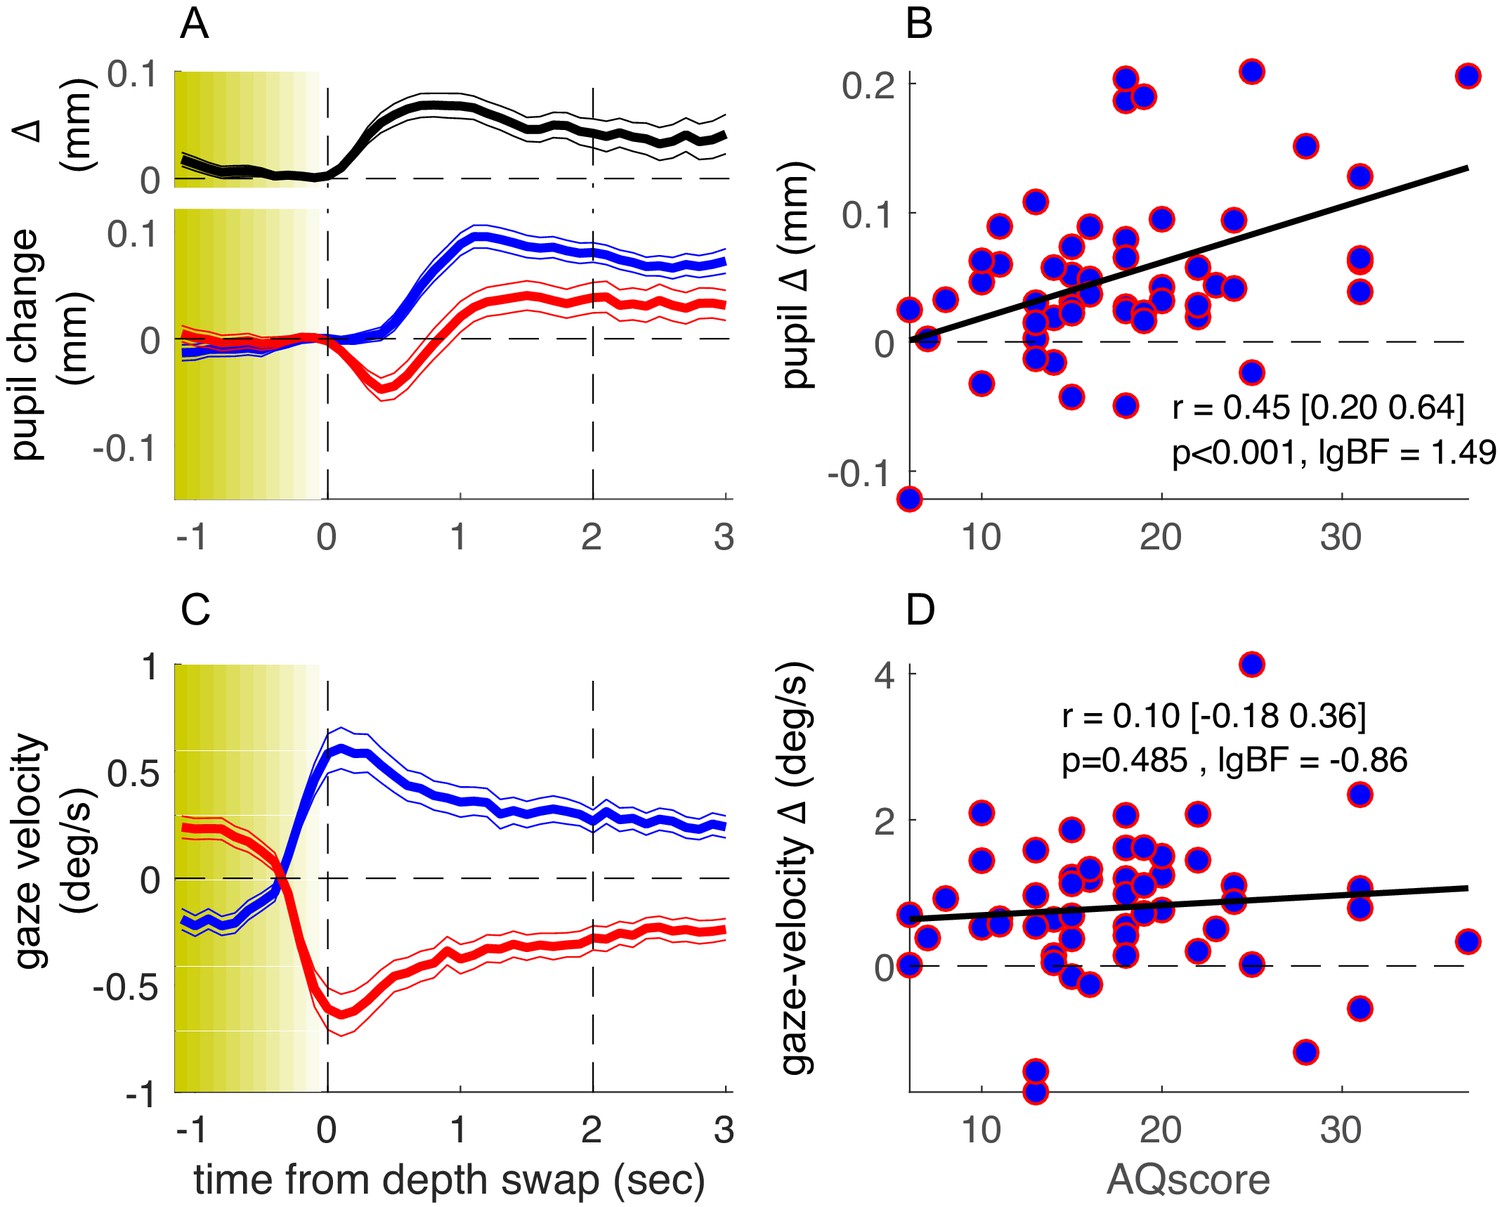
(A) Pupil-size traces, synchronized to stereo-depth swaps (which occurred gradually over the yellow-shaded window) and averaged separately for times when the foreground was black (blue trace) or white (red trace). The top inset (black trace) shows the timecourse of the difference between the two traces. Thin lines show standard error across the 53 participants. (C) Same as A but showing gaze-velocity traces, computed after filtering out gazes shift faster than the maximum stimulus speed (3.9 deg/s) and after inverting the sign of velocity values for trials when the black dots moved leftward, so that positive gaze shifts always imply gaze shifts in the direction of the black dots. (B-D) Average pupil-size difference (B) or gaze-velocity difference (D), computed in the interval 0:2 s (marked by the vertical dashed lines in A and C) for each participant and plotted against their score on the Autism-Spectrum Quotient questionnaire. The thick black line shows the best fitting linear regression; text inset gives Pearson’s correlation coefficient with 95% confidence interval and associated p-value and base-10 logarithm of the Bayes Factor (lgBF).
Figure 2—figure supplement 1
Results of the main experiment with report-based analysis.
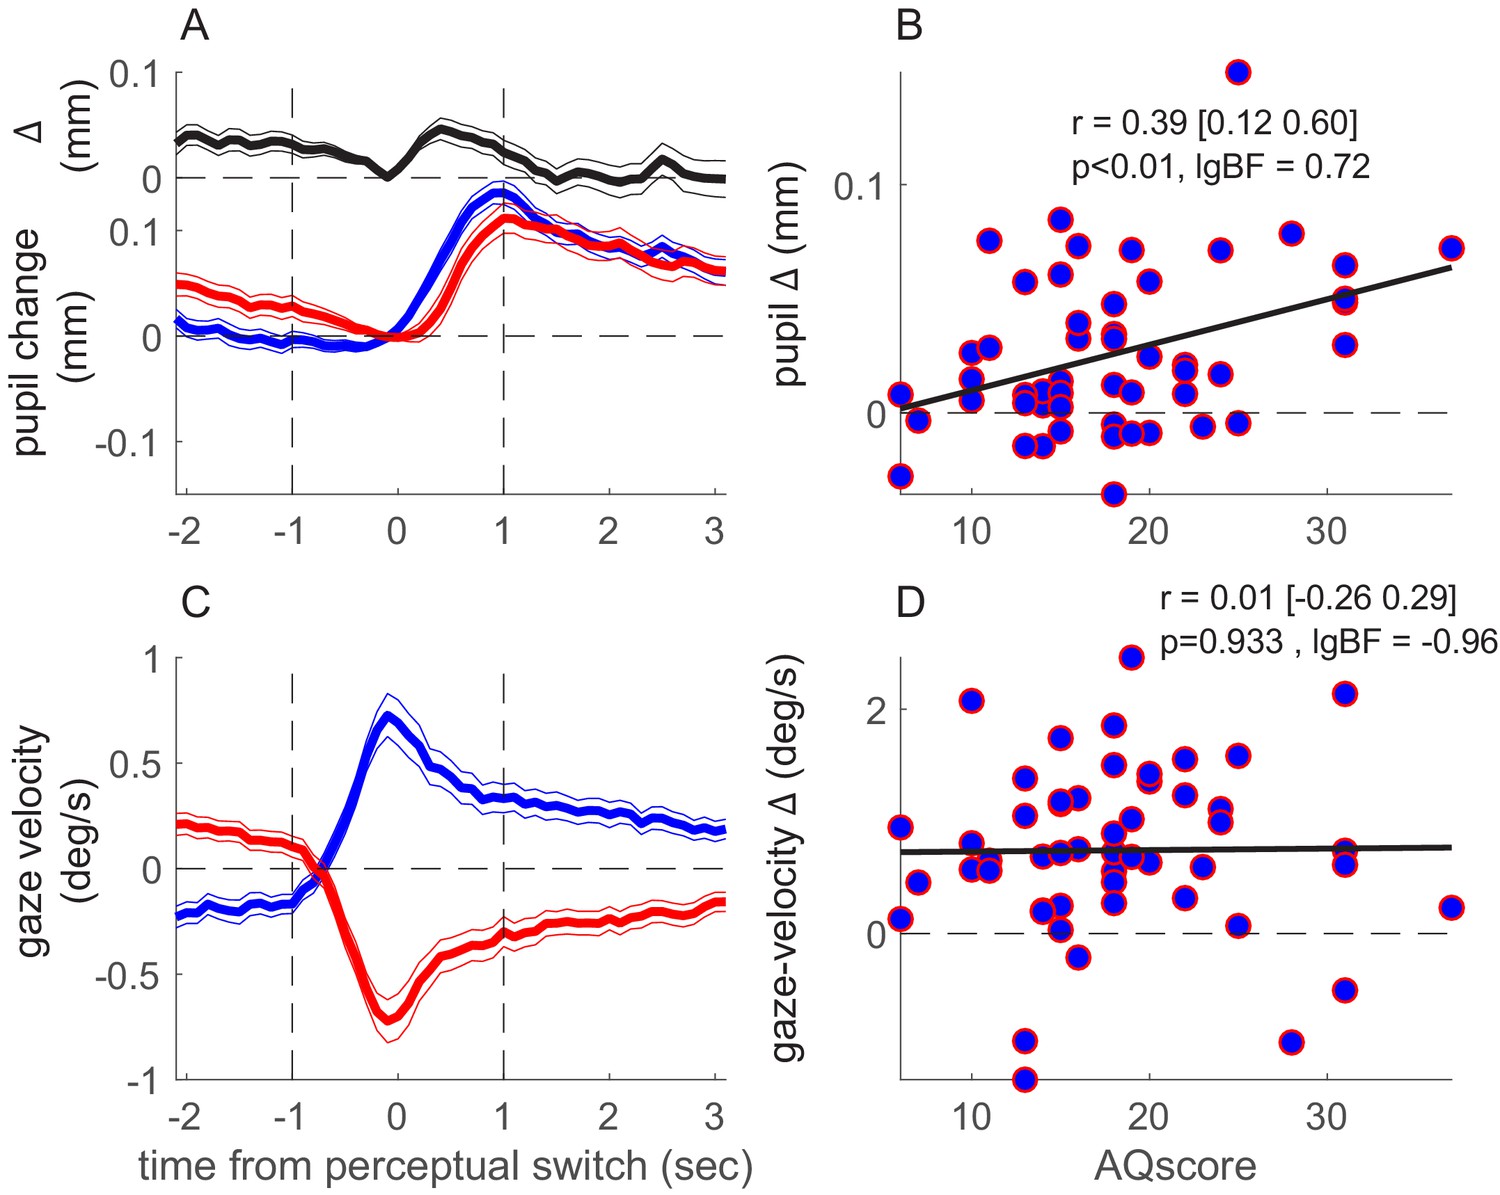
Same as in Figure 2, but synchronizing traces from the main experiment to perceptual reports rather than stereo-depth. Blue and red traces show data from times when participants reported the black or the white dots in the foreground, respectively. Reports switched at time = 0 s, implying that color-coding is swapped for times < 0 s (accordingly, pupil-difference traces are sign-changed for t < 0 s). Pupil-size and gaze-velocity differences in panels B and D were computed by averaging over the interval −1:1 s marked by the vertical dashed lines.
Figure 3 with 1 supplement
Results of the no-report experiment.
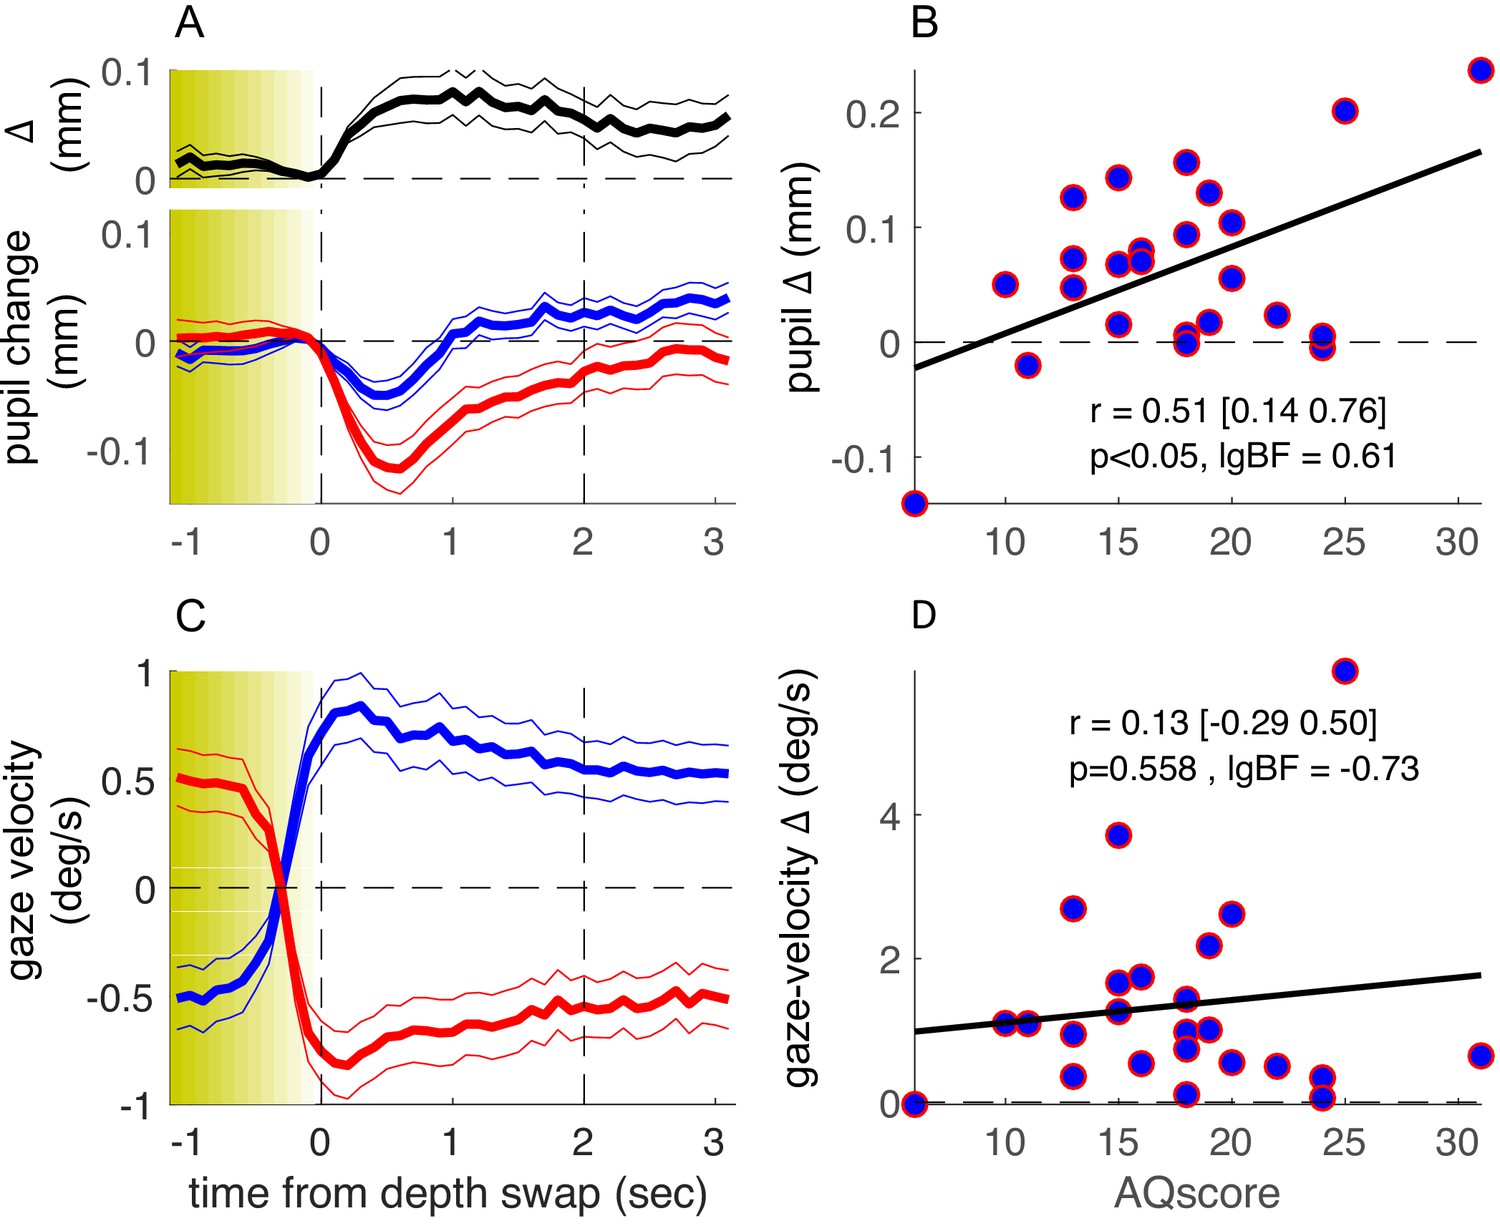
Same as in Figure 2 but showing results from a no-report version of the experiment, in which 24 of the original participants took part. lgBF: base-10 logarithm of the Bayes Factor .
Figure 3—figure supplement 1
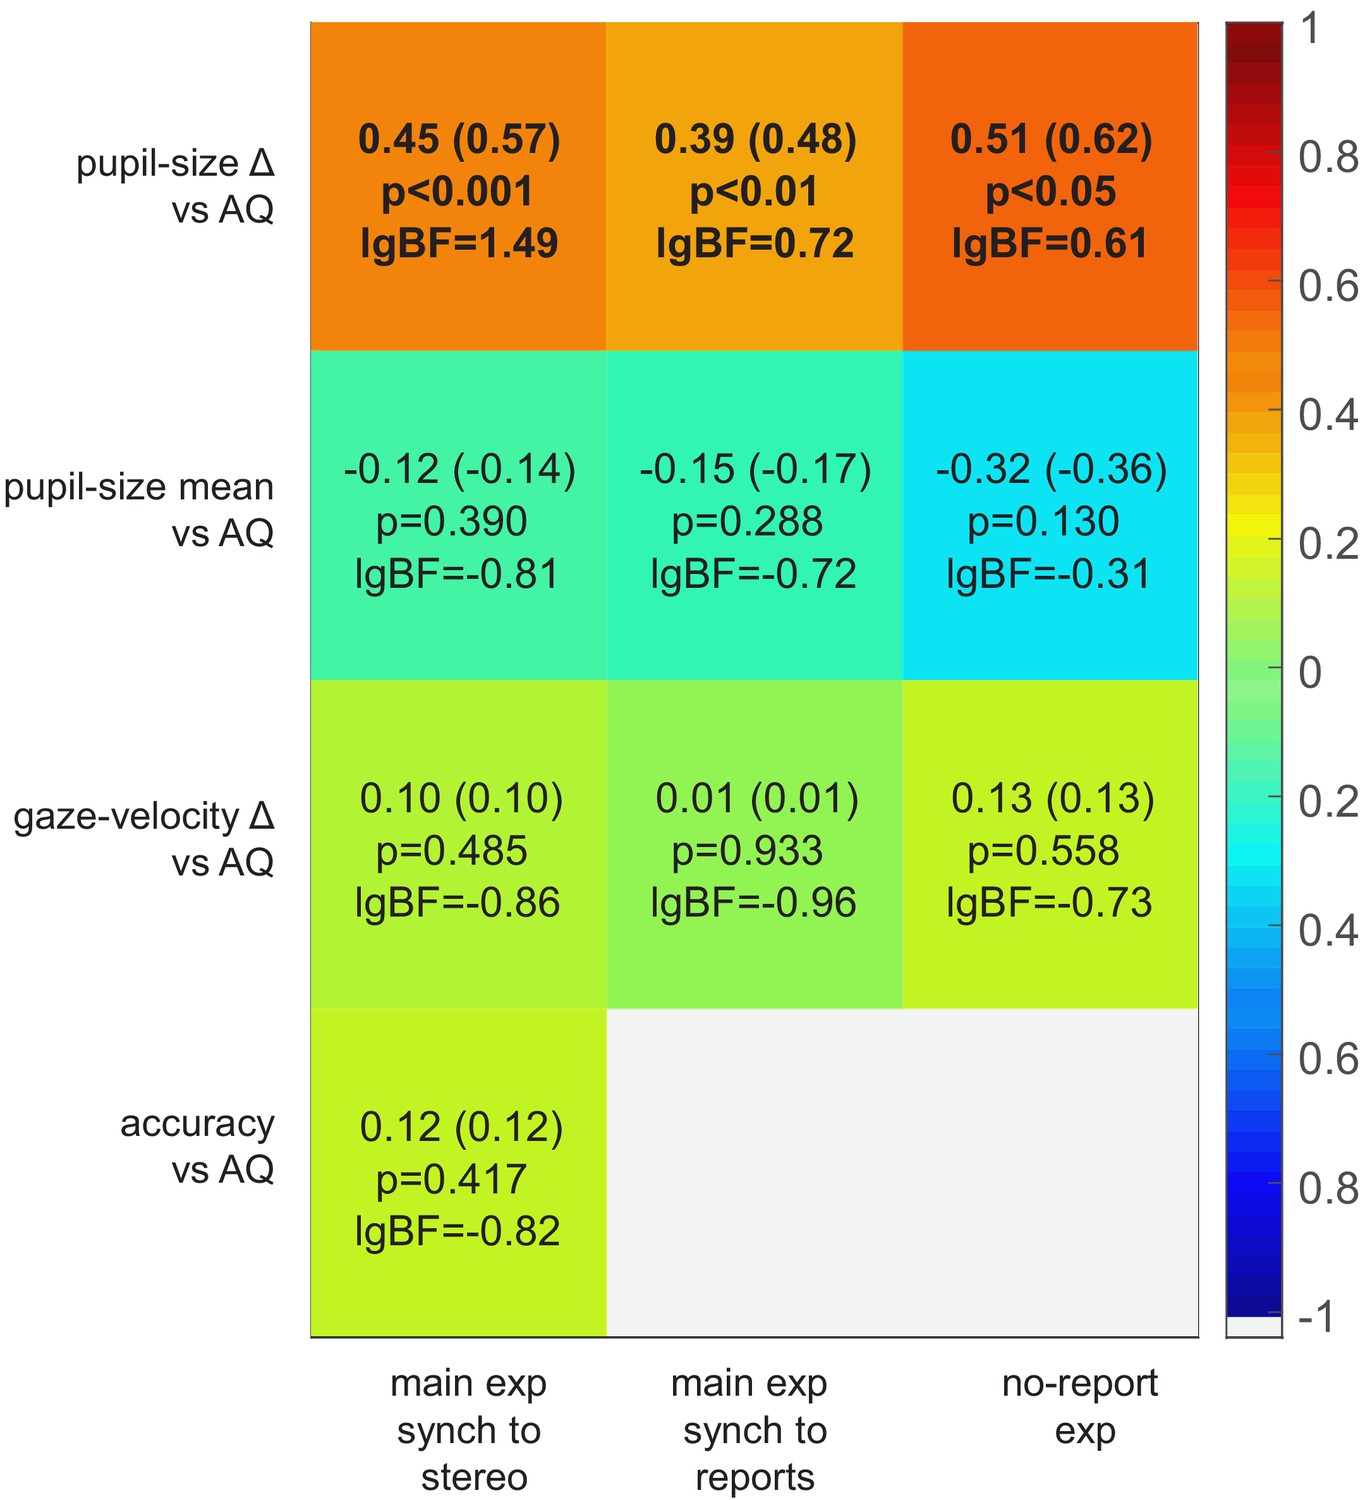
Summary of the Autism-Spectrum Quotient (AQ) correlations.
Correlation matrix between AQ and the four main parameters collected in the main experiment (and analyzed after synchronizing traces to changes in stimulus depth or perceptual reports, left and middle column, respectively), and in the no-report experiment (right). The colormap shows the correlation coefficients, also displayed as text in each cell, accompanied with p-values and base-10 logarithm of the Bayes Factors (lgBFs); text in each cell additionally gives disattenuated correlations (values in parenthesis), computed with the Spearman-Brown formula (Spearman, 1910) taking into account the split-half reliability of each parameter, and the test-retest reliability of the AQ score (Hoekstra et al., 2008).
Figure 4
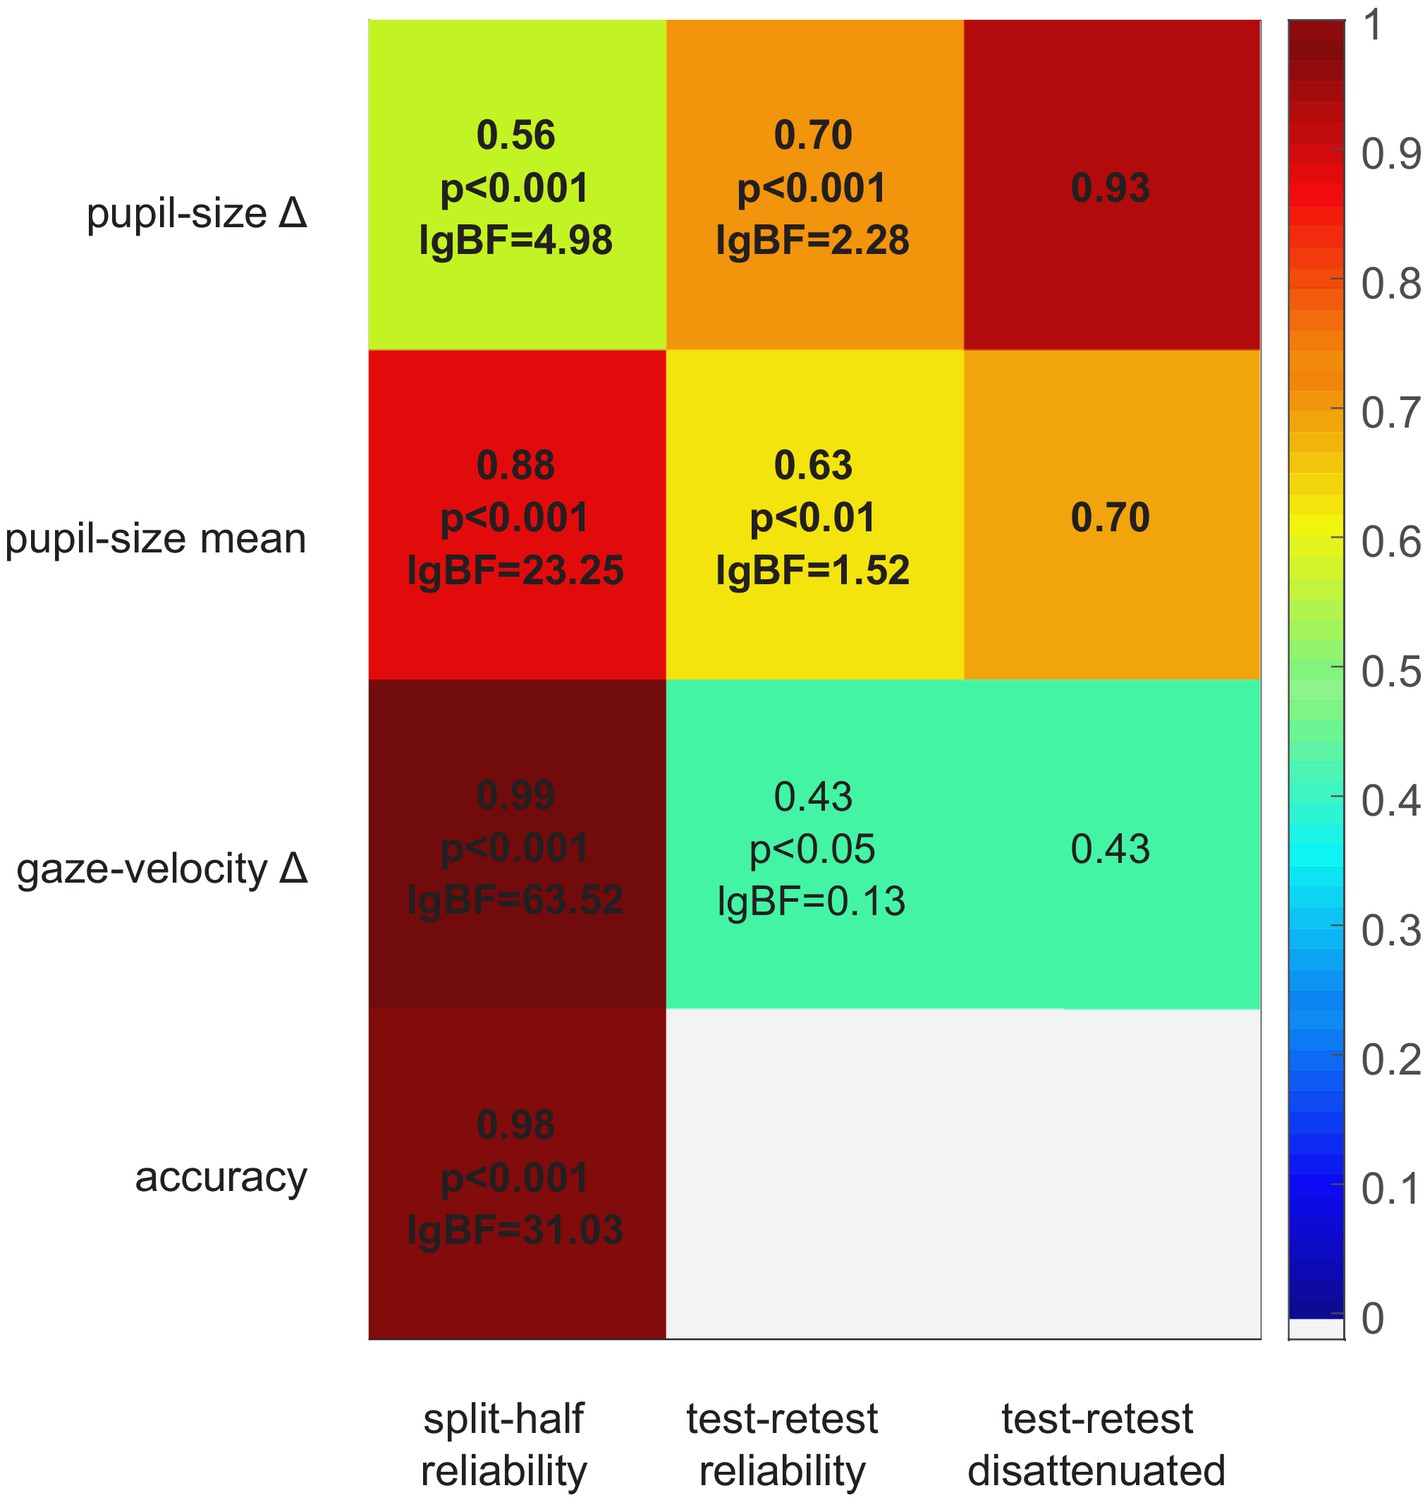
Split-half and test-retest reliability.
Split-half reliability (computed as the Pearson’s correlation coefficient of parameters computed from the odd and even trials, across participants and experiments), test-retest reliability (Pearson’s correlation coefficient of parameters computed in the main and no-report experiment, across the 24 participants who took part in both), and disattenuated test-retest reliabilities (computed with the Spearman-Brown formula [Spearman, 1910] taking into account the split-half reliability of each parameter in each experiment).
Additional files
Download links
A two-part list of links to download the article, or parts of the article, in various formats.
Downloads (link to download the article as PDF)
Open citations (links to open the citations from this article in various online reference manager services)
Cite this article (links to download the citations from this article in formats compatible with various reference manager tools)
Objective pupillometry shows that perceptual styles covary with autistic-like personality traits
eLife 10:e67185.
https://doi.org/10.7554/eLife.67185


