Young domestic chicks spontaneously represent the absence of objects
- Department of Cognitive Science, Central European University, Austria
- Department of Life Sciences, University of Trieste, Italy
- School of Biological and Behavioural Sciences, Department of Biological and Experimental Psychology, Queen Mary University of London, United Kingdom
- Department of Psychological Sciences, Birkbeck, University of London, United Kingdom
- Center for Mind/Brain Sciences, University of Trento, Italy
Figures
Figure 1
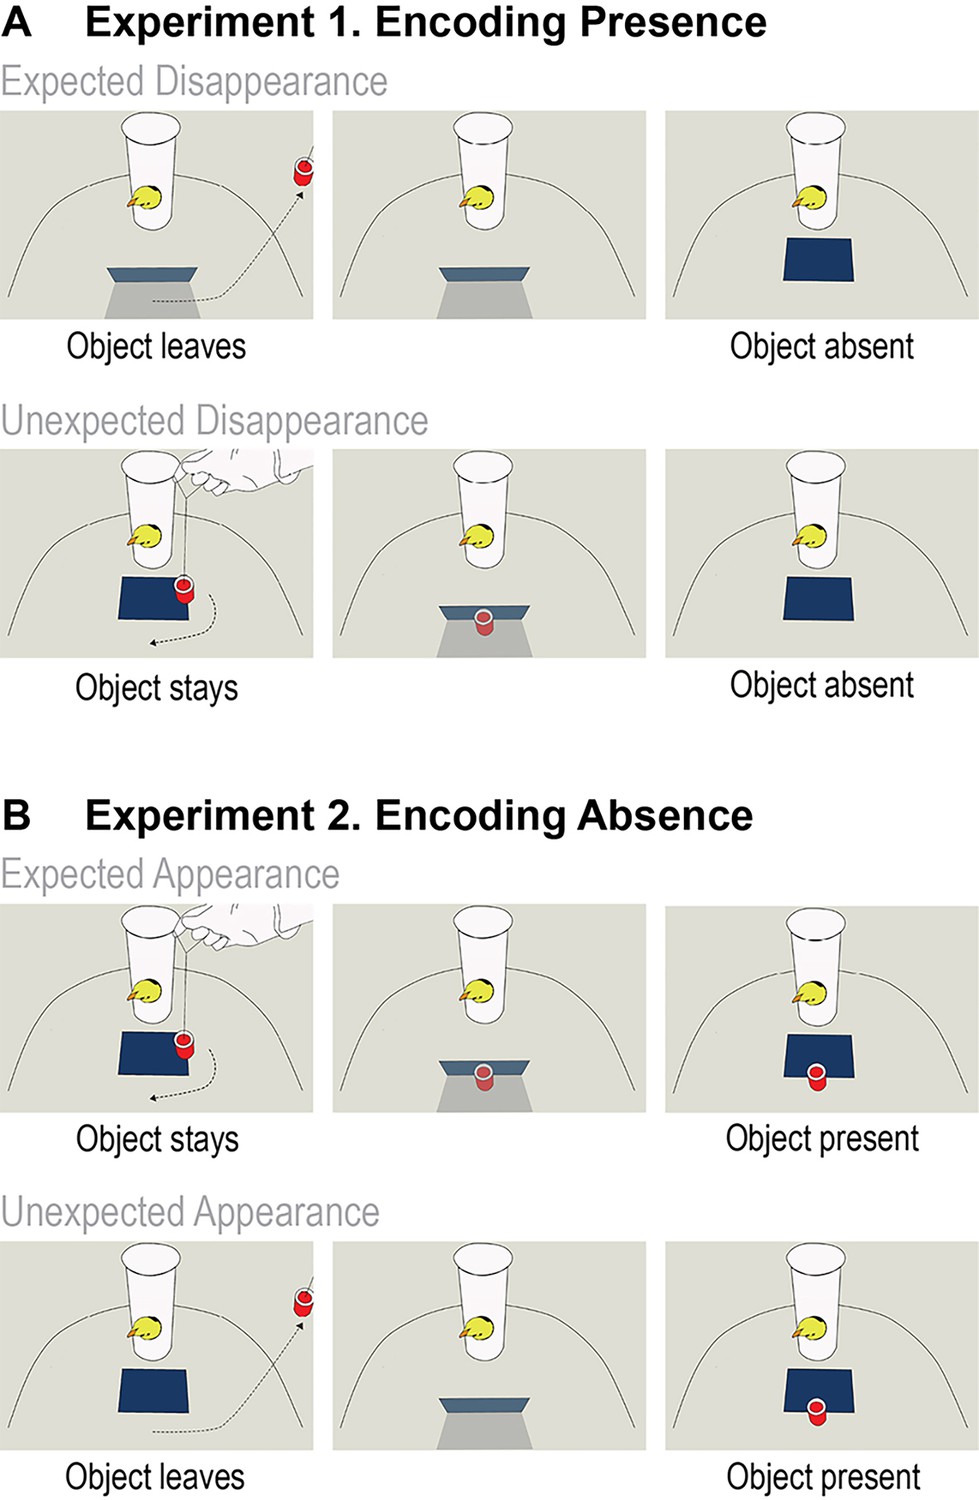
Schematic illustration of the events in Experiments 1 and 2.
(A) Experiment 1 – Encoding Presence. The upper panels depict the events in the Expected Disappearance condition, where the target object was removed from the arena before the screen was lowered revealing the empty space behind it. The lower panels depict the events in the Unexpected Disappearance condition, where the target object was placed behind the screen visibly to the chick but then it was secretly removed from the arena. When the screen was lowered, it revealed the empty space behind. (B) Experiment 2 – Encoding Absence. The upper panels depict the events in the Expected Appearance condition, where the target object moved behind the screen and when the screen was lowered, it revealed the presence of the object. The lower panels depict the Unexpected Appearance condition, in which the target object was visibly removed from the arena, and then the vertical position of the screen was restored. Afterwards, the target object was secretly reintroduced into the arena, and when the screen was lowered, it revealed the target object.
Figure 2
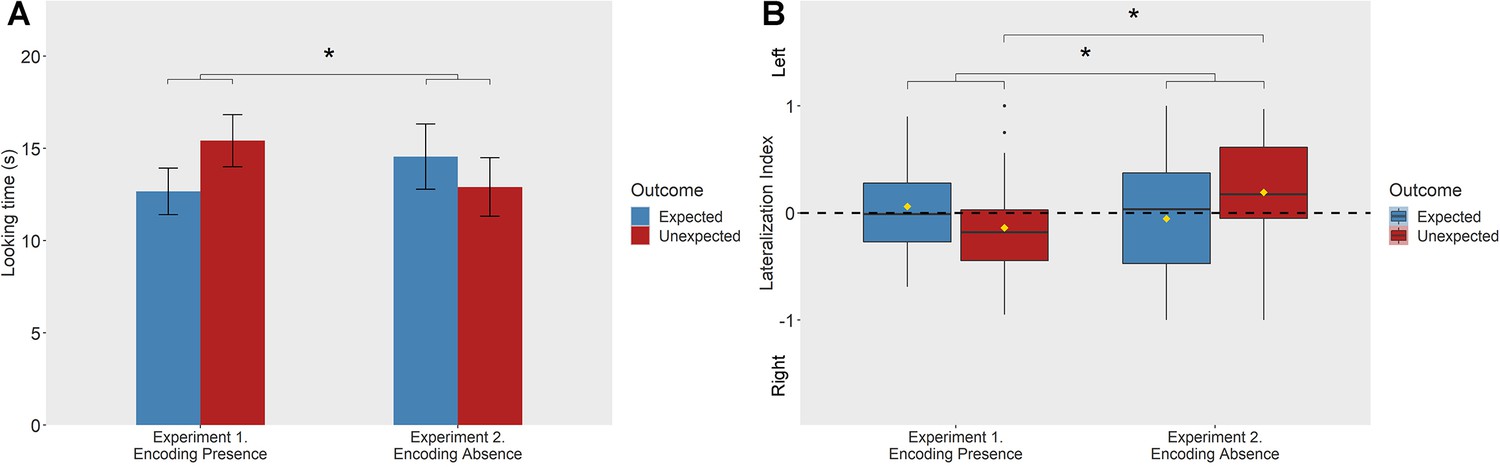
Results of Experiments 1 and 2.
(A) Mean Looking Times elicited by Expected and Unexpected outcomes in the two experiments. The asterisk indicates a significant interaction between Outcome (Expected/Unexpected) and Experiment (F1,51 = 4.244, p = 0.045) and a significantly higher looking time observed for the Unexpected outcome in Experiment 1 (Encoding Absence) than in Experiment 2 (Encoding Presence) (Scheffé test, p = 0.028). Error bars represent standard error of the mean. (B) Lateralization Index as a function of Experiment and types of outcome. Asterisks indicate a significant interaction between Outcome (Expected/Unexpected) and Experiment (F1,51 = 4.652, p = 0.036) and a significantly higher left-eye bias observed for the Unexpected outcome in Experiment 2 (Encoding Absence) than in Experiment 1 (Encoding Presence) (Scheffé test, p = 0.023), suggesting that the Lateralization Index is sensitive to violations of expectation regarding the absence of objects. For box plots, the horizontal line represents the median, yellow diamonds depict the mean values, box height depicts first and third quartiles, and vertical lines represent the 95th percentile. Dots represent the outliers of the data set.
Figure 3
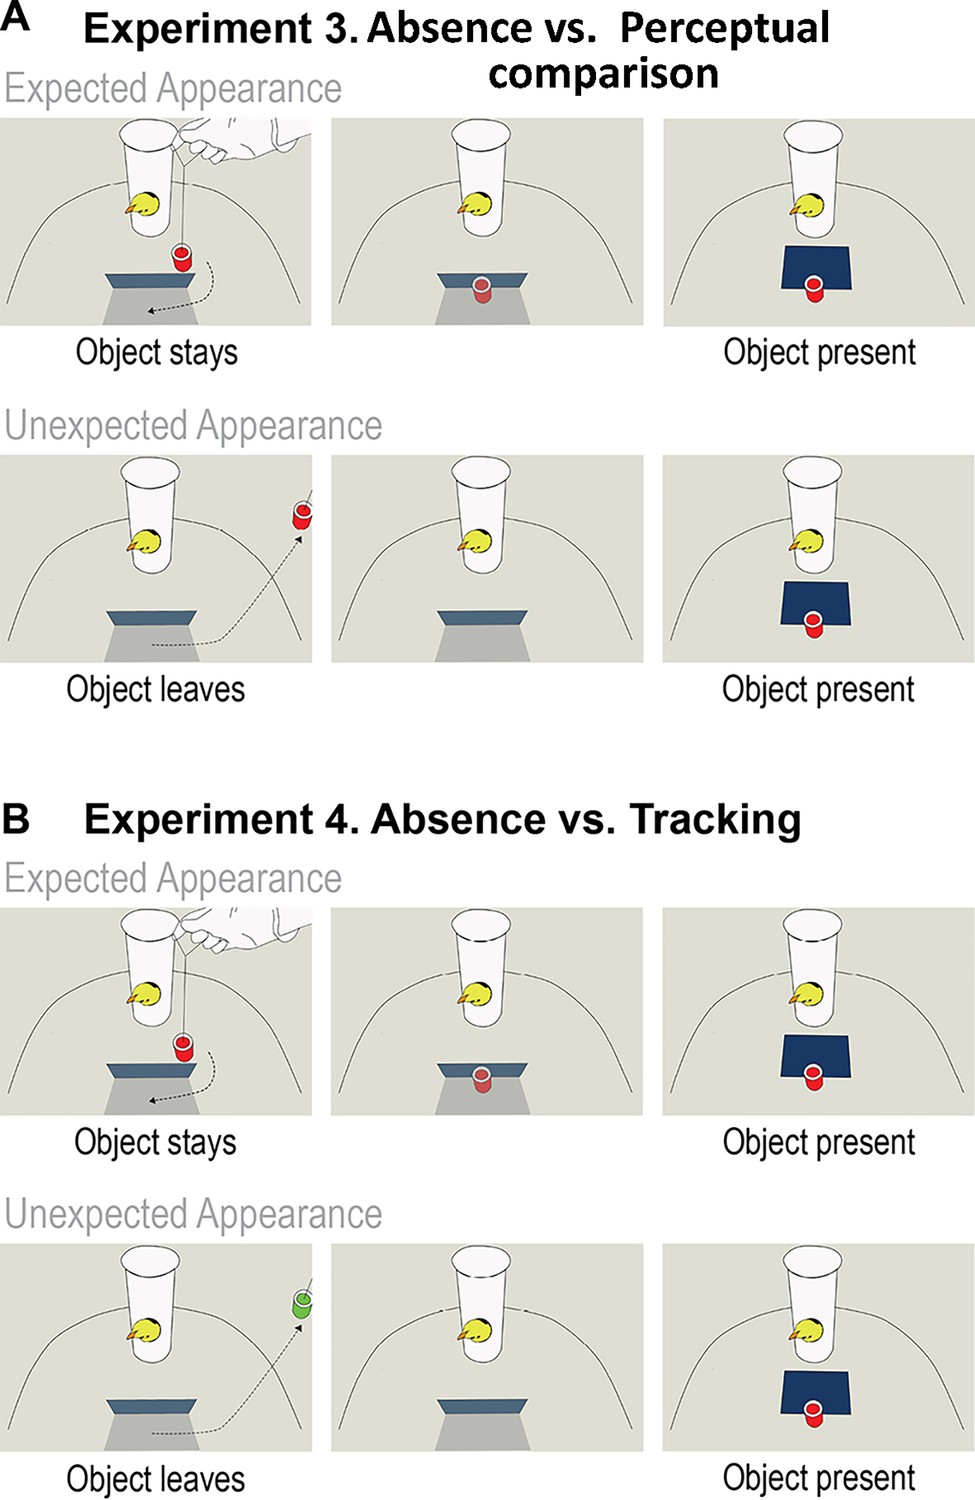
Schematic illustration of the events in Experiments 3 and 4.
(A) Experiment 3 – Absence vs. Perceptual Comparison. The upper panels depict the event in the Expected Appearance condition, where the target object moved behind the screen and when the screen was lowered, it revealed the object behind. The lower panels depict the events in the Unexpected Appearance condition, in which the object first moved behind the screen and then it was visibly removed from the arena. Afterwards, the object was secretly placed behind the screen and when the screen was lowered, it revealed the object. Note that, in both conditions, the screen’s initial position was vertical. (B) Experiment 4 – Tracking vs. Absence. The upper panels depict the events in the Expected Appearance condition, which was identical to the same condition of Experiment 3. The lower panels depict the Unexpected Appearance condition where the (green) target object first moved behind the screen and then it was visibly removed from the arena. Afterwards, the red object was secretly reintroduced behind the screen. In the outcome phase, the screen was lowered and the red object appeared.
Figure 4
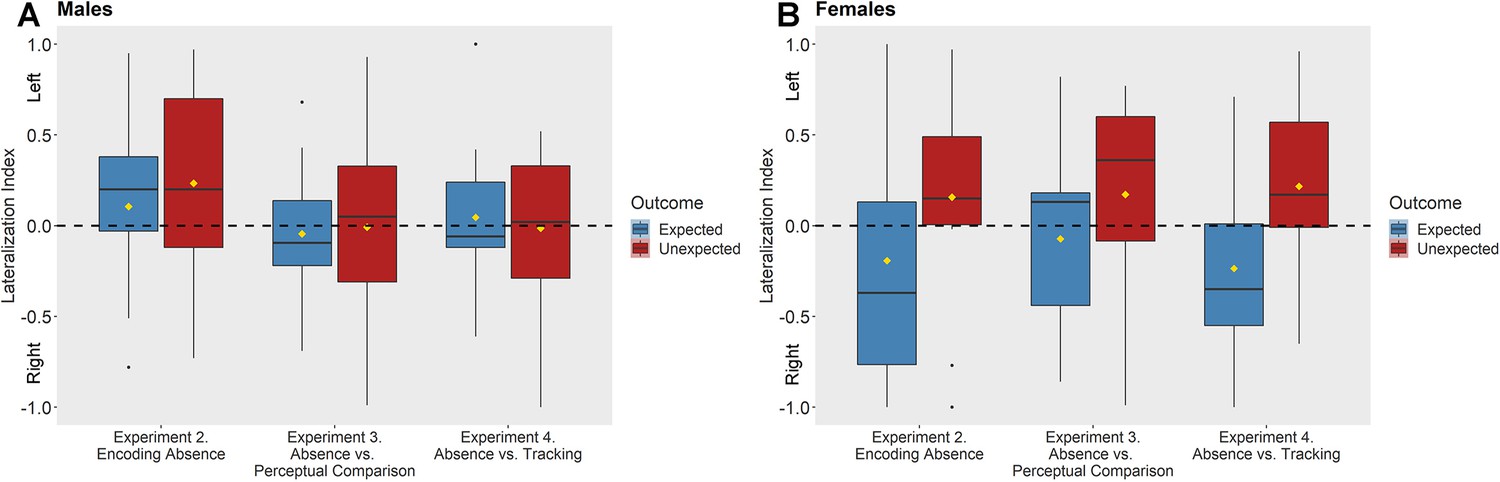
Results of Experiments 2–4.
(A) Mean Lateralization Index elicited by Expected and Unexpected outcomes for male chicks. (B) Mean Lateralization Index elicited by Expected and Unexpected outcomes for female chicks. An 3 × 2 × 2 analysis of variance (ANOVA) revealed a main effect of Outcome (F1, 75 = 6.273, p = 0.014), reflecting higher level of left-eye bias for the Unexpected compared to the Expected outcome and a significant interaction between Outcome and Sex (F1, 75 = 4.157, p = 0.045) indicating females’ more pronounced differentiations between the outcomes. The horizontal line is the median, yellow diamonds depict the mean values, box height depicts first and third quartiles, and vertical lines represent the 95th percentile. Dots represent the outliers of the data set.
Videos
Video 1
Test events in Experiment 1 (Encoding Presence).
The chick is presented with the Expected and Unexpected Disappearance of the imprinting object (example video from the test set).
Video 2
Test events in Experiment 2 (Encoding Absence).
The chick is presented with the expected and unexpected appearance of the imprinting object (example video from the test set).
Video 3
Test events in Experiment 3 (Absence vs. Perceptual Comparison).
The chick is presented with the expected and unexpected appearance of the imprinting object (example video from the test set).
Video 4
Test events in Experiment 4 (Absence vs. Tracking).
The chick is presented with the expected and unexpected appearance of the imprinting object (example video from the test set).
Additional files
-
Transparent reporting form
- https://cdn.elifesciences.org/articles/67208/elife-67208-transrepform1-v1.pdf
-
Supplementary file 1
Looking time data in Experiment 1-4.
- https://cdn.elifesciences.org/articles/67208/elife-67208-supp1-v1.docx
Download links
A two-part list of links to download the article, or parts of the article, in various formats.
Downloads (link to download the article as PDF)
Open citations (links to open the citations from this article in various online reference manager services)
Cite this article (links to download the citations from this article in formats compatible with various reference manager tools)
Young domestic chicks spontaneously represent the absence of objects
eLife 11:e67208.
https://doi.org/10.7554/eLife.67208


