Single-cell-level protein analysis revealing the roles of autoantigen-reactive B lymphocytes in autoimmune disease and the murine model
- Department of Dermatology, The University of Tokyo Graduate School of Medicine, Japan
- Laboratory of Radiology and Biomedical Engineering, The University of Tokyo Graduate School of Medicine, Japan
- Department of System Design Engineering, Keio university, Faculty of Science and technology, Japan
- Department of Applied Chemistry, The University of Tokyo Graduate School of Engineering, Japan
- Department of Mechanical Engineering, The University of Tokyo Graduate School of Engineering, Japan
Figures
Figure 1 with 1 supplement
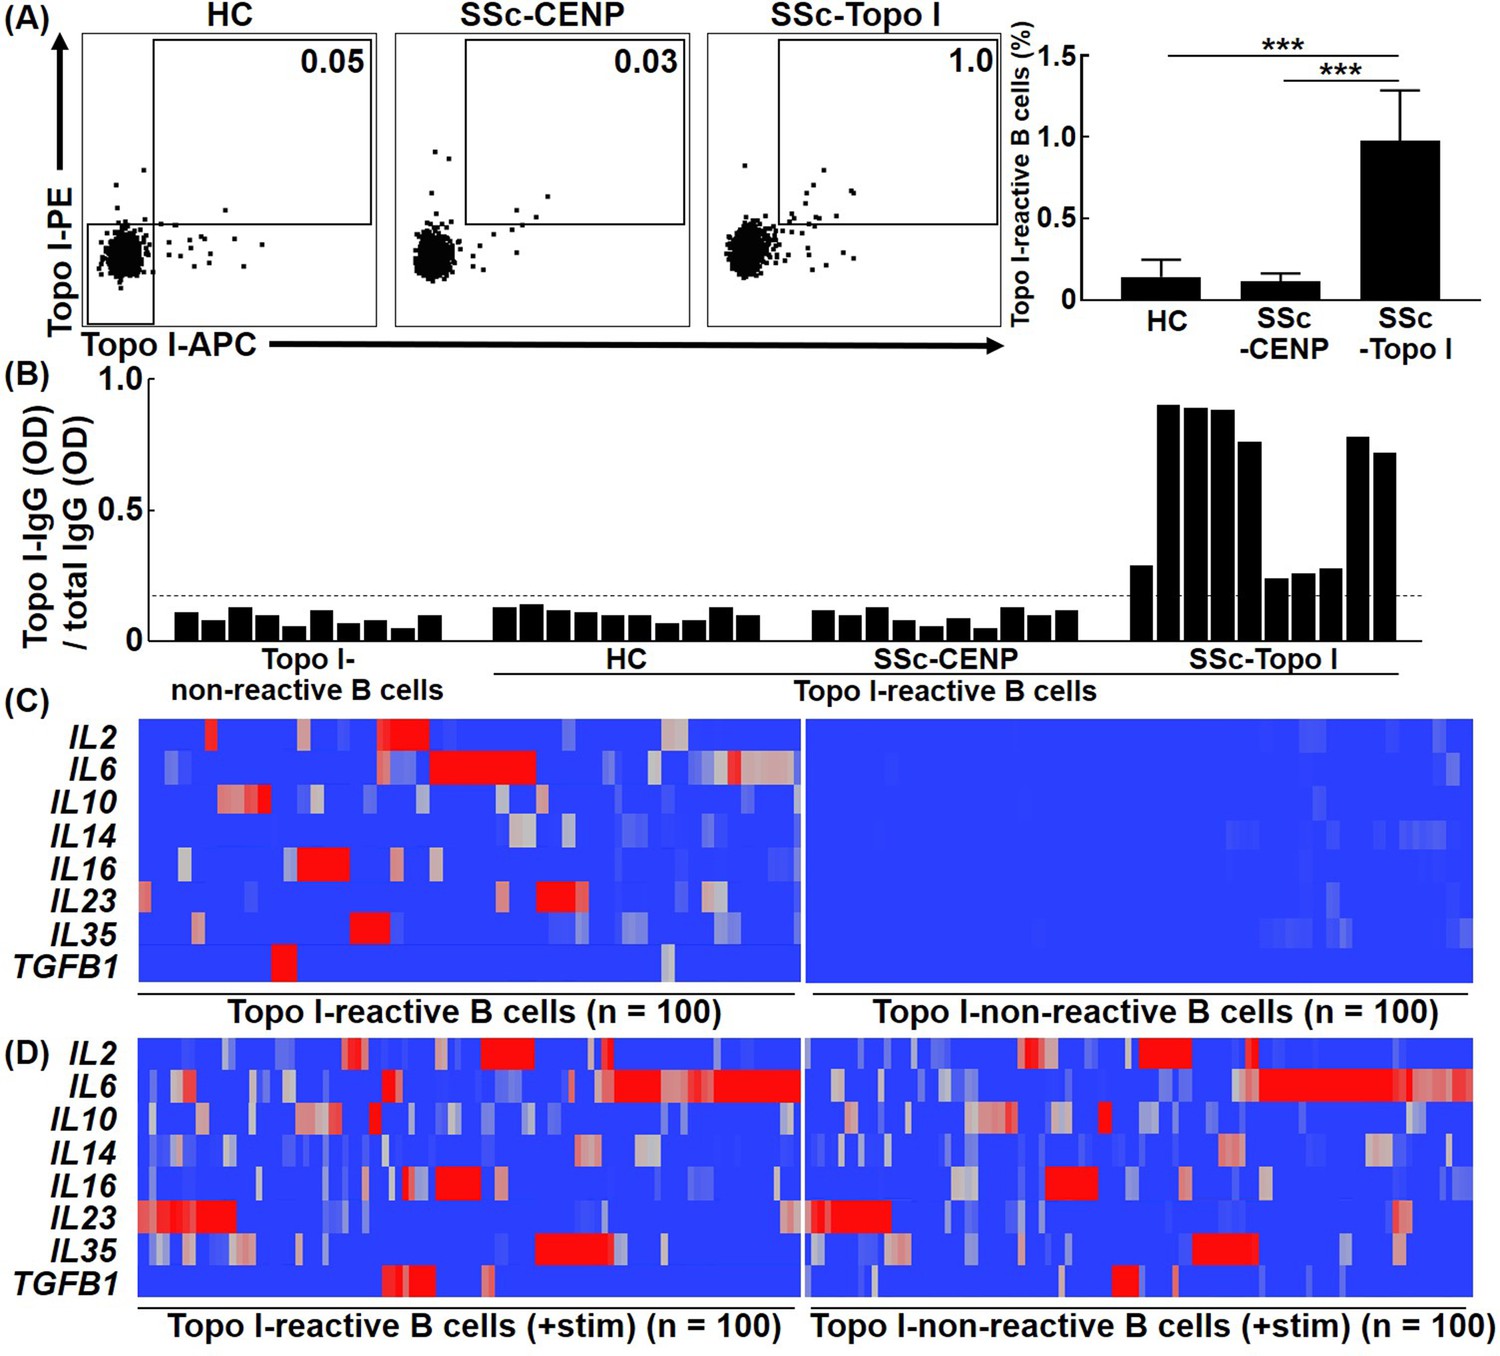
Frequencies and cytokine production ability of topo I-reactive B cells in systemic sclerosis (SSc) patients.
(A) Frequencies of topo I-reactive cells in CD27+ CD19+ cells obtained from the peripheral blood of 50 healthy controls (HC), 50 anti-CENP antibody-positive SSc patients, and 111 anti-topo I antibody-positive SSc patients were examined with flow cytometric analysis. Topo I-PE+ topo I-APC+ cells were identified as topo I-reactive B cells. Topo I-PE- topo I-APC- cells were used as topo I-non-reactive B cells in the following experiments. The bar graphs show the mean + SD. ***p<0.005. (B) Topo I-reactive B cells were isolated using a cell sorter and subjected to single-cell culture for 48 hr. Subsequently, levels of IgG anti-topo I antibody and total IgG in the supernatant were measured using the μELISA system. The IgG anti-topo I antibody titer produced by each B cell was determined by dividing the IgG anti-topo I antibody OD value by the total IgG OD value. Data for 10 cells in each group are represented. The dotted line represents IgG anti-topo I antibodies with an average titer of +6 SD. (C) Real-time-RT-PCR for cytokines was performed at the single-cell level using topo I-reactive B cells and topo I-non-reactive B cells, 100 each, obtained from anti-topo I antibody-positive SSc patients, and is shown in the heatmap. The color of the hea map indicates the degree of mRNA expressions, which are higher as the color of the heatmap changes from blue to red. (D) Upon stimulation with PMA and ionomycin, both topoI-reactive CD27+ B cells and topo I-non-reactive CD27+ B cells produced a variety of cytokines and showed similar cytokine profiles.
-
Figure 1—source data 1
Source file for frequencies and cytokine production ability of topo I-reactive B cells in systemic sclerosis (SSc) patients.
This archive contains all data used for the quantitative analysis shown in Figure 1.
- https://cdn.elifesciences.org/articles/67209/elife-67209-fig1-data1-v1.xlsx
Figure 1—figure supplement 1
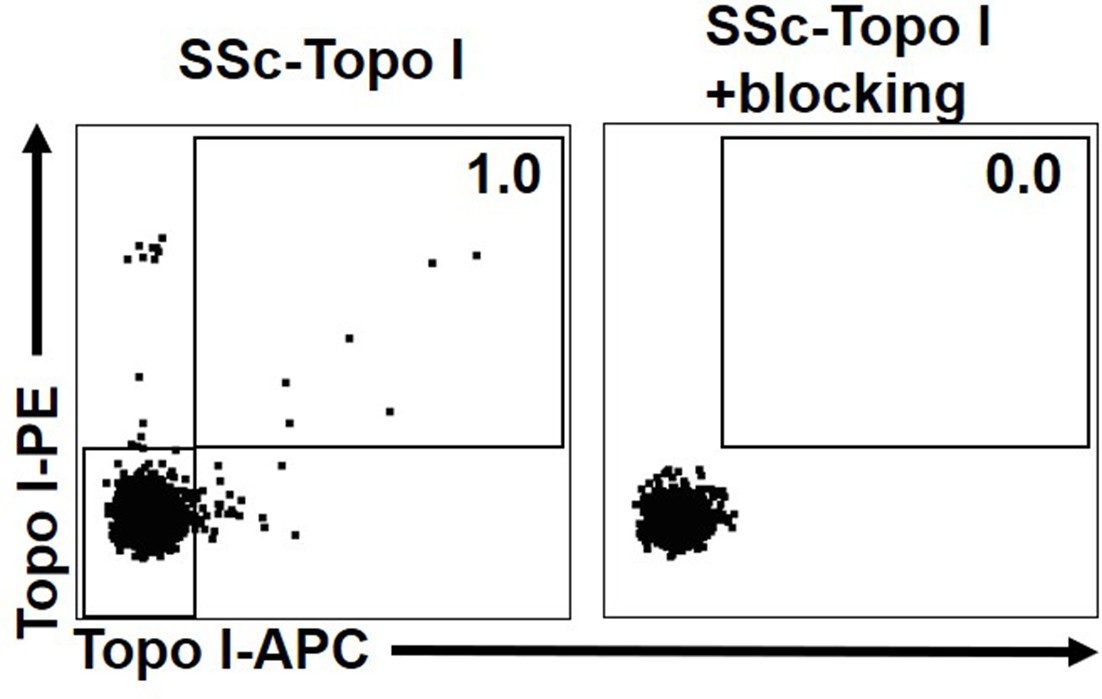
Blocking effect of topo I to frequencies of topo I-reactive B cells in anti-topo I antibody-positive systemic sclerosis (SSc) patients.
Topo I-reactive B cells in CD27+CD19+ cells obtained from anti-topo I antibody-positive SSc patients were flow cytometric pre-blocked with excess topo I.
Figure 2 with 3 supplements
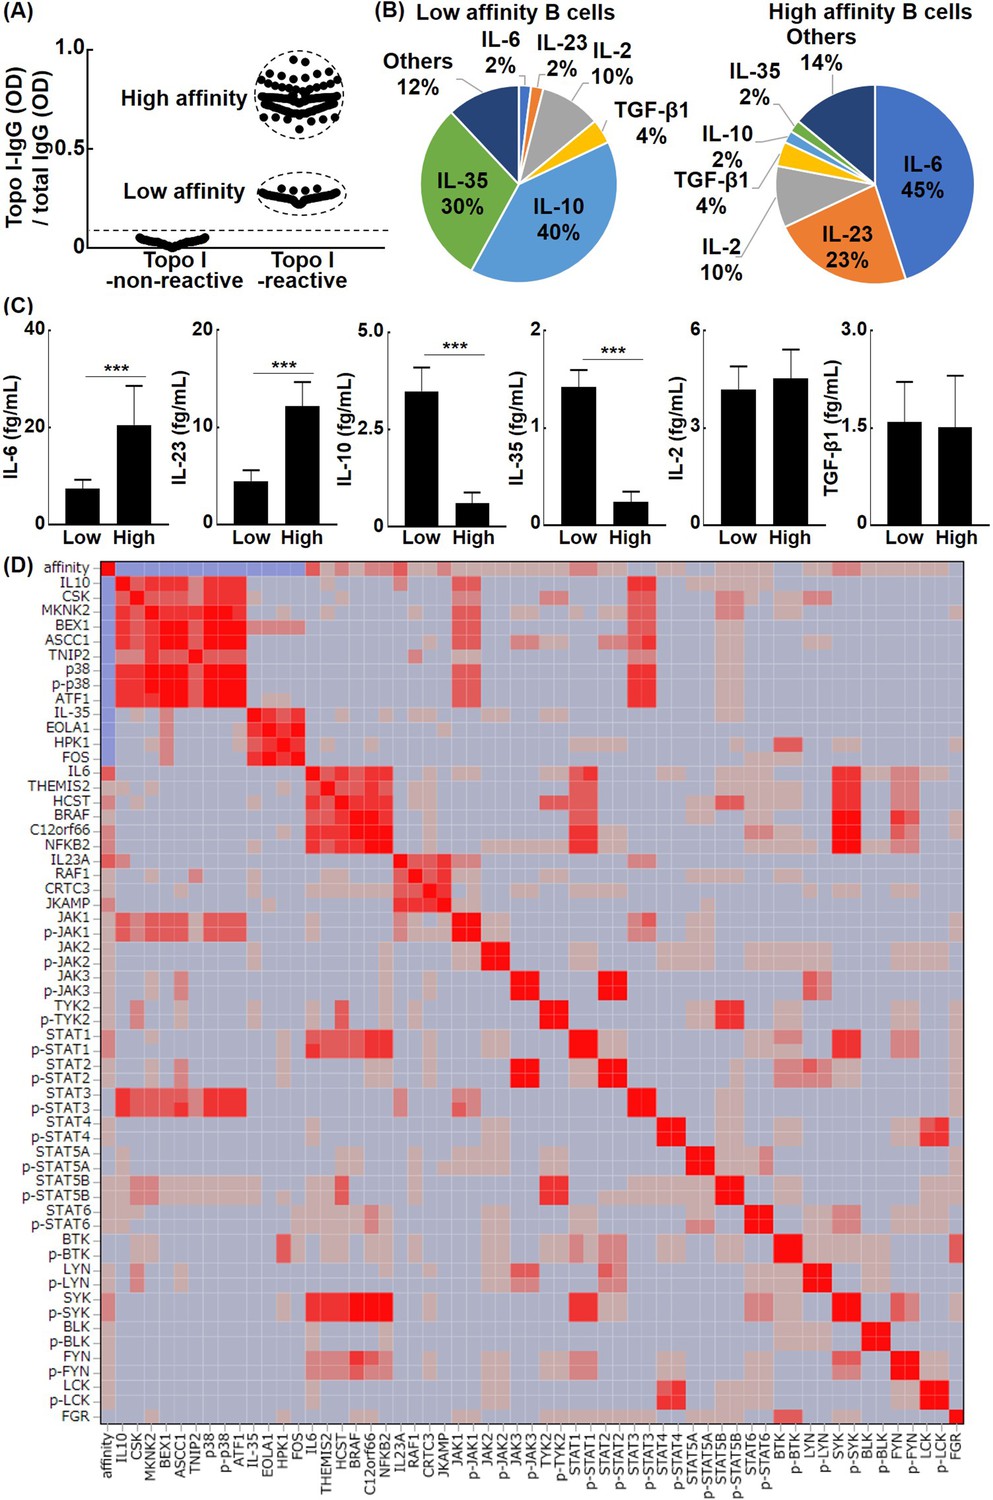
The relationship between the affinity for topo I in topo I-reactive B cells and their ability to produce cytokines in systemic sclerosis (SSc) patients.
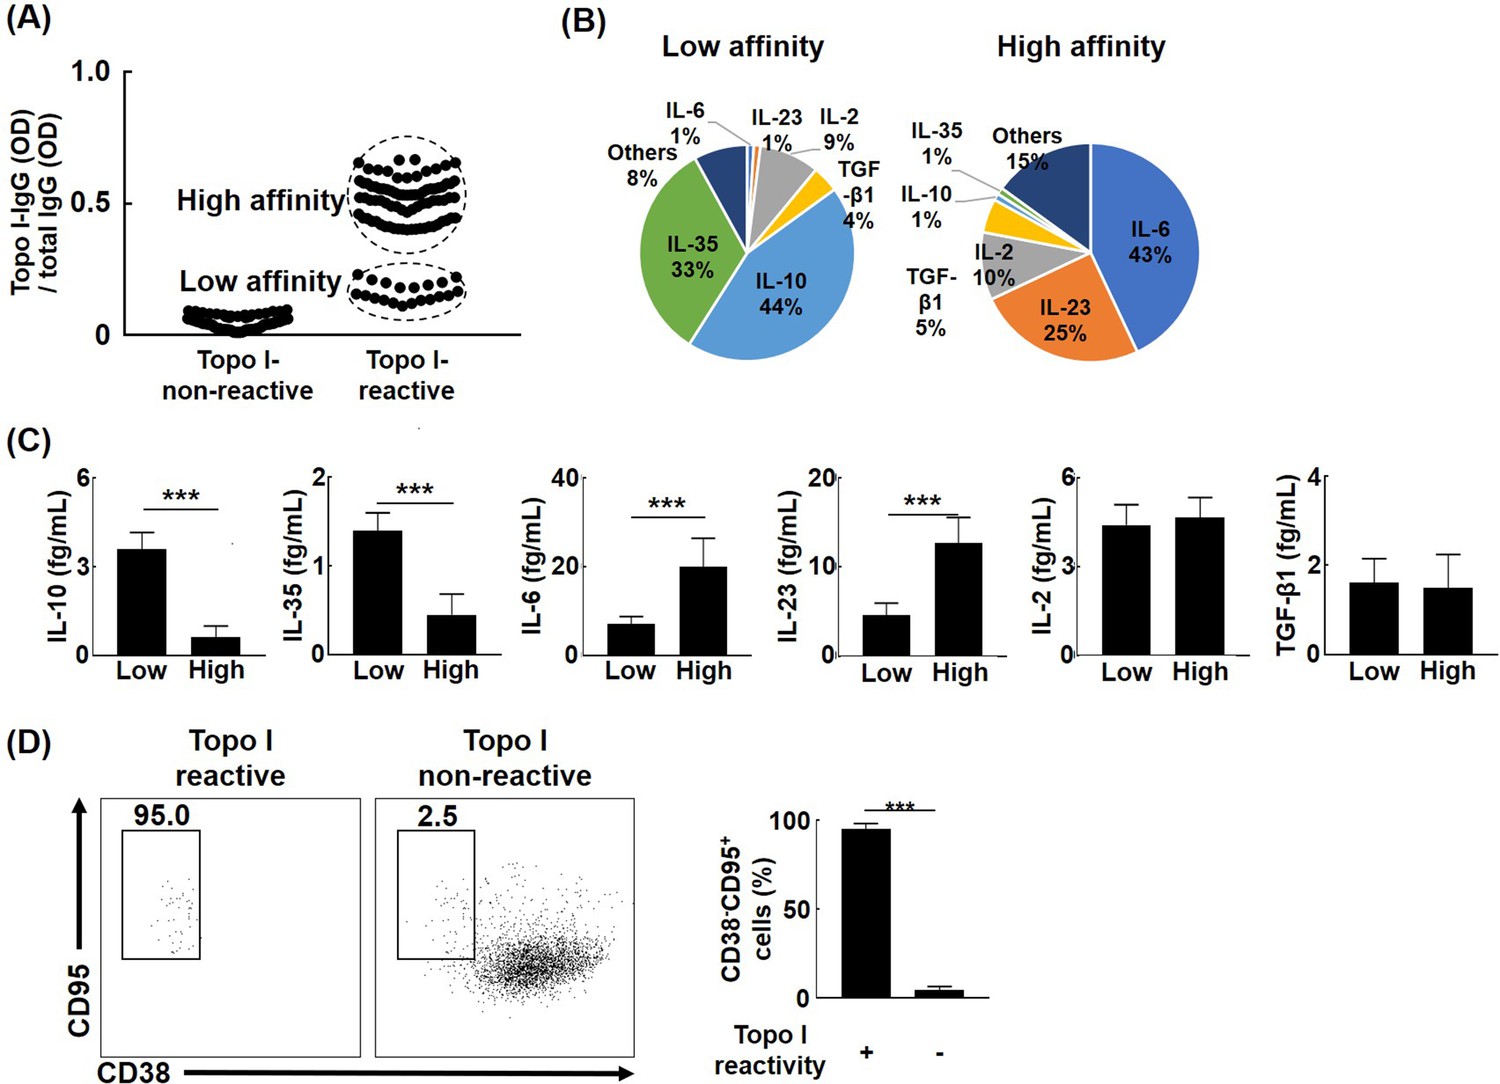
(A) Topo I-non-reactive B cells and topo I-reactive B cells were isolated from the peripheral blood of anti-topo I antibody-positive SSc patients, and topo I titers were measured at the single B cell level. Topo I-reactive B cells were divided into two groups: B cells with low or high affinity for topo I. (B) The frequency of B cells producing each cytokine is represented in the pie charts. (C) The amount of each cytokine produced by these cytokine-producing B cells was measured. For these experiments, each of the 300 topo I-reactive B cells and topo I-non-reactive B cells from 111 anti-topo I antibody-positive SSc patients were used. (D) Affinity for topo I, cytokines, and intracellular proteins was analyzed at the single-cell level using topo I-reactive B cells, 100 each, obtained from anti-topo I antibody-positive SSc patients, and correlation heatmap is shown. µELISA was used to measure the cytokines, affinity, intracellular kinase, and phosphorylated kinase in each single cell. The color of the heatmap indicates the degree of correlations, which are higher as the color of the heatmap changes from blue to red. The bar graphs show the mean + SD. ***p<0.005.
-
Figure 2—source data 1
Source file for the relationship between the affinity for topo I in topo I-reactive B cells and their ability to produce cytokines in systemic sclerosis (SSc) patients.
This archive contains all data used for the quantitative analysis shown in Figure 2.
- https://cdn.elifesciences.org/articles/67209/elife-67209-fig2-data1-v1.xlsx
Figure 2—figure supplement 1
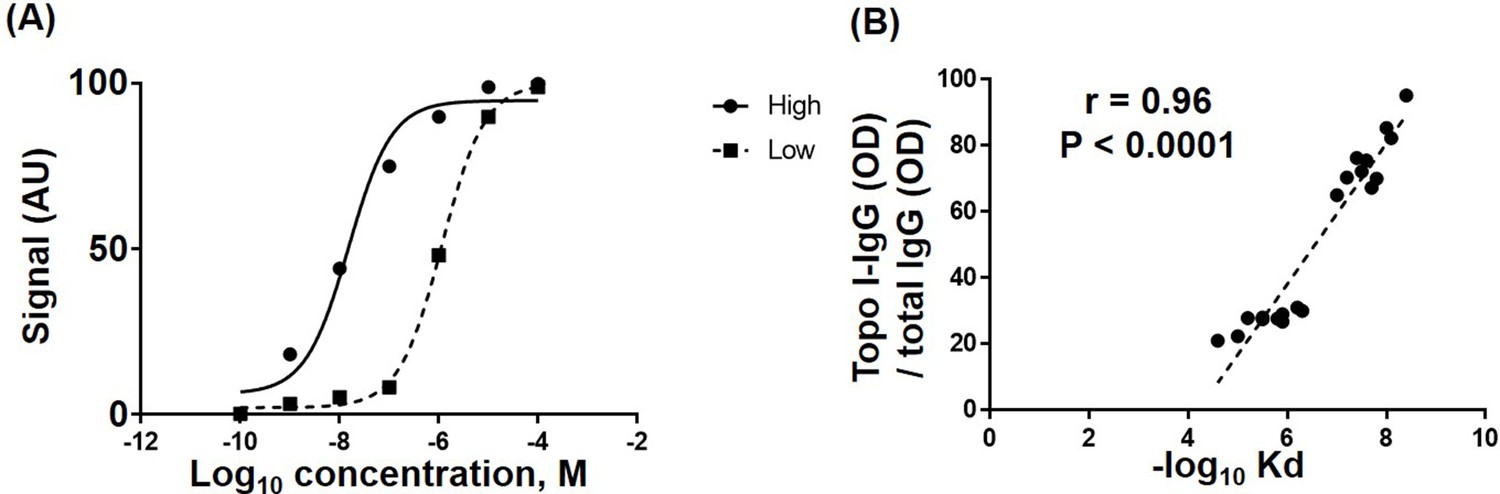
Affinity analysis and correlation of affinities for topo I in topo I-reactive B cells with topo I-IgG(OD)/total IgG(OD).
Topo I-non-reactive B cells and topo I-reactive B cells in CD19+CD27+ B cells were isolated from the peripheral blood of anti-topo I antibody-positive systemic sclerosis (SSc) patients, and topo I titers were measured at the single B cell level. Topo I-reactive B cells were divided into two groups: B cells with low or high affinity for topo I. Each affinity was analyzed and Kd value was calculated (n = 10, respectively) (A). Correlation of -log10 Kd and topo I-IgG(OD)/total IgG(OD) (B).
-
Figure 2—figure supplement 1—source data 1
Source file for affinity analysis and correlation of affinities for topo I in topo I-reactive B cells with topo I-IgG(OD)/total IgG(OD).
This archive contains all data used for the quantitative analysis shown in Figure 2—figure supplement 1.
- https://cdn.elifesciences.org/articles/67209/elife-67209-fig2-figsupp1-data1-v1.xlsx
Figure 2—figure supplement 2
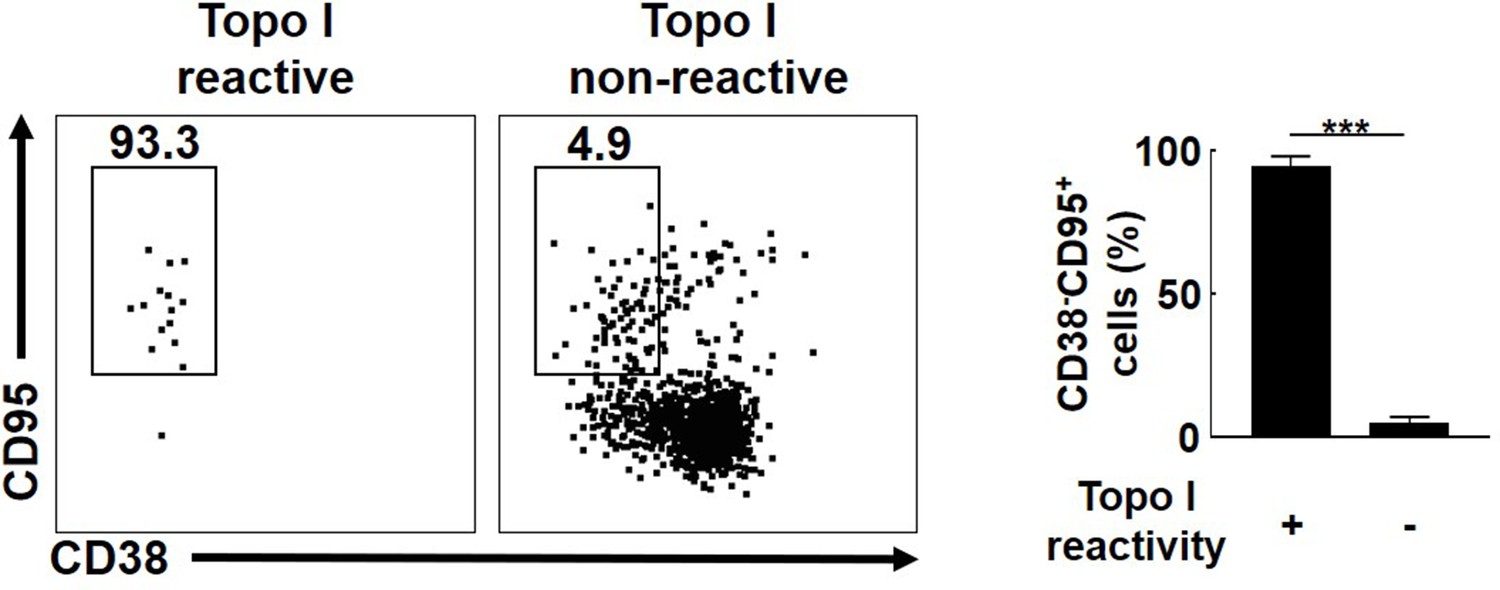
Frequencies of CD38-CD95+ cells in topo I-PE+Topo I-APC+CD19+CD27+ B cells in anti-topo I antibody-positive systemic sclerosis (SSc) patients.
Frequencies of CD38-CD95+ cells in topo I-PE+Topo I-APC+CD19+CD27+ B cells in anti-topo I antibody-positive SSc patients were analyzed by flow cytometry (n = 10). The bar graphs show the mean + SD. ***p<0.005.
-
Figure 2—figure supplement 2—source data 1
Source file for frequencies of CD38-CD95+ cells in topo I-PE+Topo I-APC+CD19+CD27+ B cells in anti-topo I antibody-positive systemic sclerosis (SSc) patients.
This archive contains all data used for the quantitative analysis shown in Figure 2—figure supplement 2.
- https://cdn.elifesciences.org/articles/67209/elife-67209-fig2-figsupp2-data1-v1.xlsx
Figure 2—figure supplement 3
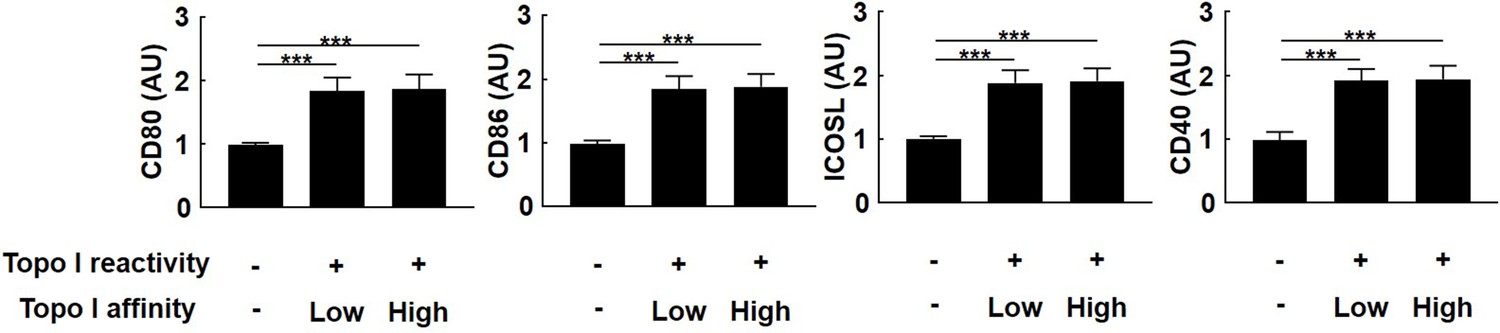
Expression of co-stimulatory molecules in topo I-PE+Topo I-APC+CD19+CD27+ B cells in anti-topo I antibody-positive systemic sclerosis (SSc) patients.
Expression of co-stimulatory molecules (CD80/86, ICOSL, and CD40) in topo I-non-reactive B cells and topo I-reactive B cells (topo I-PE+Topo I-APC+CD19+CD27+) with low or high affinity for topo I in anti-topo I antibody-positive SSc patients was analyzed by µELISA method (n = 10, respectively). The bar graphs show the mean + SD. ***p<0.005.
-
Figure 2—figure supplement 3—source data 1
Source file for expression of co-stimulatory molecules in topo I-PE+Topo I-APC+CD19+CD27+ B cells in anti-topo I antibody-positive systemic sclerosis (SSc) patients.
This archive contains all data used for the quantitative analysis shown in Figure 2—figure supplement 3.
- https://cdn.elifesciences.org/articles/67209/elife-67209-fig2-figsupp3-data1-v1.xlsx
Figure 3

Effects of topo I-reactive B cells on the differentiation of CD4+ T cells in systemic sclerosis (SSc) patients.
B cells with low affinity for topo I and those with high affinity for topo I as well as topo I-non-reactive B cells were obtained from anti-topo I antibody-positive SSc patients (n = 111). These B cells were co-cultured with CD4+ T cells. After 48 hr of co-culture, mRNA was extracted from these cells and FoxP3 and RORγt expression levels were examined by real-time RT-PCR. The results were presented when 96-well plates were used as a co-culture site (A) and when microculture plates (B) were used (C). These cells were further co-cultured on microculture plates, and the protein expression of CD4, CD20, FoxP3, and RORγt was confirmed by fluorescent cell staining and signal intensity was determined by ImageJ (D). Similarly, co-culture in microculture plates in the presence of anti-IL-10 (10 μg/ml), anti-IL-35 (5 μg/ml), anti-IL-6 (1 μg/ml), or anti-IL-23 (5 μg/ml) antibodies (Abs) was conducted, followed by fluorescent cell staining (E). These results represented seven experiments. The bar graphs show the mean + SD. Original magnification, ×1000. *p<0.05.
-
Figure 3—source data 1
Source file for the effects of topo I-reactive B cells on the differentiation of CD4+ T cells in systemic sclerosis (SSc) patients.
This archive contains all data used for the quantitative analysis shown in Figure 3.
- https://cdn.elifesciences.org/articles/67209/elife-67209-fig3-data1-v1.xlsx
Figure 4 with 1 supplement

The development of fibrosis and cytokine production by topo I-reactive B cells in the topo I-induced systemic sclerosis (SSc) model mice.
(A) Topo I-induced SSc model mice were generated by immunizing topo I up to four times every 2 weeks. At days 0, 14, and 56, mice were sacrificed and used for study as non-immunized, first immunized, and fourth immunized mice, respectively. Mice treated with phosphate-buffered saline (PBS) instead of topo I were used as controls. Six mice in each group were used. (B) Dermal thickness and lung fibrosis score, which reflect the extent of skin and lung fibrosis, respectively, were examined histologically using skin (original magnification, ×40) and lung tissues (×100). (C) Topo I-reactive B cells in splenic B cells from these mice were identified with flow cytometric analysis. Frequencies of topo I-reactive B cells in total B cells (D) and the IgG anti-topo I antibody titer in each of the topo I-reactive B cells (topo I) and topo I-non-reactive B cells (Ctrl) are shown (E). Each of the 100 topo I-reactive B cells isolated from mice immunized once and four times with topo I was analyzed. Frequencies of B cells producing cytokines (F) and the amount of produced cytokines are shown in the pie charts (G). The bar graphs show the mean + SD. *p<0.05, **p<0.01, ***p<0.005. †p<0.001 vs. each Ctrl.
-
Figure 4—source data 1
Source file for the development of fibrosis and cytokine production by topo I-reactive B cells in the topo I-induced systemic sclerosis (SSc) model mice.
This archive contains all data used for the quantitative analysis shown in Figure 4.
- https://cdn.elifesciences.org/articles/67209/elife-67209-fig4-data1-v1.xlsx
Figure 4—figure supplement 1
The relationship between the affinity for topo I in topo I-reactive B cells and their ability to produce cytokines in complete systemic sclerosis (SSc) model mice.
Topo I-induced complete SSc model (complete model) mice were generated by immunizing topo I for four times every 2 weeks. At day 56, mice were sacrificed and used for study as complete model mice. Six mice in each group were used. Topo I titers were measured at the single B cell level. Topo I-reactive B cells were also divided into two groups: B cells with low or high affinity for topo I (A). The frequency of B cells producing each cytokine is represented in the pie charts (B). The amount of each cytokine produced by these cytokine-producing B cells was measured. For these experiments, each of the 300 topo I-reactive B cells and topo I-non-reactive B cells from six complete model mice were used (C). Frequencies of CD38-CD95+ cells in topo I-PE+Topo I-APC+CD19+ B cells (n = 10) (D). The bar graphs show the mean + SD. ***p<0.005.
-
Figure 4—figure supplement 1—source data 1
Source file for the relationship between the affinity for topo I in topo I-reactive B cells and their ability to produce cytokines in complete systemic sclerosis (SSc) model mice.
This archive contains all data used for the quantitative analysis shown in Figure 4—figure supplement 1.
- https://cdn.elifesciences.org/articles/67209/elife-67209-fig4-figsupp1-data1-v1.xlsx
Figure 5
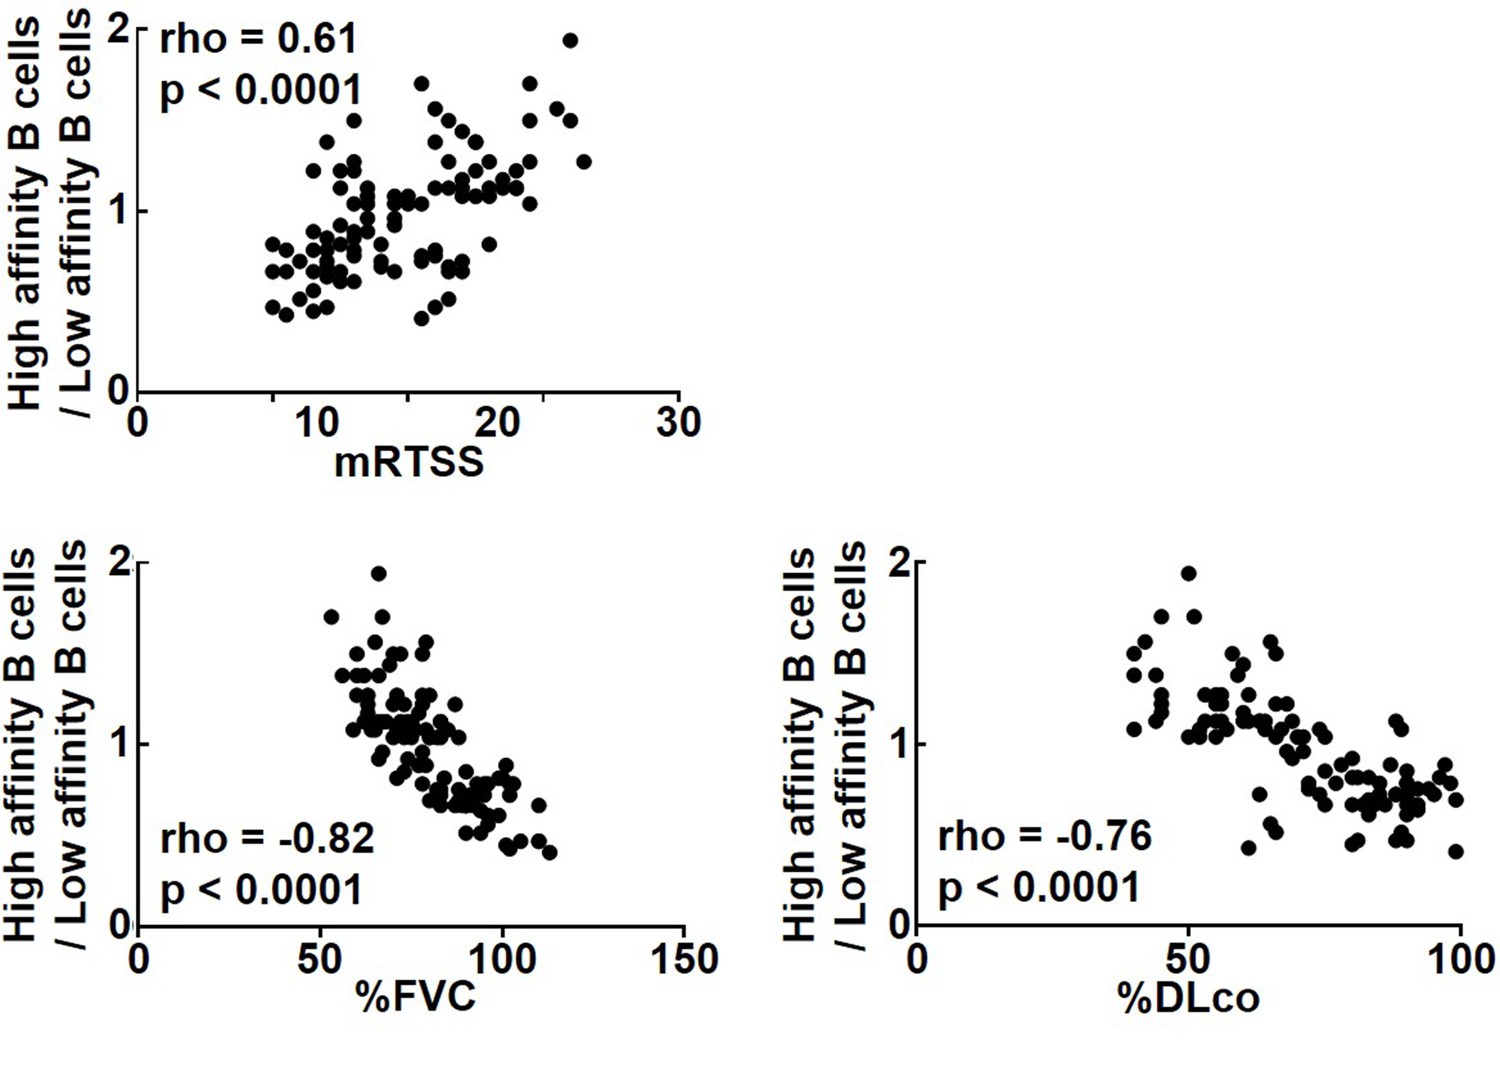
Correlation of affinities for topo I in topo I-reactive B cell with clinical parameters for skin and lung fibrosis in systemic sclerosis (SSc) patients.
In anti-topo I antibody-positive SSc patients (n = 111), the ratio of B cells with high affinity for topo I (high-affinity B cells) to B cells with low affinity for topo I (low-affinity B cells) was correlated with modified Rodnan total skin thickness score (mRTSS), percent predicted values of forced vital capacity (%FVC), and percent predicted values of diffusion capacity of the lung for carbon monoxide (%DLco).
-
Figure 5—source data 1
Source file for correlation of affinities for topo I in topo I-reactive B cell with clinical parameters for skin and lung fibrosis in systemic sclerosis (SSc) patients.
This archive contains all data used for the quantitative analysis shown in Figure 5.
- https://cdn.elifesciences.org/articles/67209/elife-67209-fig5-data1-v1.xlsx
Figure 6 with 2 supplements
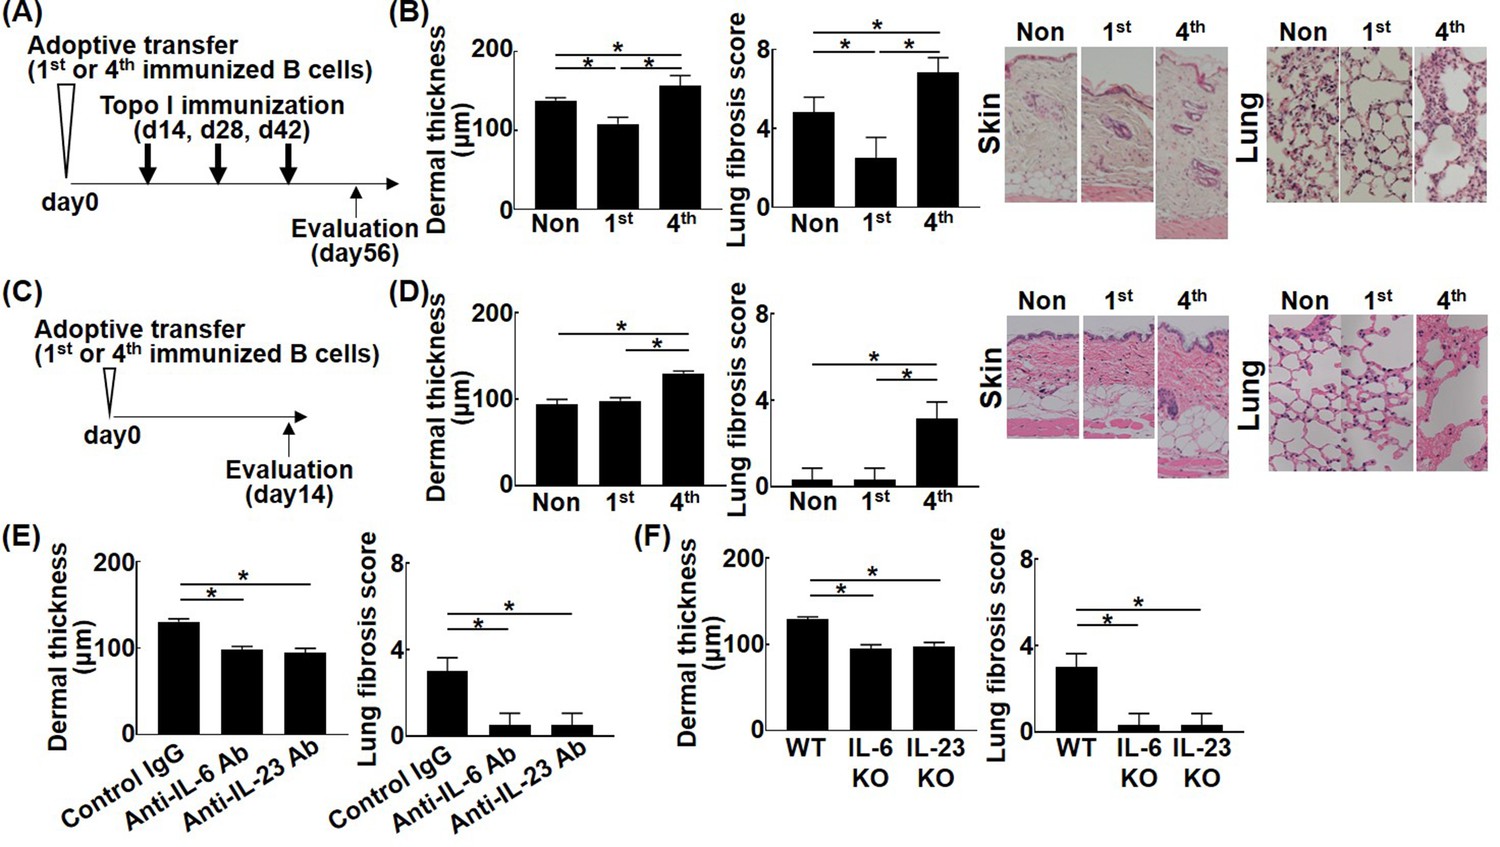
Effect of the affinity for topo I in topo I-reactive B cells on the development of fibrosis in the topo I-induced systemic sclerosis (SSc) model mice.
Topo I-reactive B cells (104 cells) from mice immunized once or four times with topo I were adoptively transferred into wild-type (WT) mice, and 14 days later, these WT mice were immunized with topo I three times every 2 weeks (A). 56 days after the adoptive transfer, the skin (original magnification, ×40) and lung tissues (×100) were obtained, and the dermal thickness and lung fibrosis score were examined histologically (B). Similarly, after 14 days of the adoptive transfer of topo I-reactive B cells (104 cells) from mice immunized once or four times with topo I into non-immunized WT mice (C), the dermal thickness and lung fibrosis score were measured (D). Serum anti-topo I antibody levels were elevated in both first and fourth models compared with non-immunized WT mice. Furthermore, topo I-reactive B cells were adoptively transferred with either anti-IL-6 (1 mg/week, administrated subcutaneously) or anti-IL-23 (100 μg/week, administrated subcutaneously) antibodies (Abs), and dermal thickness and lung fibrosis score were examined 14 days after the adoptive transfer (E). WT mice, IL-6-deficient (IL-6KO), and IL-23-deficient (IL-23KO) mice were immunized four times with topo I. Then, 104 cells of topo I-reactive B cells obtained were transferred to non-immunized WT mice, and the dermal thickness and lung fibrosis score were measured 14 days later. Serum anti-topo I antibody levels were elevated in both IL-6 KO mice and IL-23 KO mice compared with non-immunized WT mice (F). These results represented six experiments. The bar graphs show the mean + SD. *p<0.05.
-
Figure 6—source data 1
Source file for the effect of the affinity for topo I in topo I-reactive B cells on the development of fibrosis in the topo I-induced systemic sclerosis (SSc) model mice.
This archive contains all data used for the quantitative analysis shown in Figure 6.
- https://cdn.elifesciences.org/articles/67209/elife-67209-fig6-data1-v1.xlsx
Figure 6—figure supplement 1
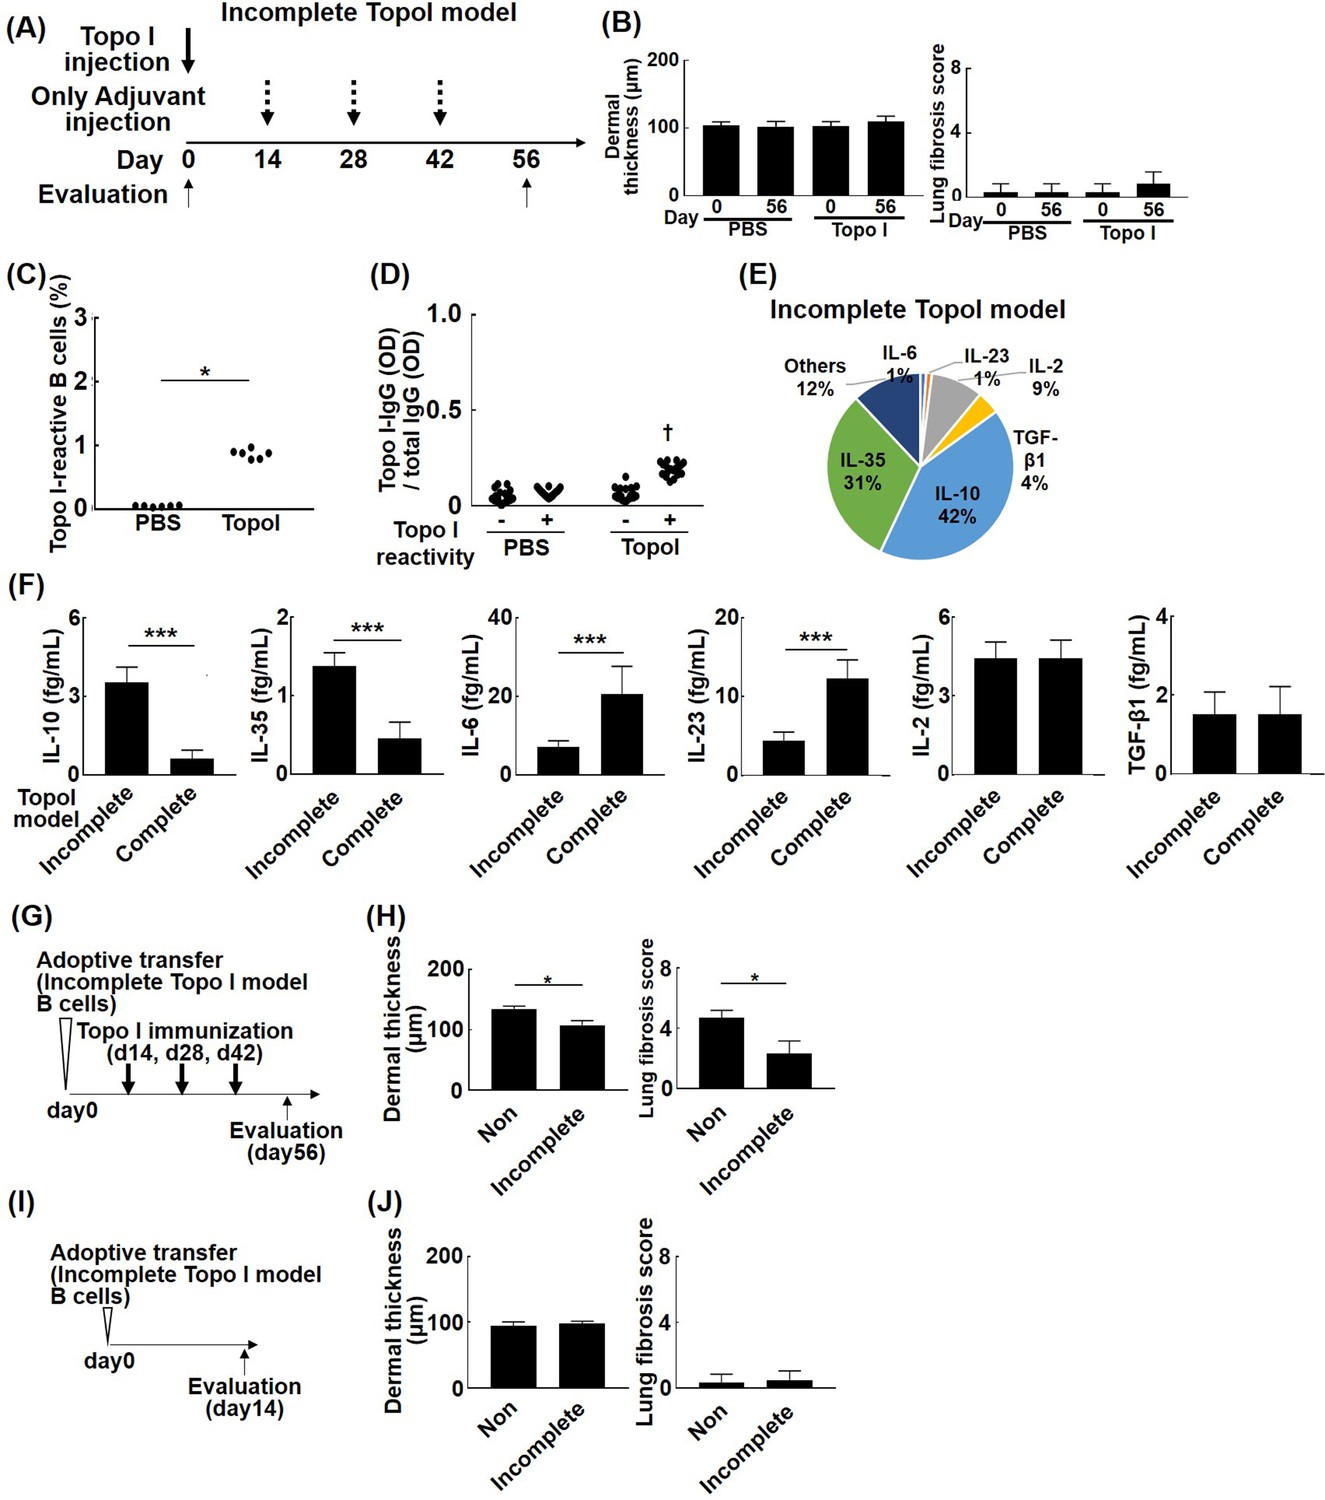
The effect of fibrosis and cytokine production by topo I-reactive B cells in the topo I-induced incomplete systemic sclerosis (SSc) model mice.
Topo I-induced incomplete SSc model (Incomplete model) mice were generated by immunizing topo I for one time, followed by adjuvant immunization up to three times every 2 weeks (A). At days 0 and 56, mice were sacrificed and used for study as non-immunized and fourth immunized mice, respectively. Mice treated with phosphate-buffered saline (PBS) instead of topo I were used as controls. Six mice in each group were used. (B) Dermal thickness and lung fibrosis score, which reflect the extent of skin and lung fibrosis, respectively, were examined histologically using skin (original magnification, ×40) and lung tissues (×100). (C) Topo I-reactive B cells in splenic B cells from these mice were identified with flow cytometric analysis. Frequencies of topo I-reactive B cells in total B cells (C) and the IgG anti-topo I antibody titer in each of the topo I-reactive B cells (Topo I reactivity+) and topo I-non-reactive B cells (Topo I reactivity-) are shown (D). Each of the 100 topo I-reactive B cells isolated from mice immunized once and four times with topo I was analyzed. Frequencies of B cells producing cytokines and the amount of produced cytokines are shown (E, F). Topo I-reactive B cells (104 cells) from incomplete model mice with topo I were adoptively transferred into wild-type (WT) mice, and 14 days later, these WT mice were immunized with topo I three times every 2 weeks (G). 56 days after the adoptive transfer, the skin and lung tissues were obtained, and the dermal thickness and lung fibrosis score were examined histologically (H). Similarly, after 14 days of the adoptive transfer of topo I-reactive B cells (104 cells) from incomplete model mice with topo I into non-immunized WT mice (I), the dermal thickness and lung fibrosis score were measured (J). The bar graphs show the mean + SD. *p<0.05, **p<0.01, ***p<0.005. †p<0.001 vs. each control.
-
Figure 6—figure supplement 1—source data 1
Source file for the effect of fibrosis and cytokine production by topo I-reactive B cells in the topo I-induced incomplete systemic sclerosis (SSc) model mice.
This archive contains all data used for the quantitative analysis shown in Figure 6—figure supplement 1.
- https://cdn.elifesciences.org/articles/67209/elife-67209-fig6-figsupp1-data1-v1.xlsx
Figure 6—figure supplement 2
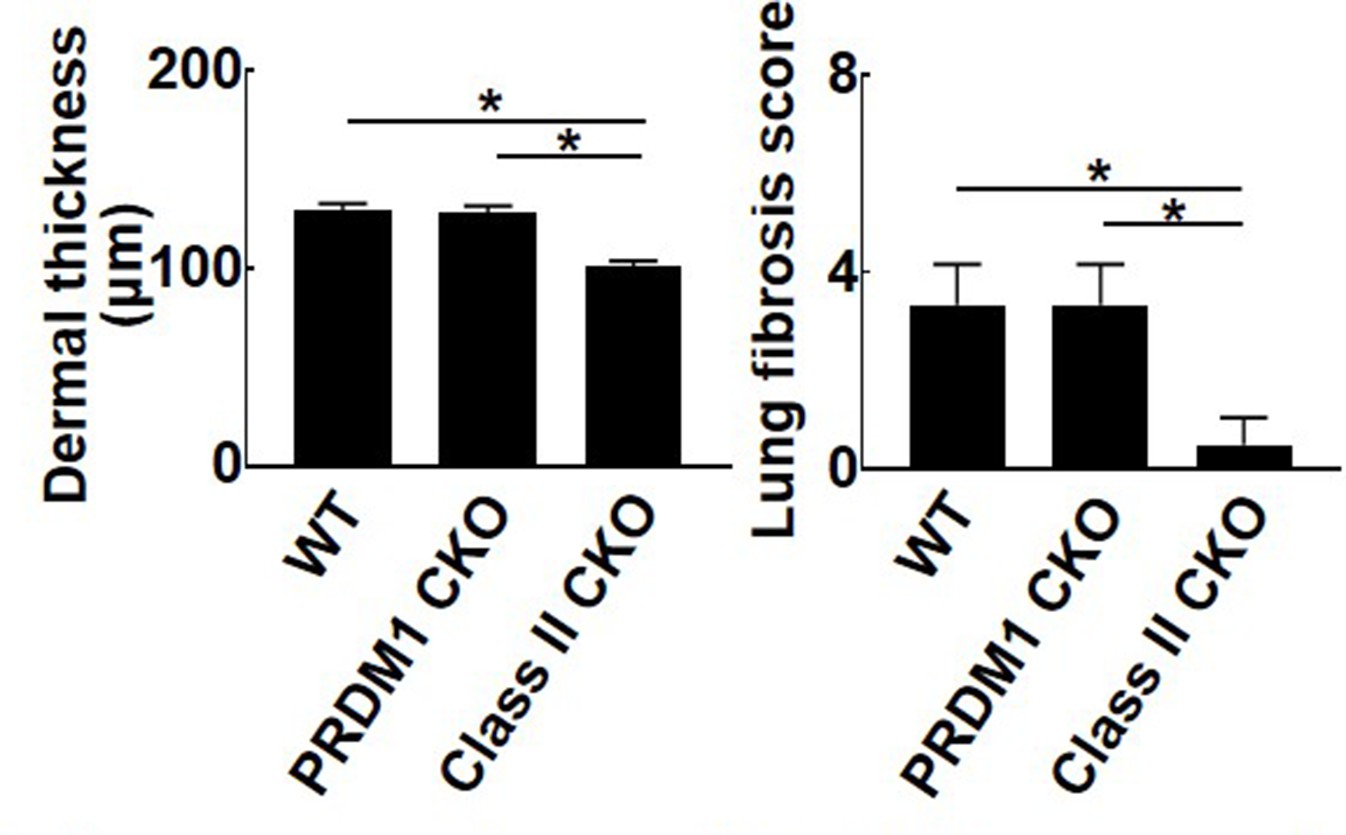
Effect of B cell-specific Blimp1 or class II in topo I-reactive B cells on the development of fibrosis in the topo I-induced systemic sclerosis (SSc) model mice.
Wild-type (WT) mice, B cell-specific Blimp1 CKO mice (PRDM1 CKO), and B cell-specific class II CKO mice (Class II CKO) were immunized four times with topo I. Then, 104 cells of topo I-reactive B cells obtained were transferred to non-immunized WT mice, and the dermal thickness and lung fibrosis score were measured 14 days later. These results represented six experiments. The bar graphs show the mean + SD. *p<0.05.
-
Figure 6—figure supplement 2—source data 1
Source file for the effect of B cell-specific Blimp1 or class II in topo I-reactive B cells on the development of fibrosis in the topo I-induced systemic sclerosis (SSc) model mice.
This archive contains all data used for the quantitative analysis shown in Figure 6—figure supplement 2.
- https://cdn.elifesciences.org/articles/67209/elife-67209-fig6-figsupp2-data1-v1.xlsx
Figure 7 with 1 supplement
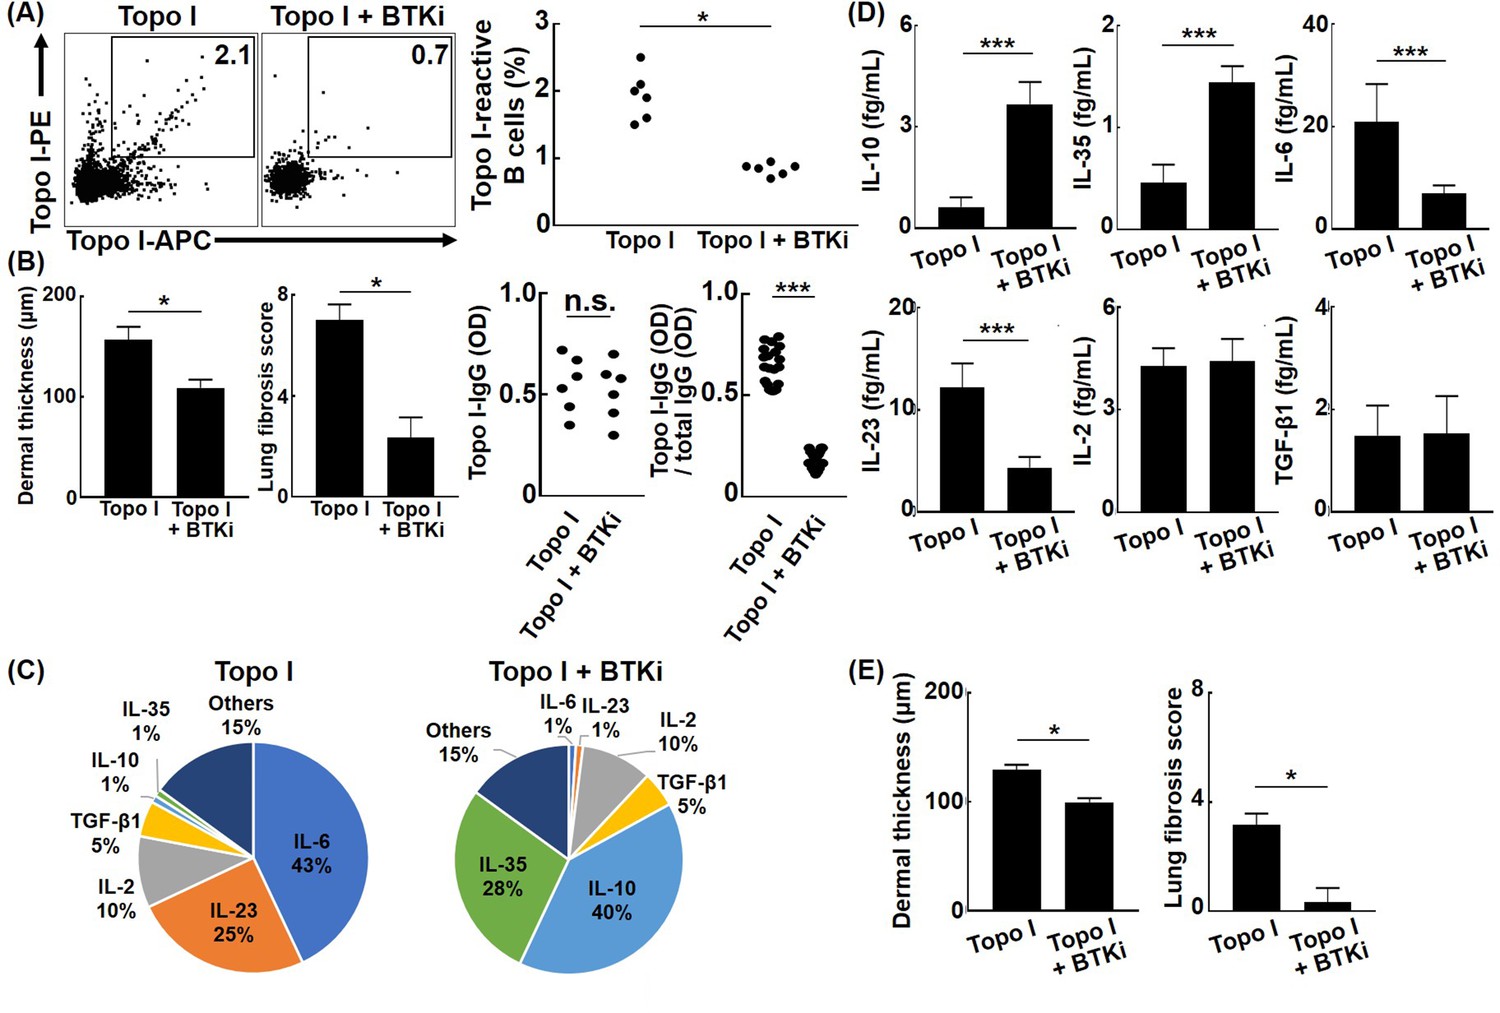
Effect of Bruton’s tyrosine kinase (BTK) inhibition on the affinity for topo I of topo I-reactive B cells and the development of fibrosis in the topo I-induced systemic sclerosis (SSc) model mice.
(A) Frequencies of topo I-reactive B cells in splenic B cells from mice immunized four times with topo I and from mice treated with a BTK inhibitor along with topo I were examined. Ibrutinib (12.5 mg/kg/day, administrated orally) was used as the BTK inhibitor. (B) We measured the dermal thickness, lung fibrosis score, titer of serum IgG anti-topo I antibodies, and titer of IgG anti-topo I antibodies produced by individual topo I-reactive B cells in these mice (n = 6). Frequencies of cytokine-producing topo I-reactive B cells (C, total 200 cells) and the amount of produced cytokine (D, 100 cells each) are shown in the pie charts. (E) Topo I-reactive B cells (104 cells) obtained from these mice (n = 6) were adoptively transferred to wild-type mice, and the dermal thickness and lung fibrosis score were measured after 14 days. Topo I, topo I-induced SSc model mice; Topo I + BTKi; BTK inhibitor-treated topo I-induced SSc model mice. The bar graphs show the mean + SD. *p<0.05, ***p<0.005.
-
Figure 7—source data 1
Source file for the effect of Bruton’s tyrosine kinase (BTK) inhibition on the affinity for topo I of topo I-reactive B cells and the development of fibrosis in the topo I-induced systemic sclerosis (SSc) model mice.
This archive contains all data used for the quantitative analysis shown in Figure 7.
- https://cdn.elifesciences.org/articles/67209/elife-67209-fig7-data1-v1.xlsx
Figure 7—figure supplement 1
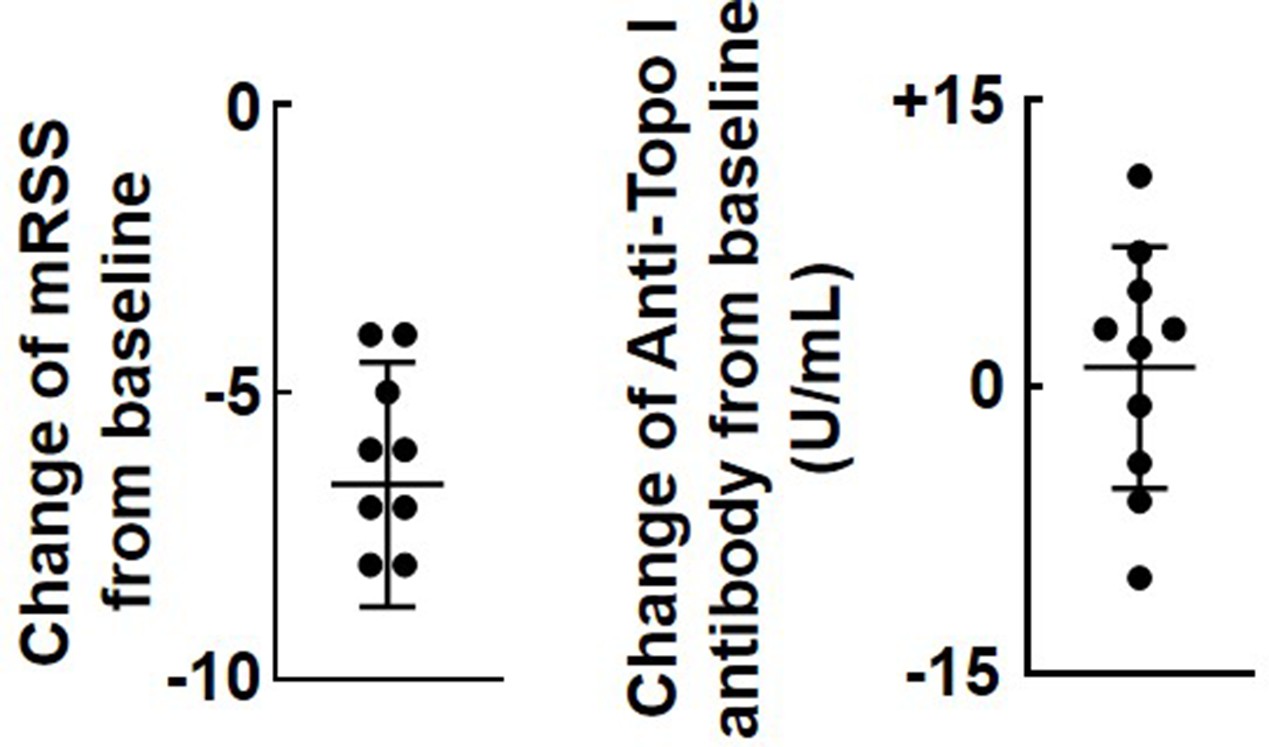
Change of modified Rodnan skin score (mRSS) and anti-topo I antibody from baseline after rituximab (RTX) treatment.
For the 10 patients who received RTX treatment, data at 1 year after RTX showed that mRSS improved by an average of about six points, while titer remained the same.
-
Figure 7—figure supplement 1—source data 1
Source file for change of modified Rodnan skin score (mRSS) and anti-topo I antibody from baseline after rituximab treatment.
This archive contains all data used for the quantitative analysis shown in Figure 7—figure supplement 1.
- https://cdn.elifesciences.org/articles/67209/elife-67209-fig7-figsupp1-data1-v1.xlsx
Tables
Table 1
Clinical correlation of the affinity for topo I of topo I-reactive B cells in anti-topo I antibody-positive SSc patients.
| Characteristics | High-affinity B cell-dominant group* | Low-affinity B cell-dominant group* | p-Value |
|---|---|---|---|
| Sex, number of males/females | 4/54 | 5/48 | N.S. |
| Age at onset, mean ± SD (age) | 52 ± 9 | 49 ± 7 | N.S. |
| Disease duration, mean ± SD (years) | 5 ± 2 | 2 ± 1 | <0.001 |
| Number with dcSSc/lcSSc | 50/8 | 47/6 | N.S. |
| Clinical features | |||
| mRTSS, mean ± SD | 23 ± 5 | 16 ± 4 | <0.001 |
| Pitting scars or ulcers (%) | 62 | 13 | <0.01 |
| Lung involvement | |||
| Interstitial lung disease (%) | 78 | 68 | N.S. |
| %FVC, mean ± SD (%) | 70 ± 9 | 91 ± 11 | <0.001 |
| %DLco, mean ± SD (%) | 57 ± 11 | 83 ± 10 | <0.001 |
| Laboratory findings | |||
| Serum IgG levels, mean ± SD (mg/dl) | 1512 ± 371 | 1398 ± 353 | N.S. |
| Serum IgM levels, mean ± SD (mg/dl) | 159 ± 16 | 179 ± 22 | N.S. |
| CRP levels, mean ± SD (mg/dl) | 0.28 ± 0.19 | 0.21 ± 0.14 | N.S. |
| Anti-topo I antibody levels, mean ± SD (U/ml) | 144 ± 32 | 147 ± 43 | N.S. |
-
Unless noted otherwise, values are the number of observations.
-
*The high-affinity B cell-dominant group had a higher frequency (>50%) of B cells with high affinity for topo I among CD27+ B cells, while the low-affinity B cell-dominant group had a higher frequency (>50%) of B cells with low affinity for topo I.
-
dcSSc, diffuse cutaneous systemic sclerosis; lcSSc, limited cutaneous systemic sclerosis; CRP, C-reactive protein; N.S., not significant; mRTSS, modified Rodnan total skin thickness score; %FVC, percent predicted values of forced vital capacity; %DLco, percent predicted values of diffusion capacity of the lung for carbon monoxide; SSC, systemic sclerosis.
Additional files
Download links
A two-part list of links to download the article, or parts of the article, in various formats.
Downloads (link to download the article as PDF)
Open citations (links to open the citations from this article in various online reference manager services)
Cite this article (links to download the citations from this article in formats compatible with various reference manager tools)
Single-cell-level protein analysis revealing the roles of autoantigen-reactive B lymphocytes in autoimmune disease and the murine model
eLife 10:e67209.
https://doi.org/10.7554/eLife.67209


